US Government interest payments, tax receipts, tariffs, average interest rate on the debt, and Debt-to-GDP ratio in Q1 2026.
By Wolf Richter for WOLF STREET.
The US government fiscal situation and the US Treasury debt are a terrible long-term mess by just about every measure, including the ratio of tax receipts to interest payments, and the Debt-to-GDP ratio. And in May, revenues from tariffs collapsed and turned negative due to refunds being paid out following the Supreme Court ruling in February. But the Q1 mess we’re discussing here does not include the effect of the tariff refunds. That problem will muck things up further in Q2.
And the government’s solution to the mess, supported by the Fed, has been to “let it run hot”: higher nominal economic growth and higher inflation – instead of fiscal responses.
Interest payments by the federal government on its gargantuan Treasury debt dipped by $2 billion in Q1 from the record in Q4, to $305 billion (red in the chart below).
But for the past four quarters combined, interest payments rose by $64 billion (+5.6%) compared to the same period a year earlier, to $1.20 trillion. The $64 billion increase was the result of $2.8 trillion additional debt (which rose to $39.1 trillion by the end of Q1), softened by lower interest rates on short-term Treasury bills due to the Fed’s rate cuts last year.
Interest payments don’t occur in a vacuum; they occur in the context of tax receipts to pay for them.
Tax receipts by the federal government fell by $20 billion in Q1 from Q4 to $939 billion, including a $14 billion decline in tariff revenues (blue in the chart below).
But for the past four quarters combined, tax receipts rose by $494 billion (+15.6%) from the same period a year earlier, helped by an additional $230 billion in tariffs over the four-quarter period, to $3.67 trillion. That surge of tax receipts is the result of “letting it run hot” and of the tariffs. Current-dollar economic growth and higher inflation cause tax receipts to balloon.
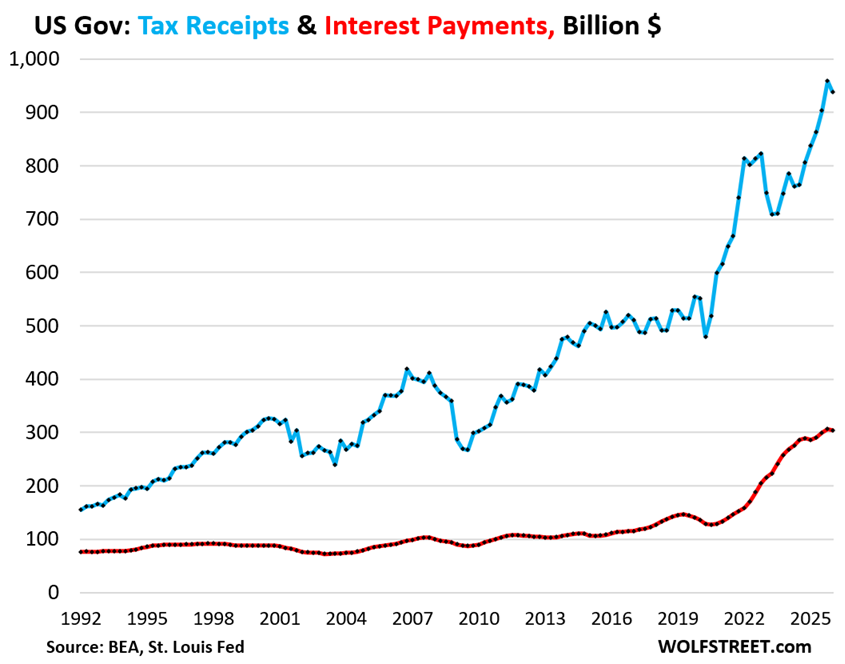
Tariff revenues declined to $76 billion in Q1, from $90 billion in Q4.
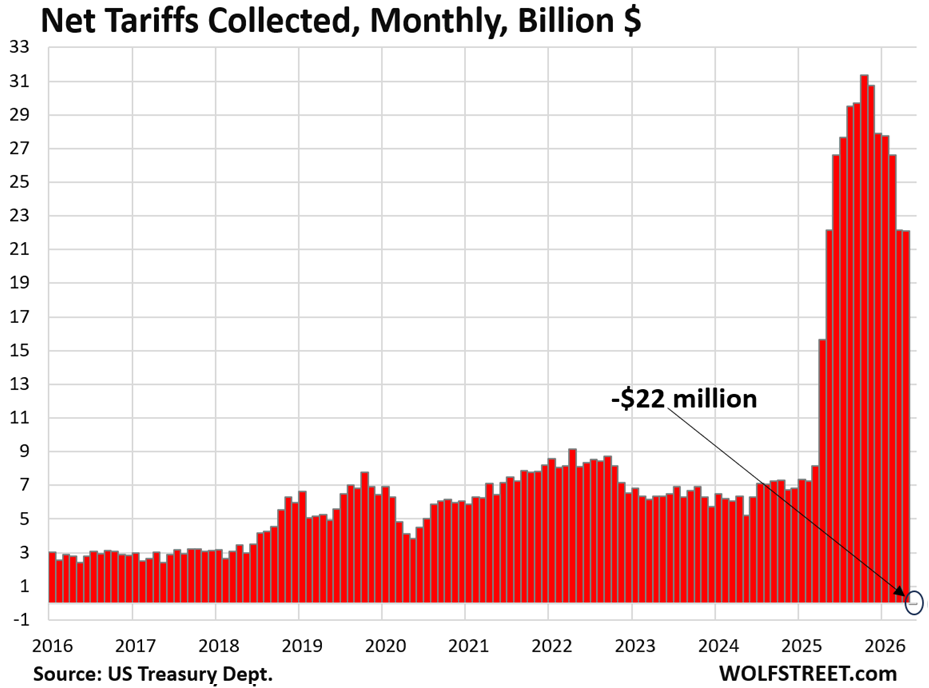
Not included in these Q1 figures is what happened in May: Refunds of tariffs – due to SCOTUS striking down a portion of the tariffs – exceeded revenues from the remaining tariffs, and net revenues from tariffs were slightly negative (-$22 million). This collapse of the tariff revenues in May and dragging into June will muck up the Q2 figures, and is not included in the Q1 tax receipts here.
For the past 12 months through May, tariffs amounted to $302 billion, per the most recent Monthly Treasury Statement.
The ratio of interest payments to tax receipts worsened to 32.5% in Q1, meaning that interest payments ate up 32.5% of the tax receipts available to pay for them. An ugly situation.
But the prior surge of tax receipts through Q4 had improved the ratio substantially from the worst levels in Q3 2024, when the ratio had marked the worst point (37.5%) since 1996, when the government’s finances were climbing out of the fiscal crisis of the 1980s.
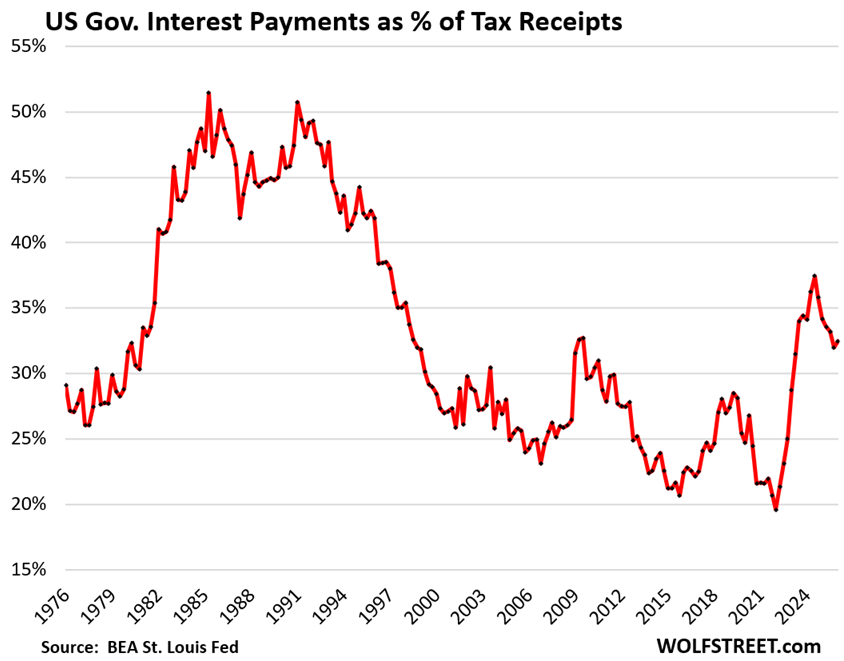
This measure of tax receipts, released by the Bureau of Economic Analysis as part of its second revision of the National Accounts, tracks the receipts that are available to pay for general budget expenditures, such as interest payments, defense spending, government salaries, etc. Excluded are receipts that are not available to pay for general budget expenditures and are not included in the general budget, primarily Social Security and disability contributions that go into Trust Funds, out of which benefits are paid directly to the beneficiaries, and those payments are also not included in the general budget.
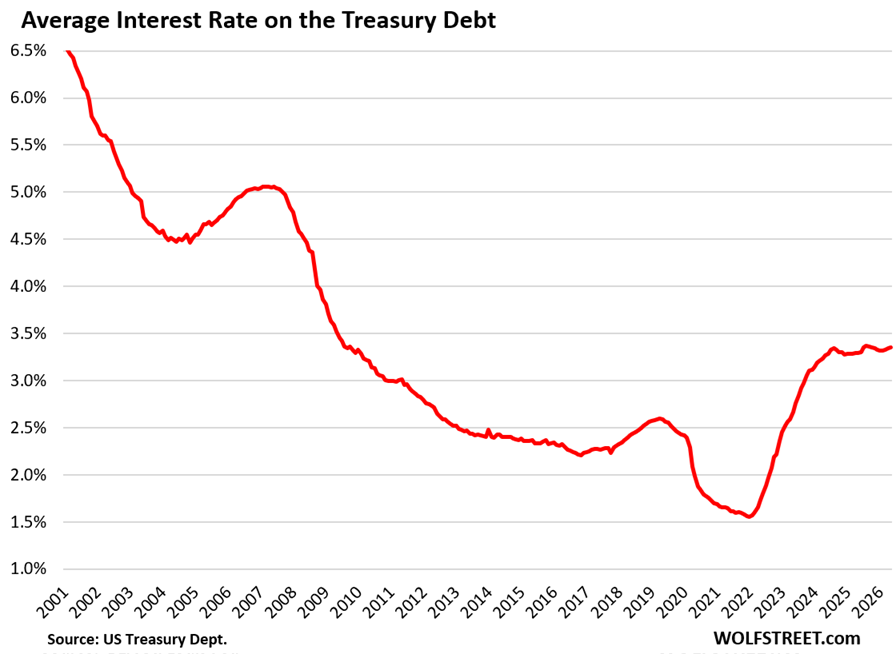
The average interest rate on the Treasury debt has been between 3.30% and 3.36% since mid-2024, after more than doubling from early 2022 when the Fed first hiked its policy rates. In May, it ticked up to 3.35%, according to data from the Treasury Department.
New interest rates enter the interest expense only gradually when old Treasury securities mature and are replaced with new Treasury securities at the new interest rate, and when additional Treasury securities are issued at the new interest rates to fund the deficits.
The $6.67 trillion in Treasury bills outstanding (terms between 1 month and 12 months) mature constantly and get refinanced in huge auctions every week, and therefore transmit changes in short-term interest rates quickly to the average interest rate paid on the debt. Interest rates of Treasury bills are largely a result of the Fed’s current and expected policy rates. But that’s only on $6.67 trillion of $39.3 trillion in total Treasury debt.
The rest of the $39.3 trillion in Treasury debt is slow to react as changes in interest rates on longer-term debt enter the average interest rate only with newly issued securities to replace maturing securities issued years ago or to fund new deficits.
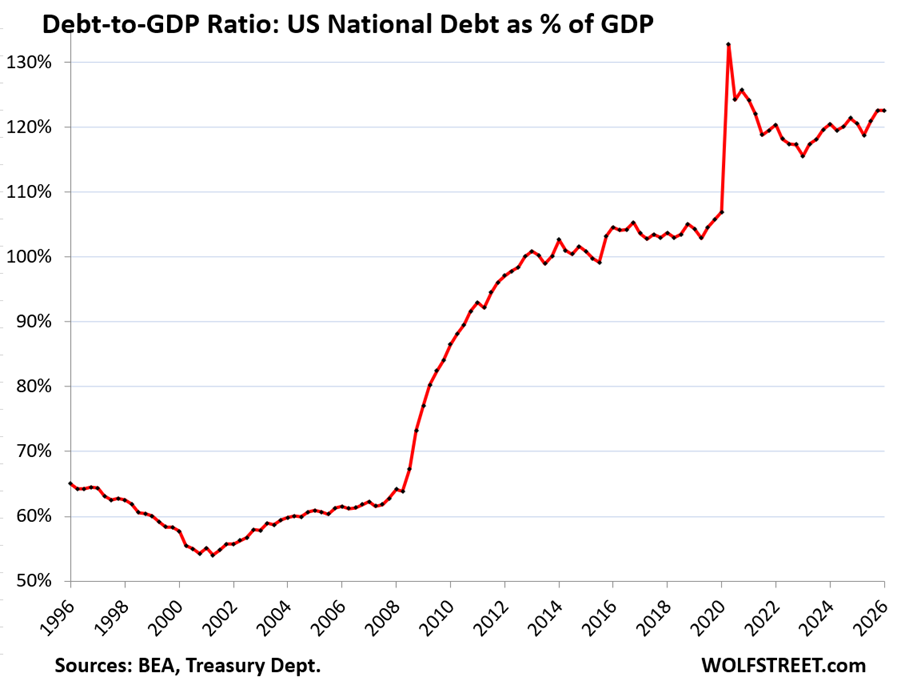
The ugly Debt-to-GDP ratio edged up a hair to 122.6% in Q1. The ratio shows the burden of the debt on the overall economy, similar to the debt-to-income ratios used to evaluate debt burdens of businesses and households.
The debt ceiling in the first half of 2025 had caused the ratio to drop because Congress prevented the government from issuing more debt to fund the expenditures and deficits that Congress had told the government to fund. The government played along with this absurd but time-honed charade for a while by draining its huge checking account (Treasury General Account) and by executing some “extraordinary measures,” such as temporarily not paying into government pensions funds, instead of borrowing more. So the debt remained unchanged in the first half of 2025. As GDP rose during that time, the debt-to-GDP ratio dipped over those two quarters. But then the magic flipped back to reality, and the debt-to-GDP ratio jumped back into line.
Inflation & nominal economic growth to the rescue? It is obvious that the government and the Federal Reserve have had the intention of letting the economy “run hot” as a way of addressing the fiscal mess.
Inflation has been well above the Fed’s official inflation target for over five years. In May, it accelerated to over 4%, double the 2% inflation target, and there are still Fed officials talking about rate cuts, though those are unlikely now.
Even the core inflation rate – which exclude the energy price spike and food – has surged to 3.4% on an annual basis, according to the Fed-favored core PCE price index. The six-month core PCE price index has accelerated to 4.1%, the worst since June 2023. Inflation in core services other than housing was a big driver of that acceleration as inflation spreads into the broader economy. But this is not new: Core inflation has been accelerating since May 2025.
And yet, only 9 of the 19 FOMC members expected a rate hike this year, according to the dot plot of the Fed meeting two weeks ago. Warsh didn’t submit his expectations, while 8 expected no change in policy rates, and 1 expected a rate cut this year, despite this acceleration in core inflation measures. And this was the most hawkish Fed meeting in a while!
Clearly, the Fed is not interested in bringing inflation down to 2.0%. It got seriously nervous when core PCE inflation dropped below 3% in 2024 and started cutting rates. And it’s getting a little nervous when recent trends of core PCE inflation – such as the 6-month rate – go over 4%. It is obvious that the Fed does not want to trigger a recession to push inflation down to 2%. A recession would make the US fiscal mess much worse.
A rapidly growing economy generates more taxable income and substantially higher tax receipts – both from corporate and individual taxpayers. Growing asset prices generate capital-gains taxes.
Those capital gains tax receipts can plunge when asset prices drop, such as in 2022, which caused the drop in tax receipts in the first half of 2023, when it came time to pay capital gains taxes for 2022.
In 2025 there was the surge of tariff revenues. Manufacturing in the US generates large amounts of tax revenues, including from the secondary and tertiary effects of manufacturing, far outrunning any decline in tariff revenues that might come along with producing more in the US.
So that’s the game plan to address the fiscal mess: Higher nominal economic growth (in Q1, nominal GDP grew by 5.8% annual rate, after 4.2% in Q4 and 8.3% in Q3), more manufacturing in the US, and higher inflation in a moderate range, such as between 3-5%. Higher nominal economic growth and higher inflation can be effective in slowly reducing the burden of the debt on the economy.
But this type of inflation is a high price to pay by households for the continual reckless profligacy of the government. Meanwhile, neither Congress nor the White House are making any efforts to address the root cause of over two decades of reckless fiscal policies.
Enjoy reading WOLF STREET and want to support it? You can donate. I appreciate it immensely. Click on the mug to find out how:

![]()
When debt/GDP now stands at 122%, why was there so much news recently reporting that the debt had jumped the red line of 100% of GDP?
They’re talking about the publicly traded portion ($31.6 trillion, also called “marketable Treasury securities) of the total debt ($39.3 trillion). They’re giving you a common and self-serving falsehood about the US debt.
Here is more info on this split, amounts, and charts:
https://wolfstreet.com/2026/03/19/bond-market-gets-edgy-as-us-treasury-debt-hits-39-trillion-spiking-by-2-trillion-in-7-5-months-and-not-slowing-down/
About $7.7 trillion of the US Treasury securities are not publicly traded (“nonmarketable Treasury securities”). Most have been purchased by US government pension funds, the Social Security Trust Fund, etc., and these amounts invested in Treasury securities are owed the beneficiaries of those pension plans, SS beneficiaries, etc. They’re NOT “owned to ourselves,” as some people like to say to lie about the actual size of the debt. They’re a real Treasury debt that is owed others, and that pays interest.
A small part of the $7.7 trillion in non-traded Treasury securities are i-bonds and ee-savings bonds held by households, and other securities. None of these securities can be traded.
Some people only count the publicly traded portion ($31.6 trillion) of Treasury securities, and not the total amount of Treasury securities ($39.3 trillion) that the US government has issued and owes. The $39.3 trillion is the total amount of Treasury securities outstanding; it’s the total amount that the US government owes via Treasury securities. And that amount is 122.6% of nominal GDP. There is no way around it.
Paul Krugman famously (infamously) disagreed with your assessment, Wolf, and deserves to be continually called out for his disingenuousness:
“Families have to pay back their debt. Governments don’t — all they need to do is ensure that debt grows more slowly than their tax base. The debt from World War II was never repaid; it just became increasingly irrelevant as the U.S. economy grew, and with it the income subject to taxation. Second — and this is the point almost nobody seems to get — an over-borrowed family owes money to someone else; U.S. debt is, to a large extent, money we owe to ourselves.”
Paul Krugman, 2008 Nobel Prize recipient, defending the “it’s money we owe ourselves” argument in “Nobody Understands Debt,” New York Times, Opinion Page, January 1, 2012
Krugman is right in this case.
What’s relevant is the level of debt, maturity schedule, debt/income relative to other nations, and most critically the stability of income relative to other nations.
Yes our debt is exploding, but so is the rest of the world and our income is much more stable than those other countries.
Krugman is wrong about the “owe to ourselves” part.
What you’re talking about it what the article discusses and not what Krugman was discussing.
John H: I don’t know who was fundamentally wrong more times, more often and on larger scale. Was it Krugman or Keynes? The damage they both created.
The FED’s path for the next 10 years is already pre-determined even if they claim the opposite. That the US will have to devalue is close to economic necessity, as reducing this level of indebtedness by austerity is politically unfeasible and probably also economically unwise.
The question is whether the political system uses this opportunity of devaluation to balance books, reduce debt, and go for a reset, similar to the events of the 70/80s with a Volker coming in at exactly the right moment when the cycle concludes. Or, if it squanders it all by using any monetary accommodation as encouragement for more squander and looting.
Call me cynic, but I lost hope that there will be a stop to insanity. Swings of the political pendulum between the two parties just mean adjustments to which lobby groups will receive the most handouts financed by future tax revenue. Meanwhile fiscal conservatives like Massie get pushed out of the system because they can’t possibly withstand the onslaught of the vast amounts of lobbying money.
AIPAC might have something to do with Massie getting pushed out….
Re: Call me cynic, but I lost hope that there will be a stop to insanity.
The sooner one realizes we live in a banana republic, the sooner it will all begin making sense. Consequently, the US dollar is just another banana dollar.
“Swings of the political pendulum between the two parties just mean adjustments to which lobby groups will receive the most handouts financed by future tax revenue.”
…and there we have it. Every pig gets a turn at the trough.
Voters love to point the finger at those darned politicians THAT THEY ELECTED. The bottom line is that fiscal conservatism is not very popular or else more leaders would be getting elected on a platform of reducing deficits.
Voters are also accountable for letting all that lobbying money affect their votes. The dumbest thing is when voters who despise the idea of being influenced by big money then vote for the primary candidate who ha raised the most money because they appear to “have the most support”. And then they go right back to criticizing the US form of bribery when they themselves participated in it!
Democracy is not the best way to make quality decisions. It is the best way to make the population be accountable for their own decisions. Over the past 10 years and over the next couple of decades, Americans will be out what accountability means.
The terrifying thing is that the average American is so low on self-accountability that they’ll continue to blame some “other” for their coming poverty. This excuse-making could lead to all kinds of disorder and violence.
We point fingers at non district politicians. Your local politician is usually thought highly of. Thus,
Fenno’s Paradox: This phenomenon in political science is driven by three main factors:
Local Focus: Constituents see their own representative as accessible, responsive, and hard-working, often crediting them with bringing jobs or federal funding to the local district.
Institutional Blame: The broader legislative body is viewed as an abstract entity characterized by gridlock, partisan bickering, and scandal
Incumbency Advantage: Individual lawmakers have high visibility and can build strong personal connections with their electorate, making them appear distinct from “the rest of Congress
If voters thought the system worked, more would turn out to vote.
BY % OF ELIGIBLE VOTERS
Year Total ballots cast
2024 63.9%
2022 46.2%
2020 66.6%
2018 50.0%
2016 60.1%
2014 36.7%
2012 58.6%
2010 41.8%
2008 62.2%
2006 41.3%
2004 60.7%
2002 40.5%
It isn’t great, but there has been a noticeable uptick in recent years.
That is A truth but not the WHOLE truth. One reason that lots of voters don’t vote is they simply don’t care to. For instance, when I was teaching college in the early 2000s most of my students were well aware that they knew precious little about politics and as a result they just didn’t want to vote (rather than casting a potentially “bad” vote).
The data shows that as well… in the Presidential elections of 1960, 1964, and 1968 the voter turnout hovered around 62%… but in the 1972 race (the first one where 18 to 20 year olds could vote) turnout dropped to the mid-50s and stayed there for decades (even though in 1972 the Vietnam War was raging… which that age cohort had enormous interest in).
I think you’re not considering the impacts of AI implementation. Medicare is the demon here, and AI will dramatically reduce Medicare spend.
They could always do a wealth tax to fund debt repayment. It seems like the public appetite for this is growing, with multiple centrist democrats getting primaried out. Polling suggests that 70%+ of the US support a wealth tax. You could also use Picketty’s idea of in-kind payments from billionaires so that when they pay the tax, it doesn’t wreck the stock market.
IMO this is the only way to avoid further cuts to the social safety net or sliding into a debt spiral.
When the Dems take Congress and raise the capital gains taxation, among others….
all will be well.
I doubt the Fed will be able to fix the problem by itself.
At some point the government is going to have to step in and raise taxes, preferable on the Super Rich like the guy with his $500 million dollar yacht.
The Super Rich, at the very least, should be taxed at the same effective rate as someone working at minimum wage.
Private credit is still an unresolved mess. Interesting times. Good time to be hiking around Europe.
What continues to be ignored is that the Federal Reserve has always loved inflation. It permits corporations and banks to pay down debt with cheaper dollars. The gimmick has been going on since Arthur Burns in the 70s inflation rout that always crushes those that cannot pass along price increases or have any power over prices, i.e. the average joe. The only thing that used to protect them were unions which have been crushed.
So what is the solution on government debt? A devaulation, not likely. But how about the defense budget as a starter.
Rates of real interest are manipulated by the Fed thru purchasing Treasury debt. Another financial farce. And how do they buy trillions of debt? Simple, with a pencil.
My cynical side thinks the Iran war was started to boost military spending to also increase GDP which will help make our fiscal mess look just a little better than it actually is.
That assumes they had some sort of plan beyond Friday, which they clearly did not.
Previous plan of offloading equipment to Ukraine and modernizing, all while running it a bit hot seemed to be achieving the same goal with less mess I would say. That admin’s mistake was probably more political with the migrant issues etc..
But I think Iran war had other objectives, if regime change had been achieved that would give the US leverage with another major oil producing region, it would be near impossible for China to use it’s REM leverage against US as they have against Japan. That’s my cynical side thinking.
My cynical side thinks it was meant to generate inflation because covid cash has been running short and they’re going to be in need of a new “crisis” soon for an excuse to vomit up some more.
Probably 1% of the extra billions Americans and non-Americans are paying to US oil and gas companies is being reinvested back into Republican candidates during the midterms. That amounts to hundreds of millions of dollars.
PROBABLY…you are expressing your wishful thinking, nothing fact based. This is the stuff that gets perpetuated as fact and just runs wild. Your opinion only, which you are entitled to, and my opinion is just the opposite.’ I also have no facts to back it up either!!
What effect will the US being “OK” with 3-5% inflation have on the dollar being the world’s reserve currency, and on the holders of dollars in foreign countries?
There will be no big effect as long as other countries/central banks/investors still feel that the USD is the least dirty shirt and/or the powers that be actually use the remaining time to get our fiscal house in order. Unfortunately I tend to agree with Rick (above) about using short term stimulus to paper over our problems instead of solving them.
Also insisting on $1.5 Trillion in defense spending when the US can not even beat a 3rd rate country because of poor foresight does not make one feel that much of that funding will be wisely used. It will just get us to the end of our rope (when interest on the debt equals all tax receipts) faster.
As Hemingway said “it went slowly until it went all at once”.
I do have some hope as it is more “toss the bums out” time than I have ever seen in my 77 years. Even here in bright red Utah the head of the state Senate and others got primaried out simply due to general disgust with tone deaf politicians (no policy issues involved). The post mortem is/was that while the main concern are kitchen table issues the next is a general feeling among the electorate in both parties that current politicians simply do not listen to the voters (one loosing R even said that explicitly). Perhaps the ones who do listen will hear that being on a fiscally unsustainable course is simply not popular. Some people really do want their kids to live in a better world.
May we all find a better future.
not being able to beat a 3rd world country….yes we could if we wanted to obliterate it, which we don’t. We are trying not to have civilian casualties, which may happen anyway.
Swimmer, almost all the holders of dollars in foreign countries are facing inflation higher in their native currency than US$ inflation. That is why many are holding dollars. If US inflation gets above 5%, that might change somewhat.
The dollar is NOT “the world’s reserve currency” — it is only one among many reserve currencies. In terms of share, it’s number 1 with a share of 56.8%. The euro is #2 with a share of 20%. And there are many others. Details here:
https://wolfstreet.com/2026/03/28/status-of-us-dollar-as-global-reserve-currency-usd-share-drops-to-31-year-low-as-central-banks-diversify-into-other-currencies-gold/
One has to wonder how much of that tariff (tax) revenue will have to be returned…
Looks like our elite owners are really push the whole dollar –> tether –> stable coin –> treasuries, circle jerk. Going to be great when the taxpayer has to bailout all these crypto (i.e. bitcoin) ETFs.
Interesting times.
I remember, back in the day, there used to be recessions. And during recessions there would be deflation, which would give some relief from the constant inflation that crushes the consumers spending power. I guess that the decreased tax revenue during those periods makes it so the numbers don’t work, so they put and end to recessions.
I asked AI what the historical average success rate is for inflating away the debt. It gave 10-15%. The better solution was raising taxes, but revolutions happen with that one. It’s going to be tricky.
Do Americans want to pay higher taxes with resulting lower Nominal GDP or pay higher prices resulting in higher nominal growth to get the National debt under control? With prices rising 3% to 5% a year I get to choose how much or how little I want to spend and I also can choose to find lower cost alternatives or deficit spend and maybe walk away from it.
dOn’T rAiSe MaH tAxEs!
Seriously, the winning move is probably to convert our USDs to Australian or New Zealand dollars while it’s still worth something, and watch the place burn from afar.
What exactly do you think the Australian and Zealand economies are based on? They make money by selling commodities to China that are used to make consumer products to Americans. If the US starts to decline, these countries are the first hurt, not the last.
Try Swiss treasuries – the stated yields are low but your wealth will be preserved
https://fred.stlouisfed.org/series/DEXSZUS
The SNB prints more money proportionately than any other central bank. It can because it has created a racket where everyone wants to buy CHFs, a tiny currency, and the SNB prints them and sell them to forex traders, and with the proceeds (USD, EUR, YEN, etc.) buys USD-denominated stocks, euro-denominated assets, etc.
It’s a racket, not fiscal prudence, that you’re buying into.
It’s all rackets Wolf, you know that better than anybody. Just find 3-5 rackets you can live with for proper diversification.
Besides – the Swiss basically invented (or perfected) chocolate, time, Valium, and LSD. That’s a racket I can get behind.
“Clearly, the Fed is not interested in bringing inflation down to 2.0%”
Like we didn’t see this coming. I never even took economics and I could see this a mile away. I remember thinking a long time ago when I learned about all the debt China was buying up that they would just lose a lot of it to inflation eventually.
Imagine how pissed they must be at us. We sold them a lemon of a currency.
As pissed as the Japanese after the Plaza Accord(s). Note that very quickly attention rotates to dealing with domestic upset.
Thanks Wolf
Wolf, this analysis is spot on, one of your very best. The American electorate and its representatives in government do not have the stomach to (1) reduce government spending and/or (2) raise taxes. Therefore, the national debt will continue to grow precipitously. There is only one “solution,” and that is to continue borrowing and let inflation run hot. The 2% inflation target is an absolute fantasy. The U.S. Dollar may not collapse, but it certainly will lose a significant amount of purchasing power. Bottom line: don’t trust your Dollar savings to support your goals in life. Doesn’t matter whether you are young or old. My approach: I have been dollar-cost averaging out of Treasury securities (T-bills and T-bonds) and into super highly diversified stock funds like Vanguard’s VT (Total World Stock). This reflects my confidence that the worldwide business community will deal with inflation and deliver real purchasing power growth over the long haul. This despite the current nosebleed stock valuations. You have to take a position. I am saying no to the Dollar and yes to companies whose employees work hard every day to deliver value to their customers. We’ll see what happens.
Don’t want to alarm you but VT is 62% US based, and 33.4% Tech. It’s not what I would call super highly diversified.
If what you are saying is that the market for equities is risky and overvalued in general and/or that it has allocated too much value to one region (the U.S.) or to one industry (tech), then you may be right. But I’m not a stock picker. I’m not trying to beat the market. Instead, I’m trying to match the market. My goal is to eliminate diversifiable risk that is associated with a single company, a single region, a single industry, etc. You do that by investing in a worldwide market-weighted basket. Is VT (or any other fund) perfectly weighted across all assets on the planet? No, but it’s the closest thing out there available to the general public.
Just a note, VT is about 63% US-based stocks:
https://stockanalysis.com/etf/vt/holdings/
I suggest country specific ETFs for handpicked nations with relatively low debt/GDP ratios, such as EWA, EWJ, EPOL, EWY, EWM, ENZL, and EWG. I can’t recommend China, or any of the “world” or “ex-US” ETFs with heavy China exposure, because equity ownership in China means something different than it means in other countries with stock markets.
lol at the idea that most of the public companies are “delivering value to their customers.” Especially big tech.
I disagree. During my career I worked very hard at five different companies, three of them publicly traded, one of them privately owned, and one that I started up and ran myself with a couple of business partners. In all cases my colleagues and I cared a lot about whether we were meeting our customers’ needs enough to have them choose us over our competition. So yes, I do believe that small, medium and large companies strive to deliver value to their customers. Yes, there are companies who treat their customers poorly and don’t deliver value, but they don’t get away with it forever.
Totally agree with Doubting.
I think most company employees try to do their best.
I think most people want to do a good job at their work.
However, they do not steer the ship. And, entitled monopolies lacking real fiscal competition or oversight is pretty much criminal.
While I agree feel tis the small companies especially ones with a lot of face to face folks that care more about customer satisfaction.
That used to be true but nowadays there is no longer enough “competition” in many sectors of the economy.
True. They don’t get away with it forever and Boeing is a good example of just losing it.
James beat me to the punch. I don’t doubt that a lot of employees try to do a good job, and that a lot of small and medium businesses value their customers and try to have a mutually beneficial relationship.
I was referring to the oligopolic companies like Microsoft and Google. They operate in their own best interests, not those of their customers. They can raise prices whenever they want and get very little to no pushback, as customers don’t have meaningful choices.
Their business model is more one of rent-seeking.
No problem with the interest on govt. debt. The central bank can just print the money to pay it off.
Wolf – when a family or a company /business is overwhelmed beyond reasonable hope, they declare bankruptcy, get a clean slate and start all over again. Things go back to business-as-usual, for the most part. As a birthday present for America’s 250th, isn’t it time we declare national bankruptcy once and for all?? 🇺🇸
Clean slate. Goodbye debt. New beginning.
p.s.: this national debt situation is so old and such an anchor around our country’s neck. ⚓️
you have a naive view of business bankruptcy. In most business bankruptcy proceedings, the owners lose most or all of the business, and creditors either get the entire business (debt restructuring) or get the proceeds from asset sales (liquidation). Bankruptcies where owners retain the business exist (such as PG&E), but the much more common outcome is that owners lose everything and get booted out — though the business itself might continue as before but under different ownership.
Running the economy hot to increase inflation will hurt consumers and businesses alike unless pay increases with inflation. Furthermore, new government budgets increase with inflation increasing the odds of bigger deficits even with higher tax receipts. Digging out of debt only has one solution: increase taxes and reduce spending.
Stock up on edibles and you can’t go wrong with these circumstances.
Been prepping goods/skills/clan for decades.
I don’t understand how all of this does not weaken the Dollar. It is like the more Dollars the US prints, the more worth they get.
Dollar is losing its purchasing power and hence weakening for us citizens
Over last few decades it has lost more than 75 percent
Over last 6 years it has lost almost 50 percent of purchasing power
But dollar is doing better against other currencies
Because other current are doing worse than dollar and are losing purchasing power faster than dollar
Wolf what do you think about the opinion of Michael Pettis that US fiscal deficit is indirectly driven by the trade deficit? I.e the federal government has to borrow and spend to compensate for the domestic demand destruction caused by the trade deficit (if government doesn’t borrow and spend we will have unemployment spike), and hence to resolve the fiscal issues we need to solve trade deficit first.
This is completely backwards. It’s the equivalent of saying I eat too much because I’m morbidly obese and the solution is to stop being morbidly obese so I am able to stop eating.
While there is no direct cause and effect between our twin deficits, it’s clear that a government that spends for more than it taxes via debt (fiscal deficit) induces a country to consume more than it produces (trade deficit) – not the other way.
The absurd self-serving hot take (trade deficits cause fiscal deficits) is just magical thinking in service of absolving the current regime from making a politically difficult reforms.
I think Pettis would respond to this by saying that US trade deficit is clearly driven by other countries’ trade proficiency (China devaluing their currency, etc), since global trade must balance. So even if US gov stopped overspending we’d still have trade deficit. Hence the causality is: trade deficit causes fiscal deficit.
I wasn’t asked, but the recycling of the trade deficit into treasuries is not a 1:1 relationship – not even close. In ’25 the trade deficit was $901.5B and the fiscal deficit was $1.8T. So even if the entire trade deficit was reinvested into treasuries and absolutely none of it was put into stocks, bonds, bank accounts, real estate, or assets outside the US, that would only cover half the fiscal deficit.
The question is not whether the trade deficit forces the US’s foreign trading partners to buy treasuries (they can buy anything); it’s whether the US could have dug itself into this deep of a debt hole without them – i.e. with a trade surplus? Basically the world offered US voters of the 1980s-2020s a way to receive both tax cuts AND low goods inflation in exchange for printing dollars. It was irresistible.
During that time, billions of people were lifted out of starvation-level poverty worldwide, as formerly dirt-poor China, India, and Middle Eastern countries developed, as communism collapsed in Eastern Europe, and as formerly subsistence economies in Africa and South America found worldwide markets. So regardless of what happens to the US, it was probably a good thing for humanity.
But had they not been around to sell us things in exchange for the currency we print, we’d have simply seen higher interest rates. If the recent multiplication of the amount of interest paid by the US government hasn’t changed our behavior, and if the fact that a third of our government budget goes to paying interest on the debt hasn’t changed our behavior, then we would have gone the exact same route and gotten to the end point faster.
Thanks. I agree that the congressmen probably don’t think about trade deficit when voting in the budget. I’m just not sure that if they suddenly started behaving fiscally responsibly we wouldn’t end up with a recession caused by the overall demand shortfall in the economy.
Warsh said they are all committed to reaching the 2% target.
No worries. /S
“ So that’s the game plan to address the fiscal mess.”
Hopefully before the debt hits the projected mark of 56 trillion in 2036.
$56,000,000,000,000
Debt would be 100 trillion in next decade or so and wed have been having the same discussion
Usa can print ad infinitum
So if we never have a recession or high inflation again, and if the population stays roughly the same, and if entitlement spending stays the same, and if nothing randomly disruptive ever happens again, then we should see a stable debt-to-gdp ratio over 100 percent forever. Sounds like a plan! I mean fiscal responsibility and tough reforms are literally contradictory to the laws of reality, so I think this is the best bet for future prosperity.
Maybe if we give billionaires like Musk, Bezos, Zuckerberg, Ellison, Black, Trump, etc. more ways of avoiding paying any taxes, the economy will grow fast enough to outpace the ever rising debt.
Yes that was sarcasm.
In my opinion those will never repay the debt, but they will be very useful to lower the US income inequalities.
A more equal society is a happier and safer society and this was assessed many, many centuries ago.
Here, it’s still not a thing and it’s often confused with socialism.
There is no such thing as ‘taxing the rich’. That’s just marketing. And obviously from a historical and psychological standpoint better than its corollary which is ‘we need more government spending and a bigger government role in directing the economy’.
Countries, including Japan, Italy and Germany simultaneously run sizable trade surplus’s while maintaining high debt-to-GDP ratios.
All FX currencies including the dollar have lost purchasing power by design as a result of the nearly universal 2% central bank inflation targets. But to this point, the dollar’s strength against others currencies remains resilient. Look no further than the buck-forty CAD for context.
“Countries, including Japan, Italy and Germany simultaneously run sizable trade surplus’s while maintaining high debt-to-GDP ratios”
you need to do a little comparison shopping about the “maintaining high debt-to-GDP ratios” part: Japan’s is the highest in the world, Germany’s is low. Italy is in the middle (even worse than the US).
Debt to GDP ratios:
Japan: 250
Italy: 137
Germany: 63
A couple thoughts.
I am reading a lot of comments complaining about, or explaining and that is fine. I wish there were more comments on solutions.
A proposed solution regarding fiscal deficit and mismanagement and both political parties inability to solve today. Let’s discontinue the bashing of Dems or Reps; fiscally they are a Uniparty. Let’s consider as a society pushing for Buffet’s solution which is pass a law that any time their is a fiscal deficit of 3% or more, all sitting elected officials are barred from running and holding office again. May help.
Regarding when the fiscal annual deficit implodes, or alternatively when the national debt implodes….the two alternative solutions being 1. Continue to kick can, continue to increase debt, continue to print money, continue to create inflation and pray the bond vigilantes refuse to fund the federal government….this is likely choice of today Congress , FED and monied interests controlling Congress. At least this choice spreads out the disaster via inflation on every consumer….but asset owners continue to win. Alternative 2 is the big reset, the default, the haircut. Read about this. Remember all debt today is digital and digitally tracked. Federal government declares default and only paying 40 cents on the dollar. That creates insolvency in most every bank, insurance company, financial institution, brokerage, Wall Street firm automatically….unless at same time law is passed that every intermediary can also default with no legal contractual responsibility to the same 40%. Now all debt owners, called creditors have a 40% haircut. Stroke of a pen…click of a key. This is why many thoughtful advisors recommend hard assets like land, homes, buildings, commodities instead of owning debt. This resolution is quite discriminatory as to whom bears the burden of the default (as opposed to devaluation of the debt via inflation).
What I find interesting, is as assets continue to be concentrated in fewer people, the burden of the default falls on that same smaller set of the population and the likelihood the masses will support such a default.
So, there is one solution….and then some other thoughts
Cbanker,
Great comment/observation you just made. I think that solutions are impossible until such time divisions are not exploited by people always seeking gain. For example…. taxes and spending (debt). On the surface such an easy solution until the finger pointing begins. Like a person going broke, they either spend too much or don’t earn enough. My brother in law was in that position and that is what his Dad told him (I was there). Later, after he lost his house, he said that he knew he was in trouble when he was nailing down the sub floor but he just kept going. He then proceeded to outfit it with everything high end and someone else ended up with a beautiful home and BIL rented for the rest of his life. When 911 hit the Country rallied and pulled together until the big war mistakes were made. But for a while everyone was on the same page because everyone was equally threatened. Now, there are winners and losers big time. It is the perceived unfairness that dooms solutions.
I pay a lot of taxes in my country. I don’t mind paying my taxes because I don’t feel I’m getting ripped off and someone else gains. About 15 years ago I had to get some cancer surgery. In the bed next to me in the surgery unit was my old doctor, now retired. He had to have a shoulder rebuilt after he crashed his plane. Same quality of care, same hospital, no cost to either of us. Covered by taxes. In fact, no premiums for the coverage. My surgery was urgent and done within a week of diagnosis, his required a wait time for space, but neither had advantage over the other. The triage was done by need and not by advantage.
Private money has to come out of elections. There has to be a way to recall leadership like was just done in Britain. When a minority govt situation arises pols must compromise and ‘work across the aisle to get things done, or face extermination next election cycle. 3 or 4 political parties would help get this done but that would require some serious political reform. I don’t think there is a will or way to get that done. In fact, I just read congressional pols were sent home for early recess because they could not compromise. Easier to just shut it down an go home. If they had their pay and benefits docked for not being at work would this have happened? I don’t think so.
We’ll see. I don’t think quietly running inflation at 3-5% and increasing manufacturing (presumably through tariffs) will be enough.
I think the only way we get out of this mess is a combination of real tax collection increases, massive military spending cuts, and a combo of social security delays and a socialized healthcare system like all the rest of industrialized world, which will be very bad news for domestic doctors and pharma and very, very long wait times for the consumers.
As inflation continues to rage and standards of living continue to decline, it’s a wonder why even more citizens aren’t leaving. Life can be so much better outside the U.S.
Thinking we can inflate the debt away or at least to a manageable level is wishful thinking at best and probably better described as a gimmick that just postpones the inevitable consequences of living beyond our means. A few thoughts to support my thinking:
Many government expenditures are inflation protected, the outlays go up with inflation.
Inflation erodes the dollar’s purchasing power and bond buyers eventually want compensation to cover the erosion. If the fed steps in buying debt it is done with printed money exacerbating inflation.
While wages go up, they do not generally rise as fast as inflation. Laborers’ contribution rate to tax revenue does not keep with increased government expense rate. The laborer does not contribute as much to consumption on a net basis as his wealth earned is less which contributes to economic contraction.
The cleanest way to fix our debt mess is for congress to spend less than revenue. We have as a country have done this twice; once following WW1 and the Spanish Flu pandemic that led to the roaring twenties and again after WW2 that led to lower deficits and allowed for the Eisenhower interstate system to be built, a huge benefit to our country’s economy and its growth.
You need to read the article. You don’t seem to understand what it says: It’s the REVENUES (tax receipts) that jump with big nominal economic growth, inflation, and capital gains. Much higher revenues make the interest expense easier to pay and reduce the relative burden of the outstanding debt.
I read the article and agree that revenues increase with inflation, but I did not see much information countering increases in revenues also caused by inflation. Without actual study of the numbers, it is just arm waving to say that revenues will increase faster than outlays. The study seems like a worthwhile endeavor for one of the budget offices.
Another point for thought is health care seems to outpace inflation, and we have a demographic issue with a shrinking labor force particularly with the southern border under better control and growing population collecting their health services from government insurance programs like Medicaid and Medicare.
Another point is we have had generally increasing inflation for quite a while and concurrent increasing debts and deficits even with very low interest rates. Would not thinking more inflation would be doing more of the same and expecting different results? I have put forth many points explaining why I am skeptical of saying we can inflate our way out of this mess, especially looking at the revenue side of the problem without a serious look at how the expenditure side is affected.
“…. that revenues will increase faster than outlays.”
NO ONE said that. re-read my comment.
What I said in the article is that revenues increase with nominal economic growth, inflation, and capital gains. You can see it on the first chart, blue line.