The 6-Month “core services” PCE price index jumped 4.2% annualized, pushed the 6-month core PCE to 4.1%, worst since June 2023.
By Wolf Richter for WOLF STREET.
The price of gasoline was still a big driver of inflation in May, though in recent weeks, gasoline prices have dropped as crude oil prices have plunged, and gasoline will slowly fade as a source of inflation. But inflation in core services, which account for over 60% of where consumers spend their money, is reheating. And this time, it’s not driven by housing services, but by other services. Core services are the biggie, and that’s were inflation beyond energy has been reheating. The Fed has some reason to “look through” the energy price spike, but it cannot “look through” the surge of inflation in core services.
The “core services” PCE price index jumped by 0.46% in May from April (+5.6% annualized, blue in the chart below). The six-month core services PCE price index jumped by 4.2% annualized, the worst since June 2024 (red).
Core services dominate consumer spending, and that’s where inflation has been accelerating for a year, after coming down from the surge in 2021 through early 2023. Core services are where inflation is tough to battle. A lot of these core services lack adequate competition that consumers can leverage, and once companies that sell these services are confident they have pricing power, they raise their prices, and consumers wail and gnash their teeth and pay them.
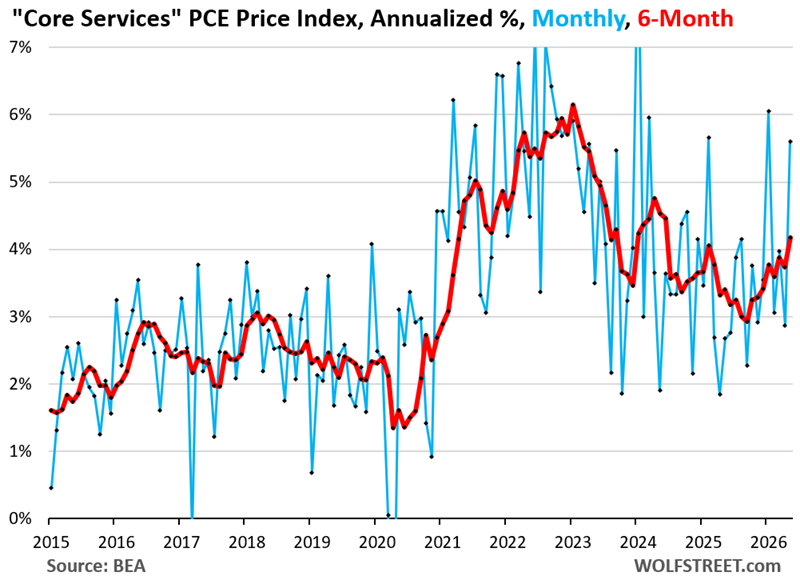
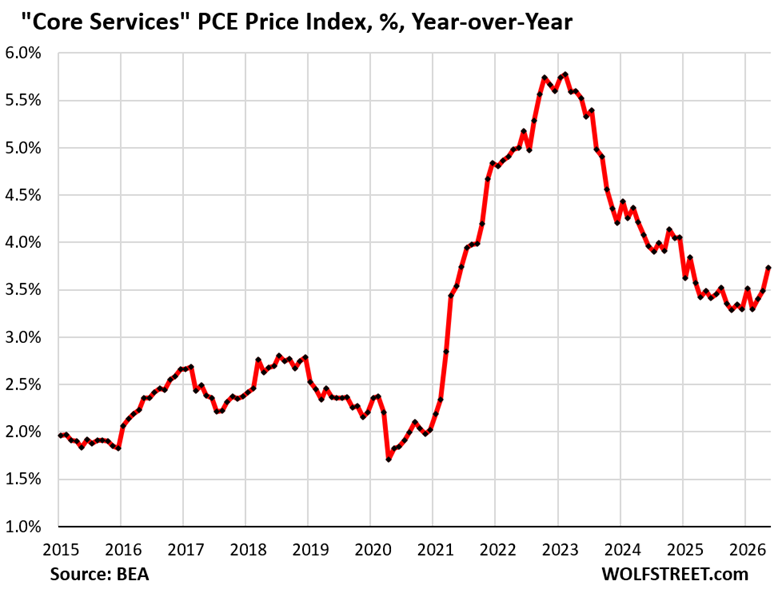
Year-over-year, inflation in core services rose by 3.7%, the worst increase since February 2025.
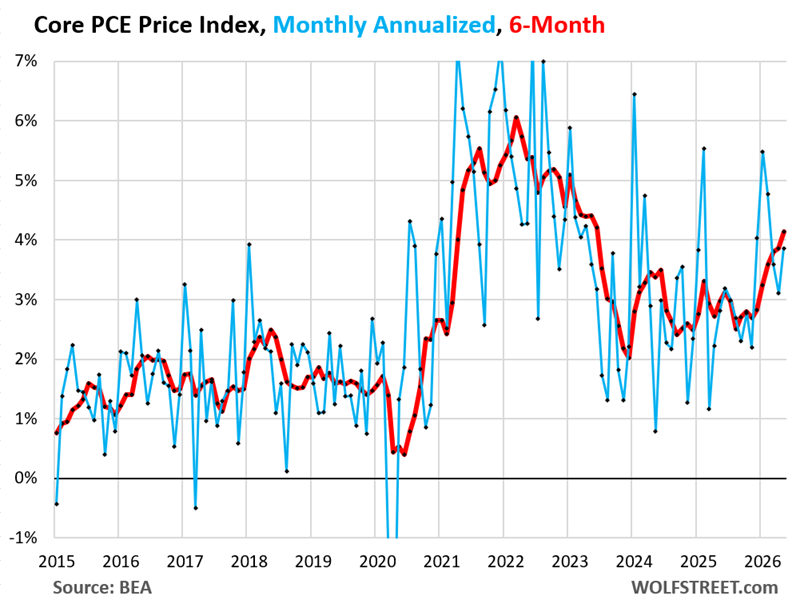
The core PCE price index – which excludes energy and food, and thereby excludes the spike in gasoline prices – rose by 0.32% in May from April (3.86% annualized, blue in the chart below).
The six-month core PCE price index, which shows the recent trends, accelerated to 4.1%, the worst since June 2023, and that’s without the energy price spike. It was primarily driven by the surge of inflation in “core services,” which dominate consumer spending; and secondarily, by increases in some goods categories — more in a moment.
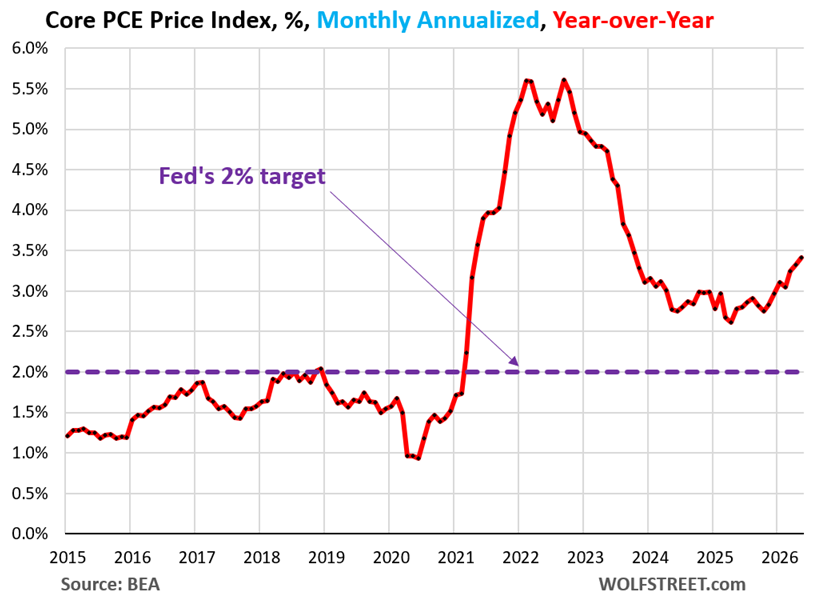
The year-over-year core PCE price index rose by 3.4% in May, the worst since July 2023.
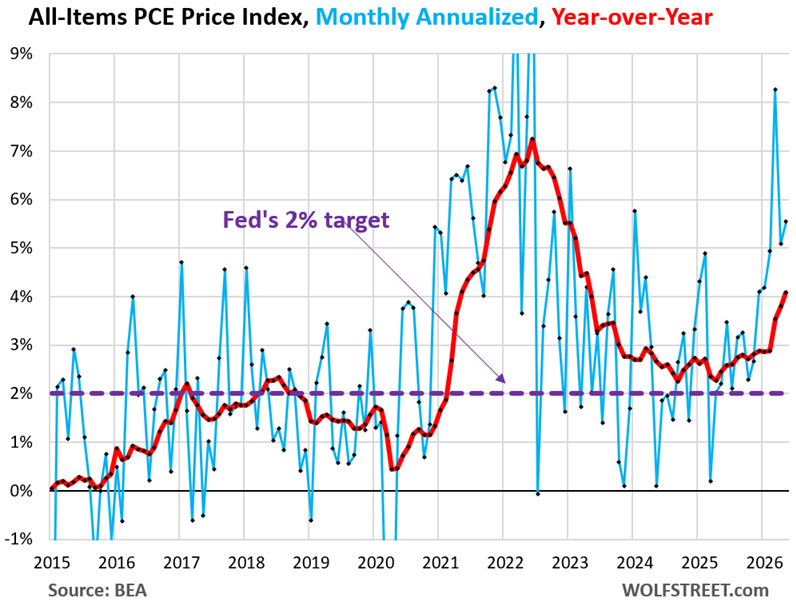
The Fed uses the core PCE price index as one of the yardsticks for its 2% inflation target (dotted purple line), the yardstick that allows the Fed to “look through” the energy price spike as food and energy prices are not included in this index.
It has been above the Fed’s 2% target since March 2021 (over five years!), and never got even close to the Fed’s 2% target, but bottomed out at 2.6% in April 2025 and has been moving away from the target ever since.
The all-items PCE price index – the other inflation index used by the Fed as its inflation yardstick – jumped by 0.45% in May from April (+5.5% annualized, blue line in the chart below).
Year-over-year, the PCE price index jumped by 4.1%, the worst since April 2023 (red line).
By this measure, inflation is now over double the Fed’s inflation target of 2% (dotted purple line). It has been moving away from the Fed’s target since May 2025, with big month-to-month surges in the months prior to the war in Iran.
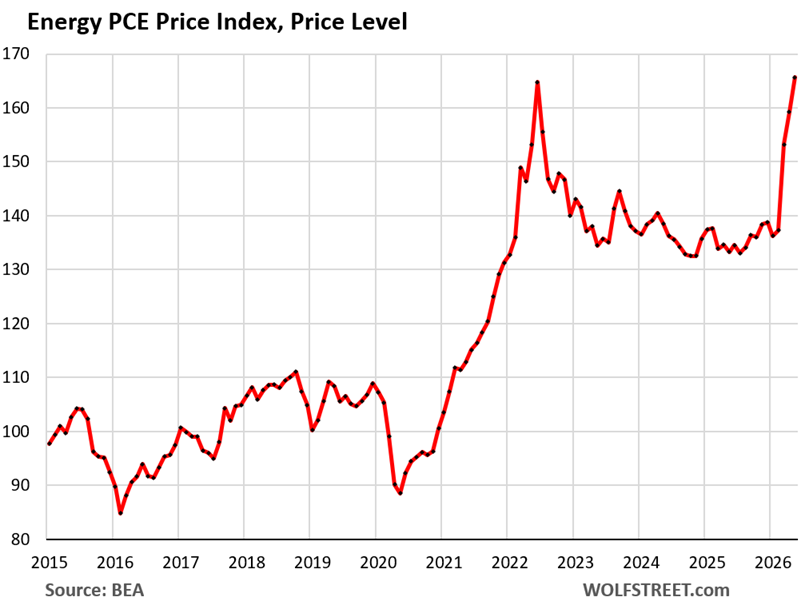
The energy PCE price index jumped by 4.0% in May from April (60% annualized) on top of the spikes in the prior months.
This pushed the year-over-year increase to +24.3%, up from a negative reading in February.
Prices of motor fuels have been declining in recent weeks, and that will be reflected in the PCE price index going forward.
But electricity costs have been surging – and those prices are highly regulated – and those price surges have been driven by demand growth from AI data centers, and that’s a structural inflation issue.
This chart shows the price level, not the year-over-year percentage change.
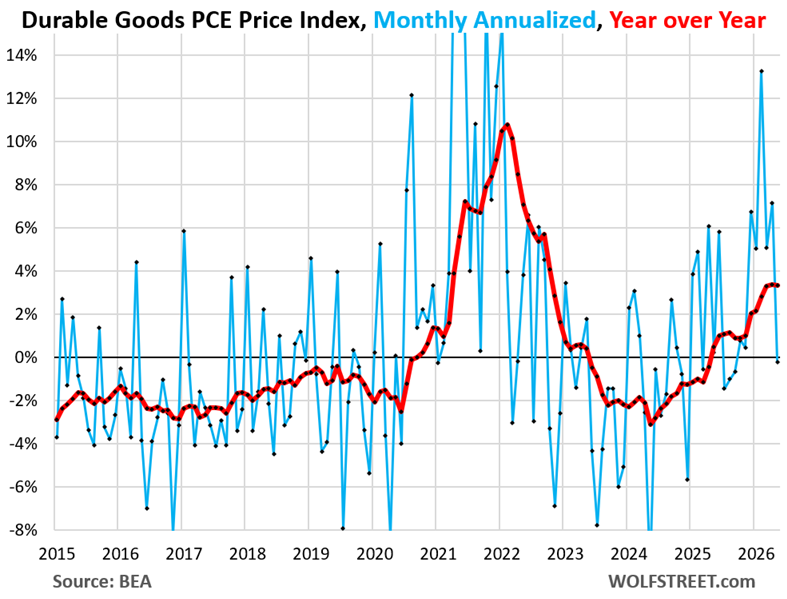
Durable goods prices dipped month to month by a hair, but were up 3.3% year-over-year, driven by massive spikes in four categories:
- Information processing equipment (laptops, PCs, tablets, accessories, and software that comes with them spiked by 10.2% year-over-year, driven by the price pressures on semiconductors from the AI investment boom, and also driven by software whose subscriptions got jacked up because AI is now included in them – the inflationary AI boom.
- Jewelry prices spiked by 22% year-over-year, as the earlier price spike of gold gets passed on.
- Video, audio, photographic, information processing equipment and media spiked by 8.3% year-over-year, on price surges in semiconductors.
- Glassware, tableware, and household utensils are where some of the tariffs were successfully passed on: prices spiked by 14.6% year-over-year.
Many other major categories had year-over-year declines, were unchanged, or had only small increases, such as new and used behicles.
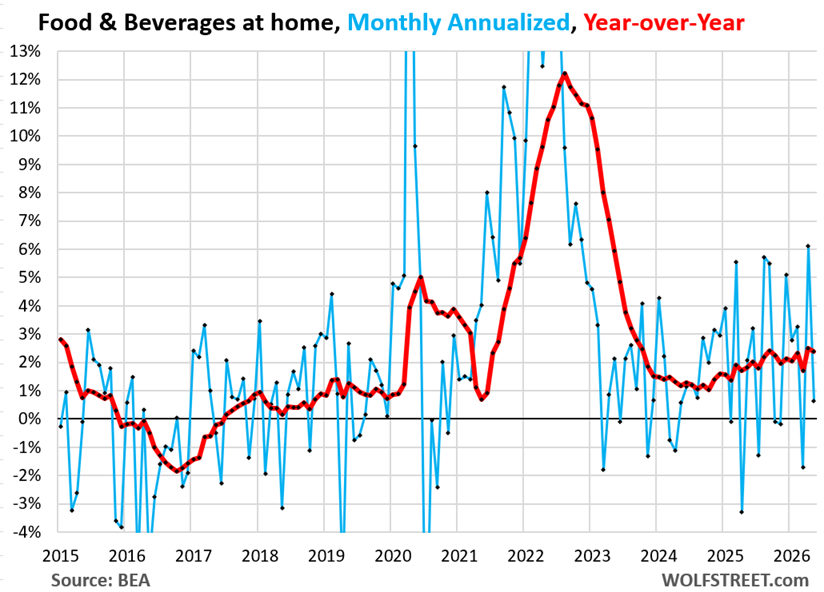
Food prices inched up a hair in May from April and rose 2.4% year-over-year.
Enjoy reading WOLF STREET and want to support it? You can donate. I appreciate it immensely. Click on the mug to find out how:

![]()
Hi Everyone! I’m still hiking in Europe (awesome). But this one had to get done this evening here.
Hope you’ve found some good IPAs!
IPAs in Europe? My Liechtenstein buddy suggested the religion is traditional lagers there (so, his favorite beer in USA was Miller Lite), though that was some years ago. Meanwhile the IPA dominance is fading fast in USA, Rogue shut down last year. I still refuse to touch seltzers.
Kurt Chambers
Your buddy in Lichtenstein needs to get out a little more. There are lots of small breweries that brew IPAs, from Germany to Greece.
Germany is likely the most conservative country in Europe when it comes to beers, although some craft beer places had started to pop up when I was last there in ’23.
Download Untappd and check nearby venues and selection ;-)
Why would someone in a place like Germany or Belgium, with all the outstanding beers those countries produce, want to drink an IPA? The whole point of IPAs was to be able to ship them to/from India without them going bad, not for them to be good. All those hops giving it a bitter taste are just preservatives.
In the modern context, if you just overload a beer on hops it covers up the corner-cutting elsewhere in the process, kind of like how the lowest quality groceries are always loaded up on sugar and salt.
Yes. Also found some nice other local beers.
If you make it to Belgium, get some Westvleteren XII. Considered by some to be the best in the world, and I don’t disagree.
Hope you are finding some ways to cool off over there Wolf. Thanks for posting,even on your break.
It’s not that bad here. We’re in the mountains, so the water is ice-cold, and we can take ice-cold showers till hypothermia sets in every night at our un-airconditioned hotels to bring the core temperature back down, a huge relief. The mother of all cold showers! We’re also able to go for a swim in the lakes or larger creeks we run into, and those are cold too. So there are ways to seriously cool off here. And at night, it cools off, and by morning, it’s pretty cool before the sun comes up. So we’re fine. People in big cities are not fine, however, and for many people in big cities — almost no one as AC in Europe, and big cities become heat islands that never cool off — the heat can be life-threatening.
No AC and no ice cubes, seems like Europe is still in the stone age.
No, they’re just at the same latitude as Canada. People forget that detail. Their deadly heat wave is my every summer!
Beware of security and enjoy traveling
from tokyo japan
There’s internet on the peak of the Matterhorn? Swell!
Or hell?
Wolf – are you hiking in Europe, or hitchhiking in Europe?
“Prices of motor fuels have been declining in recent weeks, and that will be reflected in the PCE price index going forward.” F’n yay! tired of winning!
Considering that the Strait of Hormuz is likely to be closed for the foreseeable future, I’m hearing that the full effects of the closure will be felt across the US later this summer. I cannot image inflation coming down anytime soon, unfortunately.
And that situation is still assuming a steady progress to ending this current confrontation. I am reminded what they did to Carter after he allowed the deposed Shah entry to the US for cancer treatment. The hostage crisis then lasted 444 days. I expect ‘issues’ will be ramped up over and over for the next few years and we’ll be whipsawed with rising and falling energy prices as a form of punishment….and just to assert power and additional pay back for the bombing. It’s a bloody mess.
Stagflation coming? ” Headcount reductions in factories have accelerated to levels not seen outside of recessions since 2009. The industry has shed over 100,000 jobs, dropping employment to its lowest levels since the end of the pandemic”
Enjoy the holiday WR and thanks for the article on your time away. Most appreciated.
You’ve been spreading the same oil-company propaganda BS for two months. Meanwhile, it’s summer and oil prices have plunged. I explained to you many times in advance and during, why that would happen and did happen.
My “Gas Station from Hell” is still posting $6/gallon for regular gas in spite of the $30 drop in crude. I think this is price gauging like Trump stated.
Come on, you and I have been thru this many times. Gas prices and production are cyclical. Oil rigs shut down when inventory is high. Do you think those oil ships coming to our ports empty and leaving filled up, as Trump claims, didn’t reduce inventory? The last bidding on the Strategic Oil Reserve auction had 2 bidders. They are so small they can’t process it, just hoping they can make enough from selling the contract to cover the 20% increase in barrels the contract demands they return. Do you actually believe a politician, especially Trump?
Trump only lies 50% of the time. This time he was telling the truth.
It was price gouging from get-go. Prices don’t spike on their own. They get raised by companies selling the product.
Wolf, the markets set the price level. Demand and production now and in the near future set prices, unless some idiot has the power to start a “war”. Are you saying that Trump’s intervention didn’t start the snowball going downhill?
Premium gas this morning. $3.85
Castle Rock Colorado
I know a place where I get $1.00 per gallon fuel — my garage when I plug-in my Tesla M3. That’s the equivalent price per gallon for the electricity I use.
Kudos to you.
I only have EVs and have 5 of them. I usually charge my EV in my work place for free. Other EVs at mid night during super off peak rates
It’s rich irony blaming a gas station owner “like Trump stated” for the price gouging operation that was this war. Hundreds of millions of dollars out of the many billions the oil and gas industry earned thanks to the war are heading to GOP candidates. That was the whole point of the war. The gouge was the war itself, not the gas station middleman.
Vehicle parts are still inflating in price.
I do most all of my own vehicle repairs, and keep record saving all my receipts.
Exact same parts are double, triple, quadruple in price over the past 3-5 years.
One part failed the other day, luckily it was warranty…. But it had doubled in price in just 9 months.
Thank you for honest reporting what is actually happening!!!
EXACTLY why I support Wolf’s Wonderful reporting,,,
and will continue to do so.
No matter where he might choose to vacay…
This is one cost of reshoring.
Tom S.
This was a problem before reshoring.
The parts companies went bankrupt, were bought out, and consolidated as a result of GFC. Now there are only a few huge parts companies that supply everything to everyone, including vehicle manufactures. Which is why they can charge whatever price, and have whatever reliability.
Not necessarily just a new result of re-shore.
It is not just antidotal info either. I have kept records of parts prices and parts longevity on many vehicles over 30 years… all compared apples for apples.
Parts prices are rising, parts reliability and longevity are falling. Most especially in the last 3-5 years.
Also my cousin was at a mechanic re-certification class awhile back and said that in the class they stated that vehicles are trending back toward the old 100,000 mile lifespan due to planned obsolesence, and the high costs of repair due to complexity, and labor costs vs. just buying another vehicle.
Ford is the worst with planned obsolesence.
Jerome Transitory “We’re Going To Let It Run Hot” Powell is a major loser, and his legacy is GONZO. The dude FAILED EPICALLY to reign in inflation. He is worse than Arthur Burns. This is ALL ON HIM.
“This is ALL ON HIM.”
Whereas I’d say it’s all on a succession of Fed Chairmen, Congresses, and Presidents starting with FDR and running through to President Vegetable and President Trump.
With special mention of LBJ for introducing an extravagant welfare state, and expanding a stupid, reckless war in Vietnam without troubling to think how to pay for them.
Depth
“We will see through the data when appropriate”
is still in play.
The subjectivity of the Fed errs always in the same direction, slow to raise.
We need a hard railed monetary policy like the Taylor Rule.
Chip and capacitor prices, plus services, charging higher.
WSJ says inflation above the “target range”. yep, for about 5 years now …
*rein
Need to not post so late.
No, it’s all on us voters for electing the people who promised to run up the debt in exchange for tax cuts, wars, and benefits. It’s on us for voting for whoever makes the biggest fake promises to “create jobs”.
Imagine an alternative universe where deficit uber-hawk Ross Perot won in ’92.
Integrated Circuits (ICs) are in almost every product these days.
Demand for ICs is greater than the supply, especially for high-end parts and the most critical memory devices. This situation will raise prices for many products and services.
Given that so many products mentioned above use electricity, the demand for electricity is growing faster than the supply, so prices rise for the juice that powers our world.
All of this causes inflation!
There is one pervasive economic constant out there today: inflation. Since the government’s of the world can not stop spending more than their incomes, it ain:t going away. Perhaps by letting it run hot, the economy that is, will collapse and we can all start all over again.
Thanks again for the 6 month annualized percent change graphics! That’s the metric I think most helpful.
PS. I think the titles of the 6 month graphics could be labeled a little more clearly if they were edited slightly, from, for example:
“Core PCE Price Index, Monthly Annualized (blue), 6 Month (red)”
to something like
“Core PCE Price Index, Annualized Growth, Monthly (blue), 6 Month (red)”
Jeff, not every month yields a growth. We’re lucky if we see a decrease. Sometimes we do. Wolf currently titles his figures such that they cover all cases. Cheers.
Separately, Wolf, hope you’re enjoying your time with your brother and hiking. Wishing you safe travels and easygoing recovery for your joints and muscles. Look out for bears!
I can only hope Warsh is reading this blog. These charts are simple enough for a 1st grader.
Meanwhile, Wolf as time off from his Eiger Sanction to post info that is mles above the slop on 99% of financial sites
Careful, your ass kissing will wake the hungry German bears while the smooching echoes off the cliffs.
😆
If you know a better source than Wolf, I would like you to share.
His updates on inflation are the best I’ve seen. That said, I disagree with other opinions of his.
Wandervogel?
Have a good holiday Wolf.
Inflation will still be waiting for you when you return.
Enjoy the wurst and beer and scenery!
Go ahead Mr. Warsh, raise those rates, I triple dog dare you!!!!
Pretty please? With a cherry on top and extra ice cream on the side?
I wonder how Wolf likes the 100+ deg temperature on his hiking trail?
So we finished the hike, and I’m on my way back. In Salzburg, the heat during the day was exhausting. But out in nature, it’s different, hot but bearable. Cover up to protect yourself from the sun, drink lots of water, you know the drill. And take a dip in cold creeks, rivers, or lakes at least once a day to cool off completely, which makes a huge difference. And then, back in the non-AC hotel room, take a long ice-cold shower until you emerge shivering. And out in nature and in these villages, where we were, it cools off at night. So it was OK without AC at night.
Big city cores are just about relentlessly unbearable without AC. But we didn’t go there, except Salzburg (which may not qualify as a big city, but it has a very dense core which heats up really badly).
My brother and I agree: we prefer hiking in beautiful weather, though hot, a million times over hiking in the rain… and it can rain a lot in the Alps, which makes hiking truly miserable. We loved the uninterrupted beautiful weather, and we considered ourselves lucky. Last night, the moon was nearly full. Gorgeous.
Wolf
Don’t feel so bad. Its going to be 105 deg here in the Swamp this Thurs. Add in the humidity and it feels like another 10 degrees, like 115 deg. Then add the reflective heat from all the white concrete buildings and it’s effectively like 120 to 125 degrees. I’m stayin in except early in the morning or late in the eve.
I (in the US) and always amazed by people in the US who will go into their air conditioned house on a hot summer day and take a steamy hot shower. You know you are working against yourself, right?
Great sounds like a good trip! Safe travels!
Well,sounds like the Euro Vaco was a hit….,good deal!
Demand deposits as a percentage of M2 stood at 10 percent in February 2020. By May 2026 demand deposits stood at 30 percent of M2. That shift has activated monetary savings. That has kept the economy afloat as time deposits represent frozen savings.
Demand deposits plus currency have increased by 1419.4b while M2 has increased by 1006.5 since last June. I.e., there has been a shift in deposit classifications and a flight to safety changing the composition of the aggregates. These are spendable balances, means-of-payment money, and should propel the economy forward.
That has lead to the broadening out of inflation.
Sounds to me like a lot of investors have discovered the barbell strategy. They’re piling into the riskiest equities with a quarter of their money and leaving three quarters in money market funds. That’s a lot easier now that demand deposits have an actual yield, unlike in 2020.
Wolf enjoy the hike as it is something I can no longer accomplish. a hundred yards is a goal now. Besure to use sun screen and cover all other places. I was rather well seasoned during my young life and spent many hours in the sun. Farm work does provide many hours outside. Now numerous skin cancers are beginnig to take their toll. Doctor and surgeon services are also inflating in cost so thankful we have Medicare, even if I don’t like the idea, along with paid policies it has begun to increase my expenses. Hoist a few for ne too!
Sorry to hear about your medical issues. I understand the power of the sun. I always hike in long-sleeved shirt with collar up, long pants, broad-brimmed hiking hat, and #50 sunscreen on my hands. So far, so good.
Given the administration is paying energy companies lots of money NOT to develop plants that will generate electricity, is simply insane. Granted, it doesn’t affect current electricity prices, it does affect future outlook and future prices though.
It is incredible just how many of this administration policies fuel inflation.
“[Core PCE] has been above the Fed’s 2% target since March 2021 (over five years!), and never got even close to the Fed’s 2% target, but bottomed out at 2.6% in April 2025 and has been moving away from the target ever since.”
The April 2025 bottom was a few months from the point in November 2025 when the Fed’s balance sheet bottomed out. After that point, the balance sheet reversed course and started growing again.
From the Federal Reserve, (https://www.federalreserve.gov/publications/files/balance_sheet_developments_report_202511.pdf ):
“On October 29, 2025, the FOMC announced that the Committee would conclude the reduction of its aggregate securities holdings, consistent with its Plans for Reducing the Size of the Federal Reserve’s
Balance Sheet. …
Beginning December 1, 2025, the Committee will rollover at auction all principal payments from Treasury securities and reinvest all principal payments from agency securities into Treasury bills.”
These decisions, communicated months in advance (i.e. back in April/May, at the bottom), occurred in the same timeframe that disinflation pivoted to rising inflation.
Call it QE or call it “Balance Sheet Reduction”, this stuff appears to be very, very strong medicine.
So I’ll be watching to see if KevWar or the Federal Reserve quietly announces a resumption of QE after the July or September FOMC meetings. No decision will transmit to me that the plan is continued money printing, balance sheet growth despite all promises, and higher inflation.