Fed shed 26.5% of Treasuries it had added during pandemic QE.
By Wolf Richter for WOLF STREET.
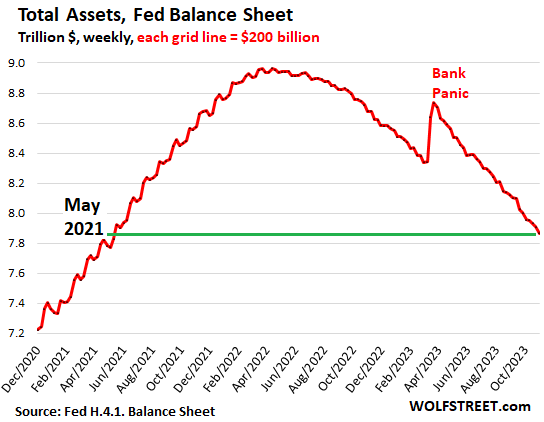
The Fed’s Quantitative Tightening (QT) and the unwinding of the bank-panic liquidity measures continue on track: Total assets on the Fed’s balance sheet dropped by $89 billion in October, to $7.87 trillion, the lowest since May 2021, according to the Fed’s weekly balance sheet today.
Since peak-QE in April 2022, total assets have dropped by $1.10 trillion. The close-up view:
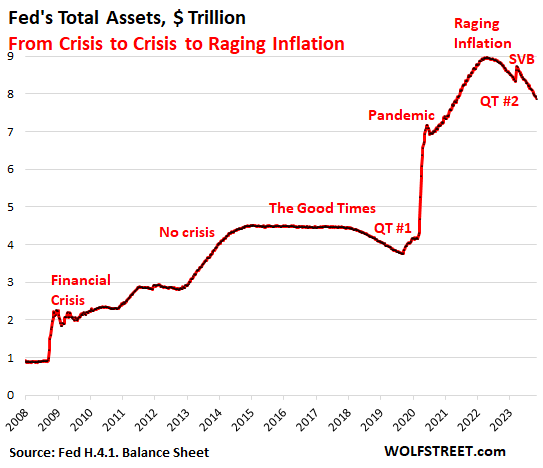
From crisis to crisis to raging inflation:
During this $1.1 trillion drop in assets under QT #2, inflation has backed off from its rage in 2022, but it’s still nearly twice the Fed’s target.
By contrast, during QT #1 between November 2017 and August 2019, when the Fed’s total assets dropped by $688 billion, inflation was below or at the Fed’s target (1.8% core PCE in August 2019), and the Fed was just trying to “normalize” its balance sheet.
But now there’s a lot of inflation still, and the QE asset-pile ballooned when the Fed went hog-wild during the pandemic, and now there’s a lot more to take off the pile. The long view:
QT on track.
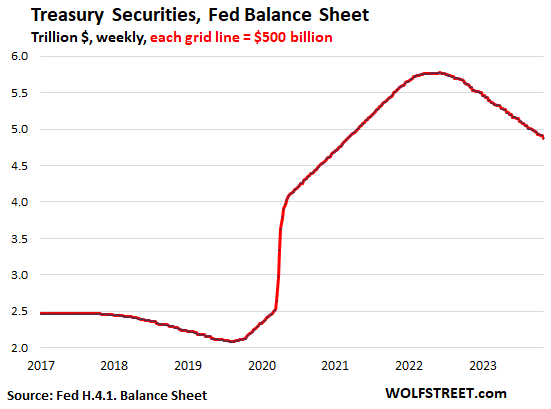
Treasury securities: -$58 billion in October, -$899 billion from peak in June 2022, to $4.87 trillion, the lowest since March 2021.
The Fed has shed 27.5% of the $3.27 trillion in Treasury securities it had piled on during pandemic-QE.
Treasury notes (2- to 10-year securities) and bonds (20- & 30-year securities) “roll off” the balance sheet mid-month or at the end of the month when they mature and the Fed gets paid face value for them. The roll-off is capped at $60 billion per month, and about that much has been rolling off, minus the inflation protection the Fed earns on Treasury Inflation Protected Securities (TIPS) which is added to the principal of the TIPS.
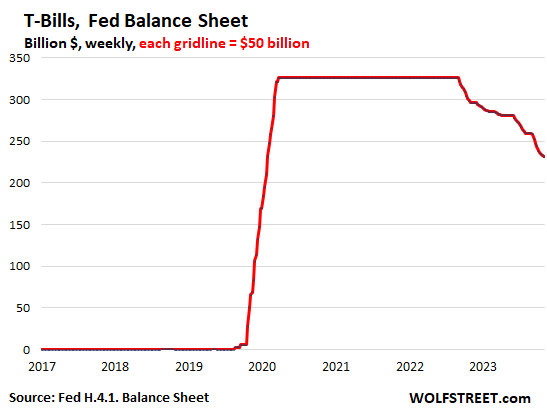
Why Treasury bills are important for QT. These short-term securities (1 month to 1 year) are included in the overall Treasury securities of $4.87 trillion on the Fed’s balance sheet.
They show us when the roll-off of notes and bonds falls short of the $60-billion monthly cap, because T-bills are then used to make up the difference. And when the Fed runs out of T-bills, the Treasury roll-off will fall below the $60 billion cap.
There were only three months this year – February, May, and August – when the roll-off of notes and bonds exceeded the $60 billion monthly cap, so the roll-off was capped at $60 billion.
In the other seven months this year, the roll-off of notes and bonds was below the cap, and T-bills were used to make up the difference. In October, $7 billion of T-bills were used for this purpose.
From March 2020 through the ramp-up of QT, the Fed held $326 billion in T-bills that it constantly replaced as they matured by buying new T-bills at auctions. This is evidenced by the flat line in the chart below.
In September 2022, T-bills first started rolling off as needed to top off the Treasury roll offs.
On the current balance sheet, T-bills are down to $231 billion, with the other $95 billion in T-bills having by now been used to top off the Treasury roll-off.
The stash of T-bills on the balance sheet tells us that the Fed will hit the $60 billion cap each month. Once that stash is gone, the roll-off of Treasuries will then mostly not reach the $60 billion cap.
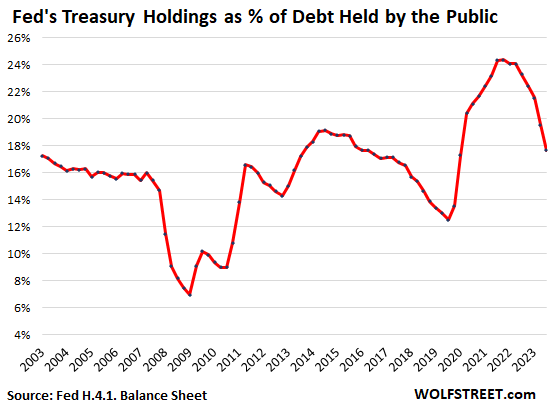
The Fed’s weight in the Treasury market: The Fed now holds 17.7% of marketable Treasury securities held by the public, down from over 24% at the peak. The sharp drop in the percentage is a result of two factors: One, the QT drop in Treasury securities on the Fed’s balance sheet; and two, the ballooning marketable securities issued to fund the gigantic deficit.
In other words, the Fed still plays a big role in the bond market, but that role is rapidly declining in relative terms:
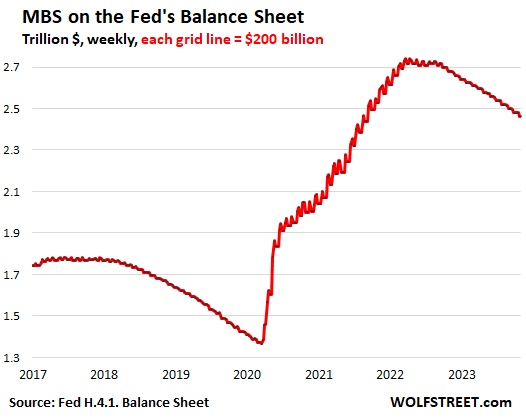
Mortgage-Backed Securities: -$17 billion in October, -$277 billion from the peak, to $2.46 trillion, the lowest since September 2021.
The Fed only holds government-backed MBS, and taxpayers carry the credit risk. MBS come off the balance sheet primarily via pass-through principal payments that holders receive when mortgages are paid off (mortgaged homes are sold, mortgages are refinanced) and when mortgage payments are made.
The spike in mortgage rates has caused refis to collapse and home sales to plunge which slowed the mortgage payoffs, and therefore the pass-through principal payments, with the MBS run-off between $15 billion and $21 billion a month, far below the $35-billion cap.
Bank-panic liquidity pile unwinds.
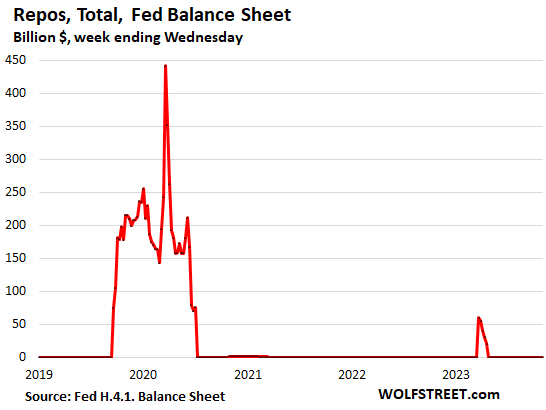
Repos come in two flavors, both $0 now. Repos with “foreign official” counterparties – likely the Swiss National Bank in its efforts to backstop the take-under of Credit Suisse by UBS – were paid off in April. At the peak in March 2023, they reached $60 billion.
The normal repos with US counterparties faded out in July 2020, when the Fed made the terms less attractive. The Fed currently charges 5.5% on repos, as part of its policy rates, which it left unchanged yesterday, and there are no takers at these rates. But there were lots of takers during the crisis in March through June 2020, and when the repo market blew out in late 2019. That’s the big bulge in the chart below.
The little bulge in early 2023 were the repos with foreign official counterparties.
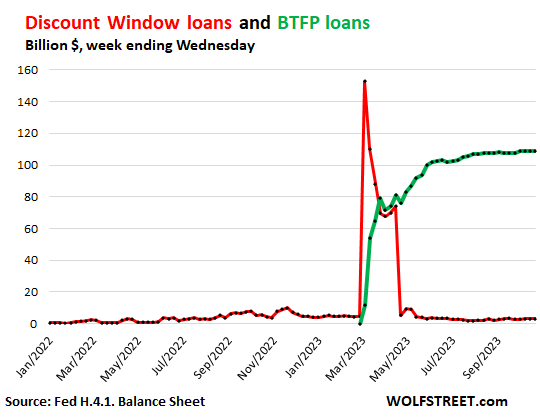
Discount Window: roughly unchanged in October, at the near-nothing level of $2.9 billion, compared to $153 billion in bank-panic March (red line in the chart below).
Discount Window lending to banks is as old as the Fed. The Fed currently charges banks 5.5% to borrow at the discount window, and banks have to post collateral under strict conditions and at “fair market value.” Banks pay off these expensive Discount Window loans as soon as they can.
Bank Term Funding Program (BTFP): ticked up by $1.4 billion in October to $109 billion (green line in the chart below).
The BTFP, created during the bank panic, is less punitive and more flexible than the Discount Window. Banks can borrow for up to one year, at a fixed rate, pegged to the one-year overnight index swap rate plus 10 basis points. The collateral is valued at purchase price rather than at the lower market price.
This facility is small compared to the $22.8 trillion in commercial bank assets held by the 4,100 commercial banks in the US.
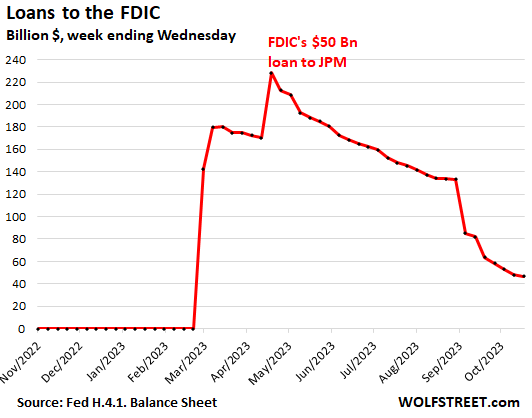
Loans to FDIC: -$16 billion in October, to $47 billion.
The FDIC has been selling the assets it took on with the takedowns of Silicon Valley Bank, Signature Bank, and First Republic. After the asset sales close, the FDIC sends the proceeds from the sales to the Fed to pay down the loan balance. The FDIC also issued a $50 billion loan to JPMorgan to fund part of the First Republic liabilities that JPMorgan took on.
Enjoy reading WOLF STREET and want to support it? You can donate. I appreciate it immensely. Click on the mug to find out how:

![]()
Wolf – I think it should be $9.47 trillion in below statement.
Treasury securities: -$58 billion in October, -$899 billion from peak in June 2022, to $4.87 trillion, the lowest since March 2021.
I mean $9.87 trillion
My number is correct. This is just Treasury securities, and they’re now down to $4.87 trillion. They were never ever $9.47 trillion. At the peak, there were $5.75 trillion.
You might be thinking total assets. They topped out at just under $9 trillion and are now down to $7.87 trillion.
Lost in the shuffle is the ballooning balance sheet at the FHLB.
They are lending way beyond their original charter and their balance sheet quadrupled to way over a trillion during the bank panic earlier this year.
I think they have stepped in as a step lender of last resort and in view of their ballooning balance sheet I wonder how much QT has actually occured.
What does it mean when it’s down?
Was the $60 billion monthly limit abitrary or calculated to not roil markets or was there other reasoning behind the number? It seems to be slow relative to the buildup. Why not $80 or $100 or $120 billion/month?
The caps were “compromises” among FOMC members, Powell explained some time ago. Some wanted higher caps, others wanted lower caps, and so they compromised.
But they’re largely theoretical anyway because they’re higher than the average natural roll-off. So far, MBS have never hit the cap, and Treasuries hit the cap like 5 months out of 15 months of QT. And as Treasuries continue to shrink, the maturing amounts also shrink, and there will be fewer and fewer months when they will hit the cap. So the caps are really not a big deal.
The only time the caps could be a big deal is when mortgage rates plunge to 3%. Then you will see MBS fly off the shelf at a rate far higher than the caps. But I doubt we’ll see 3% again in the years while the Fed still has MBS on its balance sheet.
Wolf: I notice that $1.3T of MBS were bought by FED from Pandemic to March 2022. The jump from ~ 1.35 to 1.95 during the first month or so of pandemic perhaps makes sense but why or what made them continue to buy MBS when the IR was close to zero and anyone could or should have refinanced? Unless they loans were on zombie properties. And from whom they bought, banks? Confusing.
Anyway, at the rate they are doing QT, it will take another 81 months if they want to start with a clean slate. Assuming we would not have any great recession or depression in the mean time.
Thanks for the good work.
The Fed should have never ever bought any MBS ever, period. The Fed should have never done QE. It should have used repos to supply the market with liquidity, and after a few months, let the repos mature and vanish, and done. That’s how the Fed did it before 2008, including following 9/11. Worked fine.
When mortgage rates drop to something like 5%, there will be an onslaught of refis (all the 6-8% mortgages), and that will drain the MBS from the balance sheet at a very fast rate. That happened in 2019. So you cannot project this out in a straight line.
Really? Will it be worth the mortgage fees? They get quite expensive.
And homeowners may hope for 4% down the line.
I’m confused. The runoff has been way below the cap each month, so I thought the Fed wasn’t replacing any MBS the way they do with treasury securities. So why would there be 6-8% mortgages on the Fed’s books?
I would have thought the opposite, that the rates dropping to 5% would cause people to move, causing a payoff of the 3-4% mortgages originated during the pre-2022 era, as the delta would be lower, so giving up the 3% mortgage would be less painful.
What am I missing here?
If people have a 3% mortgage now, and rates drop from 8% to 5%, it creates less incentive for people to stay put. They can move for a job or whatever, close out the 3% mortgage, and enter a new 5% mortgage that much more palatable than 8%. Plus, if they do it while prices remain high, they can reap a price gain to offset the higher 5% mortgage rate.
Einhal,
In terms of the refis, LOL, why didn’t I think of that? Good point.
The Fed ended MBS purchases in Sep 2022. So up to then, that’s the pool of mortgages including those with higher rates, but not 8%. Between April 2022 and September 2022, mortgage rates were in the 5-6% range. So in terms of refis, mortgage rates would have to drop to 5% and below to trigger a surge in passthrough principal payments.
Yes, 5% would cause people to move, sell their old homes, and pay off their old 3% mortgages, and those would be in the Fed’s mortgage pools, and so that would trigger a surge in passthrough principal payments for the Fed.
Wolf-
Your comment: “That’s how the Fed did it before 2008, including following 9/11. Worked fine.”
Like Einhal, I’m confused, too. During the mortgage crisis of 2008, what event or facts changed that persuaded the Fed to make such a monumental and experimental change in its methods of operation?
The short answer is corruption. Mortgage backed securities in fact violated contract law. The right thing to do would have been to let all these corporations go BANKRUPT and PROSECUTE THE PERPS.
Instead corrupt politicians (primarily Hank Paulson) lead a taxpayer-funded bailout through TARP and TALF and changed the law so that there would be no prosecutions.
At this point, everyone in the country should have revolted as it was clear the rule of law was 100% dead.
Wolf is 100% correct. The Fed NEVER should have touched MBS, this was a creation of the financial sector and those f&%kers should have been forced to choke on their own creation.
John H.,
Bailing out investors in the housing market and lenders to the housing market (banks, MBS holders, etc.), and thereby bailing out pension funds, bond funds, money market funds, etc., initially, and after the first wave, inflating home prices and asset prices in general. This was explained by Bernanke himself. QE was all about the Wealth Effect.
I think the threat of “global financial collapse” or whatever was tied to the MBS, so congress/treasury freaked out and asked the fed to do the unprecedented move of buying MBS (to support investment bank balance sheets which were looking insolvent due to MBS price collapse).
More frightening to me is when the Fed forayed into buying corporate debt during the pandemic. One step away from buying stocks. The resulting wealth inequality would be astounding.
https://www.newyorkfed.org/markets/mbs_faq.html
WB, Wolf and Tom S.-
Thanks for the input.
Seems to me that the Fed needs to be reformed with some meaningful activity and size restrictions (in addition to a complete revision to it’s congressional mandate).
I nominate Lewis Lehrman to lead the commission, if he’s available!
I agree. Can an entire generation launch a class action suit against the fed for creating an absurd housing bubble?
AwaitingBubbleRubble,
That would be a hoot. But a lawyer would have to chime in. There are rules as to who can be sued in class-action lawsuits. I don’t think government agencies (Federal Reserve Board of Governors) can be hit with class-action. Will a lawyer please chime in here?
Wolf is correct. The federal government has general immunity from lawsuits (sovereign immunity). In other words, the federal government or its agencies and subdivisions can’t be sued unless Congress passes a law explicitly allowing it.
One example is the Federal Tort Claims Act, but it’s limited to things that are non-discretionary. For example, when a person is assaulted by a federal officer while on duty.
The doctrine of sovereign immunity generally protects the government from lawsuits. The Federal government and its agencies can only be sued if a law specifically authorizes such a suit. The Federal Tort Claims Act is a classic example of a law authorizing lawsuits against the Federal government. Civil rights legislation also allows lawsuits for various infringements of civil rights. Another example is the Internal Revenue Code which authorizes taxpayer lawsuits for tax refunds. Class actions are possible against the Federal government if the lawsuit is allowed by law. I’ve never had occasion to deal with it, but I doubt that sovereign immunity has been abrogated when it comes to the discretionary acts of Federal agencies such as the Fed.
Yes of course. It’s been done many times in history. 1776 comes to mind
Who do you think was damaged? Those priced out of the market, or those who bought houses and are about to lose a lot of money on them?
the Fed is not a federal gov’t entity. It is a private corporation. It has no sovreign immunity. It is open to lawsuits. What the basis of the suit would be is an open issue. It is unclear if the Fed Board of Governors has individual immunity.
Dr. J,
The Federal Reserve is a hybrid organization. Only the regional Federal Reserve Banks are private corporations whose shares are owned by banks in their respective districts. Members of the Board of Governors, located in Washington, D.C., are appointed by the U.S. President and confirmed by the U.S. Senate. Board members and staff are civil service employees. A majority on the Fed’s rate setting FOMC are government employees.
The Board of Governors, accordingly, is only subject to lawsuits as authorized by Congress. It’s important to understand the structure because some people try to paint the Fed’s hybrid status as some sort of secret conspiracy even though the whole structure is very transparent. I can’t remember when, but I know Wolf has discussed it.
Those days of less than 6% mortgages are gone. I mean gone forever unless we have a depression. Get over it.
At the rate they’re plunging right now, you may see them by the end of the month. (I’m exaggerating…or am I, lol?)
re: “That’s how the Fed did it before 2008, including following 9/11. Worked fine.”
Monetarism has never been tried. The only tool, credit control device, at the disposal of the monetary authority in a free capitalistic system through which the volume of money can be properly controlled are legal reserves and reserve ratios.
All deposit taking, money creating financial institutions, should have uniform legal reserve requirements, for all deposits, in all banks, irrespective of size, both as to types of assets eligible for reserves, as well as the level of reserve ratios. There is no reason for differential reserve requirements in the first place (something Nobel Laureate Dr. Milton Friedman advocated, December 16, 1959).
https://files.stlouisfed.org/files/htdocs/publications/review/2023/06/02/fiscal-dominance-and-the-return-of-zero-interest-bank-reserve-requirements.pdf
As I said: “The FED will obviously, sometime in the future, lose control of the money stock.” May 8, 2020. 10:38 AMLink
Link: Dr. Daniel L. Thornton, May 12, 2022:
“However, on March 26, 2020, the Board of Governors reduced the reserve requirement on checkable deposits to zero. This action ended the Fed’s ability to control M1.”
Apparently, no one understood how Greenspan caused “Black Monday”.
“As I said: “The FED will obviously…”
I don’t know how many of these comments you have ready to go, but I have seen most of them on my site from you multiple times (copy and paste). You’re promoting some kind of crazy economy theory from your dead “mentor” — you explained to me who he was, some academic or other that passed away years ago, but I can’t remember now.
Wolf said: “When mortgage rates drop to something like 5%, ”
——————————-
When? Don’t you mean if?
Wolf said: “When mortgage rates drop to something like 5%, there will be an onslaught of refis (all the 6-8% mortgages), and that will drain the MBS from the balance sheet at a very fast rate.”
———————————————
Why would 5% interest rate refis drain the FED’s balance sheet?
Exactly! Especially the MBS Holdings are a big problem for the Fed, and as you mentioned correct, as long as the Mortgage Rates are on this level. Another problem is, the Fed (and other Central Banks) do QE too strong and far too long.
With QE you can restore a market malfunction, but central banks transformed QE from a temporarily to a permanent tool, which is also a reason why they stuck with their balance sheet roll off.
Additional remarks i forgot: I also agree with you that the Fed should use more their repo instruments to manage the liquidity in the market. These are short term loans and as we can see in the balance sheet, T-Bills matured far more earlier as the notes and bonds.
But the ECB is on the same wrong way.
This is very well written. I’m teaching monetary policy to my class next week. I’ll be posting a link to your article so that we can see the theory in terms of real data. Thanks 👍
All that matters Wolf:
P($14T before $6.8T): non zero
P($14T before $0T): zero
;)
Whoops… meant:
P($14T before $0T): 100%
for that last one :P
Firstly let’ me say, Wolf your website is amazing and your analysis is very inciteful. I just wish you had more YouTube videos though and maybe a weekly commentary where you invite people on and discuss the state of the economy and world as a whole.
Now, here’s my analysis.
Firstly I see alarm bells as every time the Fed reduces its balance sheet by circa 1 trillion, another crisis pops up so this reduction is not likely to last too long.
2nd, is this rally going to be a sucker’s rally? I wonder.
Thirdly, Japan worries me. I suspect they may have to sell US treasury to defend their currency which of course will increase the flood of treasuries and could buy extension push up yields. Japan is the 3rd largest economy in the world and it’s instability can cause the US economy into a crisis.
Fourthly, Yellen’s move to increase issuance into the short end of the curve will no doubt increase instability throughout the entire curve. So at some point we MUST SEE YIELD CURVE CONTROL BY THE FED, and this must be inflationary, aka Argentina style, not Japan style. Very bullish for gold.
Fifthly, a 2 trillion deficit in a time when there is no actual war is unheard of. And this deficit is certainly adding to economic growth and inflation. Once yields rise, the US government will be forced to either engage the fed via yield curve control and or reduce spending and or increase taxes. Or maybe they will be happy to run 20% inflation for 5 years and reduce the debt to GDP % via inflation. I would not rule that out. Maybe that is something they can do once they officially go to war?
Seventhly, next year interest on national debt is likely to reach 1 trillion. And when deficits to GDP reach 10% it will force a credit downgrade. That is only a matter of time.
My overall view is any deficit over 2 trillion will be bullish for gold and silver.
Much to agree with, especially your first line, LOL. Seriously, much to agree with. But not everything.
Here’s something I want to point out specifically:
Your #4. You’re overlooking the obvious: Actual issuance will shift to notes and bonds… even in Q4, as long-term yields have dropped, and Treasury can now boost long-term auctions. Keep an eye on the auctions. This announcement of TBAC recommendations was designed to push down yields, and it worked, and so now they can go back to actually issuing more long-term paper.
The Fed has full-blast-broadside shot down repeatedly yield-curve control and NIRP during QE. That those are toxic for banks, and the Fed won’t kill the banks that it’s in charge of propping up. That’s one of the most fundamental principles you need to understand.
Your #5 and #6: you underestimate the extent to which a government that creates its own fiat currency can fund itself. They won’t run out of funding; but they will create a lot of inflation if they don’t get the deficits under control.
I deleted your #6 and your last paragraph. I don’t allow warmongering on this site. Violation of Commenting Guideline #13
Hey Wolf,
How come the 30 Year jumbo mbs rates are higher than the 30 year fixed?
I’ve been watching the mbs rates on mortgage news daily very closely since the pandemic and the jumbo 30 years have always been decently lower than the 30 yr fixed.
Then, once the rates started going up the jumbo rates went higher than the fixed and have been higher since then.
Because investors don’t trust the collateral values along withunique tail risks in economies of coastal areas where jumbo mortgages are utilized (lack of adequate insurance/cost & exposure to tech/finance). Spreads over the 10y have been widening, but much more for jumbos.
Isn’t it as simple as the jumbo mortgages being non-Freddie/Fannie compliant, and thus investors can’t pass the risk to taxpayers?
That should be the normal condition since jumbo loans can’t get Fannie Mae and Freddie Mac backing. That they were lower than conforming mortgages for a while was an aberration.
Powell gonna take you out back the Fed Shed.
Knock those credit cards 💳 out yo pocket!
So less money, less demand, higher rates on longer durations and prime rates. Explains trend is down with bear market rallies.
Wolf….
Knowing you are correct, could you point out what I am misreading on this Federal Reserve page?
https://www.federalreserve.gov/releases/h41/20231102/
The balance sheet seems to read 7.947 Trillion. What needs to be deducted to get to your number 7.87 Trillion?
Thanks
Yes, the Fed balance sheet is a bit convoluted. Go down to Table 5, “Consolidated Statement of Condition of All Federal Reserve Banks,” first part of table “Assets,” then the bottom line, “Total Assets” = 7,866,664
What you’re looking at is Table 1, “Factors Affecting Reserve Balances of Depository Institutions.”
thanks
Wow, unwinding the fraud, all the way back to …
…2021.
Pathetic.
Full FAITH and credit… LOL!
Keep them honest Wolf!
Wall Street HATES this QT.
Here is my calculation of how low the Fed’s balance sheet can go. This was over a year ago, and it still holds. The minimum possible balance sheet size is determined by the liabilities:
How Low Can the Fed’s Balance Sheet Go?
Yes, I remember that. I still think getting to 5.5 trillion is EXTREMELY optimistic.
Wolf, could you provide a chart of Total FED Assets before the year 2008? Like from 1980 till now?
No, if you want to study ancient history, go study ancient history.
On FRED the WALCL series is Wolf’s “total FED assets” chart going back to 2002.
Before 2008 it is very boring (a straight nearly flat line) and I believe enough things changed in 2008 that it may be hard to compare the composition. These two things together presumably are why Wolf doesn’t care to look back at it.
It always rose with “currency in circulation,” (the Federal Reserve Notes in your pocket) a liability, which nearly always rises.
Then two things happened during the financial crisis:
1. QE
2. The Government moved its checking accounts from banks (mainly JPM) to the Federal Reserve Bank of New York (the TGA). The massive deposits of the government in the TGA added additional liabilities to the Fed’s balance sheet (deposits are liabilities for the bank).
This explains the relationship — scroll down to “currency in circulation” and then to “Treasury General Account (TGA)”
https://wolfstreet.com/2023/09/16/feds-balance-sheet-liabilities-rrps-plunge-reserves-rise-after-bank-panic-currency-in-circulation-dips-after-pandemic-spike-tga-gets-refilled/
Why even have the cap on MBS? Surely the market could handle the Fed having a policy of we are no longer buying MBS and when they roll off they roll off…no artificial caps.
When mortgage rates dropped back in 2020-2021, the passthrough principal payments reached $120 billion a month, some months even more, and that’s how much can come off in MBS from the balance sheet when rates drop.
Because MBS affect what people pay in mortgage rates, this whole topic is political, and the Fed seems to be trying to tread a fine line here.
At this point, the cap is just decoration.
But back in 2019, when the Fed was still letting MBS run off and replaced them with Treasuries, the rates had dropped, and there was a surge of refis, and the MBS runoff hit the cap every month.
Any chance the Fed will accelerate the rate of QT? What would have to be true for that to happen?
It doesn’t need to accelerate. It’s quite fast already. But it needs to keep it going on autopilot in the background for years. That’s the plan, and it’s a pretty good plan. QT is coming under heavy attack already. And running it on autopilot in the background gives it a chance to keep going. They’re operating in a financial & political environment that is hostile to QT. Everyone wants their free money back.
1) No.
2) For pigs to quite literally fly over the Eccles building at high noon every day for a year. The Fed barely has the courage to continue the QT that it’s doing now.
I’ll assume you’ll be commenting on this less and less as it starts to fade into the background of new news, until that next liquidity crunch happens.
On another topic, your data that you use, with the rolling three month averages (which I love, thanks). It occurred to me, after the non farms payroll report came out today with a 100k revision of the past two months. what happens to your data? Seems a few more rows to edit, but does it affect the overall shape of the curve?
And on this topic, these data points have huge impacts on the stock markets, which as we all know, is forward looking, but it’s a lot harder to change the past two months entries in the stock market than your spreadsheet.
Just curious to know if people program their trading algo’s to be revision looking
1. I will continue to publish monthly updates on the Fed’s balance sheet as long as there is movement. They get a lot of traffic from my core readers and from Google. If I don’t post them, my inbox blows up with people wanting to know if I’m OK. I have a few series like that. Must-do stuff. That’s one of them.
When at some point the balance sheet stays kind of fixed, then people will lose interest, and I might not write about it every month. Maybe every 3 or 4 months will be enough (with “same old same old” in the title?)
2. All my data is always updated with all revisions. What you see on my site is the revised data going back to Adam and Eve, if I have to. Sometimes I show a chart with revised AND previous data (the infamous red-line-green-line charts).
3. in terms of trading algos, I think there is one guy out there that wrote it, and everyone just copied it.
We’ve seen some recent mortgages crossing the wire at just over 6% when the market rate is 8%. These are government insured VA loans for existing properties. How does anyone get these deals. Who’s paying the difference? The clients are bragging about the great deals they are getting. Someone has to be picking up the tab.
Wolf,
I think that “Fed’s Holdings as % of Treasury’s Debt Held by Public” is potentially a massively useful chart going forward – since it potentially represents the G’s ability to transmute the G’s very large accumulated debt into the citizenry’s accelerating inflation (absent increased tax revenues, the G can only buy the Treasury’s debt by having the Fed print money).
But I’m a bit surprised by the (relatively) small percentages the Fed holds and the timing of some of the ups and downs…so I have some questions/requests.
1) That “publicly held” bit tingles my Spidey Sense. I know there is a big slug of G debt (entitlements related, I believe) that is not “publicly traded/liquid”. I’m pretty sure that “special” large slug is owned by the G (the Fed?) – would that skew upward (badly?) the “Fed Owned” percentages reported on your chart?
Basically, “I’ve got a bad feeling about this…” I think there is a decent chance that the G is much more of a self-inflating balloon than the chart currently represents (Treasury incurs massive deficits, can’t find buyers for all of it, has Fed print money to buy it and thereby manipulate interest rates (while necessarily creating citizen inflation), rinse-cycle-repeat for 50 years…)
But I may be wrong.
2) It might help if accumulated G debt levels and/or 10 yr Treasury rates were laid over that % debt held chart…it would help highlight potential correlations.
In any event, I think that is a pretty useful chart and would like to see more posts involving it.
Thank you.
Your #1. You’re making up stuff. This made-up stuff based on what you don’t know gets tiring and wastes my time. Normally I delete those comments because they’re BS. Look it up before you post!!!
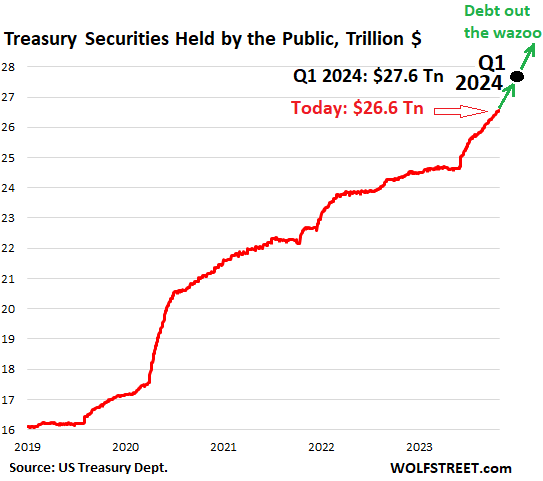
“Held by the public” = marketable Treasuries that are traded in the bond market. That’s well defined, they all have CUSIPs. I hold some of them, the Fed holds some, banks do, pension funds, bond funds, hedge funds (in complex leveraged trades) etc. they all hold them. There are $26.6 trillion of them.
The other type of Treasury securities are those that are not traded and are held by government pension funds and the Social Security Trust fund (“debt held internally” as it’s also called). $7.1 trillion of them.
Both combined make up the US national debt of $33.7 trillion which I discuss frequently here.
Here is my reporting on those nonmarketable Treasury securities in the SS Trust Fund:
https://wolfstreet.com/2023/10/23/social-security-update-trust-fund-income-outgo-and-deficit-in-fiscal-2023/
I have reported on both types for years with charts and all. In terms of the securities held by the public (marketable Treasury securities), which is what the Fed’s percentage is based on, I most recently discussed them here:
https://wolfstreet.com/2023/10/30/marketable-us-treasury-debt-to-explode-by-2-85-trillion-in-10-months-from-end-of-debt-ceiling-to-march-31-2024/
Wolf,
“In terms of the securities held by the public (marketable Treasury securities), **which is what the Fed’s percentage is based on**,”
Okay…so, if I am reading your statement above correctly, then my original suspicion was correct, the 18% “Fed Held” reported on the chart is at least somewhat misleading…because it *ignores* the G held debt that the G chose to make “unmarketable”.
(If you raise the numerator of “G held” by $7 trillion and the denominator of $34 trillion accumulated G debt doesn’t change…then by definition the “% held by G – be it the Fed or whoever – is going to be much higher than the 18% the chart indicates).
If I am missing something, please explain.
The G can play MMT-like word games by saying the chart only represents “Fed Held” (as opposed to the entirety of “G Held” – Fed plus whomever) but from a macroeconomic perspective I don’t think which G actor (Fed, Treasury, SS fund, Entity X) is “officially” holding the G’s own debt matters all that much.
What matters is that the G is largely (“automagically”) holding a big hunk of its own debt.
That is telling and has macro consequences.
RTGDFA. That’s what you’re missing.
This is what the article says, quoted verbatim:
The Fed’s weight in the Treasury market: The Fed now holds 17.7% of marketable Treasury securities held by the public, down from over 24% at the peak. The sharp drop in the percentage is a result of two factors: One, the QT drop in Treasury securities on the Fed’s balance sheet; and two, the ballooning marketable securities issued to fund the gigantic deficit.
In other words, the Fed still plays a big role in the bond market, but that role is rapidly declining in relative terms…
Debt held internally is NOT traded and is NOT in the bond market and makes no difference to the bond market. So, to find out the Fed’s weight in the bond market, looking at the Fed’s holdings as a percent of total debt is an irrelevant metric. To find out the Fed’s weight in the bond market, you have to look at the Fed’s holdings as a percent of the Treasuries that are out there in the market.
The rest of your comment is such BS that I’m not going to respond to it. This fabricated BS is exasperating.
WSJ is pimping for a pivot again. Here’s from the blurb of their jobs report story Friday morning:
“The report could lead Fed officials to extend their pause in rate increases.”
That’s not a pivot. That’s a hold. Pivot is rate cuts.
Not that bad because it’s accurate.. for now. Here in Canada on the CBC or one of our major networks today some economist was brought on to project when the rate cuts will be coming, he was saying his projection was moving from 2024 to 2025, he was also blaming the Ukraine conflict for inflation. I shut the damned thing off and remembered why I don’t pay for cable at home and only watch it at work. If it wasn’t for this site maybe I’d be eating all of that up though
Very nice informative update. The balance sheet is reducing constantly, albeit slowly. There is a very long way to go.
Although the effect will be minor, I think this is the right time for FED to remove all the caps for roll offs declare a solid balance target and explicitly state that they will not stop balance roll off until that target. The Wall Street, realtor associations and the mainstream media are constantly trying to push the FED to start reinflating its balance sheet, or at least replace the rolling of securities. This expectation is hard to eliminate without a solid target.
I think tweaking anything related to QT brings unwanted attention to QT. The first rule of QT is don’t talk about QT.
Two words come to mind when looking at that QE history and that is ‘reckless hubris’’. How on earth are these unelected Central Bankers still in position and in control. When are they going to be held accountable for their incredible social and financial re-engineering of Society causing this boom/bust as well as injustice and wild speculation ?
The FED is held accountable …………….
by their masters. The FED is doing what their want.
If you saw your business tax rate cut from 35% to 21%, your stock and RE portfolio go up 300% in 10 years with zero tax hit, why would you ask such questions?
I believe the short answer is that legislators and the Fed cater to the people who put them in power. Others get a healthy dose of lip service, particularly before voting season.
The Federal Reserve did no such things at all as you assert.
The problem is the energy cost.
One of the world’s biggest shipping firms is to cut 3,500 more jobs due to lower freight rates and demand.
AP Moller-Maersk already cut 6,500 roles earlier this year as part of “rigorous cost containment measures” but said more redundancies were needed.
The firm, which transports goods for major retailers such as Nike, said profits had plunged by 92% in its most recent quarterly results.
Maersk had 95.000 workers in all the world
excellent Wolf! thank you.
It’s a ‘risk off’ day in the markets with Wall St and the uber rich front running the anticipated rate cuts. but maybe, just maybe future cuts, stopping QT, and perhaps even more QE won’t produce the same outcome as before.
it’s just like you say …‘nothing goes to heck in a straight line’. embrace the chaos.
I never understand why WOLF keep saying Fed has unwound all the Printed Money during March 2023 banking crisis.
Since I could not post a chart here. Let’s just look at the chart. Wolf, take the Oct 2022 point, connect Feb 2023 point, and draw a straight line. That’s supposedly the “linear schedule” of UnWinding that Powell has designed to follow. Say this is Linear Target.
IF the extra printed $$ since March Banking crisis has been Completely UnWound, then we should see the Linear Target line completely merge/converge with the current Balance Sheet line.
But no, the Linear Target line is still a few hundreds Billions lower than the current Balance Sheet line. That tells me there are still quite some extra money floating.
Do you follow the simple math here?
RTGDFA. ALL of it.
“WOLF keep saying Fed has unwound all the Printed Money during March 2023 banking crisis.”
Nope. You didn’t read a thing. You didn’t even look at the pictures. AT LEAST LOOK AT THE PICTURES.
What I said: “Bank-panic liquidity pile unwinds” in the Subheading of the section that discusses this. And then there THREE charts, discussing FOUR metrics of that bank liquidity. Some are at $0. Others are not.
In informal english – which you said recently is what we use here – saying something unwinds can mean either it has completed or it’s still in process. To prevent confusion, “bank panic liquidity pile continues to unwind”
“The spike in mortgage rates has caused refis to collapse and home sales to plunge which slowed the mortgage payoffs”
Additionally, anyone with a 3-4% mortgage and extra cash to burn is going to put that cash into 5+% bills/notes/CDs, rather than paying down extra principal on their mortgage.
Fixed income assets accruing interest faster than the average 30 YRFM is another odd phenomenon in this post-ZIRP world.
I might be remembering wrong, but did the previous treasury tentative auction schedule have fewer bond sales in the next month or so? I’m seeing 6 before the end of January now. Maybe it’s ok because they decreased the sizes, but if what you are saying about long rates needing to go up is true, we might not have to wait long to find out.
Seriously potentially dumb question here. If our deficit of 33 trillion and growing are public and government liabilities how can they take treasuries out as it seems like would just need to continue to issue and hopefully find buyers? Perhaps I am equating too much to personal debt where interest payments run out, banks won’t give you money so you are stuck with loan sharks, selling organs or bankruptcy. All of those options not available for government.
Great article. Nothing to dispute.