
The economy did fine with a 10-year yield of 5-8%, including in the 1990s, amid a tight labor market and lots of economic growth.
By Wolf Richter for WOLF STREET.
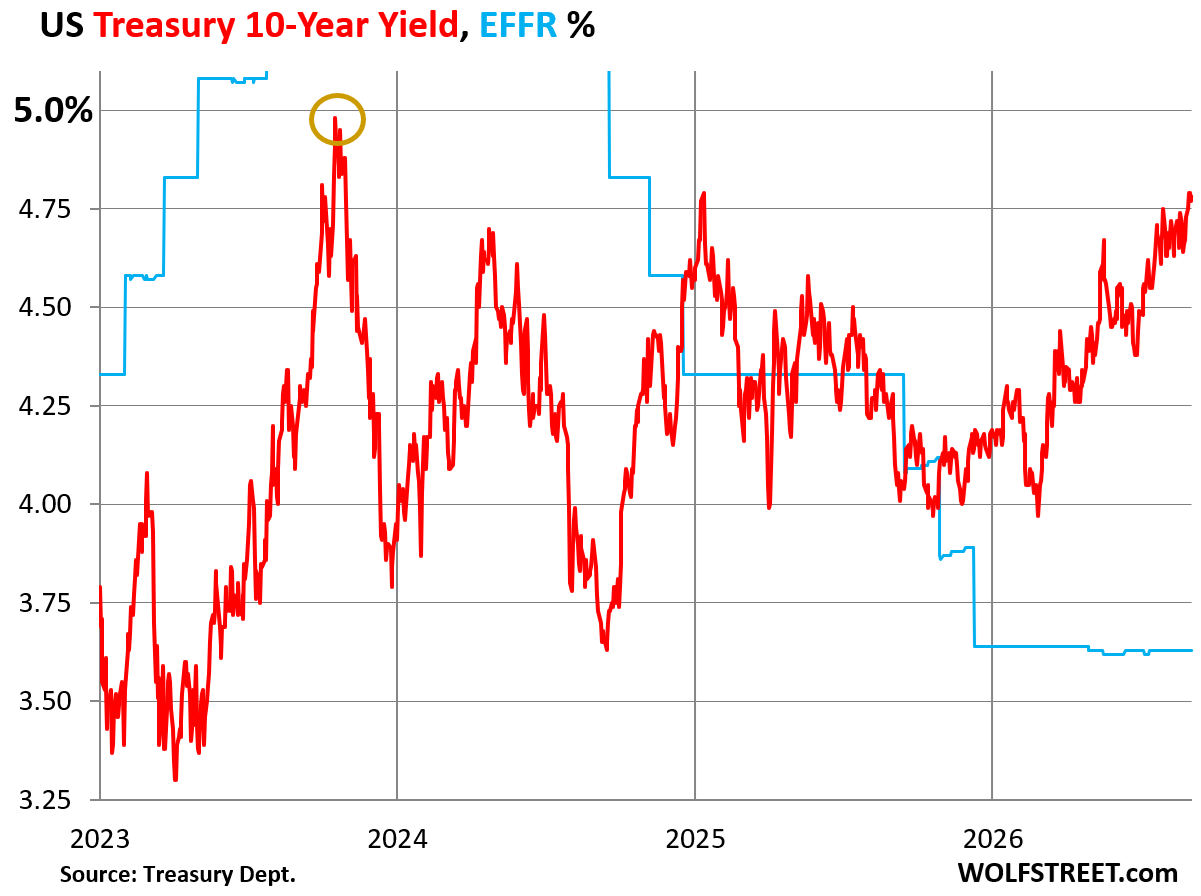
The 10-year Treasury yield has been zigzagging higher since mid-November when the Fed cut its policy rates again despite accelerating inflation. Since that rate cut, followed up by another rate cut in December, the 10-year yield has risen by 80 basis points, heading, apparently inexorably, for the 5%-line.
On Friday, it closed at 4.78%, within spitting distance of 5%, despite Bessent’s three hocus-pocus shows to try to bring it down. Sure, they might have helped keeping a lid on long-term yields, as Bessent pointed out; who knows where the 10-year yield would be by now without the hocus-pocus shows. Maybe already over 5%?
The 10-year yield is now 115 basis points above the Effective Federal Funds Rate (EFFR, blue line), which the Fed targets with its policy rates. Note the November rate cut – the drop in the blue line – despite accelerating inflation. That’s when the zigzag higher began.
Buyers and sellers in the bond market have good reasons for pushing up the 10-year yield: Inflation refuses to go back into the bottle. The Fed refuses to force inflation back into the bottle, triggering loose financial conditions in most areas of the economy, except in real estate. And the government refuses to even entertain a modicum of spending cuts and tax hikes to contain the deficits. It’s been the opposite: tax cuts and spending hikes, and they’re still talking in those terms.
The government’s unwillingness to contain the deficit causes a flood of supply of new debt needed to fund the deficits. The bond market has to absorb that new debt by luring in new buyers with higher yields – investors that are now sitting on the sidelines watching this play out. If yields move high enough, these investors will begin to nibble, and if yields move higher still, these investors will nibble some more, and if yields move a lot higher still, investors might take big bites. Some of those investors have been nibbling, but the supply keeps coming, and so the 10-year yield keeps rising.
Those reasons for pushing the 10-year yield higher aren’t going away anytime soon as neither the Fed nor the government is willing to do what it takes.
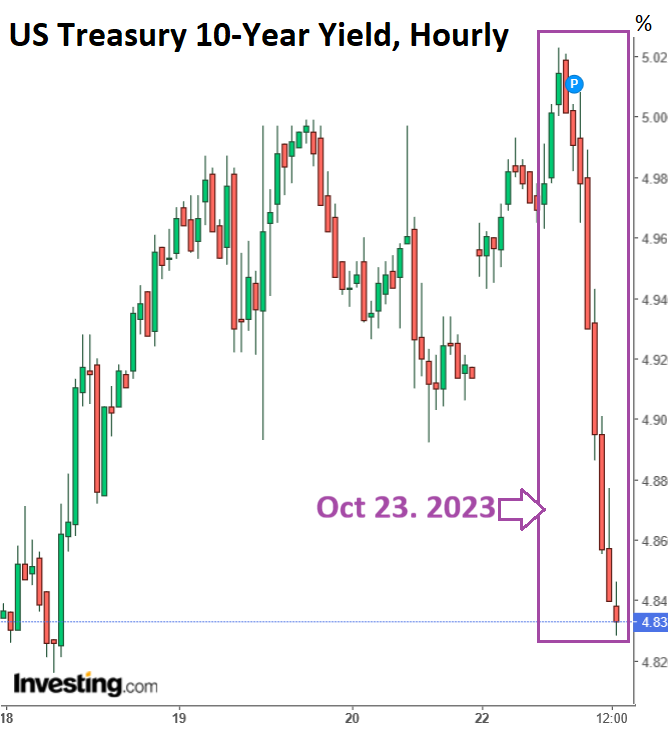
The 10-year yield had already breached the 5%-line for a few moments intraday on October 23, 2023, but that was too fast too soon, after a massive surge of 170 basis points in six months. And at 5%, the nibblers started taking out huge bites, and the sellers stopped selling, with the spectacular effect that the yield plunged by 19 basis points intraday, from 5.02% to 4.83%.
That day is circled in the chart above, showing only the closing yields. The yield then continued to plunge for the next two months, and that’s how that run for 5% ended.
Here is the hourly spectacle on October 23, 2023:
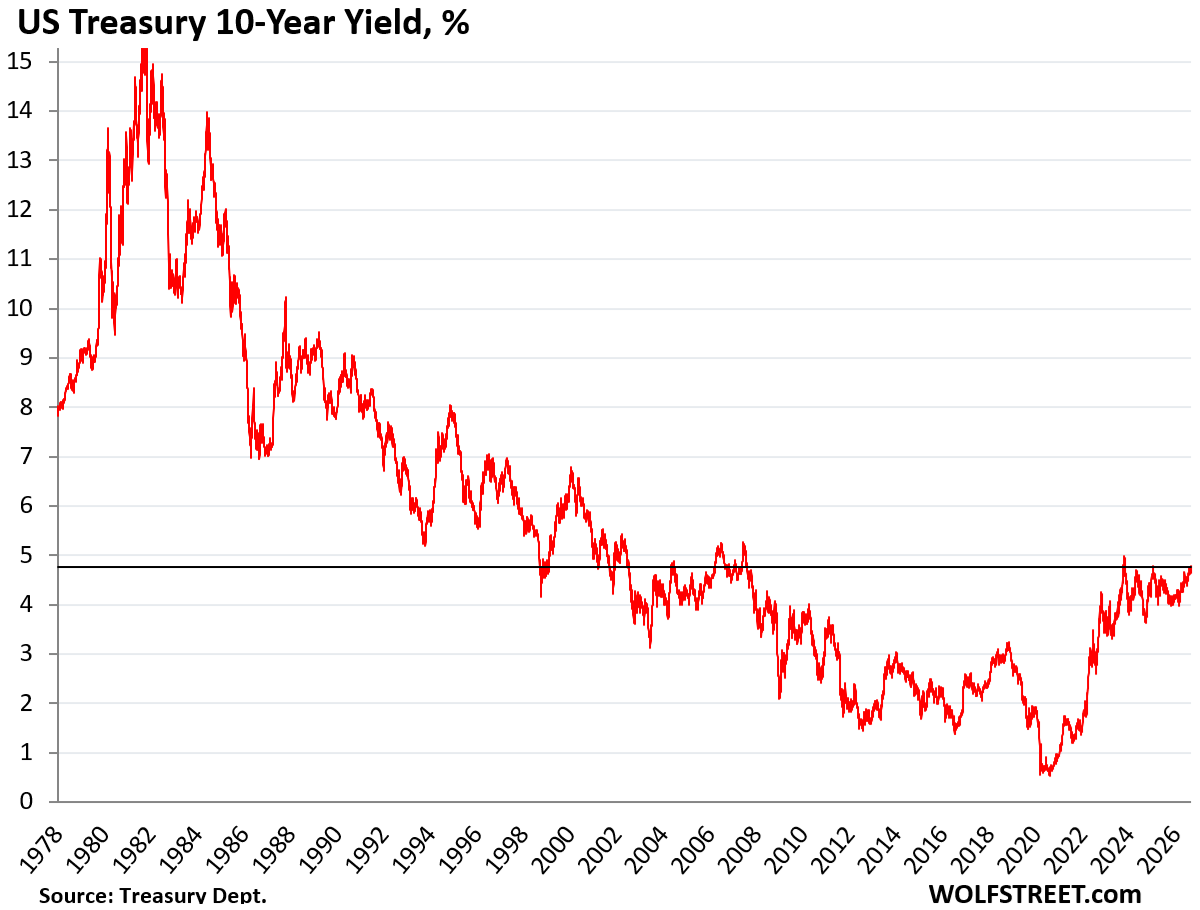
A 10-year Treasury yield above 5% and well-above 5%, was essentially the norm in the decades before 2008, before QE. Between the mid-1960s and the Dotcom Bust recession, the 10-year yield was nearly always higher than 5%, going as high as 15%. So 5% isn’t anything unusual or unheard of. For several decades, it used to be considered low.
The exception occurred during the Dotcom Bust that was hitting the economy, to which the Fed responded by cutting its policy rates as low as 1%, and kept them there too long, causing Housing Bubble 1 to bloom, which ended in the Housing Bust, which triggered the mortgage crisis, which triggered the Financial Crisis. During that time, starting in June 2002 through April 2006, the 10-year yield dropped below 5%, and stayed mostly below 5%, and for part of the time even below 4%. Then it went back over 5% again, when the Housing Bust and the Fed’s reaction to the budding Financial Crisis pushed the yield back below 5%. But it didn’t drop below 4% until the Fed started QE in 2008.
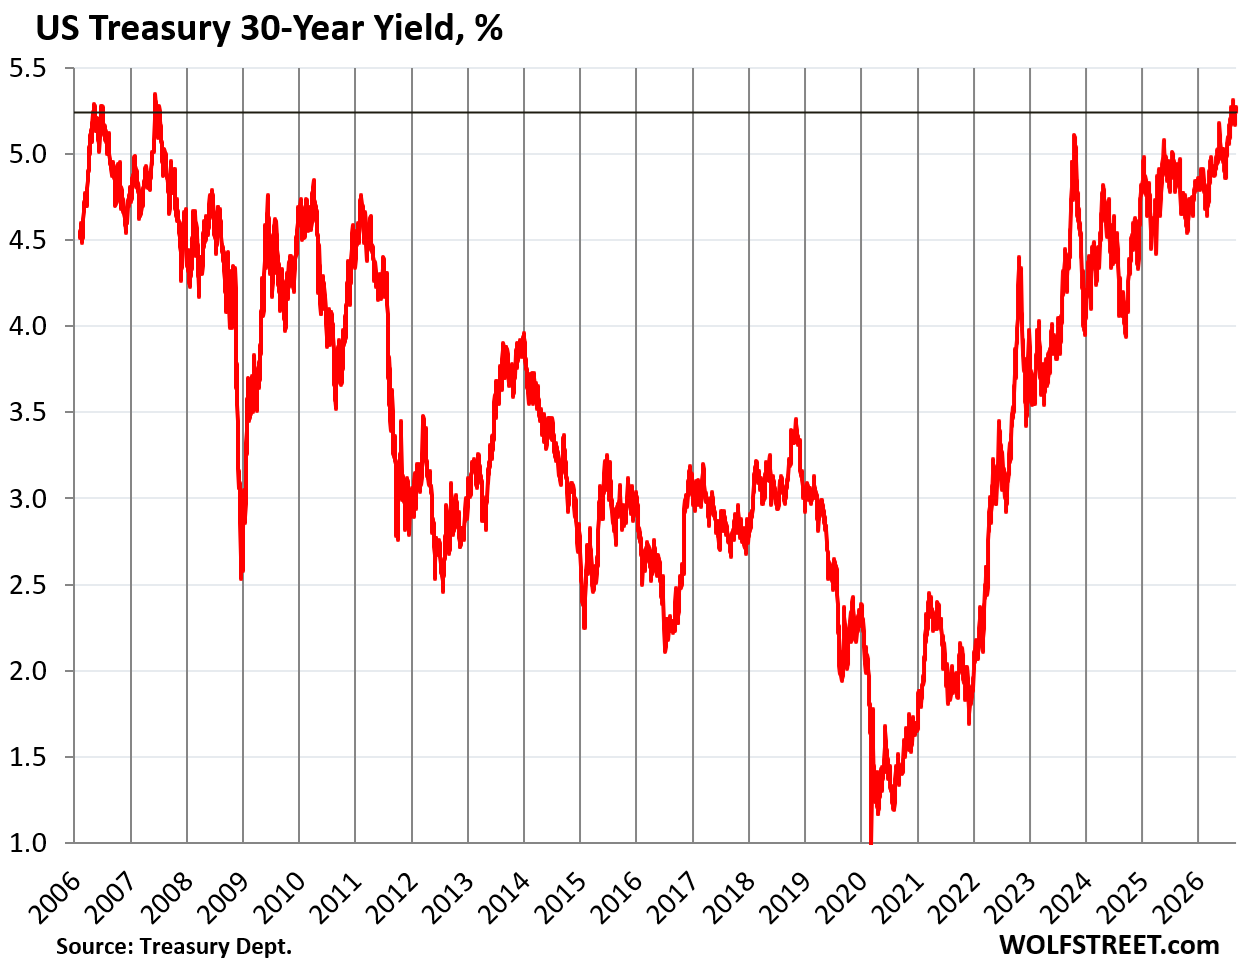
The 30-year Treasury yield hasn’t been so constrained by an imaginary line that formed some kind of ceiling, where the masses come out and buy. It has zigzagged past its October 23, 2023 high, to a two-decade high. On Friday, it closed at 5.24%.
The 10-year Treasury yield looks like it wants to break out – it looks like it already made the first step to breaking out, by leaving behind its two-month range from 4.62% to 4.72%. At some point, sooner or later, given the history of the 10-year yield, the buyers and sellers in the bond market will make another run at 5%.
The big question that arises is this: Will the same thing that happened on October 23, 2023, happen all over again, when huge demand suddenly comes off the fence at that long-awaited 5%, while sellers, shocked and appalled, pull back, thereby causing the yield to plunge again?
Or will the 10-year yield blow through the 5% — with fretting sellers burning through the worried and careful buyers — and head higher, and remain above 5%?
The government’s fiscal policies are asking for it. The Fed’s policies of being soft on inflation are asking for it. The $40 trillion in Treasury debt outstanding is asking for it.
A 10-year yield of 5%+ is obviously not the end of the world. The US economy has done fine with a 5%+ yield, including during the Dotcom Bubble, which generated a very tight labor market, big pay increases, and lots of economic growth despite a 10-year yield mostly in the range between 5-8%.
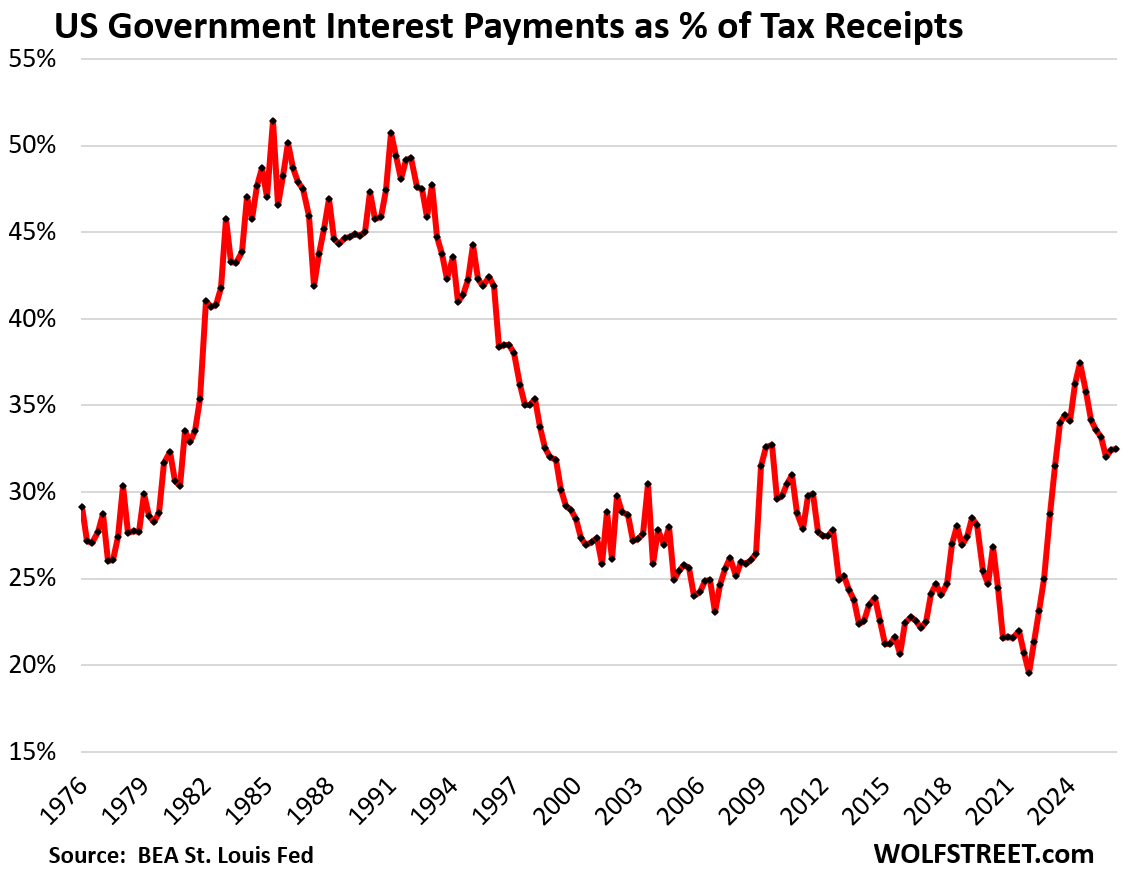
And the ratio of interest payments to tax receipts that are available to pay for them was much higher from the mid-1980s through the mid-1990s (see my analysis: Quarterly Update on the Ugly Fiscal Condition of the US in Q2 2026).
Enjoy reading WOLF STREET and want to support it? You can donate. I appreciate it immensely. Click on the mug to find out how:


The question is whether the flight to liquidity ending causes velocity to turn over faster after the surge in transaction type deposits customers are now holding.
“If the 10‑month ROC is falling after the flight ends, it is a cleaner signal of future GDP deceleration.”
Ergo, rates will eventually fall. The FED won’t raise rates in September. Waller won’t want to be behind the deflationary curve.
our 1st mortgage was 7.87% in 1994 FHA adjustable(saw lower rates coming and most time it was sub 4%)
paid it off couple years ago
have 3.35% 15 now – only debt we have
well other than vig we pay each year called PROPERTY TAXES
just got 13% increase – gonna cost us $3,000
—
real issue today v. 90’s is massive amount of govt debt issued fraudulently
grifters in CONS gress do NOT INTEND ON PAYING IT BACK
This is the 4th week in a row that the FED has TIGHTENED. That’s what has been pushing interest rates up.
Wolf, thanks for the reminder that a five percent yield on the five year is not a death watch for the economy historically. Based on the PE ratio of over 20 for small, mid and large caps one can expect a 5 percent return for stocks over the next ten years. Stocks historically should return double the ten year yield. Why would a reasonable investor buy stock market ETFs now when the return from bonds is the same?
but govt need for more debt will push out actual investments
Presumably the 30Y will go higher if the 10Y does. Any forecasting (or wishcasting) you could offer us Wolf? Do you think the spread between the 10Y and the 30Y will remain constant, or will the longest end of the curve accelerate faster?
Hard to say. The spread is roughly in the middle of its recent range (usually 0-1%). It tends to rise during and after recessions, with recent peaks about a year to a year and a half after the recession is over (in 1993, 2003, and 2010). It was actually negative when inflation was really high in the early 1980s, presumably because everyone believed that the inflation was not going to stay that high forever.
IMHO concerns about the current interest rates are that mortgages at these interest rates and housing prices are unaffordable, and the debt cost at these interest rates is moving toward crippling levels.
The higher interest rates go…the lower housing prices become.
Folks can only afford so much a month.
Now add in an actual decreasing population with the deportations.
I agree with this idea. Families pay a certain amount per month. If rates go up housing prices, since so many are purchased with mortgages, go down. However, the housing market is not very liquid. You have people holding mortgages with pricing at 3% interest rate levels. Now that levels are over 6% those price should only be about 2/3rds as much. But as you pay so little principle in the early years they owe more than the house is worth. They are stuck as they cannot take less as they will owe more than the house will sell for. Inflation and rising wages have eaten into the difference by 30% or so, but there still is a gap. One reason new construction is a larger part of sales than usual versus existing home sales. New construction is slightly smaller, slightly lower levels of amenities etc etc. to get close to what is affordable. In time it will even out to normal if the government doesn’t interfere with that market before that happens.
Prices falling with shake out all the speculation and airbnb get rich quick people. If you bought your house to live in long term, rising rates or falling prices doesn’t impact you.
Also just because a group of people overpaid for something doesn’t mean that prices shouldn’t correct – same as any asset.
When home prices come down and earnings rise, homes become more affordable. The problem is home prices – they exploded between mid-2020 and mid-2022, and that’s the problem.
as did inputs –lumber, copper, steel products
and insurance, property taxes
so there’s floor under ‘lower home values’
and please don’t forget labor has doubled also
Many once hot housing markets have cooped down significantly
Point in case Austin prices down 29 percent from peak
Home builders still have huge margins and prices can still go down a lot
There may be a price floor to new builds. To existing housing, not really.
Look at some consumer goods like clothing and sports equipment. One cost new, often considerable lower at some kind of flea market. And now and then free from the recycling station.
Second hand housing may sell way below the cost of construction.
@Sams
“Look at some consumer goods like clothing and sports equipment. One cost new, often considerable lower at some kind of flea market.”
Neither of those come with land underneath them. And land isn’t disposable.
“Neither of those come with land underneath them. And land isn’t disposable.”
Land = become the local tax mule to milk dry
And high income workers outside of health care are being impacted by ai and offshoring
Understanding the Ascending Triangle Pattern
An ascending triangle is a breakout pattern that forms when the price breaches the upper horizontal trendline with rising volume. It is a bullish formation.
The upper trendline must be horizontal, indicating nearly identical highs, which form a resistance level. The lower trendline is rising diagonally, indicating higher lows as buyers patiently step up their bids.
Buyers eventually lose patience and rush into the security above the resistance price, which triggers more buying as the uptrend resumes. The upper trendline, which was formerly a resistance level, now becomes support.
If one lends any credibility to technical trading patterns, then the 4.8-5% “ceiling” needs to be considered for the ten year bond. One may not lend credibility to technical trading, but I believe many traders do so hedge accordingly.
Wolf makes a great point re: the near immediate “buy” onslaught triggered when the Ten hit 5% last time. To me, it appears the 30yr has broken out although a return to test 5% as support shouldn’t come as a surprise. And it’s certainly possible a financially catastrophic even could send folks into a bond stampede like 2020…but I think we would see inflation spike to the moon at that point.
Fundamentals precede technicals.
Let’s hope for 6% by mid 2027 and rising.
I second that!
The ONLY thing that’s going to get EVERYONE’S attention is higher rates across the entire curve.
That inflation is always that result of excess liquidity like now,
Of course I propose that the correct meaSURE of inflation iS THE INCREASE IN Asset prices
Looks like the 10 year started going up again, when the war started. I am betting that it will drop when it ends finally.
The fiscal policies going back at least 45 years have finally led to this.
There is no artificial (or hocus pocus) constraint mechanism for US Treasury yields to reduce debt payment as a percentage of tax receipts.
It is going to force acceptance of +3.5% annual inflation or there will have to be spending reforms and even slight tax increases.
I’m not sure the economy will grow enough to avoid that.
Does it matter that we never had 40 trillion in debt with higher rates? Or will they ever come back down with this amount of debt?Just curious
how?? Japan selling Treasuries
BRICKS selling TREASURIES
EU bankrupt
ME selling TREASURIES
who’s buying??
I’m not – I demand 15% with 5% vig
No it doesn’t matter. We never had more tax revenues either, and the economy was never bigger than today.
What matters are these two relationships:
1. the ratio of interest payments to tax receipts that are available to pay for the interest payments – see last chart in the article.
Plus:
https://wolfstreet.com/2026/08/27/quarterly-update-on-the-ugly-fiscal-condition-of-the-us-in-q2-2026/
2. the debt in relationship to the economy:
Read this, it explains ALL of it:
https://wolfstreet.com/2026/08/27/quarterly-update-on-the-ugly-fiscal-condition-of-the-us-in-q2-2026/
But debt is much higher now as % of GDP ans the deficits are structurally higher compared to the 1980s. A lot of the US government spending is social welfare. Throw in an overdue recession ans it seems the ratio of interest expense to tax receipts has only one way to go.. and that is up.
You can literally say “we have never had debt of $xx dollars” because debt has literally never dropped in US dollars in all of US history. The reason is that our economy keeps growing, so the impact of past debt shrinks. This is how we have been doing it for 100 years. The best we’ve ever done was to for the debt to stay constant in the 1946-1957 and 1999-2001 periods.
In the borrow short, to lend longer time framework, short-term funding must be constantly rolled over. That’s what produces higher long-term interest rates even if inflation subsides. That’s what is increasing the interest expense on the Federal deficit.
Thus, the plumbing is based on the “arrow of time”. If rates move in the same direction, their ROC mirrors the prior movement that occurred previously in the opposite direction. The 1981 all-time peak in interest rates is documentary proof.
I could probably explain it better. It’s just momentum.
So what’s the explanation in terms of expectations for increasing rates at the long end? What’s the yield curve telling us?
The decision to remove dot plot forward policy looks?
Lenders expecting a bigger premium?
Real yield expectations?
Fears that shifts in global financial architecture will accelerate weakening of the dollar?
What are bond markets telling us?
1990s were defined by low debt, strong foreign demand, and no competition for duration. Today’s macro regime is defined by duration scarcity and issuer competition. There’s a higher debt requiring ever more issuance, hyperscaler debt competition, foreign sovereign debt competition, and decaying yen and basis trades. On top of that there’s a massive and accelerated physical buildout of infrastructure rivaling that of railroads in 19th century. All this creates a mechanical upward pull on interest rates.
Greenspan’s Great Moderation was due to a stable rate-of-change in the transactions’ velocity of money. I.e., the demand for money was stable. So, all Greenspan had to do was follow Friedman’s K percent rule.
Greenspan was no genius.
I was as a corporate financial officer for a blue chip during the 70s and 80s and dealt with the Fed fiasco caused by Arthur Burns and eventually corrected by Volcker.
Higher rates were not necessarily an impediment to growth. We invested to earn our weighted cost of capital. The fed wasnt running around bailing out the speculators on wall street, every bank in town and corporations that had marginal credit.
Yes, they raised rates to high levels. Folks still borrowed, bought houses and prices came down. Today pure capitalism has been wrecked the Fed increasing backstop to wall street and they have no real power on employment.
You dont borrow your way to growth. They have socialized capitalism beyond repair and need to return to their basic function, opening the discount window to only solvent banks and auditing banks the old way.
Too many games and too many economic theories like ZIRP and QE.
AH NO. Volcker created two back-to-back recessions.
Every politician knows all this. As a group, they want more of it, not less.
Alan,
“You dont borrow your way to growth.”
That is a fundamentally ignorant statement…
Growth requires capital. There are only two types of capital: equity capital and debt capital. Both are used to finance growth.
If you were EVER “a corporate financial officer for a blue chip,” you would know that to grow, a company has to invest, such as building another factory and equipping it with costly industrial robots, upgrading a factory’s industrial robots, buying computers and automation equipment (back in your day the 1970s and 1980s that was a HUGE and costly factor), engaging in long and expensive R&D, etc…. all of which require large amounts of capital, which is either equity capital or debt capital. There is no other source of capital. Established companies rely heavily on debt capital to finance growth because issuing new shares to raise equity capital is generally frowned upon for them. Startups generally rely more on equity capital, including during the IPO when they raise lots of additional equity capital.
Great retrospective piece, Wolf. Your 10-year Treasury yield chart book-ends the yield range for the entire previous bond bull market (roughly 40 years).
We now appear to be in year 6 of the next up cycle for rates. If one eye-balls an even longer chart for high quality bond yields (such as is presented by Homer & Sylla in A History of Interest Rates), rising 10-yr rates that grind higher for the next 30-40 years seem perfectly logical. 5-8% is supported by centuries of data.
As rates grind higher expect periods of higher unemployment, unavoidable recessions, and other profit interruptions, with market episodes like 1987 as the consequence.
Of course the holy grail of tactical asset allocation would be the answer to the question of TIMING…
The “arrow of time” is bullish next year.
Stocks and other FCF producing assets are valued using DCF models which typically use the 10 year “risk free” bond rate. And when this rate rises, asset valuations drop. This is the metric that could bust the S&P in bubble territory.
Another excellent article.
The market is reacting to real facts. The FED is attempting to do what it believes is best for the US citizens per its various mandates; and interfering in and with the market.
The best part of the article is the government refusing and government unwillingness. That is talking about failure of Congress.
It is sad that only 50,000 or some number of readers read Wolf and get this information. Wolf’s description of what is going on, the facts, the market reaction should be in and on the mainstream media daily and constantly. Should be being discussed in Congressional hearings daily. It needs to understood by all adult citizens. It needs to be of interest to voters, who then must push their elected Congress to change.
Can we do that? Or are we really just sheep. Are the sheeple getting what we deserve for our apathy.?
I am interested in how we as a society and country can change the core causation and facts that Wolf lays out so clearly.
Amen.
And it isn’t just the Market reacting to real facts. People are starting to wake up more these days.
Crazy times full of misinformation and agendas.
regarding: “I am interested in how we as a society and country can change the core causation and facts that Wolf lays out so clearly.”
“Andrew Jackson, the seventh President of the U.S. (1829–1837), in his 1832 bank veto, said that “when the laws undertake… to make the rich richer and the potent more powerful, the humble members of society… have a right to complain of the injustice to their Government.”
And vote.
Countrybanker,
Just curious. Are you an owner or a W2 employee of a country bank? From the tone of your comments, I’d lean towards you being an owner.
Denial is rampant these days.
In my simplistic understanding, the growth and inflation go hand in hand tough not always at the same rate. Sometimes economy grows faster than inflation. And sometime inflation grows faster than economy. It is very difficult to have a lot of growth and not even a little of inflation.
So, based on the above premise, do you think the Fed/Treasury/Exec is looking forward to a situation where the US economy is growing even though inflation is also high.
Do you believe, in other words, fighting inflation at all costs is no longer the motto?
There are some crucial concepts here:
In terms of “running the economy hot,” the measures we look at are:
– the inflation rate
– economic growth not adjusted for inflation (“nominal GDP”)
– debt & deficits not adjusted for inflation.
Q2 nominal GDP growth (so not adjusted for inflation) was 8.0% annualized. That is the figure to use for debt to GDP ratio and deficit to GDP ratio. There was 6.4% overall inflation in Q2 annualized — in the entire economy, not just consumers, but inflation that businesses, consumers, and governments experience. So GDP adjusted for inflation grew by 1.6% (= 8.0% nominal GDP growth minus overall inflation of 6.4%).
This is why they’re letting is run hot. With 8% nominal GDP growth, the economy and tax receipts grow faster than the debt and the deficit, and the burden of the debt eases over time.
Sure . . . until it doesn’t. That’s the question on everyone’s mind.
When does the next recession land.
Many of us have been waiting for two years.
I’m not saying it’s around the corner.
AI capex & what’s likely to be $2.25T for the 2026 FY deficit go a LONG WAY towards holding back the big bad recession boogeyman.
There won’t be a recession until the stock market has already tanked in a big way, not -20%, that’s nada, but something like -30% to -40% with highflying tech stocks collapsing by a lot more, and with the AI investment bubbles deflating, and many companies on their way to vanishing and their stocks going to zero. That sort of thing triggered a mild recession 1.5 years into the 2.5-year Dotcom Bust (Dotcom Bust ended with the S&P 500 at -50% and the Nasdaq -78%, the recession started two-thirds into that). If this happens again, it’ll trigger a recession again. Where else do you think that next recession is going to come from?
Eric Basmajian Aug 26
Corporate profits reached 12.1% of GDP in Q2.
The highest level ever.
“The share of economic growth captured by labor in the form of compensation like wages fell to a record low last quarter, hitting 52.8%, according to the Bureau of Labor Statistics, which began recording the statistic in 1947.”
The workers need a share of the profits.
spencer
The division is share of profits from investment v labor. Investment = automation, including the internet that made massive amounts of automation possible. Automation replaced unskilled or low-skilled labor at first; and then more skilled labor. And over time people have to upgrade what they know how to do to where they cannot be replaced by automation. That has been happening so far every time a new technology came along. The jury is still out if the same process takes place with AI.
Automation is hugely expensive. Lots of money was invested in automation of all kinds, including self-driving vehicles. So yes, the Waymos reduce profits sent to drivers, but they also represent many billions of dollars of investment that will need to produce a profit in the future. At the same time, the people that develop the Waymos got paid vastly more than they would have gotten paid as Uber drivers.
That’s all well and good but with a $2T deficit (5% of $40T) how does this “burden of the debt eases over time” work exactly?
Read my articles about it. I’m not rewriting my articles in the comments.
If the stock market breaks down for what ever reason, rates would come crashing down with it. The world always flocks to treasuries when the pressure is on. That’s because they return of capital, rather than return on capital.
That did not happen in 2022. Stocks and bonds tanked, meaning stock prices plunged while yields spiked. I know market memory is short, but it shouldn’t be that short.
Thing is, for many the “market memory” is that the 2022 decline was only “transitory”, and just confirmed that one should always “buy the dips”, ‘cuz there’s absolutely no risk in stocks. Any 20%decline will soon be erased and replaced with 20% gains, year after year forever.
15 years of perpetual bailouts will do that.
“The world always flocks to treasuries when the pressure is on.”
This isn’t a law of physics you know.
Wolf, above in the comments, you answered this to a question about the U.S debt and interest payments – “ No it doesn’t matter. We never had more tax revenues either, and the economy was never bigger than today.”
Debt levels don’t matter? Is that why Don was DEMANDING that the Fed lower interest rates a few days ago? Interest is now the number two expense after Social Security. I have come to this no-brainer conclusion – the U.S. is way past the point of being a failed state, but because of certain factors, including hocus-pocus, we haven’t had our crash and burn moment YET.
OK, you asked me to get blunt, so I’ll be blunt as per your request. Fretting about the debt level in a vacuum is stupid, and drawing conclusions from the debt level in a vacuum is even stupider. Fret about the debt in light of tax receipts and GDP. And I gave you those charts and figures.
“the U.S. is way past the point of being a failed state” is a stupid comment too. You have no freaking idea what a failed state is.
Imagine if we hit a recession at any point… ooph
I’m sure they’ll suggest yet more tax cuts to compensate. We can always just print money, right?
One more complexity to add to the upward trajectory of the 10-year yield is that over the period of 2020-2025, all three credit rating agencies downgraded the US debt from AAA to AA. Developed countries with AAA ratings generally pay 1% lower 10 year rates than those with AA. Using that correlation, if the US was still AAA, the 10-year would be 4% now.
How would the US be anywhere near AAA or AA or A in credit rating when the federal government owes more than $40 trillion and is adding to that at over $2 trillion per year?
Nobody listens to the rating agencies after the GFC. The ratings were overly optimistic and politically motivated.
“Nobody listens to the rating agencies after the GFC.”
Yet all the rating agencies survived and are still in business, apparently continuing to collect steady fees for their work.
Can both statements be true at the same time?
My opinion is that a large Operation twist from the Fed is coming. Short term treasuries will be exchanged for longer duration treasuries. This will put pressure on the long end and result in lower interest rates there. The consumer will benefit because much of their debt is tied to longer duration treasuries.
Warsh wants to shrink the Fed balance sheet. Doing operation twist will not effect the balance sheet total, only duration. He is pragmatic. Bessents hocus pocus was a trial balloon to see what direction rates would go. Hypothesis testing with verification,albeit short lived because a 2-4billion dollar exchange is minuscule compared to the debt.
Weakness somewhere in the economy will likely be the precipitant for the operation.
Biggest downside I can see is Fed once again removing market signal. I’m sure other downside exists and defer to Wolf and this very bright group of commenters to bring balance to my view.
You’ve got this completely ass-backwards. The Fed has ALREADY been doing “REVERSE operation twist” since last December, replacing long-term MBS (15-year and 30-year) with short-term T-bills at a rate of $15-$18 billion a month. It has discussed expanding this REVERSE operation twist to Treasury securities, replacing longer-term notes and bonds with T-bills. Warsh’s task force on the balance sheet will come up with specific recommendation on it later this year. The Fed wants to return to a balance sheet with a much shorter duration, which was the classic balance sheet before QE.
I am thinking of buying 10 ust if it hits 5.2%,
Everyone thoughts? Yes or no?
Perhaps waiting for it to top 25% yield might be more prudent.
I wish there was a way to make an overlay of the Fed balance sheet line chart (to see the effects of QE) with the US tax receipts with proportional interest payments chart? The correlation between the US tax receipts percentage gaining from 2009 onwards almost seems to mirror the percentage balance sheet gain through QE?
If you add up all the years of tax revenues, it seems to closely mirror the $7+ trillion in QE add-ons from 2009’s $800 billion onward, though the nominal dollar tax revenues are more muted than the actual nominal QE amounts.
Since further QE is not an option without public inflation uproar, that’s not a good portent for the tax receipts-to-interest payment ratio for the future, especially with 10-30Y rates rising as they are.
Maybe I’m misinformed about something, but that’s the pattern standing out the most to me here. Cutting out QE and letting long end rates run hotter seems guaranteed to severely squeeze the tax revenue/interest ratio.
Interesting. In other words, QE raised asset prices and capital gains taxes. Asset prices remain artificially elevated from past QE and perhaps expectations of future QE as an asset price backstop.
Oh, I understand much of what I said would be obvious to many familiar with the QE topic.
I probably should have homed into my point a bit more, explaining that without any more QE there will be a ‘double pincer squeeze’ on the tax revenues-to-interest paid ratio (both from higher long-end rates and lower capital gains tax collection). I just figured overlaying a Fed balance sheet chart on the tax revenues/interest payment chart would illustrate my point in that case.
I should clarify further by adding ‘without further QE and assuming fiscal spend and tax policy remains unchanged’. (Note: I’m not in favor of QE at all)
The United States had the world’s largest total household net worth in 2025, at $175 trillion.
China ranked second at $75 trillion, less than half the U.S. total.
The U.S. has more wealth than China, Germany, Japan, France, and the United Kingdom combined. Lots of options to pay down the $40 trillion debt, starts with renewing the old tax cuts and getting spending back under control in Congress. Loyal Americans should be asked to contribute a extra $3000 to $5000 to pay the debt down sooner,
Wolf will be happy to know or maybe not, ZeroHedge has cut and pasted this article.
I gave ZeroHedge the permission to post my articles back in 2012 and that continues. I used to post my articles there myself (they have or at least had a login for approved posters), and quite a few readers back then discovered my stuff on ZH.
ZH used to generate some very good stuff, including arcane incredibly good stuff no one was discussing or reading, amid the garbage. But now most of the good stuff that they themselves generate seems to have been moved behind their paywall. But their third-party posts are still public. I totally get why they went for a paywall, it’s a matter of survival in publishing, and kudos that they could pull it off.
If MSM wasn’t 100% propaganda, sites like wolfstreet & zerohedge wouldn’t exist.
I am perennially perplexed to see MSM & entertainment companies deliberately destroy their own industry & companies.
Comcast, AT&T, & Disney have picked corporate self immolation.
Once apon a time I read WSJ, THE New York times newspaper & watched CNBC. I wince in pain when I think of it.
Now it’s YouTube, Rumble, zerohedge, wolfstreet, & substack.
Times have changed.
I would like to give a huge thank you to Wolf for not letting politics wreck his web site.
I have been thinking a lot about the Social Security trust fund, which is now forecast to run out in 2029. This is supposed to result in about a 23% shortfall of revinue that SS can pay out.
If I understand correctly the SS trust fund holds special, government only bonds. I assume these are being paid by the treasury by (mostly) selling new regular bonds to pay back the trust fund.
I also assume that retirees won’t actually see a 23% reduction in benefits due to the political ramifications.
My question is since the extra benefits from spending down the SS trust fund are already being paid by the treasury, will the SS trust fund running out actually cause a change to the Treasury’s borrowing needs?
The Treasury debt is divided into two parts, the publicly traded debt ($32 trillion) and the part that is held in the SS Trust Fund, government pension funds, the Medicare Trust Fund, etc. (“intragovernmental holdings” = $8 trillion). As SS redeems the securities in its Trust Fund (gets cash from the Treasury for those securities), the Treasury has to borrow these funds from the public, and that part of the debt moves from “intragovernmental holdings” to publicly traded debt. So the $32 trillion increases by that amount and the $8 trillion decreases by that amount, and the total debt doesn’t change.
I’m pretty sure that one minute before midnight, Congress will come together and fix SS in a bipartisan manner, just like they did last time under Reagan. Then the funding for the SS outflow plus some would come from the SS system. But if they don’t, and Congress decides to fill in the 23% gap, then that portion would be added to the debt “held by the public,” without reduction of the “intergovernmental holdings,” which would make the total debt increase for the first time.
23% gap is insanity. Then to fix it is a debt add on? Nuts.
In 1997 Canada had a big shortfall in CPP (Canada pension plan)
Copy:
Prior to the reforms, the combined employer-employee contribution rate was just 5.85%. Actuaries warned that if left unchanged, the fund would completely run out of money by 2015, eventually requiring skyrocketing contribution rates of over 14% to support retiring Baby Boomers.
To fix this, the government aggressively accelerated contribution rate increases over a short period.By 2003, the combined rate reached a steady-state of 9.9%.This deliberate “over-contribution” strategy immediately began generating massive cash-flow surpluses, allowing the plan to accumulate capital rather than spending every dollar as it came in.
and:
Strict Autonomy: To protect the fund from political interference, the CPPIB was set up as an independent, arm’s-length crown corporation.
Constitutional Protection: Strong legal safeguards were written into law, requiring the consent of the federal government plus two-thirds of the provinces representing two-thirds of the population to change its structure. This threshold is famously even more stringent than the formula required to amend the Canadian Constitution
Now there is a big surplus in retirement fund, plus contributions increased to allow bigger benefits in adjusted dollars going forward. With no premium for full health insurance coverage, plus pharmacare (meds paid for) and dental coverage for low incomers, it is possible for people to get by quite well with just CPP and OAP for retirement.
average CPP payout at age 65 is $878 per month, up to $1508 per month
with OAP at 65 (universal old age pension) at $752.00 tacked on to this.
Average total is approx $1600 per person to $2200 per person with above coverages.
Then with a tax deductible RRSP built up along the way in work life couples can do quite well retired without a massive employer funded pension.
The difference between the two countries is political will and professional management. The parliamentary system forces compromise and bipartisan efforts or a party will face political extinction. Actuaries made the recommendations and all parties signed on allowing a hands-off pension plan.
Plus….union participation is about 31% overall in Canada. This forces non union employers to match benefits or lose employees. They do.
you cite average benefits in Canadian dollars. So the average total of C$1,600 = US$1,158… very meager.
Average SS payout was US$ 2,083 (in May 2026), nearly double the amount in Canada. The payout is capped at just over US$5,000. The longer you wait before drawing it (up to 70), the more you get when you start drawing it.
The CPP is primarily invested in illiquid “alternative” assets, such as Private Equity funds, private credit funds, commercial real estate, etc. About half of its assets are these illiquid alternative assets. It’s also invested in stocks and bonds. Watch what happens to its overfunding, when PE and private credit crater by 50% or more, and stocks plunge. The CCP has taken a lot of risks, and it worked (in part because these alternative assets are not traded, and the book value is whatever sky-high number the firm says it is), which is THE huge issue with PE and private credit right now. Taking risks is, well, risky. Meaning they can lose their shirts. What’s going to happen then to payouts?
“If this happens again, it’ll trigger a recession again. Where else do you think that next recession is going to come from?”
A dotcom 2.0 via AI isn’t the only nexus for a recession.
To start, private credit has great opportunity to be part of the nexus to a recession.
Potential 50-75 bp fed hikes over the next 12 months to quell inflation would be a good start.
If somehow the AI build out threads the needle & doesn’t get brought down by massive debt, data center backlash, rogue cyber-attack, then the inflation genie isn’t going back into the bottle anytime soon. This data center build will last at least 3-5 more years, followed by many more years of energy build out.
Political & Social Unrest: If the Dems take Congress, they’ll do everything they can to impeach Trump and will certainly hogtie his agenda. They’ll start passing all sorts of crazy bills that he’ll have to veto. And this could be backed up by increased social unrest. We may very finally be proven true that 2026 & 2028 are the most consequential elections in my GenX lifetime.
AGI will be here in full form by the end of 2027. That’s going to be a major problem for all sorts of jobs.
And again, I’m not saying the next recession is just around the corner as in the next 6-12 months. All of these AI companies & Congress may very well thread the needle. But that’s not where I’ll be placing my bet.
The next financial crash: AI debt could spark chain reaction…
Does the “Tax Receipts” component (of the Interest as % of Tax Receipts) include tariff revenue?
Read the article that I linked just above the chart. It does NOT bite. And it includes a chart of the revenues from tariffs (clue: the refunds).
It’s an interesting guessing game.
Any single article Wolf puts out isn’t an answer. Collectivity, however, he breaks a very complicated problem space down – presenting status quo and trends for multiple macro, corporate and individual metrics (leading and trailing). Piecing together causal analysis let alone indicator of cycle (credit, business) changes is a hard intellectual process to engage in – especially when it comes to interpreting expectations signals.
Presently, inflation is increasing but mild compared to 2020-2024; GDP growth is accelerating; credit spreads are all tight (with both high yield and investment grade yields tight); corporate balance sheets are not indicating significantly increased default rates and do indicate high cash balances (on average); where policy (e.g., countercyclical buffer requirements, dynamic provisioning) is in all of this I don’t know.
Here’s what my listening “antenna” are detecting from financial articles, the services I actually pay to keep me informed, youtube financial videos (there are some good ones though still has to work to avoid confirmation bias) and most especially conversations with friends who cover the whole spectrum of wealth, income and success.
1. It ‘s obvious Federal spending has been out of control for decades. The clear metric for this is Federal debt with increasing attention focusing on sustainability (ability to service and refi). There is emerging sentiment that the quiver of tools for addressing this has been reduced to a point where only inflation can stave off the inevitable devaluation. Nixon’s 1971 decision to decouple set a country with animal appetites on a long-term fiat driven path to currency collapse (petrodollar notwithstanding) as well immense concentration of wealth at the upper strata.
2. It’s clear (to most) that monetary policy has not served the country well. That outlook is highly politicized for many so “to most” does vary.
3. Total credit (debt) globally is increasing – there are more linkages in this than meet the eye.
4. Gov’t polices ratchet all over the map with each succeeding administration; reflecting deeper fissures in society at large. Doesn’t bode well for the time when the proverbial feces hits the fan.
5. Technical innovation is on the rise offering a bridge.
6. The Global Financial system is moving into post-Bretton Woods uncertainties.
7. The banking system and many financial institutions (e.g., big enterprises like JP Morgan or exchanges such as LMEX) are not trustworthy. Value judgment, I know. Just noting what the range of folks I converse with are thinking.
The biggest takeaway for me is the growing sentiment that a major reset in the dollar is on the horizon in the next four or five years. Life will go on after that event – but playing that change correctly is now a significant challenge. I’m in the process of figuring our how I am going to change my asset portfolios in anticipation of a reset.
Arrgh…collectively
So? if you haven’t prepared yet you are screwed for sure.IDK but I do not like this environment
It’s been building for 50+ years!
As for prep’ing. Each person has to decide that risk calculation. I feel like I’m arriving late to the vision but at least have a chance for some combined offensive and defensive moves. Best case a dollar collapse doesn’t happen.
Let’s face it, the deck is stacked against most of us. Doesn’t mean we quit the race.
Rising rates present a “Catch 22” situation. An upturn in the economy will add increased private demand for loan-funds, to the insatiable demands of Federal, State, & Local Governments. The consequent rise in interest rates will effectively abort any sustainable growth.
I like how Wolf pointed out the parallels with the fall of 2023. Inflation and interest rates at that time were very close to where they are today.
A key difference, in my opinion, is the yield curve. In October 2023, the 10y/3m yield curve was around -0.7%. Today, it is +0.86% with a rising trend. IIRC, there were several other traditional recession warnings going off at that time, a stock market correction had just occurred, and many banks were being propped up by a government lending window.
In other words, the nibblers who decided to buy treasuries en masse when they hit 5% in October 2023 (1) had reason to believe a recession was imminent, and (2) had reason to believe rate cuts were imminent.
The recession never materialized, and rate cuts didn’t come until 11 months later, but the point is that market participants thought both things were on the cusp of happening.
This time, there are no real signs of recession to worry about. We’re at full employment, with loose financial conditions, manageable debt to income levels, with solid durable goods and manufacturing orders, with expanding government deficits, expanding money supply, and a federal funds rate that is close to the 6 month average CPI, and therefore not restrictive.
So there might not be the same incentive for the nibblers to draw the line at 5% and back up the truck to buy treasuries this time. If there is no recession looming, and the Fed is going to let the economy run hot, then now is not the time to play defensive. If that’s the way things are going, why not hold out for a 6% yield, and give yourself a 20% raise!?
It seems very reasonable for UST rates to move higher based upon the deteriorating US credit and the massive increase in supply. 5.25% looks like a reasonable near-term target for the 10-yr. Not sure how fast it will get there, and there will be some likely backing and filling along the way, perhaps by year end or Q1 2027?
Way back in 2006, I did some research on corporate bond rates and spreads to the 10-yr while working in San Fran. As I recall, the 40 year average rate for the 10-yr was 6.70% back then. Of course, this was before the Fed lost its mind during Covid.
You write about the ten year yield as if it exists in a vacuum. Overlay the ten year yield with the oil price. If Iran wants to keep nuking refineries and China keeps buys oil then I expect the ten year to go over 6% as oil goes over 150.
Iran and China will derail the repblicans during the midterms. In the long run it’s much easier than dealing with Trump.