
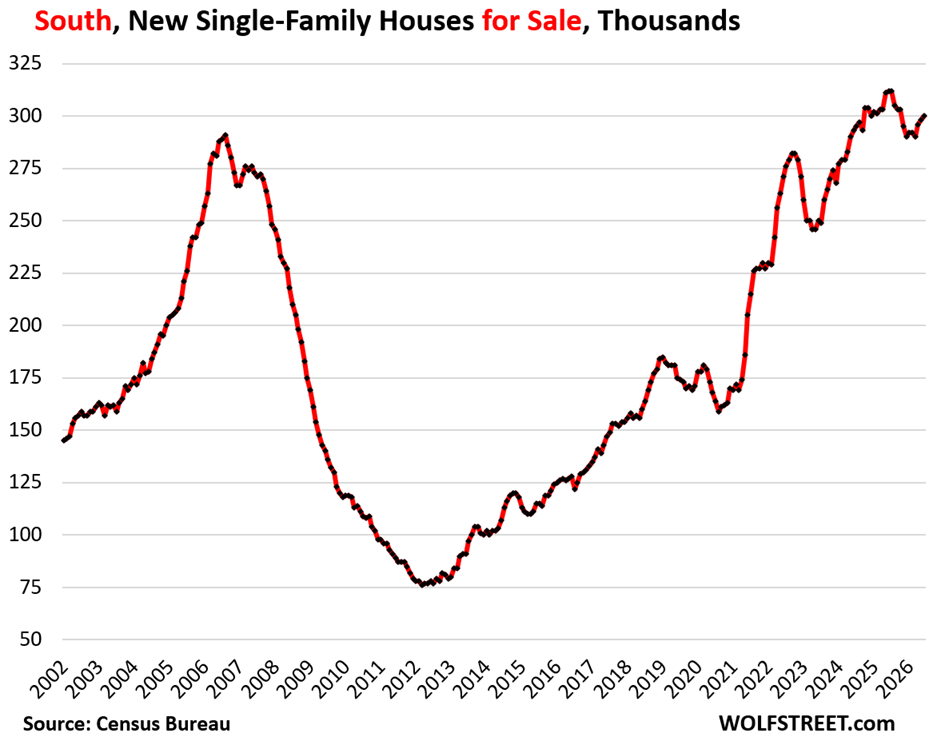
In the South, inventory for sale was up 71% from 2019, while sales were down 8%. Homebuilders are very motivated to make deals.
By Wolf Richter for WOLF STREET.
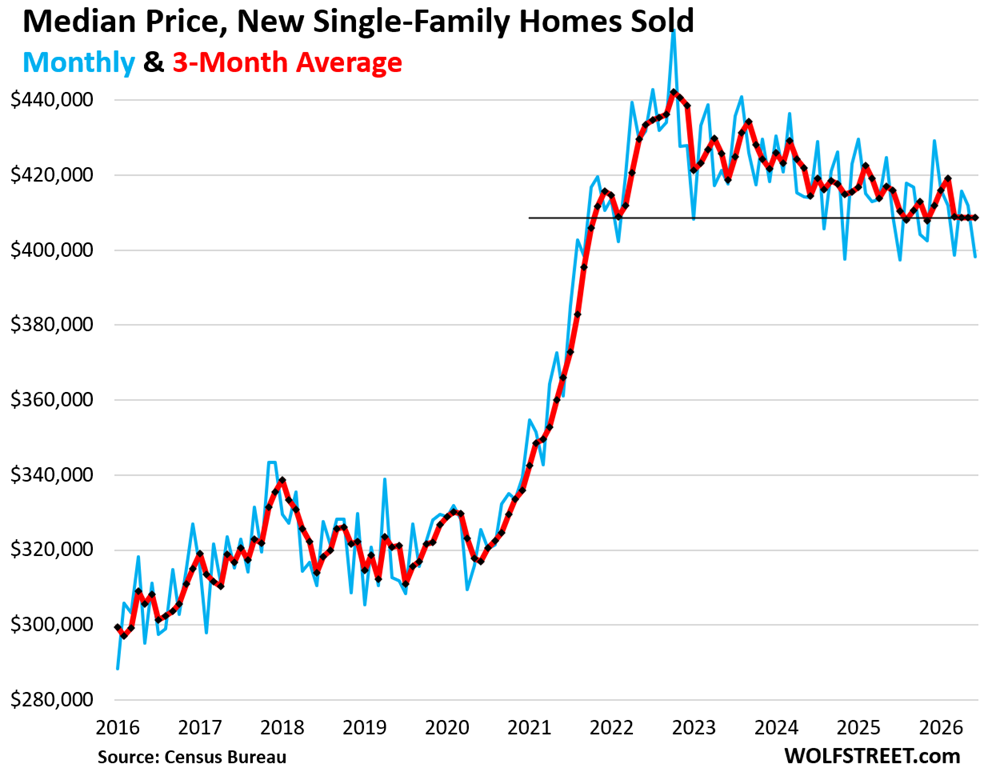
The median price of new single-family homes sold by homebuilders in June dropped by 2.7% year-over-year and by 3.8% from two years ago, and by 13.5% from the peak in October 2022, to $398,300 (blue in the chart), according to data from the Census Bureau today.
But this median price reflects prices in sales contracts and does not include the incentives and the substantial costs of mortgage-rate buydowns that homebuilders use to increase their sales. Homebuilders include the costs of incentives and mortgage-rate buydowns in their average selling prices that they report in their financial statements. But they’re not reflected here in the data from the Census Bureau.
The three-month average median price, which irons out some of the month-to-month squiggles, fell by 1.7% year-over-year and by 6.7% from two years ago, to $408,800, where it had first been in October 2021 (red).
Homebuilders are in the business of building and selling homes, no matter what mortgage rates do, and no matter how tough the market may be. They strive to protect or gain market share, and in this market, they have reduced prices, piled on incentives, and bought down mortgage rates to boost their sales, or to keep them from plunging, and it has reduced their gross margins, net profits, and share prices.
Since mid-September 2024, the stocks of the biggest homebuilders have dropped in a range between -23% (D.R. Horton) at one end, and -51% (Lennar) at the other end. Lennar has been aggressive in its pricing, giving up a big portion of its gross margin but gaining substantial market share. Pulte Group is the exception; its stock is down only about 3% since mid-September 2024. Taylor Morrison has been acquired by Berkshire Hathaway this year.
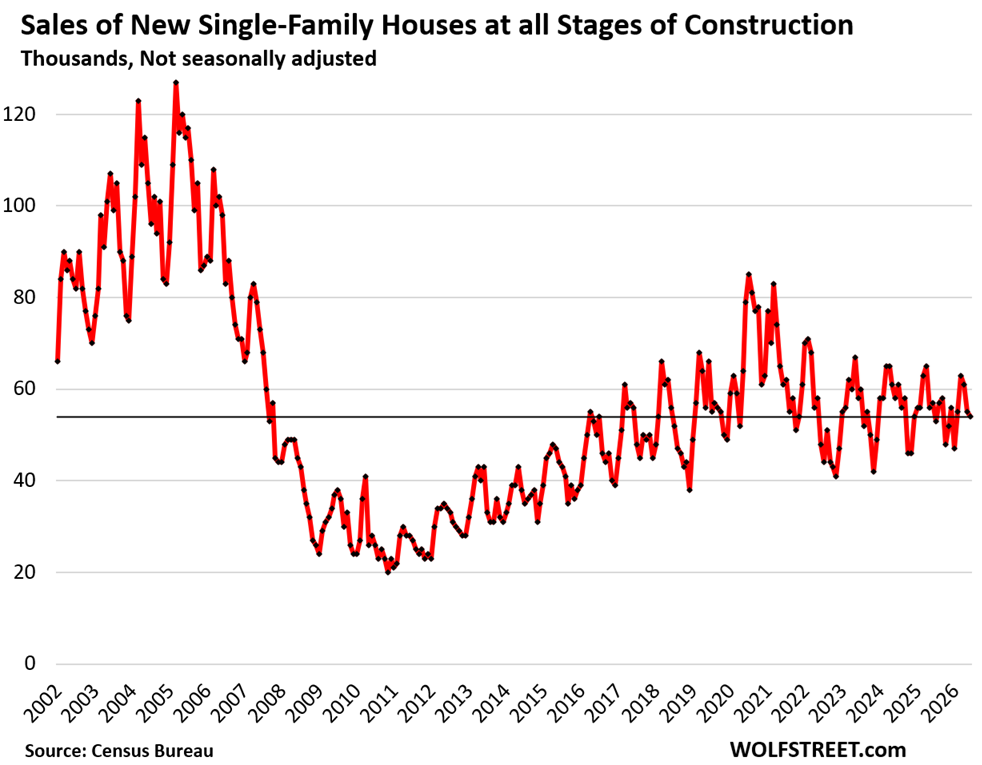
Sales of new single-family homes at all stages of construction fell by 5.3% year-over-year in June, to 54,000 homes, the third month in a row of year-over-year declines. Compared to June 2019, sales were down by 18%.
Of those total sales, 67% occurred in the South and 21% in the West (88% combined). The remaining 12% of the sales occurred in the Northeast and Midwest combined.
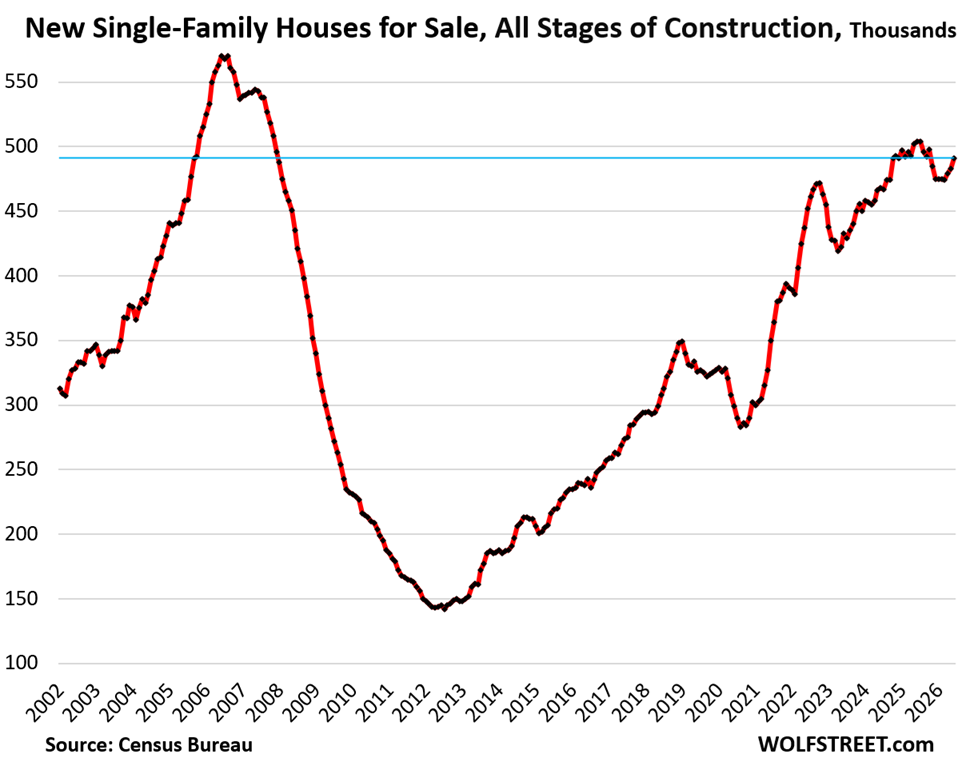
Inventory of single-family homes at all stages of construction rose to 491,000, the third month in a row of increases – tracking the three-month surge in mortgage rates, and the three-month decline in sales.
Regionally, 61% of this inventory is in the South (where 67% of the sales took place), 21% in the West (where 21% of the sales took place), and 18% of it is in the Midwest and Northeast (where 12% of the sales took place).
This is a very large inventory for sale, amounting to 9.3 months of supply at the current rate of sales. But new supply — new additions to the US housing stock — is precisely what the housing market needs the most, and homebuilders are building it. Now they just need more people to buy those homes.
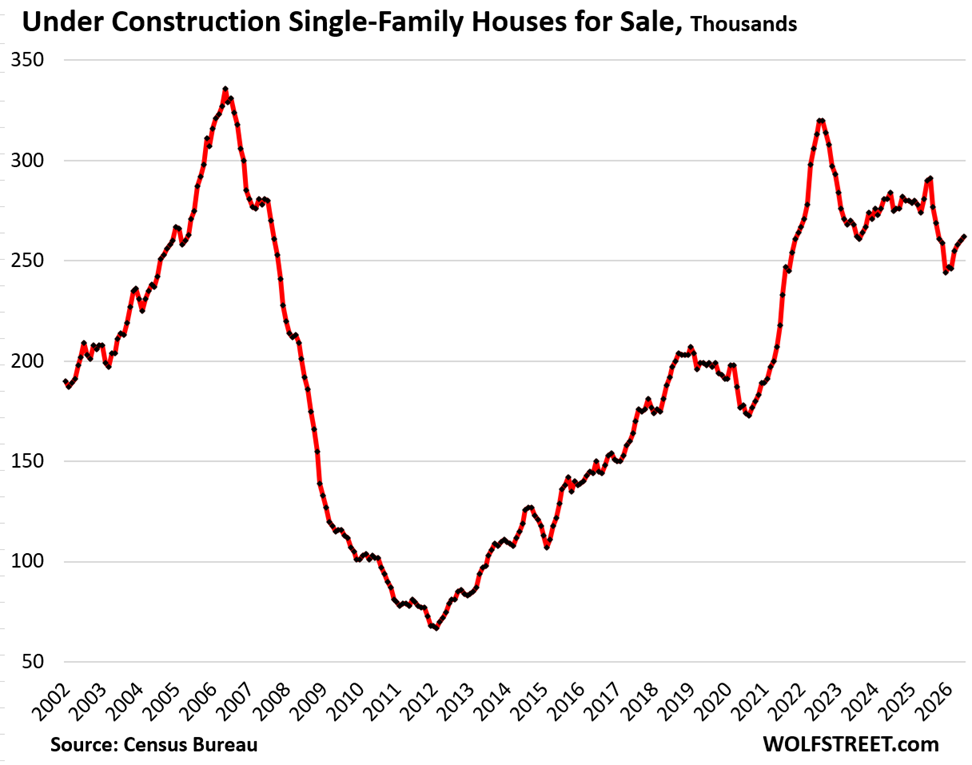
Inventory of under-construction homes rose to 262,000 homes, the third month in a row of increases, but was still down 10% from a year ago.
This is what is in the construction pipeline but hasn’t been sold yet. Homebuilders are motivated to be aggressive in selling it.
Inventory of completed homes for sale has been getting whittled down from the very high levels in December, to 113,000 homes in June, unchanged from May, and that was still up 1% from a year ago, and up by 49% from 2019.
These are mostly move-in ready “spec homes” that builders have a lot of capital tied up in, and that they’re very motivated to sell.
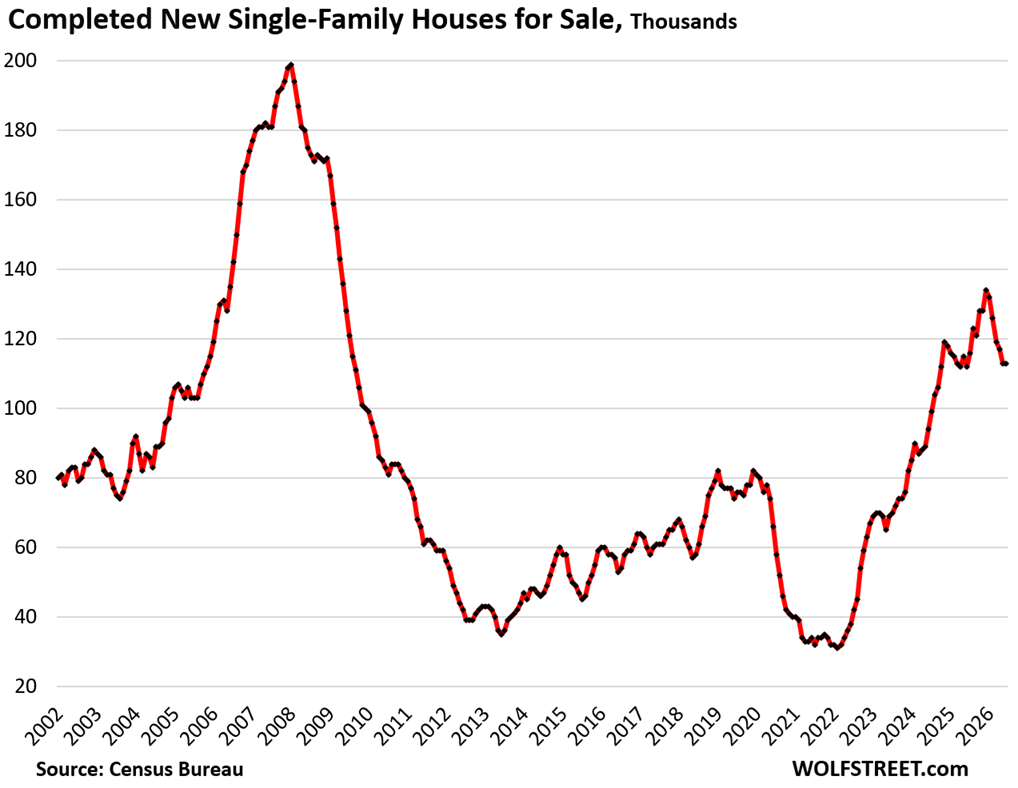

Inventory & sales by region.
A map of the four Census regions is below the article at the top of the comments.
In the South, inventory of new single-family homes for sale at all stages of construction declined by 4% year-over-year to 300,000 in June, but was up by 71% from June 2019. This is huge gigantic amount of inventory that homebuilders have to sell.
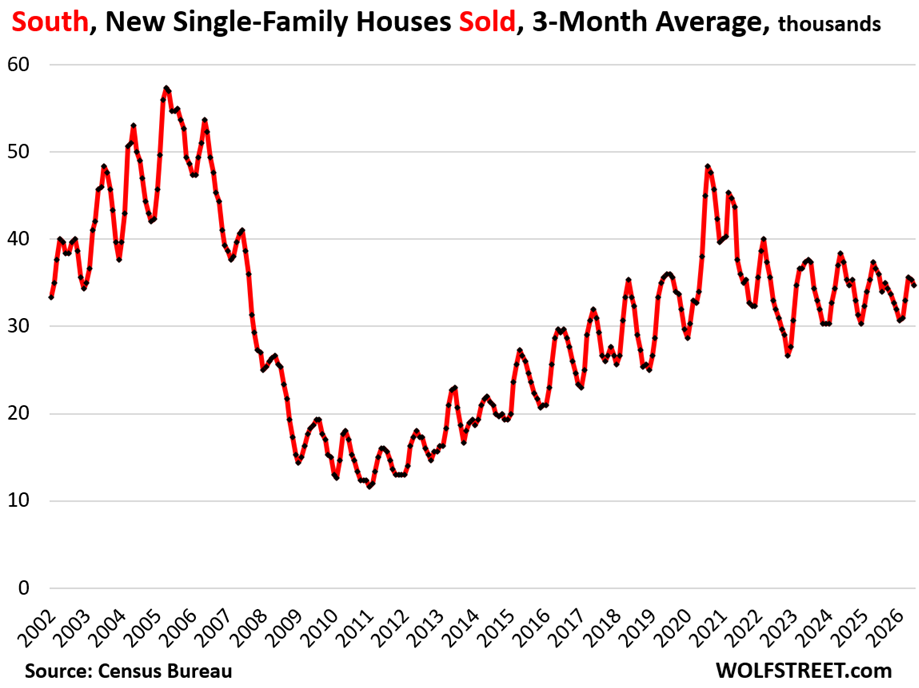
Sales in the south were unchanged year-over-year, at 36,000 single-family homes, down by about 8% from 2019.
So inventory up by 71% from 2019, and sales down by 8% from 2019. This is the definition of a glut.
The chart shows the three-month average sales to iron out some of the month-to-month squiggles.
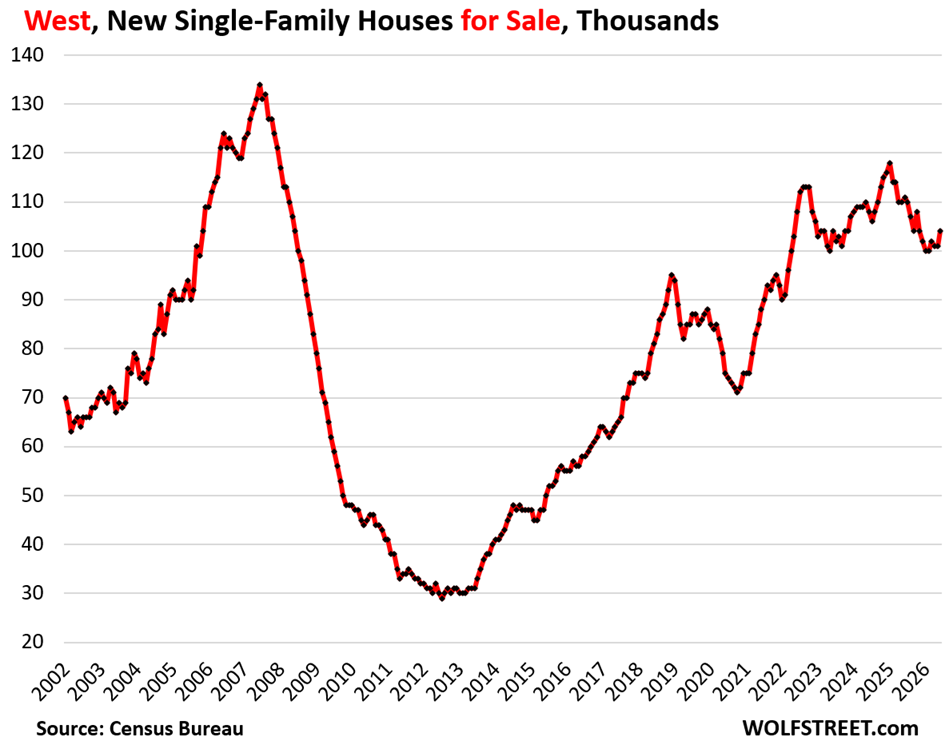
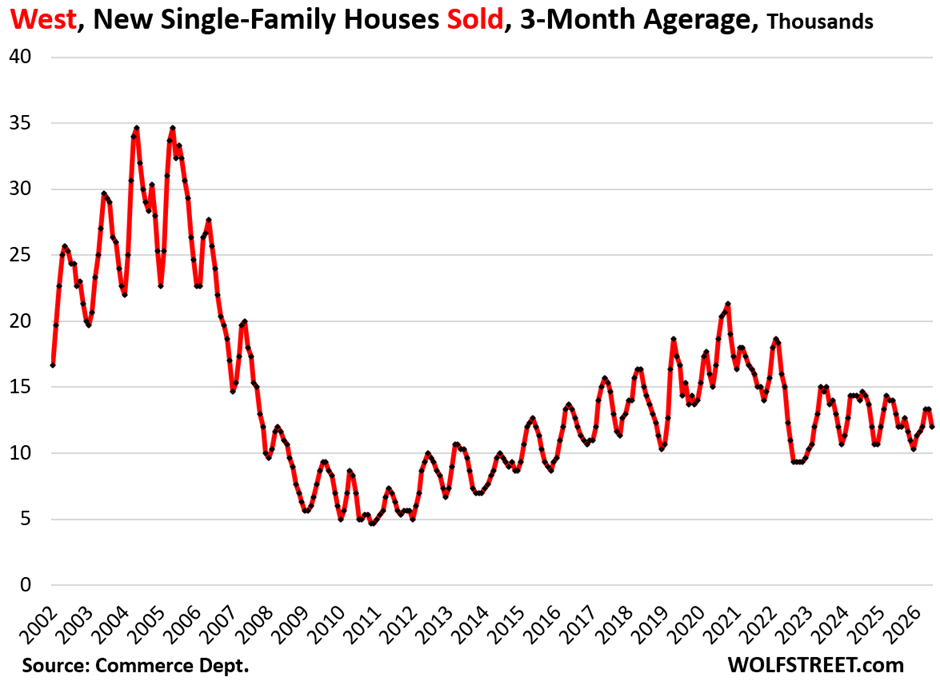
In the West, inventory of new single-family homes for sale declined by 6% from a year ago and by 4% from two years ago, to 104,000, but were still up by 22% from 2019.
Sales in the West plunged 25% year-over-year, by 36% from two years ago, and by 50% from 2019, to just 9,000 homes.
The chart shows the three-month average sales which irons out some of the month-to-month squiggles, including the squiggle-plunge in June.
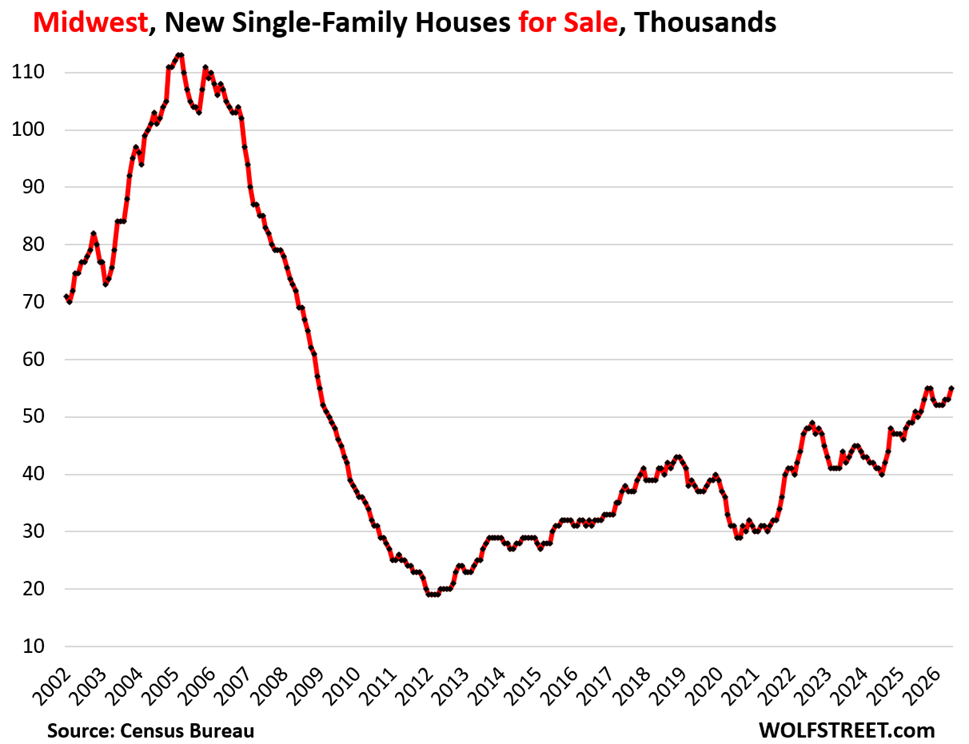
In the Midwest, inventory jumped by 8% year-over-year, by 34% from two years ago, and by 49% from 2019, to 55,000 new homes, along with October and November 2025 a 16-year high:
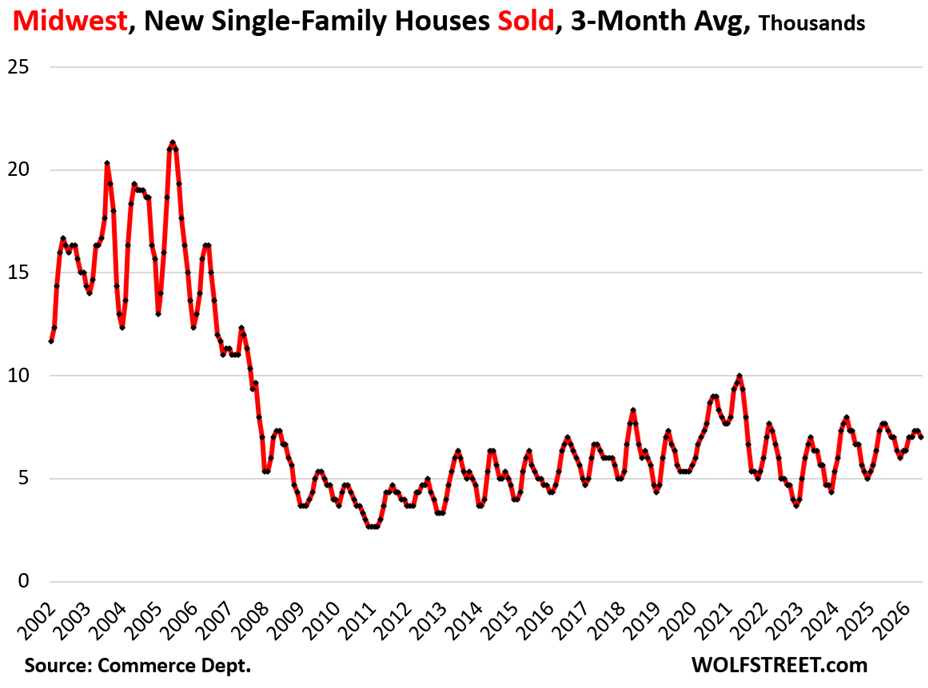
Sales came in at 7,000 (the Census Bureau rounds to the nearest 1,000). The chart shows the three-month average.
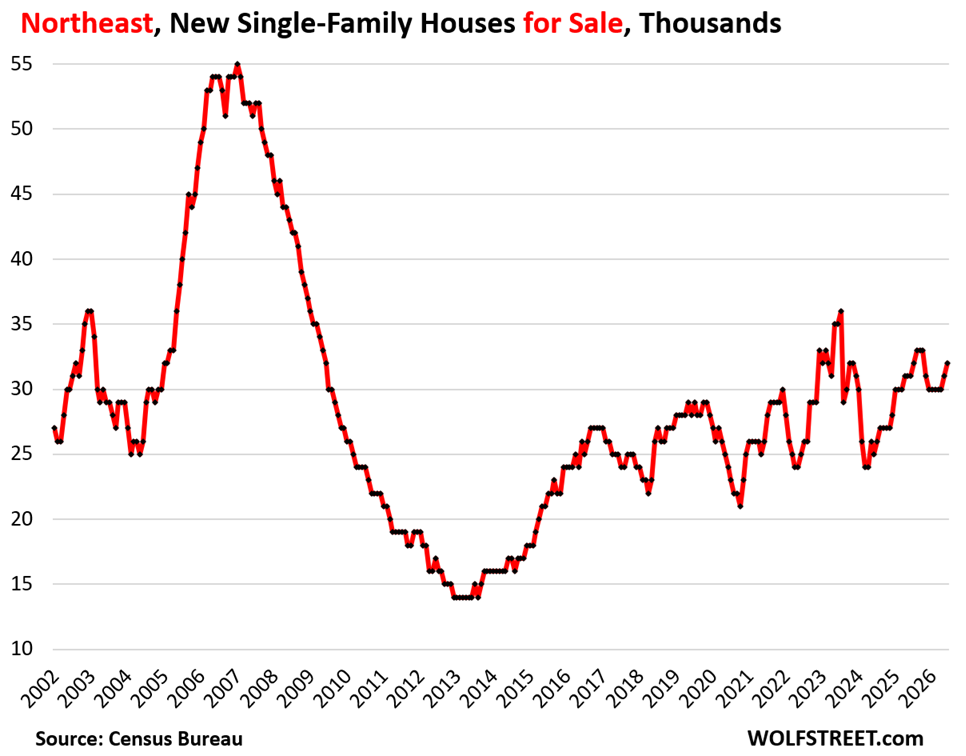
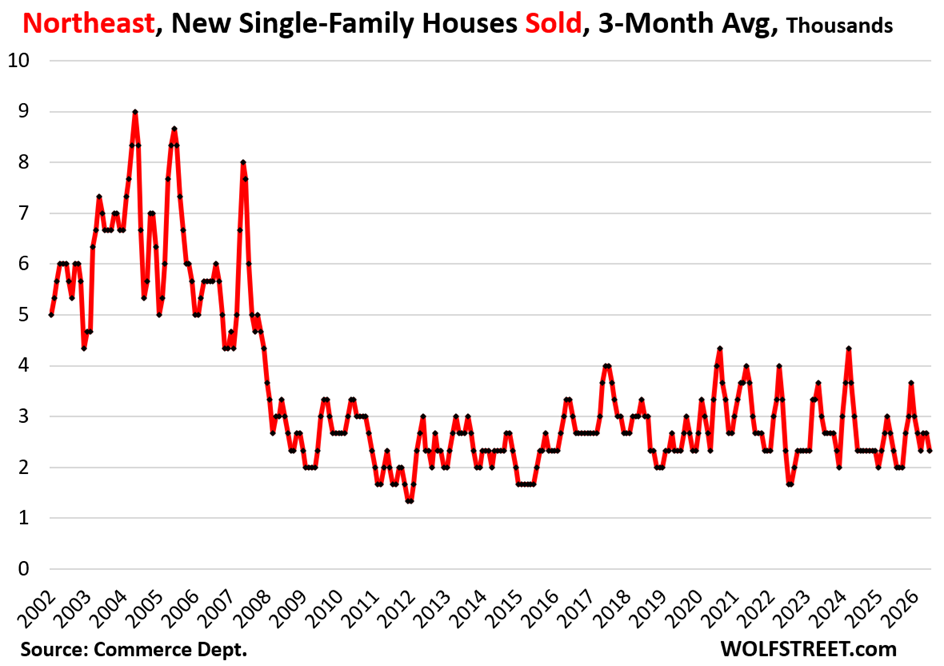
In the Northeast, inventory rose 3% year-over-year, by 28% from two years ago, and by 14% from 2019, to 32,000 new single-family homes.
The Northeast is a small area with big densely populated cities where multifamily construction (condos and apartments) plays a big role, rather than single-family construction.
Sales came in at 2,000 (rounded to the nearest 1,000). The chart shows the three-month average.
In case you missed it: Home Prices in 33 Big Expensive Cities in America: 25 Fell Year-over-Year in June, 2 Rose to New Highs
Enjoy reading WOLF STREET and want to support it? You can donate. I appreciate it immensely. Click on the mug to find out how:


The map of the four Census regions of the US. Click on the chart to enlarge it:
What is the problem with the midwest? thanks
If there is a sales and inventory problem, the cause is price. The job of price is to resolve sales and inventory problems. That’s its job just about anywhere, whether in financial markets, consumer products, or homes. But prices are still too high apparently, and homebuilders will need to sharpen their pencils some more. But there’s nearly no inventory and sales problem that price cannot solve.
I’m just outside of the Cincinnati metro and beginning to see some signs of normalcy in the residential RE market. “Normalcy” in the sense of more inventory on the market and (some) more reasonable initial listing prices.
However, that continues to be coupled with other sellers who simply cannot grasp that it is not 2022 anymore. Some of their listing prices are laughable – particularly after checking their purchase price. I facetiously call these “fund my retirement” prices.
I still don’t think this is a favorable market for buyers – overall pricing continues to be too high. But it may be slowly heading in the right direction.
“particularly after checking their purchase price.”
This is one area where the internet has handed a *lot* of power to smart/flexible buyers – knowing the other side’s primary buy-in price is a *huge* advantage in any negotiation – if buyers would only take a breath, calm down, engage their brain, and do a tiny bit of research.
And being willing to walk away/live in an apartment until the residual insanity evaporates.
A smart buyer who is calm and prepared simply will not/should not hand some $100k-$300k in profit to some hopped up flipper who thought ZIRP could never end,
Crappy weather, boomers aging in place, lack of skilled tradespersons, job market is agriculture, trucking, and construction. The new builds are nothing anyone wants – small lots, too close to the neighbors, shotty construction, two stories with no basements, everyone seems to be stoned, population isn’t dense enough, – this is not an exhaustive list.
shoddy
Thanks Marc.
“The new builds are nothing anyone wants”
Price adjustments downward can fix anything.
See 2008-2018.
It is just that 20 years of DC ZIRP turned a certain portion of the US population into economic meth-heads.
2008 and after sent a lot to rehab – but 2020 and following shows there are still a (smaller) number on the pipe.
But their delusion becomes somebody else’s catastrophe only if the buyer buys in to the hop-head mentality.
If you have a hamburger stand that cooks up super yummy hamburgers but you charge $100 per burger, you may sell a few to millionaires and billionaires. Most people will boycott. But hey – there is a solution – lower prices! Sales are in the dumps – lower prices will fix that. If you make super tasty burgers at a good price, they’ll sell like hotcakes!
Those who own don’t want to sell at any discount. They’re waiting for 2% rates
I’m south of Seattle, just outside of Tacoma. My wife and I went to visit a homebuilder to see if it could work… We thought we needed more time to save because we were looking at overpriced resales. When we didn’t make any commitment, the salesman said when we left “come at me with any offer”… So we did and with 4 weeks negotiation we arrived at a deal.
We ended up with a rate buydown to 4.75% on a 5/1 ARM and builder closing costs paid. Out of pocket is only the down payment and $500-600 monthly payment savings vs. cash incentive or market rate.
So much easier than haggling with an emotional homeowner and we got to pick out all the finishes and choose our floorplan.
It starts. We learnt nothing from the 2007-2008 crash…
See you in the headlines in a few years.
Sounds like a reasonable person making reasonable decisions and not rushing into anything but working their way to a manageable purchase. Good on you Clint for getting something true to your needs and tastes on your terms.
I would agree. This either ends in a nasty recession or higher for longer.
Rates are not going back down outside of a recession.
Buying a house via ARM right now is not a good choice, IMHO.
Why is an ARM bad now ? 5/1 gives the buyer 5 years to wait for the FED to come to the rescue and inflate debts away. After that, ***IF*** the family still has sufficient income, they can refi and enjoy their life. 5 years does not seem like too long to start the money printer. Usually, the FED intervenes when the job market takes a hit. So, try to stay employed.
Sleepless, rates are not going back to zero unless inflation goes down a lot. Which I don’t see happening soon. I wouldn’t bet on anything like the QE era repeating itself in present conditions.
My nephew once bought a house using an ARM. Renton WA….nice place. His first house. Yes, he had to walk away from it when the term ended. That old crystal ball thingy.
@Clint – Nice. I am glad you got a place. Can you tell me a bit about how the negotiation went and what was the discount percentage you got ?
Hopefully you plan on being in the house for quite awhile. If you have to sell in two years you will be competing
with the builder which is a losing battle. However, if you are there
for the long term, you should make out alright. Nothing is certain in life.
Dude! An ARM in this rate environment? You’re supposed to be going in the OTHER direction! It’s like 2006 all over again!
If the trend continues, it looks like you’ll be getting close to decent price normalization in a couple of years, relative to income. Where have all those commentators gone who were saying “no way home prices will stop skyrocketing” so confidently on Wolf Street just a year or two ago? I remember them well.
I wish something similar would happen in most European countries but alas… I guess I’ll just keep enjoying my dirt-cheap rent and saving/investing my money for the foreseeable future.
Outside of a recession, it’s doubtful that nationally there will be a 20-25% drop which is what’s needed to restore some semblance of return to the mean.
A recession will happen at some point. The business cycle hasn’t ended at all.
We’re in a post recession economy. At any hint of recession the fed and our government will inflate it away. Asset holders are in control. No falling asset prices—EVER!
Maybe, or maybe Sol is right. Don’t know. A technical recession could also be in the cards. But with so many unknowns (QT vs QE, oil, AI mania / improvements and automation, climate impacts), we can only look at current trends, I think.
I had to stop reading the comments on RE articles for a while because of all the “to the moon” shills that used to post here.
You still get the occasional “it’s gangbusters in my zip code” people here still, but much less.
Mr. Wolf writes: “Sales of new single-family homes at all stages of construction fell by 5.3% year-over-year in June, to 54,000 homes.”
Respectfully Sir: We live in a nation of 340+ million people; with a large percentage of young adults living at home. Even multiplying by 12 months, this is about 650,000 new homes. This housing situation looks like a complete failure from Wall Street. What happened to independent local construction workers building homes; the same kind of tradesmen that appear only to be allowed to work for some giant exchange traded company. Something appears to be stifling capitalism, zoning bureaucracy, endless environmental analysis of nothing unusual occurring (but prove it), banks not loaning to small business, it has to be something.
They don’t have enough buyers as it is. Look at the inventory charts.
When is the last time anyone saw a local small builder construct a spec house? I can’t remember when? I grew up as a carpenter. When big projects stalled my boss would then build spec houses to keep his workers. A guy that lived across the street from my folks would build two houses per year, mostly by himself with some hired sub trades. He would move into each house for 6 months to avoid capital gains, sell it….then move into the next one, and so on. Or, at least he had his mail delivered there. He made a very good living. Now, small builders work for customers that already have money, usually retired couples with lots of equity. Meanwhile, younger folks are stuck renting. My brother in law and his business partner do this niche work with no price guarantees, everything is cost plus. They are always paid because their customers are well off. These customer’s house cleaners charge $40 per hour, cash.
We are inundated with silly renovation shows on tv. Here is a tip, you cannot make money doing this unless you do the work yourself. But during the crazy 0% years all kinds of people started doing renos. They call it rehabbing. It was/is insulting, especially when they talk as if they did the work. I know a retired doctor who thought of herself as a rehab specialist. In today’s market it is all kaput and she quit talking about it. Picking out the paint does not qualify anyone as a builder, (are you listening Donald?)
General question: Exactly how does living in a house for 6 months that you had built eliminates capital gains. Also, wouldn’t you want to be taxed at the lower capital gains rate rather than the ordinary income tax rate?
What is stifling home sales is price. The huge run up of the past 15 years has to correct itself, or the number of buyers will be miniscule.
Its wages. Wages are not keeping pace with inflation or productivity gains. Infinite immigration, both legal and illegal has reduced wages through labor supply increases. In some industries raising wages 30% would only marginally increase the cost of business, but visa workers remove any labor supply shortages and reduce worker bargaining power.
I agree it’s wages but it’s due to outsourcing and importing everything. They don’t compete in the same market so they sell their services/goods for cheaper. Immigrants whether legal or illegal have to compete in the same market, contribute to the same economy and buy things at same price.
It’s all perspective Gary. I have sold one and bought two homes this year. You may have look a little more. But deals are getting done. Listen to Wolf. At the correct price.
Your numbers need a little tweaking. 340+ million people live in 134 million households. Approximately 65-68% of the households live in detached single family homes. To make the math easy let’s assume 66.7%. So we’re at 89.4 million single family homes in the US, and they are building 650K new homes per year. But wait – there’s more. US net population growth rate is currently 0.5% and that includes immigration. So if you rely on those long-term trends, just to stay up with population growth, we would need 447,000 new single family houses per year… and they are building 650,000.
And to reply to my own comment – demographics are not on the side of the US real estate industry, because there is an up-coming tidal wave of baby boomers who are about to start selling their single family homes and move into apartments and facilities with managed care – because they are 63-83 years old.
Home builders have no reason to quit building. Why not? They get to take market share from existing-home sellers until the entire market crashes.
The housing market is like the stock market. When prices crash you buy some, when prices explode you sell some. It is hard to get the.monry to start this process, but once you do life is better. Long live homes and stocks.
Do the stats presented include the investor build to rent houses? If so, do you have a breakout?
Short answer: no.
Long answer:
Single-family BTR is only a small portion of total single-family construction, in terms of construction starts about 7% in 2025. And BTR is included in the broader data of single-family construction starts, permits, and completions, which I cover separately, and the data is released separately.
Census:
“Built for Rent – This category includes all houses built on builder’s land with the intention of renting the housing unit. A lease-purchase, rent-purchase, or other option to eventually buy the house may exist. This also would include retirement community units, occupied under a “life-lease”/”continuing-care” arrangement (occupants pay an up front fee or small monthly fees for lifelong use.)
But this here is single-family “built for sale” and includes “inventory for sale” and “sales” a subcategory of the construction data, and it does not include the BTR sales.
Census:
“Built for Sale – This category includes all houses built on builder’s land with the intention of selling the house and land in one transaction. Such a sale is called “fee simple.” These units are often called “speculatively-built” houses.
“Also included are the following: Houses purchased and the lot rented, Houses sold as part of a condominium, Houses sold as part of a cooperative project (occupants own stock in the project as a whole, but do not own residential units), Houses sold to several individuals in a “time-sharing” arrangement.”
The NE/Midwest seem to have two distinct issues with new construction.
Most of the Northeast that is job accessible is built out with little good usable land left. This is why multifamily is predominating. The land rich areas in Upstate NY, The Pennsylvania T and northern New England lack strong local job markets and economies.
And incumbent home prices are ridiculous. A 65 year old 3 bedroom ranch with an hour plus train ride to NYC and a 45+ min drive to Newark/JC sold for 870k in my neighborhood. Even with 20% down, that is a $5,700 monthly house payment with taxes. That means you should be making $225k a year to buy it, which fewer than 15% of metro NYC households do.
In the Midwest land is more abundant but the rough winters and lack of economic drivers in deindustrialized areas have hurt new construction.
Some fairly well kniwn guy who talks about finance and the economy says that homes are about 30% overvalued presently. I respect him a lot, but was aghast at this statement. I dare say that in many parts of California, real estate is 70% overvalued. Yes, 70%. The insanity level is just as obvious as walking into an insane asylum .
Auston Texas passed a new zoning bill which will help boost housing affordability. Under the bill investors will be able to buy your home on a 6,000 sq foot lot, level it and put up three 1,200 sq foot mini homes on the same lot. These new mini homes will be more affordable for starter homes, or can be rented out for much lower rents than are currently offered for bigger homes. Once this effort is successful look for other jurisdictions across the country to do the same. They were talking about this in my own county, Montgomery County, Maryland. Mandami, the NYC mayor is also pushing this in the NYC borough of Queens, to boost affordability.
As a resident of Austin, the two cents I would offer is to grab some popcorn and watch this play out from a distance to see what happens before allowing the idea spread. None of those two extra mini homes per lot is going to have any place to park a car. There won’t be anywhere near enough street parking for these new home “owners” so they’ll be completely dependent on bicycles or pubic transportation, which is a four-letter word in these parts.
There’s a pit forming in my stomach that this is going to turn into a disaster for everybody but the developers, who are going to cash out bigly. What will be left behind are a lot of angry residents who can’t get anywhere and demand a ginormous taxpayer funded expansion of transit services. But there really isn’t a place to put that infrastructure without stealing^H^H^H^H^H^H^H^H eminent domaining a lot of private land. They’re starting to used the word “tunnels” at like a billion dollars a mile. And planning a light rail system that gets cut in half before a shovel even touches ground.
If they were apartments they could at least build upward and leave a ground level garage. But we gotta force mini single family homes for…reasons.
They can put a two-car garage plus a utility room on the ground floor of each house, and put everything else on top. This has been standard practice in San Francisco’s single-family, duplex, and triplex construction since about 1940.
There are already a lot of structures like your two-car garage and up example but I think restricted to lots under multifamily zoning, e.g. townhomes.
The only thing that changed is the zoning restriction limiting SFH zoned lots to a single house. That was relaxed without requiring rezoning. Existing constraints like setbacks, max height, impervious cover, “compatibility standards”, IRC vs. IBC, etc etc remain in place.
It seems too early to know how developers are going to actually respond but early predictions from people I think know what they’re talking about are saying we’re not going to get a lot of triplexes. Maybe they’re wrong but in a lot of cases under those code constraints (and the demolition costs of scraping existing SFHs) detached ADUs/granny flats/cottages are going to make more economic sense. But then maybe the city decides to start chipping away at those code constraints and everything resets again. Who knows. I guess that uncertainty is what is going to make this an interesting experiment to watch from a distance.
If after all this change we end up being more like San Francisco I hope we at least get a cable car out of it.
The only assets I really like are some overseas stuff that has real earnings, and TIPS because we’re in an unofficial 3% target fed inflationary regime with 2.29-2.53% breakeven.
Prices are absurd in this environment to go long on housing. Folks complaining about “affordability” don’t understand that higher lending cycles are saving them from another 08-10 repeat.
In Australia they auction houses off……read news that one realtor with 8 houses to auction, had no bidders sign up, for any. Said it’s a first. Real Estate in my backyard, Ontario, Canada, not good. in my small town fine two bedroom home on double lot sold for 30% below est. peak price, or more…..and was on mkt for awhile. Shorter mtg terms here advance price adjustments imo
I have come to this conclusion – the housing market is going to chug along and along and along – and then it’s going to TANK. A lead balloon can only be held up for so long.