
In July, the plunge in energy prices migrated into services via truck transportation services and others.
By Wolf Richter for WOLF STREET.
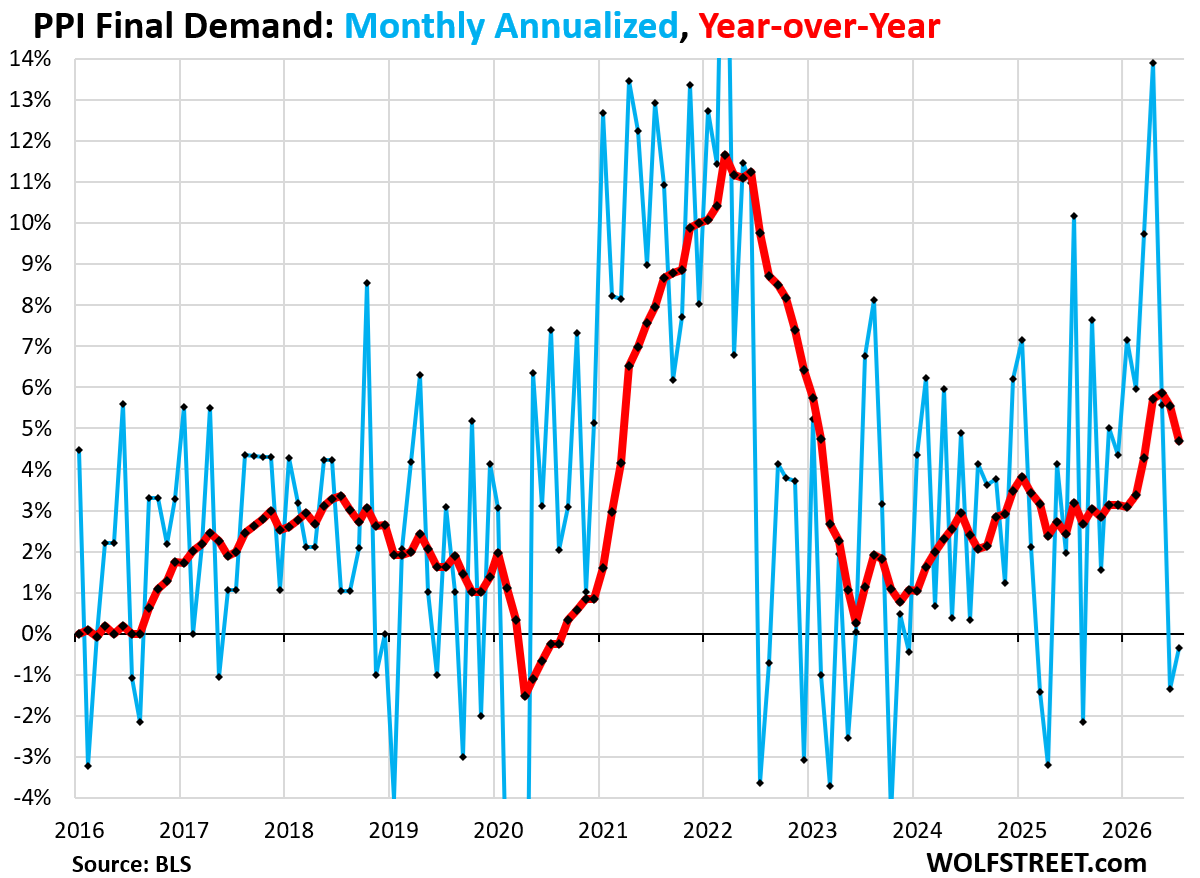
The Producer Price Index final demand, which tracks broad inflation in prices that companies pay each other, edged down 0.03% in July from June (annualized -0.3%, blue in the chart), held down in part by the PPI for energy, which plunged for the second month in a row in July. These energy prices are part of the input costs for companies, and it spread across industries, including the services PPI via truck transportation services and other services, where energy costs weigh heavily.
But June was substantially revised higher today, to -0.1% today from -0.28% reported originally a month ago, on a massive up-revision of the services PPI.
Year-over-year, the overall PPI rose by 4.7%, still a lot of inflation, but lower than the multi-year highs in the prior three months of 5.5% to 5.9% (red). The PPI has been zigzagging higher ever since the low point in mid-2023.
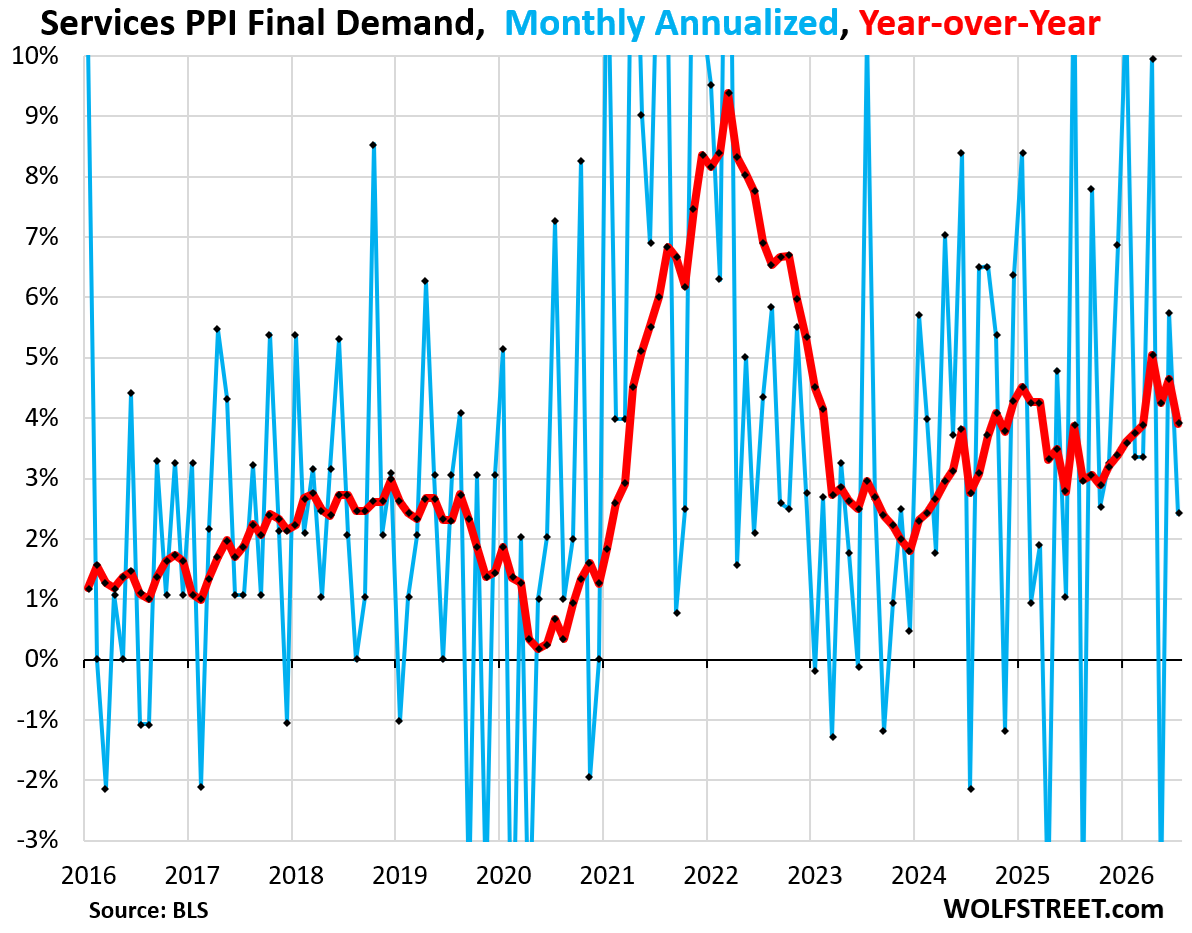
The services PPI rose by 0.20% in July from June, held down by prices of truck transportation of freight, which plunged by 1.8% month to month, due to the plunge in energy prices.
The services PPI accounts for 68% of the overall PPI final demand. It’s the biggie.
But inflation was in the revision. A month ago, the BLS reported that the June services PPI rose by 0.21% in June from May. Today, it more than doubled that inflation for June to +0.47%.
Year-over-year, the services PPI rose by 3.9%, a deceleration from the upwardly revised June reading (red line). That’s a lot of inflation in services. It has been zigzagging higher since the December 2023 low.
Within the services PPI, month-to-month:
- Transportation & warehousing services PPI plunged by 1.8% in July from June, second month in a row of declines, tracking the plunge in the energy PPI. This includes the 1.8% month-to-month plunge of truck transportation of freight. The index accounts for 4.9% of overall PPI.
- Trade services inched up by 0.1% in July from June, on top of the massively upwardly revised 1.4% spike in the prior month (originally reported as +0.4%). The index accounts for 19% of overall PPI.
- “Other services” rose by 0.6% in July from June. The index accounts for 38% of overall PPI.
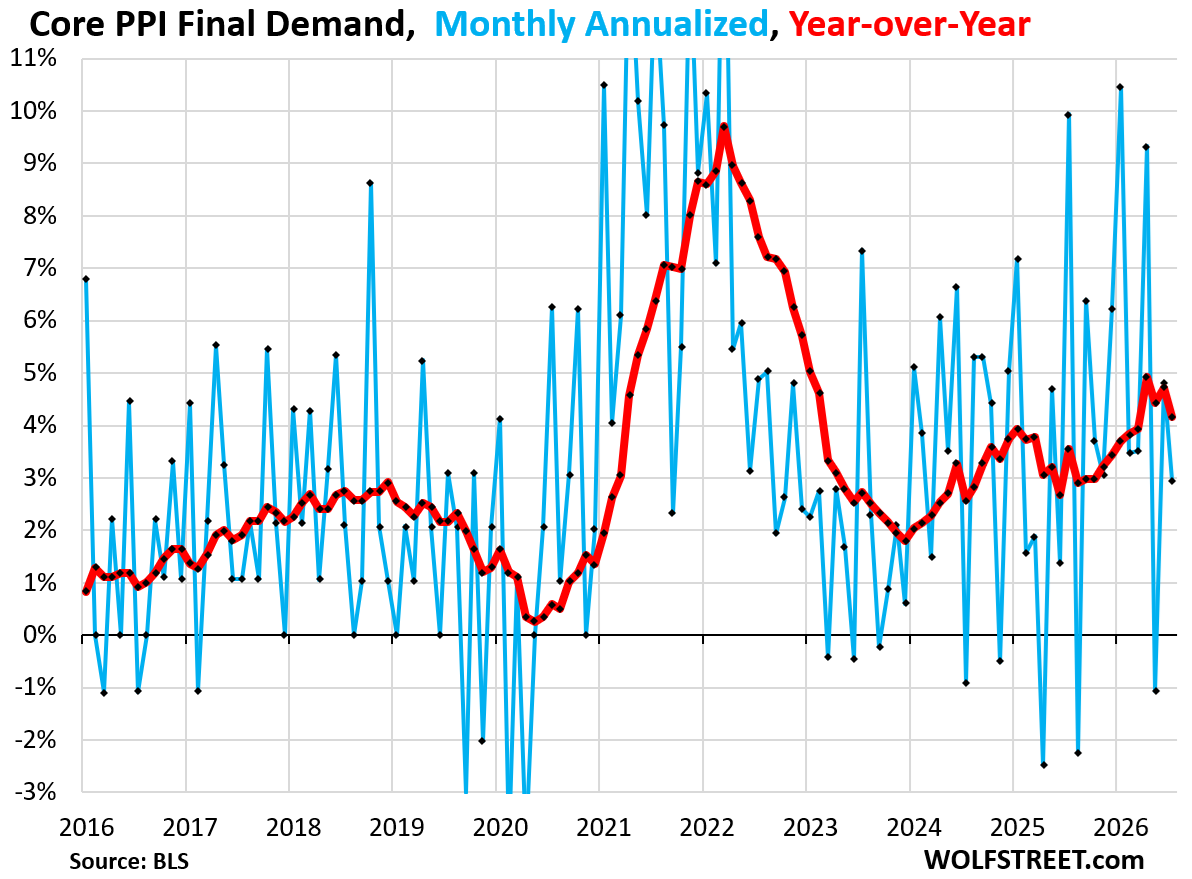
Core PPI Final Demand rose by 0.24% seasonally adjusted (+3.0% annualized, blue in the chart below). The index excludes energy and food components, and dominated by the services PPI, and the charts look very similar.
But June was revised massively higher, nearly doubling from the originally reported increase of +0.20% to today’s reported revised increase of +0.39% (+4.8% annualized), driven by the massive up-revision of the services PPI.
Year-over-year, core PPI rose by 4.2%. The four months of April through July were the worst since January-February 2023. It has been zigzagging higher since the low in December 2023 (red in the chart below).
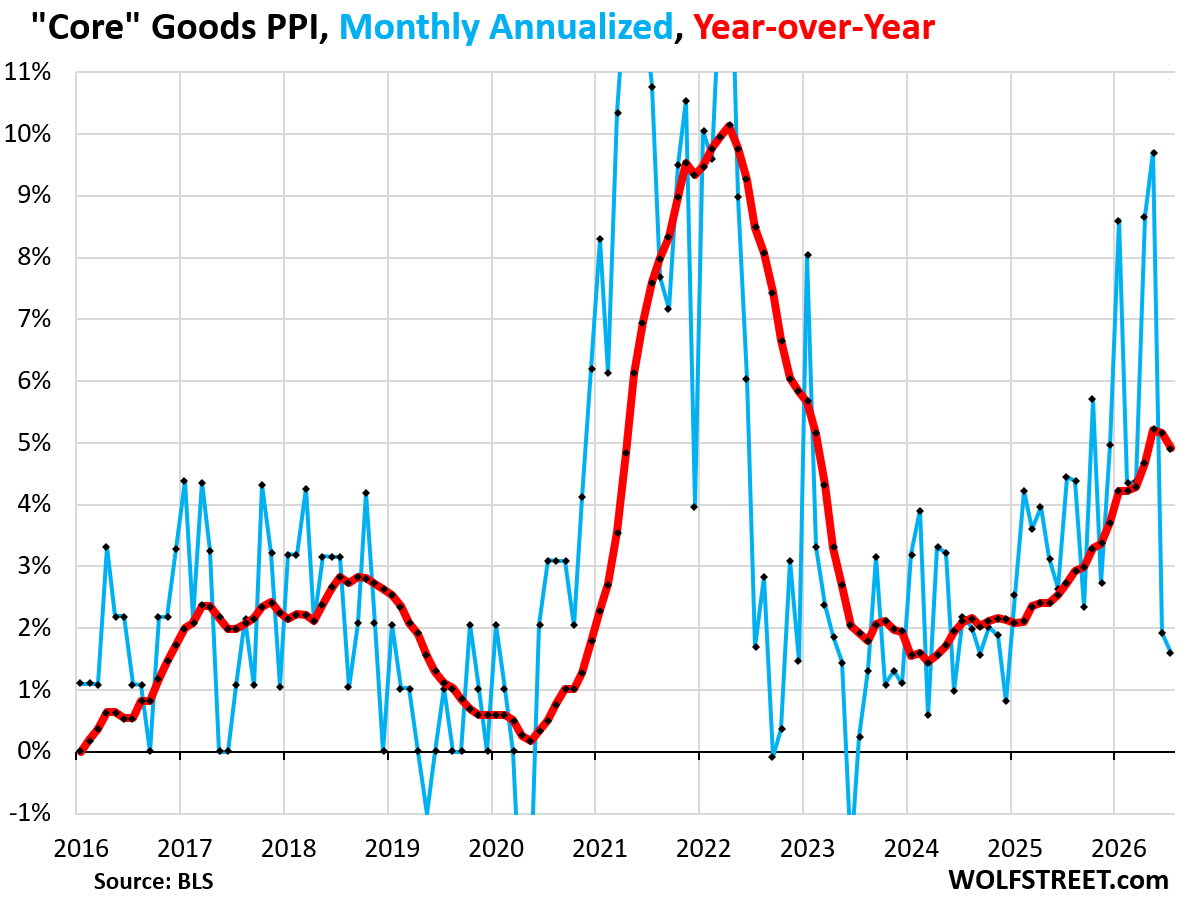
The PPI for core goods, which excludes energy and food components, rose by 0.13% (+1.6% annualized) in June from May, seasonally adjusted, after the spikes in April and May (blue line in the chart below).
Year-over-year, it rose by 4.9%, a deceleration from the upwardly revised increase in June. The last three months were the worst since February 2023 (red line). It has been zigzagging higher since March 2024.
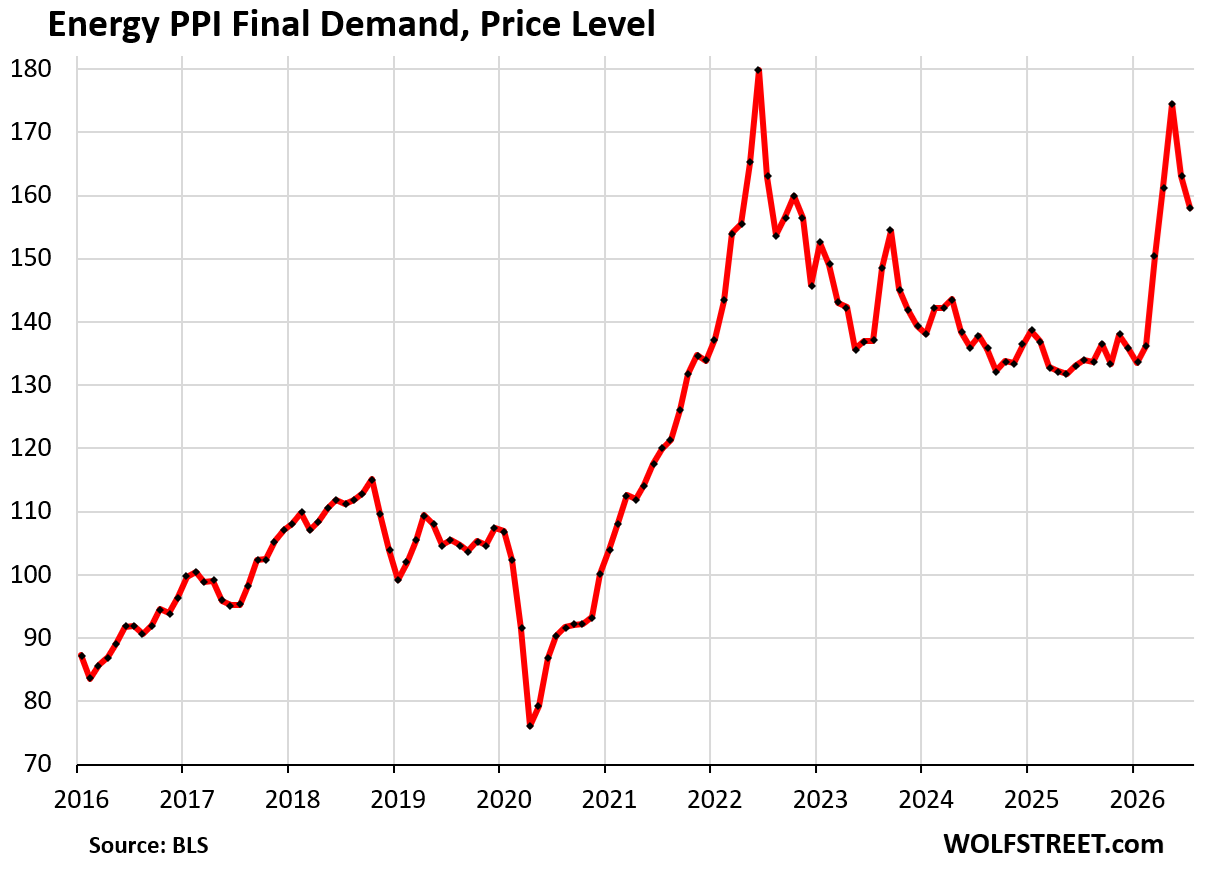
The PPI final demand for energy plunged by 3.1% in July from June (not annualized), secondly monthly plunge in a row, after the three months of spikes.
Year-over-year, the energy PPI is still up by 17.9%.
The chart shows the price level of the energy PPI, rather than the percentage change.
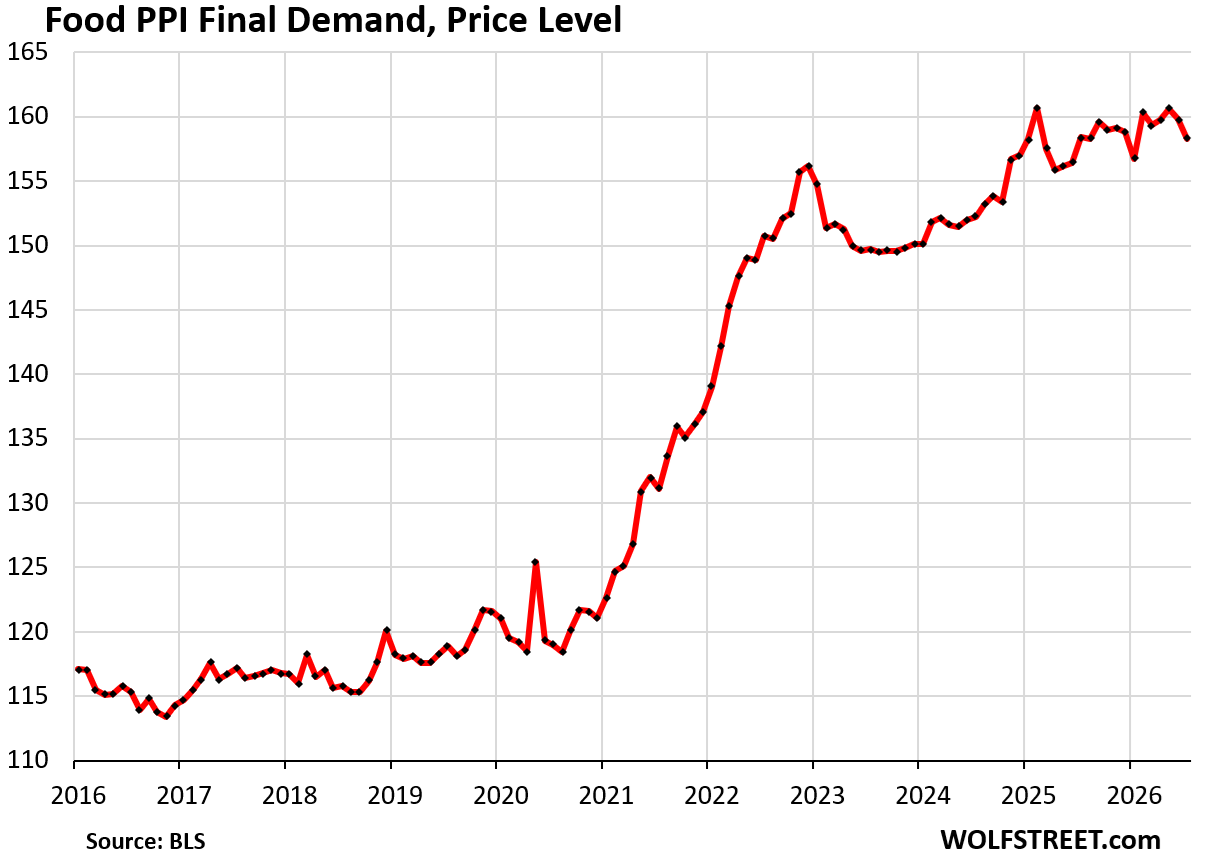
The PPI final demand for food fell by 0.93% in July from June, the second decline in a row (blue).
Year-over-year, it was unchanged. Food prices are very high after the surge in 2021 through 2022, but the further increases from those high levels have slowed over the past two years.
In case you missed it: CPI Dragged Down by Energy, Hotels & Motels (Shelter), Auto Insurance, and Meat (Finally)
Enjoy reading WOLF STREET and want to support it? You can donate. I appreciate it immensely. Click on the mug to find out how:


CPI and PPI will explode due to the U.S. Treasury, which is being forced to finance exploding deficits at quarter-century high rates. Selling $25 billion in 30-year bonds at 5.2%+ permanently locks in exorbitant long-term interest payments, replacing cheap legacy debt with expensive yields and pushing net interest expense—currently running at an annualized $1.24+ trillion—to roughly 20% to 22% of incoming tax receipts. While leaning on short-term T-bills provided a temporary patch, refunding at these higher-for-longer rates has made net interest the second-largest line item in the federal budget, far outpacing its historical 12% revenue-share average and accelerating a compounding debt spiral toward $40 trillion.
A 5.25% interest rate isn’t exorbitant. $40 Trillion of debt is.
Best estimates of the average over the history of the US (250 years) are pretty close to 5%
Anyone who reads this blog is not surprised and knows that the second wave of inflation is just getting started.
Hedge accordingly.
Could we see an economic slowdown that reduces demand and thus slows inflation?
Could inflation do this on its own?
A key question is whether rising long-term rates (and a rising spread between short and long term) can do the Fed’s work for them, lowering demand and employment, without anyone having to take accountability for raising the overnight rate.
Fast-rising spreads like the 10/3 are usually associated with recessions, but in those cases is it driven by short-term rates falling rather than long-term rates rising.
Is it a blog?
I thought it was a “hold the medieval peasant from escaping a large wall” type website with a sprinkle of Econ. 😆
Not til after the election…. numbers will be good until then
In july gasoline in my small town was $4.19, By the end of July it was $4.29. Now, first half of August it just ticked up $4.39. The SPR continues draining. Refinery attacks in different part of the world continue. Materials that normally flow out of the gulf continue to be disrupted.
It seems a bit mad that markets would put so much store in these month to month fluctuations: the Data while ignoring the underlying engine that produces the data. Almost as if they don’t really know whats going on ? And dont care as long as they can spin a story for UP.
It reminds me of that great movie “Das Boot”, a scene from the engine room with the Diesels roaring while the operators watch their gauges and the chief mechanic walks between the engines with a hearing tube to his ear inserting it down into the bowels of the engine and listens for noises he has learned to hear from long experience with those engines, that dont show up on the gauges.
In a normal world it would but I suspect a slowdown will increase the annual deficits which will increase the yield on new issuances of debt resulting in STAGFLATION…
“We told you, just not when you asked”. – The New Fed
(same as the old fed)
Speaking in Kettering, Ohio last week Federal Reserve Bank of Cleveland President Beth Hammock questioned whether recent signs of a slowdown in inflation will continue and reiterated her call to raise interest rates now.
“I love to see that those numbers are coming in lower — but I don’t have confidence that we’re going to continue to see that, or that we’re going to see them low enough that it’s going to bring us back down to that 2% number.”
Hammack continued “I think we need to act now” on interest rates.
Saying she would have preferred the Fed to raise the FFR by a quarter point, Hammack dissented against last month’s majority decision to keep it unchanged. She explained to Yahoo on Monday her view that rates weren’t “meaningfully restricting” and it could take “some number” of rate increases to bring inflation back to target. She demurred when asked what the eventual landing point should be.
Some economists however viewed the subdued 0.2% MOM increase in the core CPI eased the pressure on policymakers to raise rates. The decisions of the FOMC members including Hammack remain independent of political considerations.
Translated to “we will act in 2029”
Perhaps the 3 dissents in July will become 4 in September, 5 in October, and 6 or 7 in December.
2027 is another story. Key hawks including Kaskari, Logan, and the aforementioned Hammack all lose their voting rights on the FOMC, while the doves like Bowman, Jefferson, Cook, Powell, and Williams keep their votes.
We may or may not get one rate hike in December, depending on how the “moderates” who have been unmoved by inflation so far (Barr, Waller, and Warsh) decide to swing. But then I think that’s it. No more rate hikes in ’28, just a steadily steepening yield curve for banks to exploit, and more talk from us in the peanut gallery of an unofficial inflation target of 3-4%.
Thanks for pointing out what no one wants to hear about revisions! Maybe next month will be the same and so on. Anything to keep the animal spirits alive
I mean anything will be done to stop a stock market crash before the election. Looking at certain AI companies their debt is SOFR + a margin, so that would theoretically move with the fed funds rate….
Yen continues to weaken, PPI revised much higher, rates just shrugged and rebounded up today
Whelp, the headline PPI is…0!
Case closed.