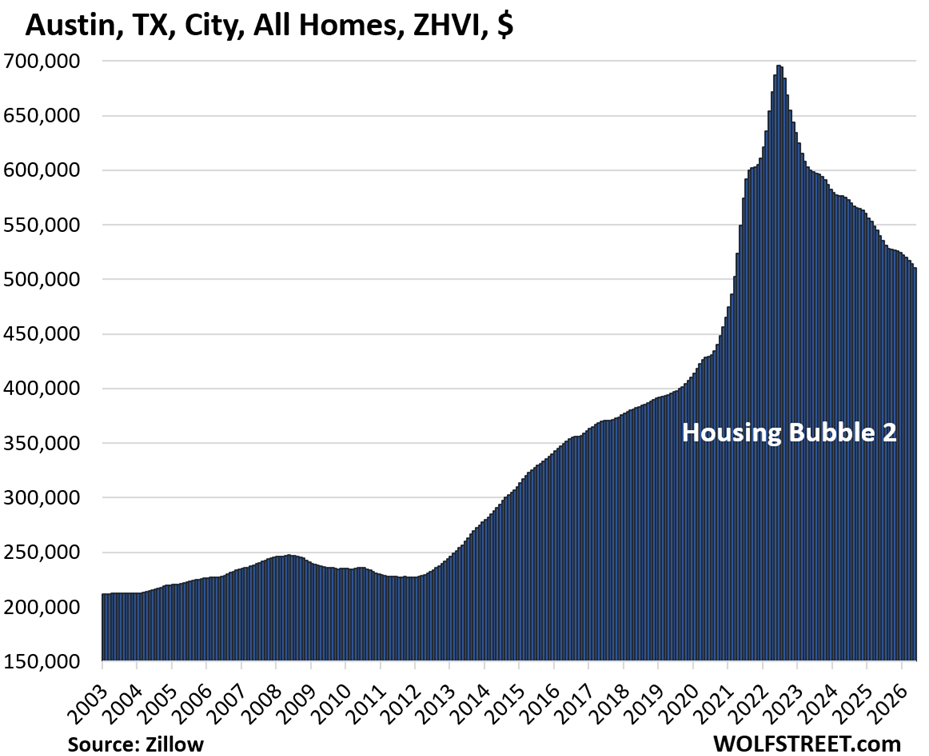
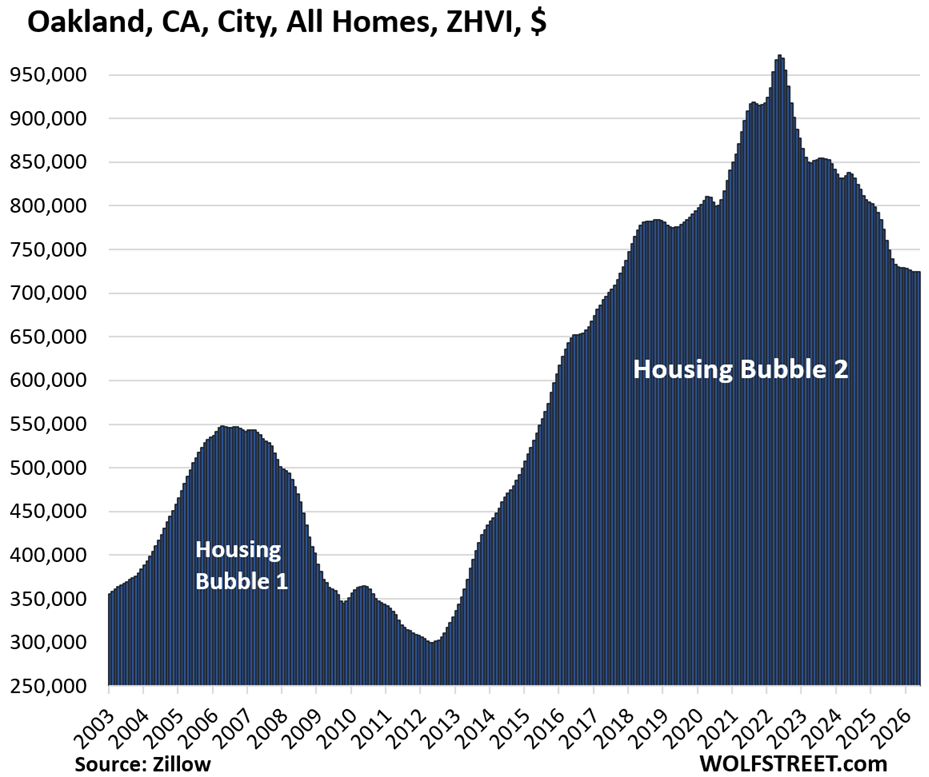
Home prices fell from peaks in prior years in 28 of the cities, led by Austin -27% and Oakland -26%, while AI mania in San Francisco trickled down from “mansion shortage” to mid-tier.
By Wolf Richter for WOLF STREET.
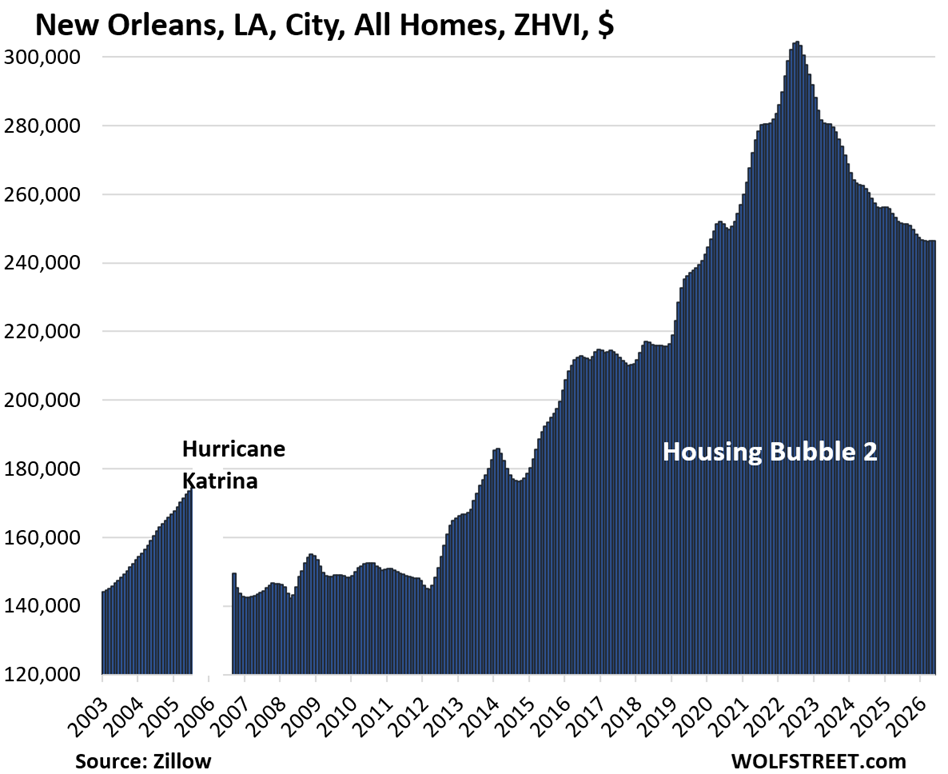
From all-time high in prior years: In 28 of the 33 cities, prices have dropped from their respective peaks in prior years, led by Austin (-27%), Oakland (-26%), and New Orleans (-19%).
In 17 of those cities, the peaks were in 2022; in 9, the peaks were in 2024; and in 2, the peaks were in early 2025 (Boston in April 2025 and San Jose in January 2025). All of the prices are seasonally adjusted.
In some cities, years of price increases have already been unwound. Prices are back to:
- Oakland: Oct. 2017
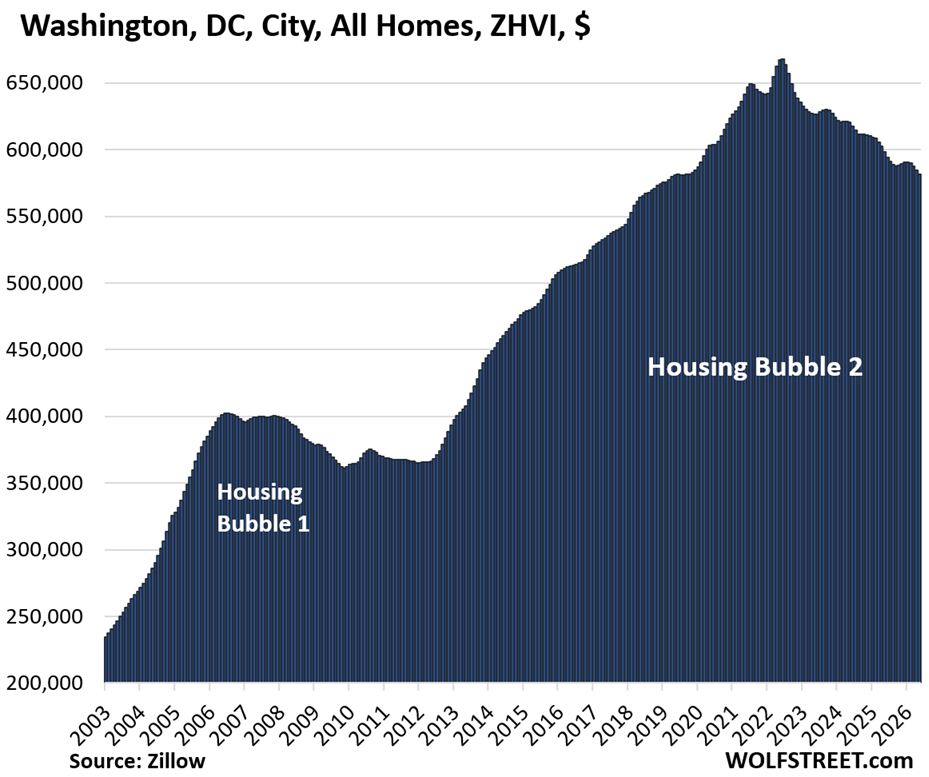
- Washington D.C.: Oct. 2019
- New Orleans: Feb. 2020
- Austin: Mar. 2021
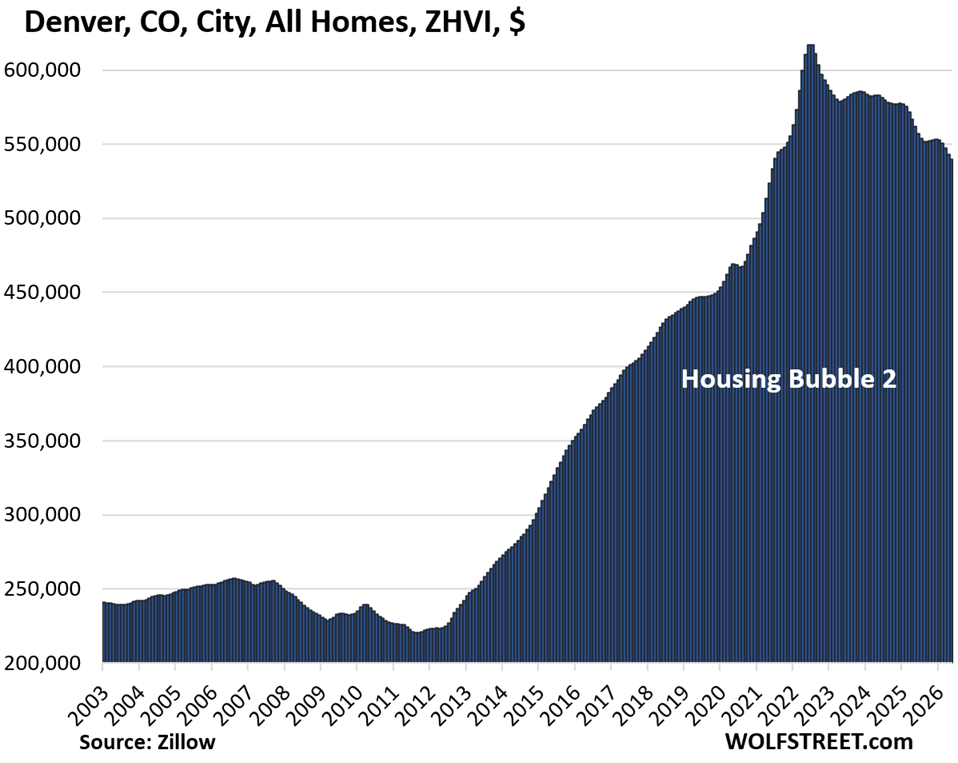
- Denver: Jun. 2021
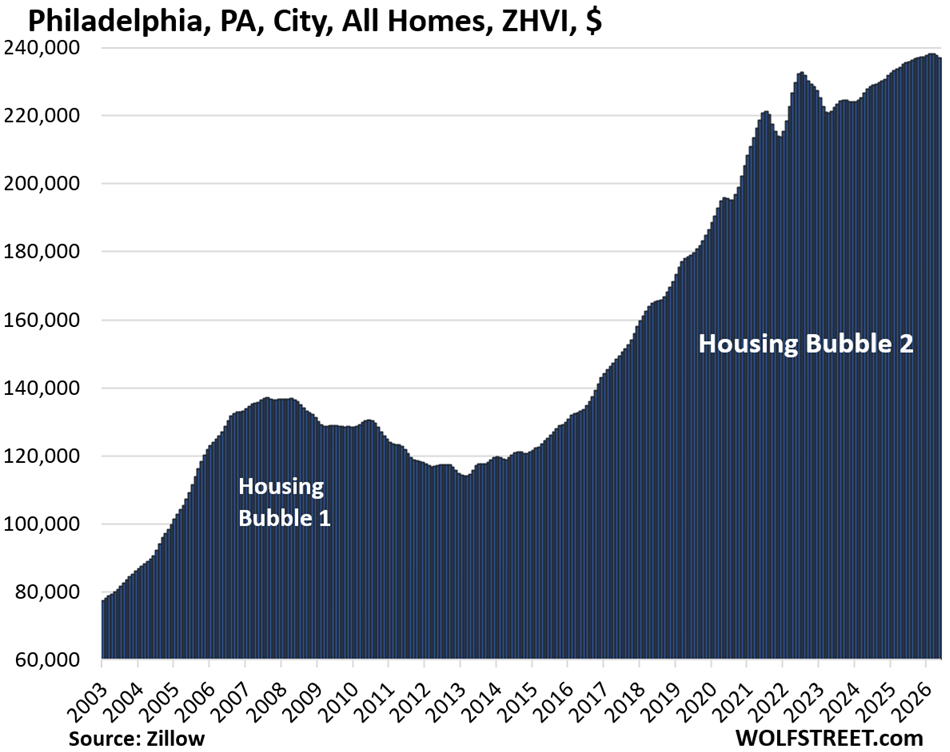
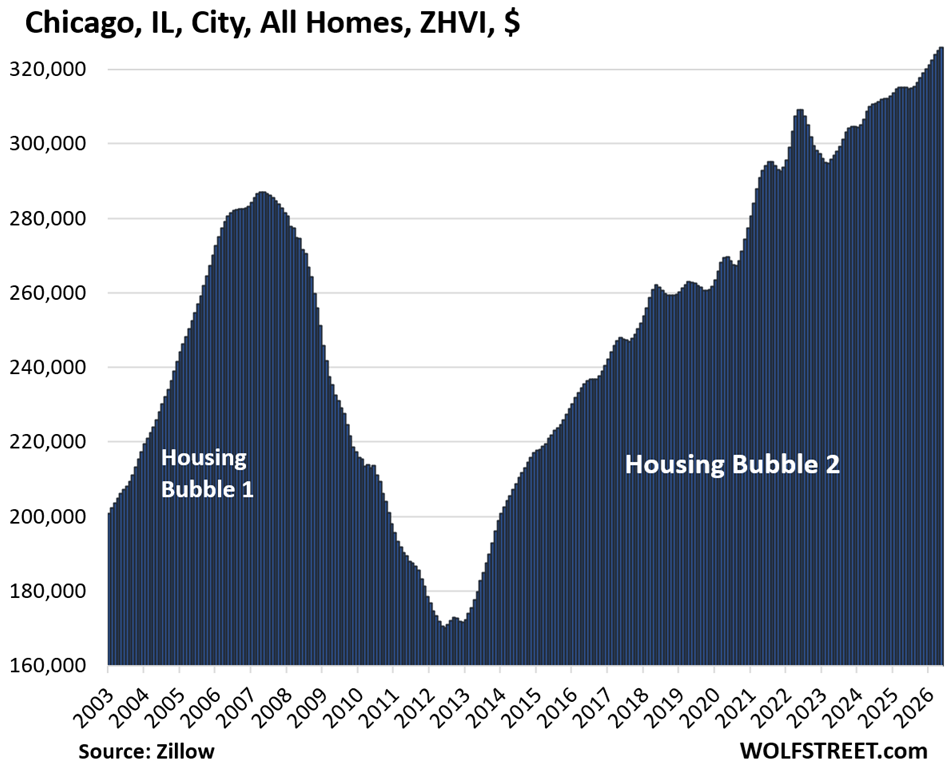
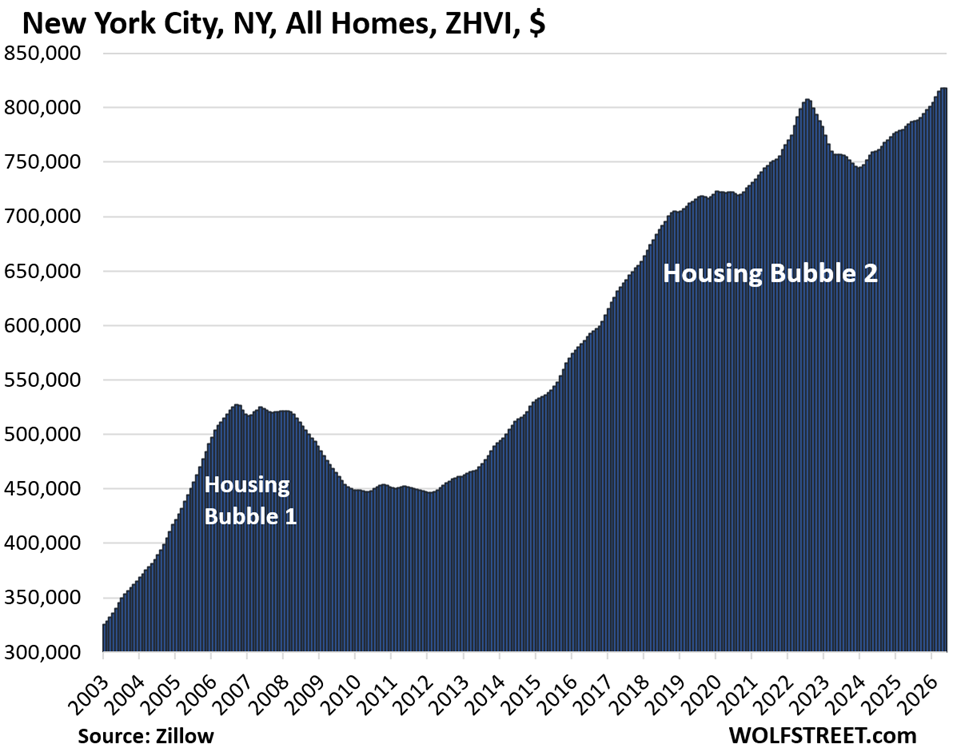
Year-over-year: In 25 of the 33 big and expensive cities we track here, mid-tier home prices in May were down year-over-year. But of the 8 that were up, two were gigantic cities, and they were the only 2 of the 33 where prices either reached a new all-time high in May (Chicago) or remained at an all-time high (New York City). In Philadelphia, mid-tier prices were still up year-over-year but by only 0.8%, after seasonally adjusted prices dropped for the past two months.
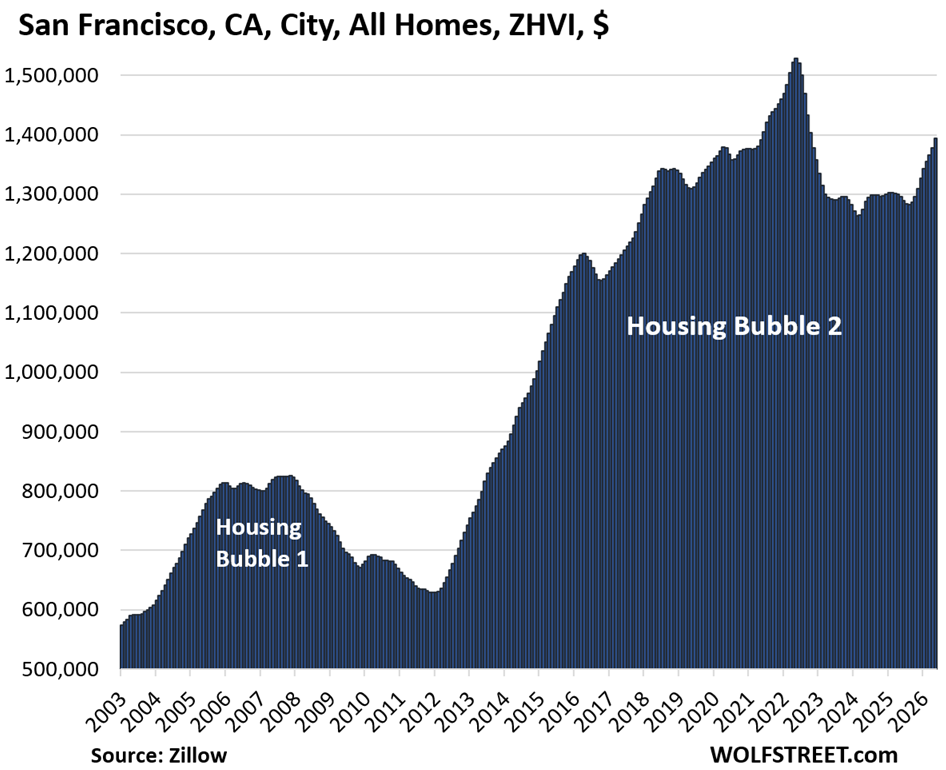
Then there’s the AI mania in San Francisco where the “mansion shortage” – fueled by the huge compensation packages offered by AI companies, such as Anthropic and OpenAI – has trickled down into mid-tier homes that we track here; prices shot up by 1.2% month-to-month and by 7.8% year-over-year, but still remained below the 2022 peak.
Month-to-month, seasonally adjusted: prices declined in 28 of the 33 cities in May; were unchanged in 3 cities, edged up in 1 city (Chicago), and exploded in San Francisco (+1.2%).
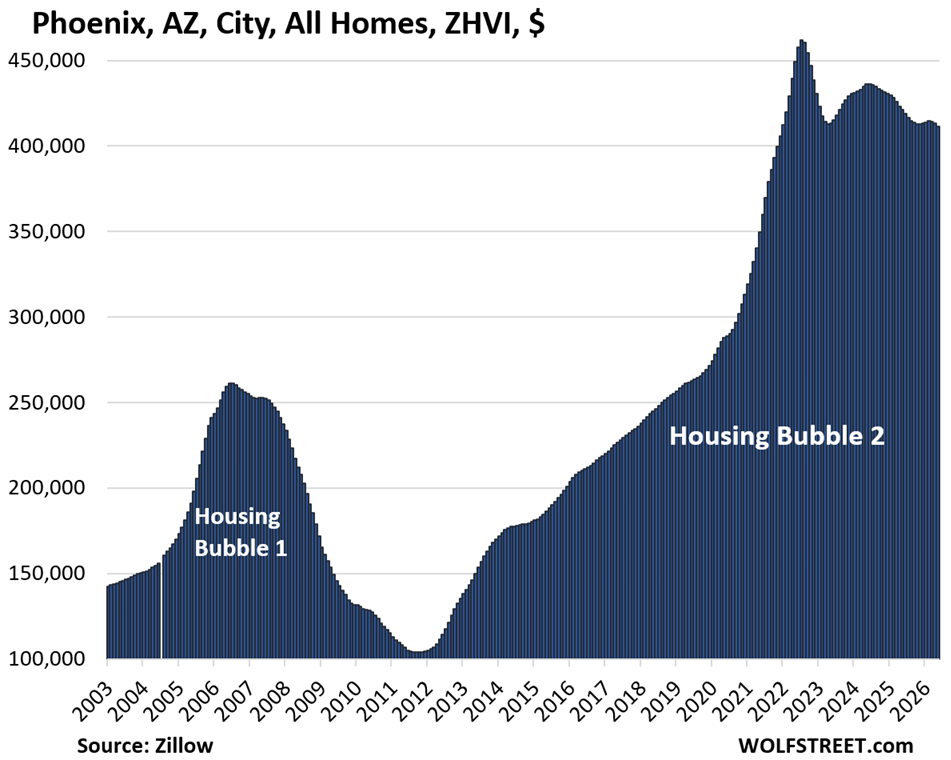
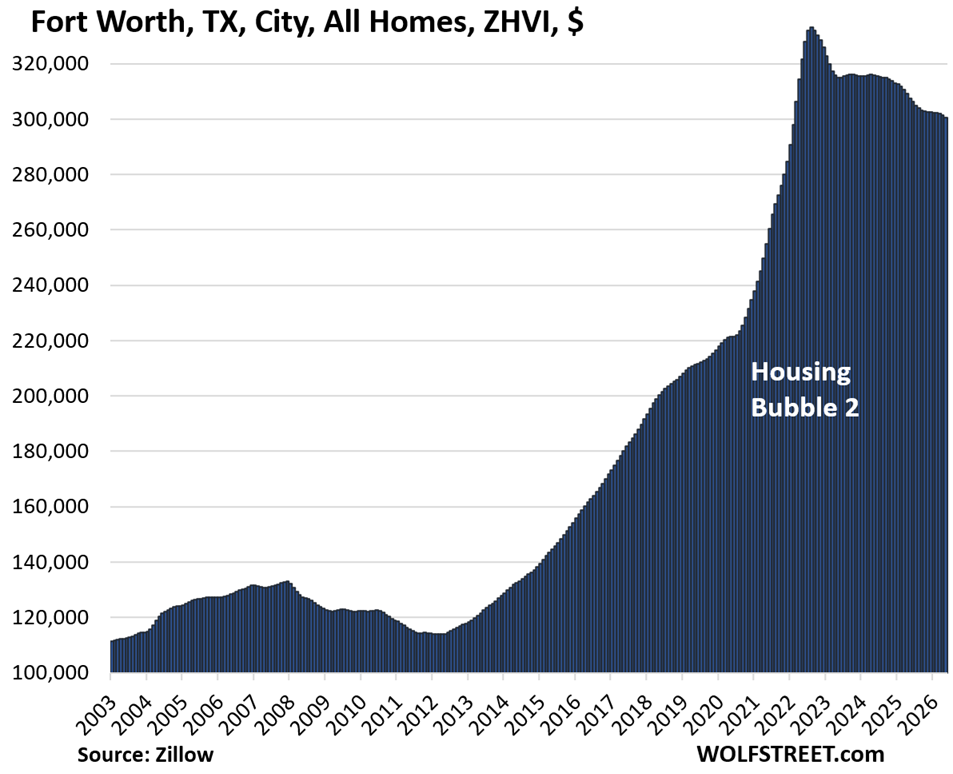
From mid-2020 to mid-2022, all of the 33 cities here had experienced huge price spikes, led by Austin (+62% in two years), Phoenix (+60%), Fort Worth (+50%), Raleigh (+49%), and Sacramento (+39%). These price spikes, on top of already high prices, created today’s affordability crisis. They were the result of the Fed’s reckless monetary policies, especially the repression of mortgage interest rates through QE: trillions of dollars of purchases of Treasury securities and mortgage-backed securities (MBS) produced the below-3% mortgage rates, even as inflation was heading toward 9%.
The price index here is the seasonally adjusted three-month-average mid-tier Zillow Home Value Index (ZHVI) for single-family homes, condos, and co-ops, released today. Mid-tier means the middle-third by price in each market. The ZHVI is based on millions of data points in Zillow’s “Database of All Homes,” including from public records (tax data), MLS, brokerages, local Realtor Associations, real-estate agents, and households across the US. It includes pricing data for off-market deals and for-sale-by-owner deals.
To qualify for the list, the city must be one of the largest by population and be among the more expensive cities where the ZHVI for all mid-tier homes must have been at least $300,000 at some point.
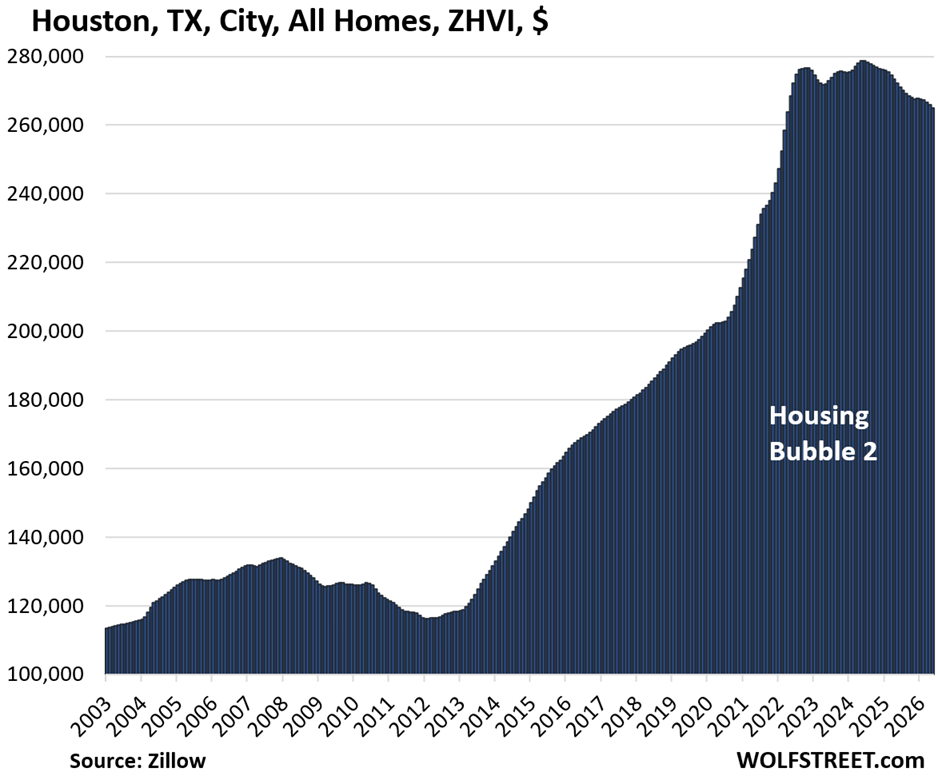
Some large cities don’t qualify for this list because the ZHVI for mid-tier homes never reached $300,000, despite the surge in recent years, such as the cities of New Orleans, Houston, Philadelphia, Memphis, Oklahoma City, Tulsa, Kansas City, Cincinnati, Pittsburgh, and a slew of others.
But Houston, Philadelphia, and New Orleans are included anyway: Houston and Philadelphia because they’re the fourth-largest and sixth-largest cities in the US; and New Orleans because it got very close to $300,000 in 2022.
The 33 Most Splendid Housing Bubbles.
In the little tables, MoM = month over month; YoY = year-over-year. The column furthest to the right shows the percentage increase “since 2000.” All seasonally adjusted.
| Austin, TX, City, All Homes, Prices | |||
| From Jun 2022 peak | MoM | YoY | Since 2000 |
| -27% | -0.6% | -5.4% | 152% |
Lowest since March 2021.
| Oakland, City, CA, All Homes, Prices | |||
| From May 2022 peak | MoM | YoY | Since 2000 |
| -26% | 0.0% | -6.2% | 246% |
Lowest since October 2017.
| New Orleans, LA, City, All Homes, Prices | |||
| From Jun 2022 peak | MoM | YoY | Since 2007 |
| -19% | 0.0% | -2.3% | 106% |
Back to February 2020.
| Washington D.C., All Homes, Prices | |||
| From Jun 2022 peak | MoM | YoY | Since 2000 |
| -13% | -0.5% | -2.8% | 254% |
Lowest since October 2019.
| Denver, CO, City, All Homes, Prices | |||
| From Jun 2022 peak | MoM | YoY | Since 2000 |
| -12% | -0.6% | -3.9% | 196% |
Lowest since June 2021.
| Phoenix, AZ, City, All Homes, Prices | |||
| From Jul 2022 peak | MoM | YoY | Since 2000 |
| -11% | -0.4% | -2.3% | 247% |
| Fort Worth, TX, City, All Homes, Prices | |||
| From Aug 2022 peak | MoM | YoY | Since 2000 |
| -10% | -0.3% | -2.3% | 187% |
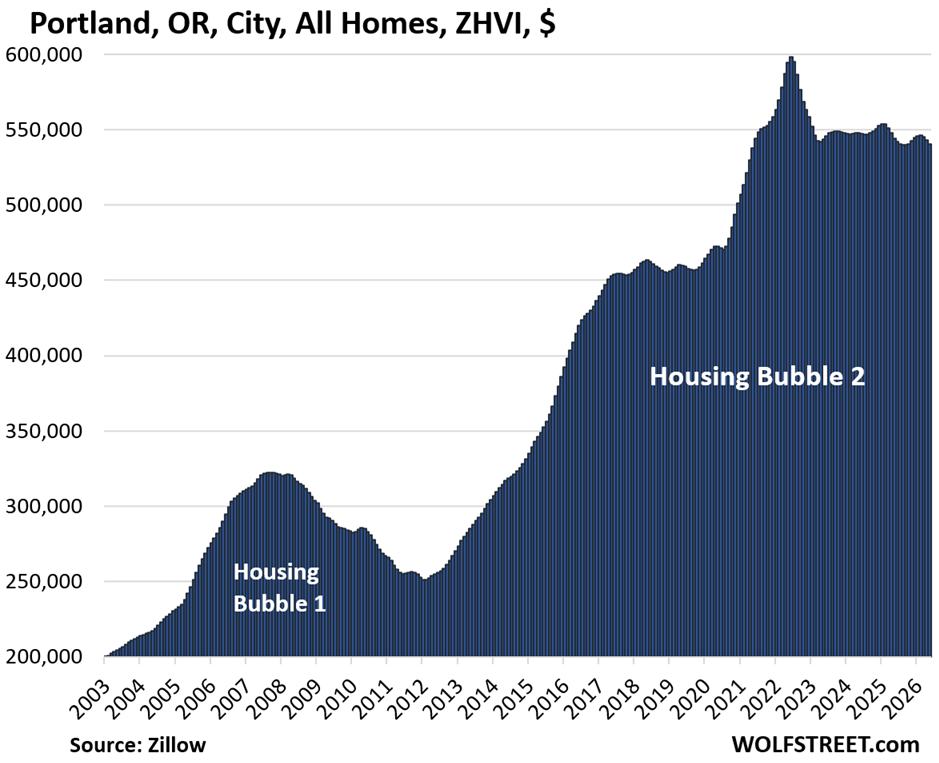
| Portland, OR, City, All Homes, Prices | |||
| From May 2022 peak | MoM | YoY | Since 2000 |
| -10% | -0.5% | -0.7% | 215% |
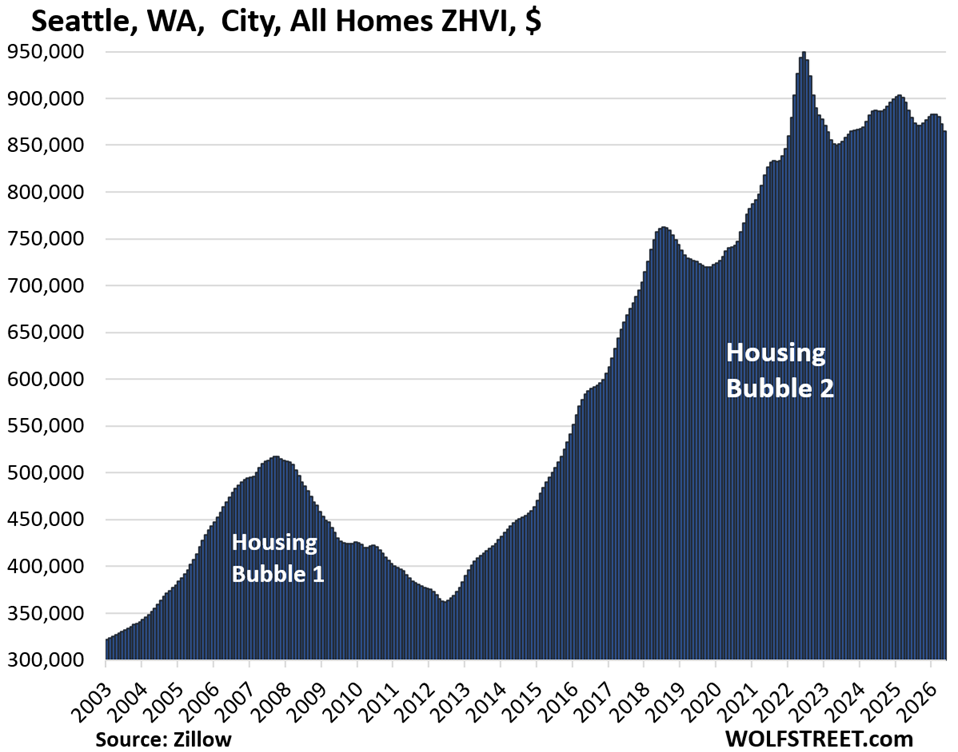
| Seattle, WA, City, All Homes, Prices | |||
| From May 2022 peak | MoM | YoY | Since 2000 |
| -9% | -0.9% | -2.5% | 224% |
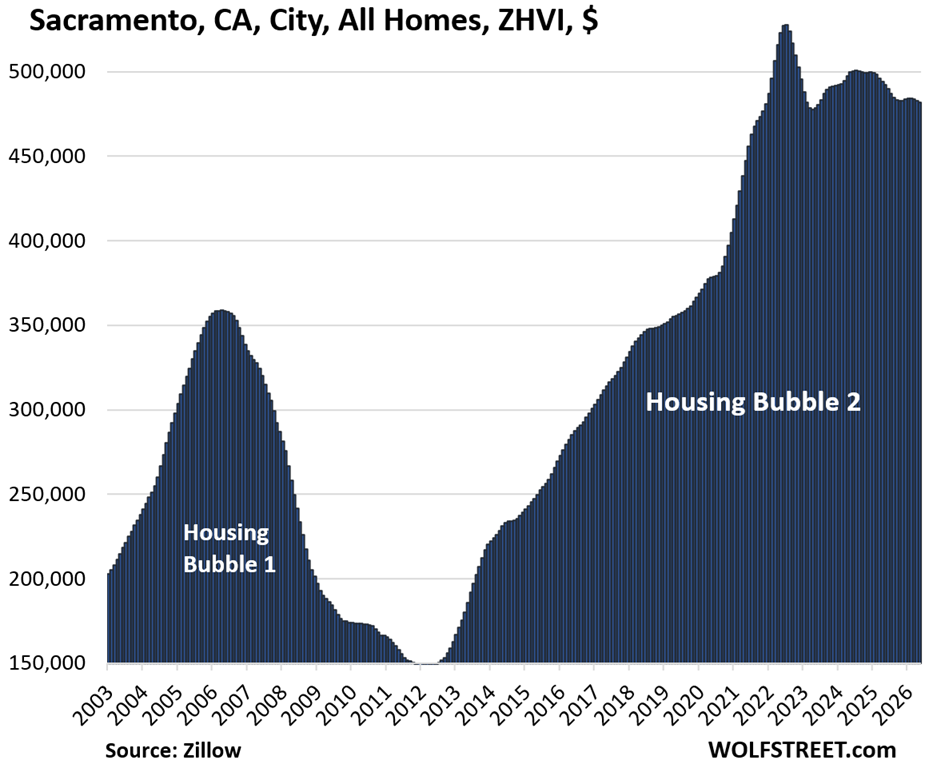
| Sacramento, CA, City, All Homes, Prices | |||
| From July 2022 peak | MoM | YoY | Since 2000 |
| -9% | -0.2% | -2.1% | 284% |
| San Francisco, CA, City, All Homes, Prices | |||
| From May 2022 peak | MoM | YoY | Since 2000 |
| -9% | 1.2% | 7.6% | 232% |
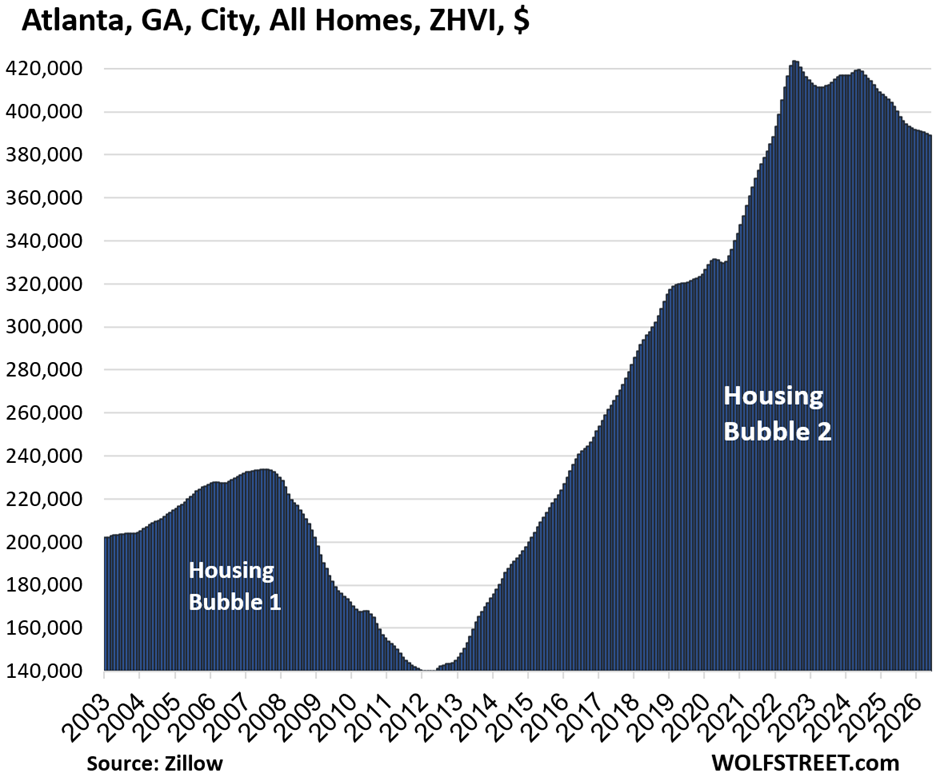
| Atlanta, GA, City, All Homes, Prices | |||
| From Jun 2022 peak | MoM | YoY | Since 2000 |
| -8% | -0.2% | -3.3% | 139% |
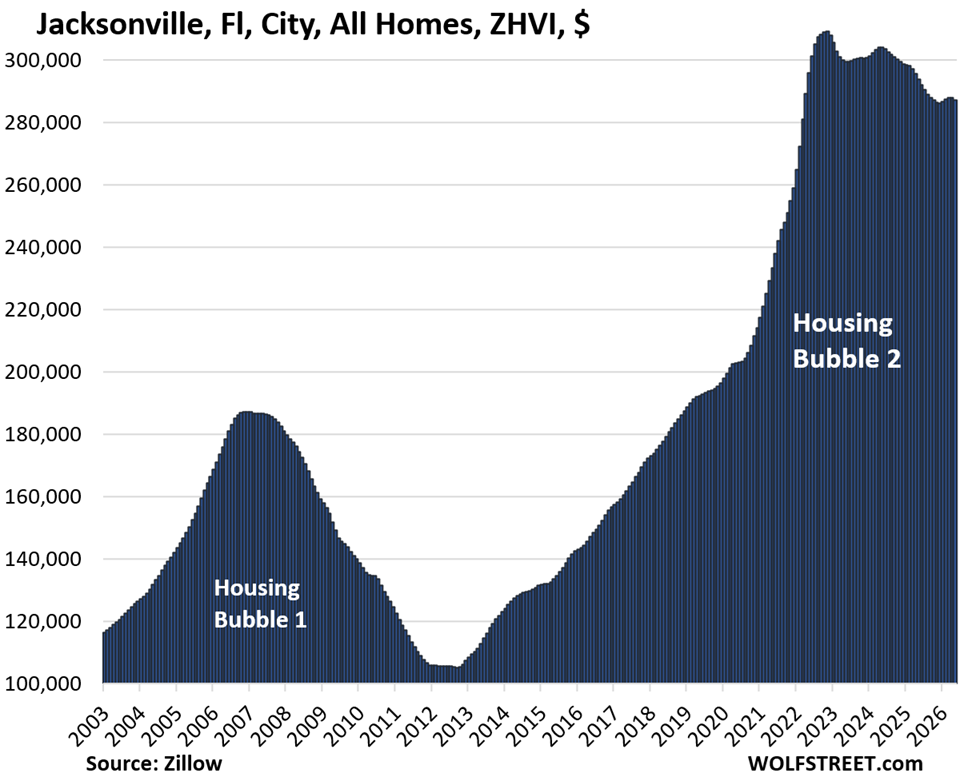
| Jacksonville, FL, City, All Homes, Prices | |||
| From Nov 2022 peak | MoM | YoY | Since 2000 |
| -7% | -0.2% | -2.2% | 203% |
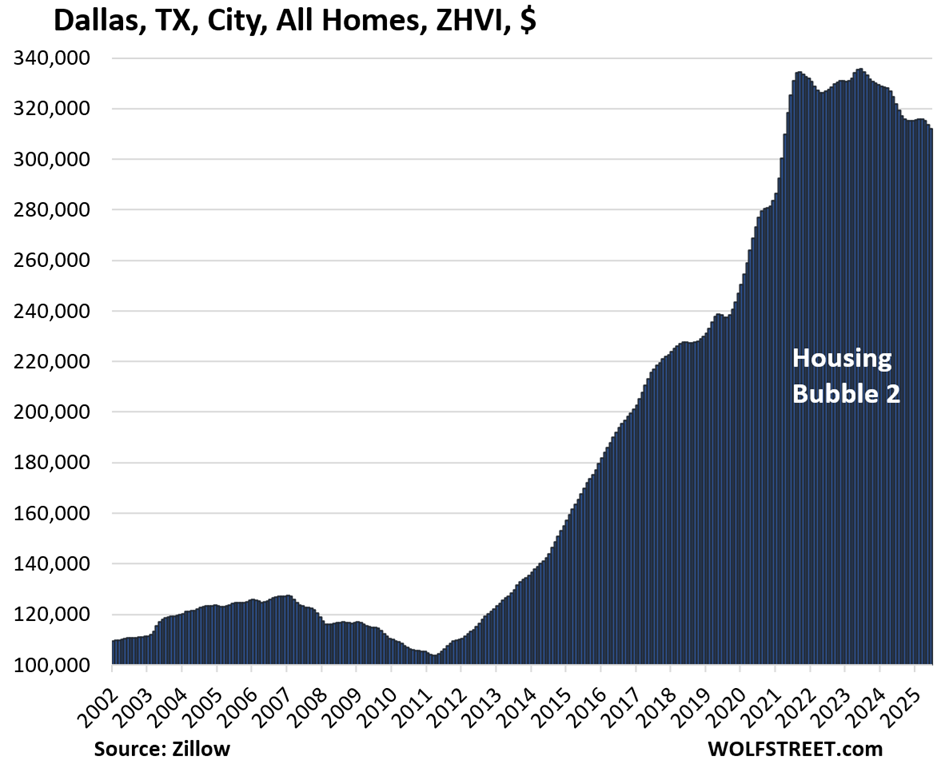
| Dallas, TX, City, All Homes, Prices | |||
| From May 2024 peak | MoM | YoY | Since 2000 |
| -7% | -0.5% | -3.1% | 212% |
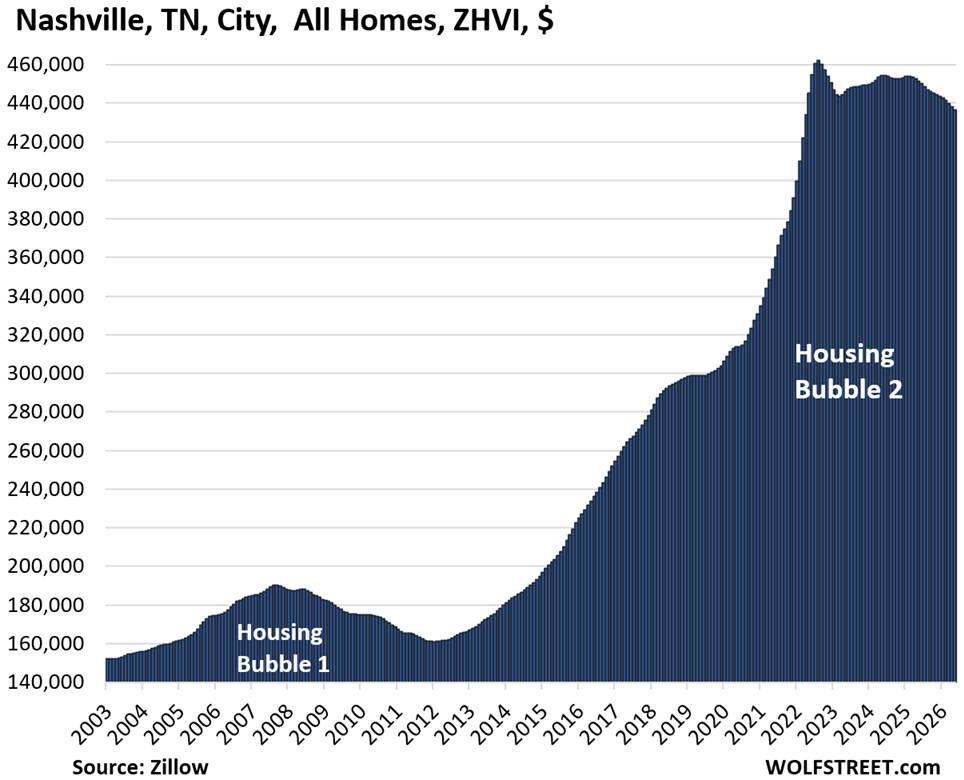
| Nashville, TN, City, All Homes, Prices | |||
| From July 2022 peak | MoM | YoY | Since 2000 |
| -6% | -0.4% | -3.3% | 212% |
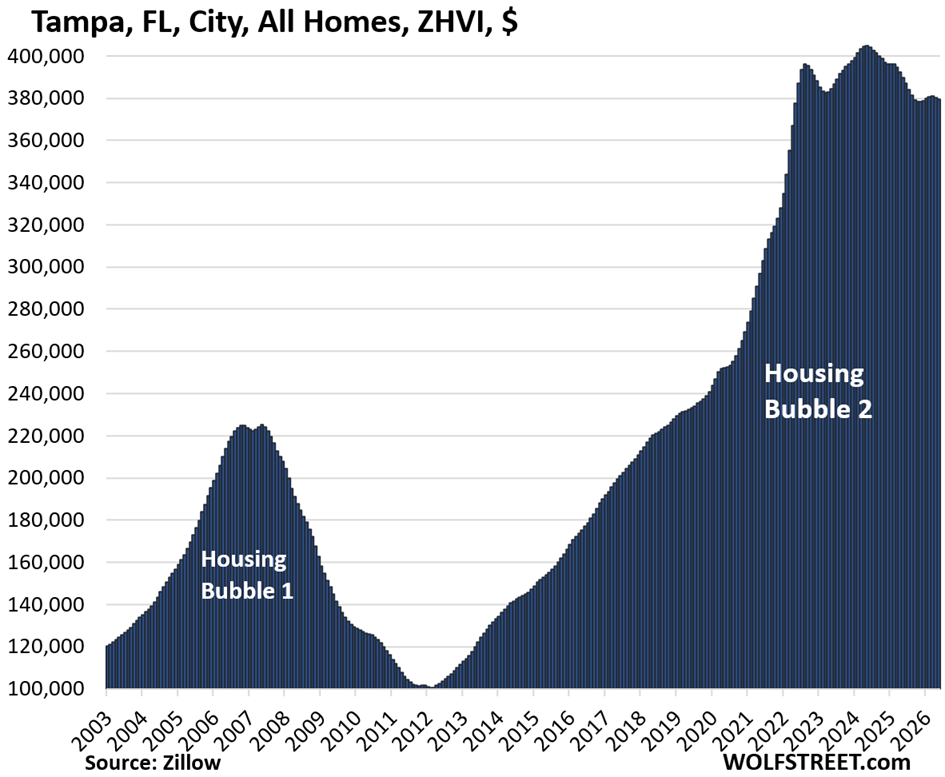
| Tampa, FL, City, All Homes, Prices | |||
| From May 2024 peak | MoM | YoY | Since 2000 |
| -6% | -0.2% | -2.7% | 310% |
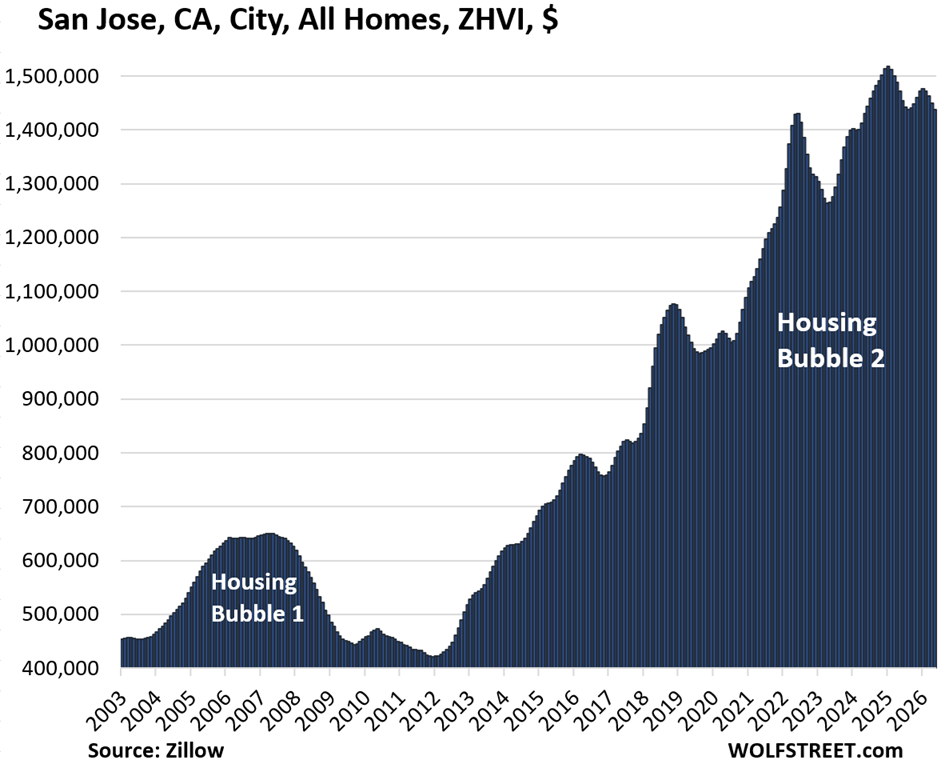
| San Jose, CA, City, All Homes, Prices | |||
| From Jan 2025 peak | MoM | YoY | Since 2000 |
| -5% | -0.8% | -2.2% | 334% |
| Houston, TX, City, All Homes, Prices | |||
| From Jul 2022 peak | MoM | YoY | Since 2000 |
| -5% | -0.4% | -2.7% | 152% |
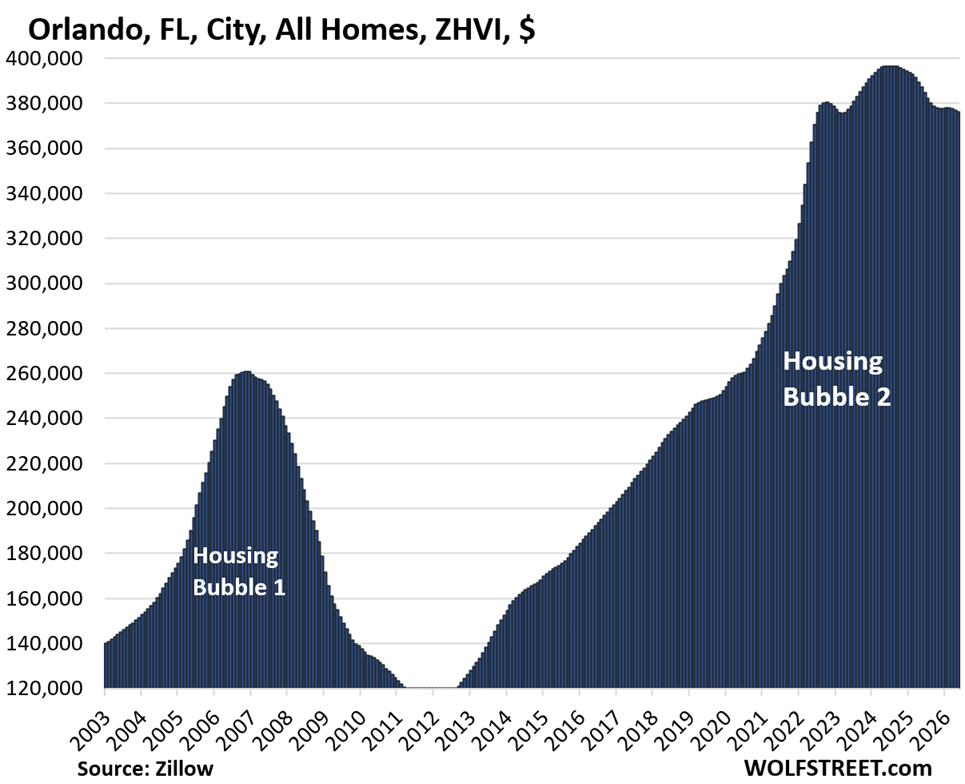
| Orlando, FL, City, All Homes, Prices | |||
| From Jun 2024 peak | MoM | YoY | Since 2000 |
| -5% | -0.2% | -2.8% | 240% |
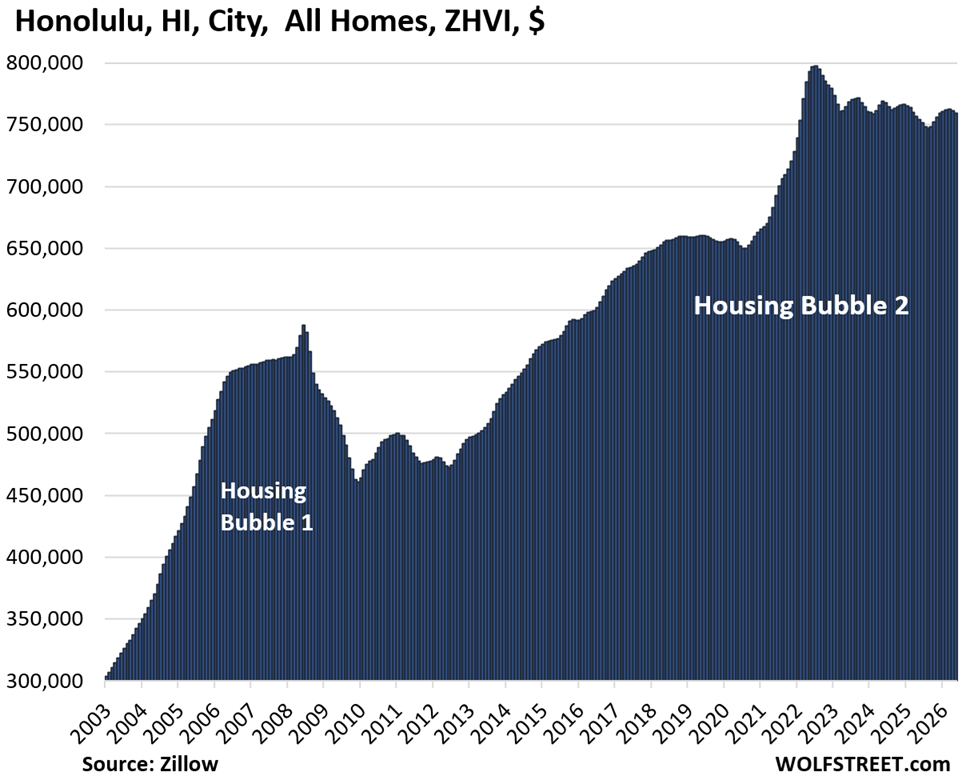
| Honolulu, HI, City, All Homes, Prices | |||
| From Jun 2022 peak | MoM | YoY | Since 2000 |
| -5% | -0.3% | 0.7% | 206% |
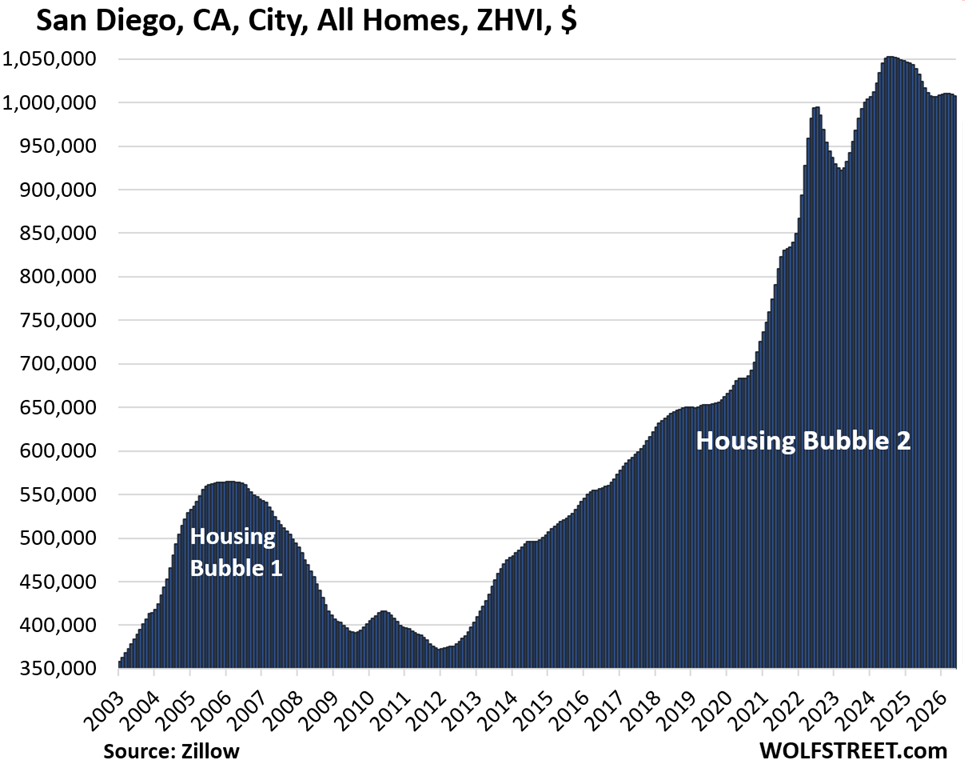
| San Diego, CA, City, All Homes, Prices | |||
| From July 2024 peak | MoM | YoY | Since 2000 |
| -4% | -0.1% | -2.3% | 347% |
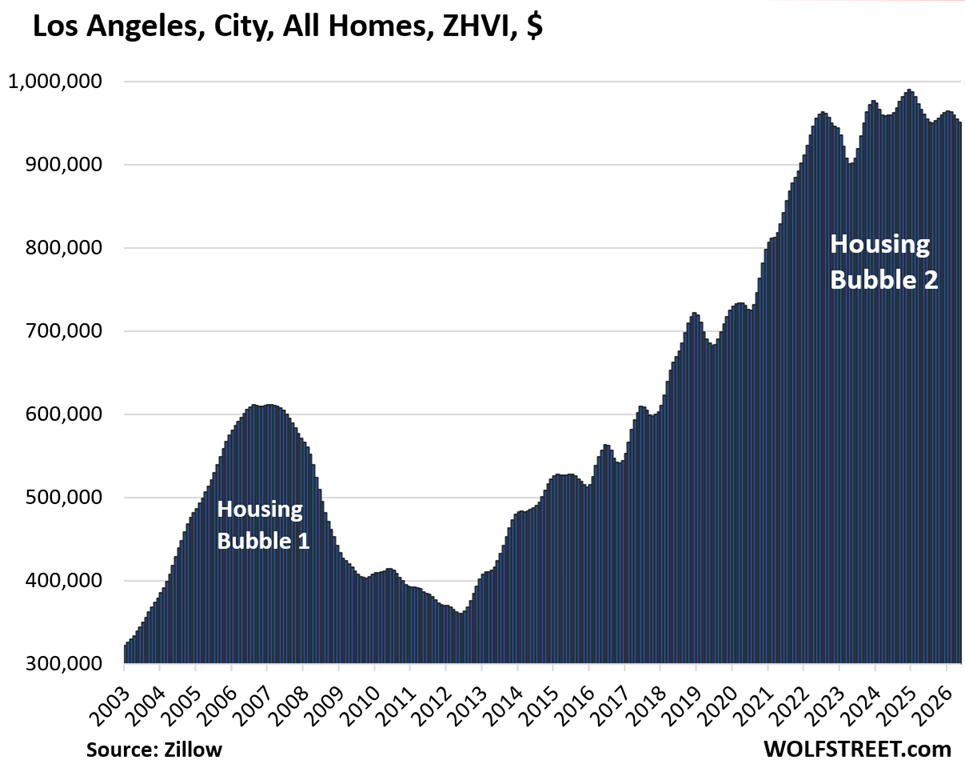
| Los Angeles, CA, City, All Homes, Prices | |||
| From Dec 2024 peak | MoM | YoY | Since 2000 |
| -4% | -0.4% | -0.9% | 323% |
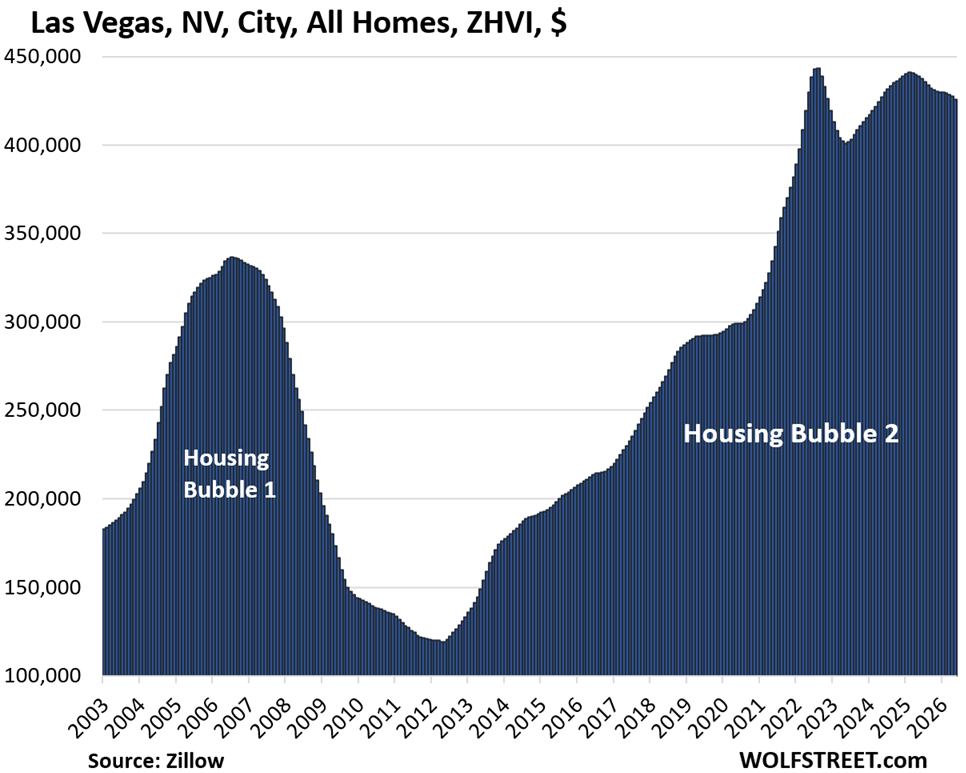
| Las Vegas, NV, City, All Homes, Prices | |||
| From June 2022 peak | MoM | YoY | Since 2000 |
| -4% | -0.4% | -2.9% | 175% |
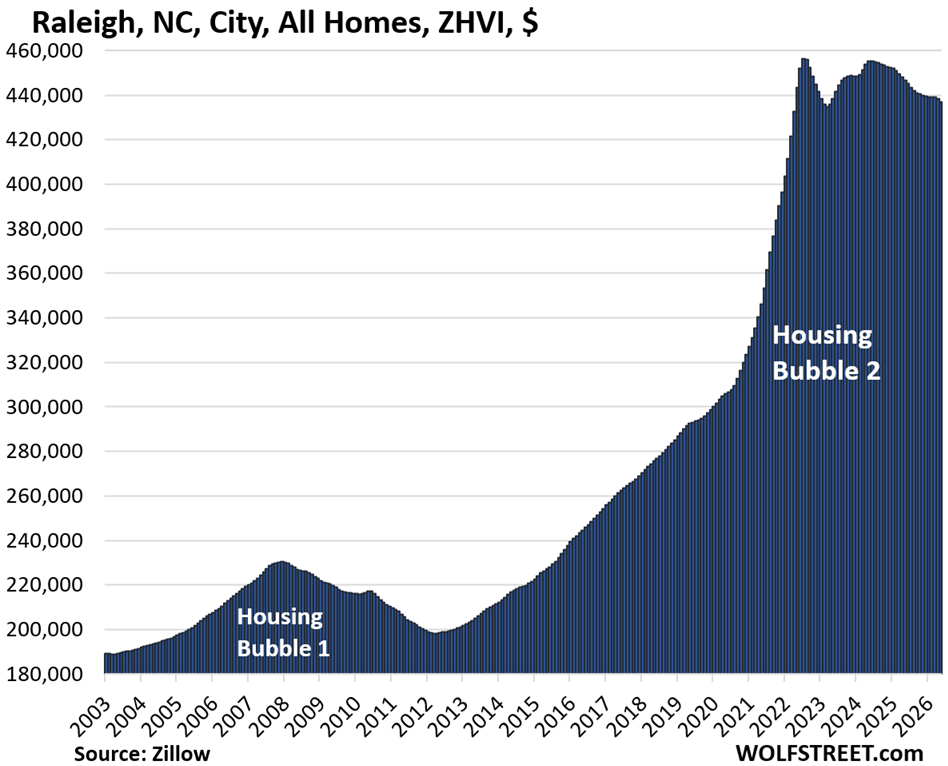
| Raleigh, NC, City, All Homes, Prices | |||
| From July 2022 peak | MoM | YoY | Since 2000 |
| -4% | -0.3% | -2.2% | 148% |
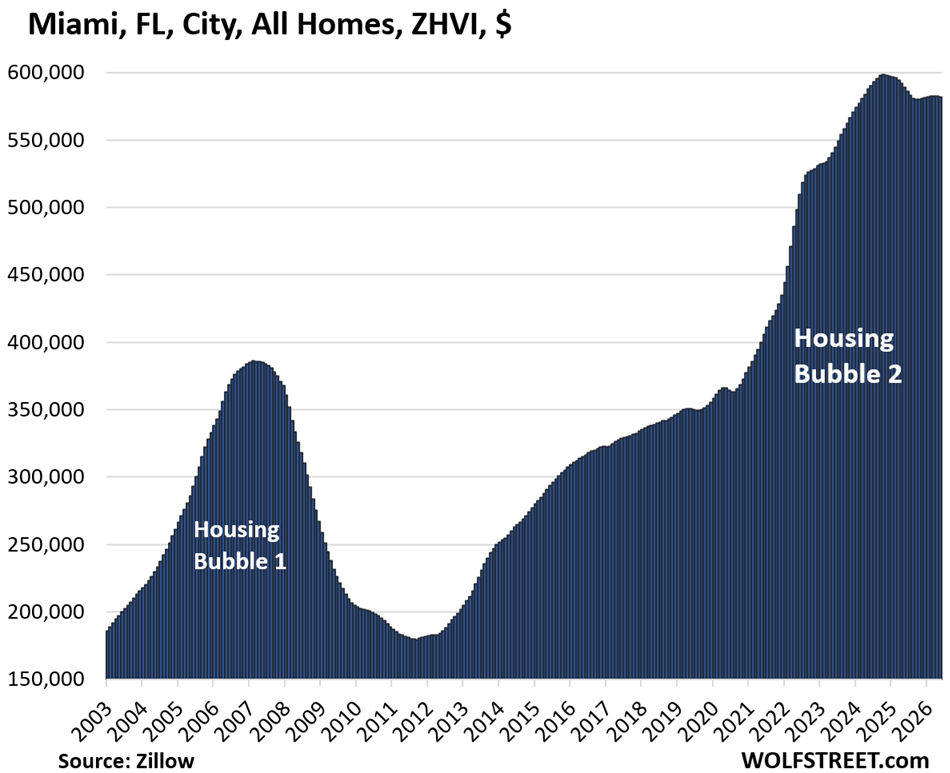
| Miami, FL City, All Homes, Prices | |||
| From Oct 2024 | MoM | YoY | Since 2000 |
| -3% | -0.1% | -1.2% | 342% |
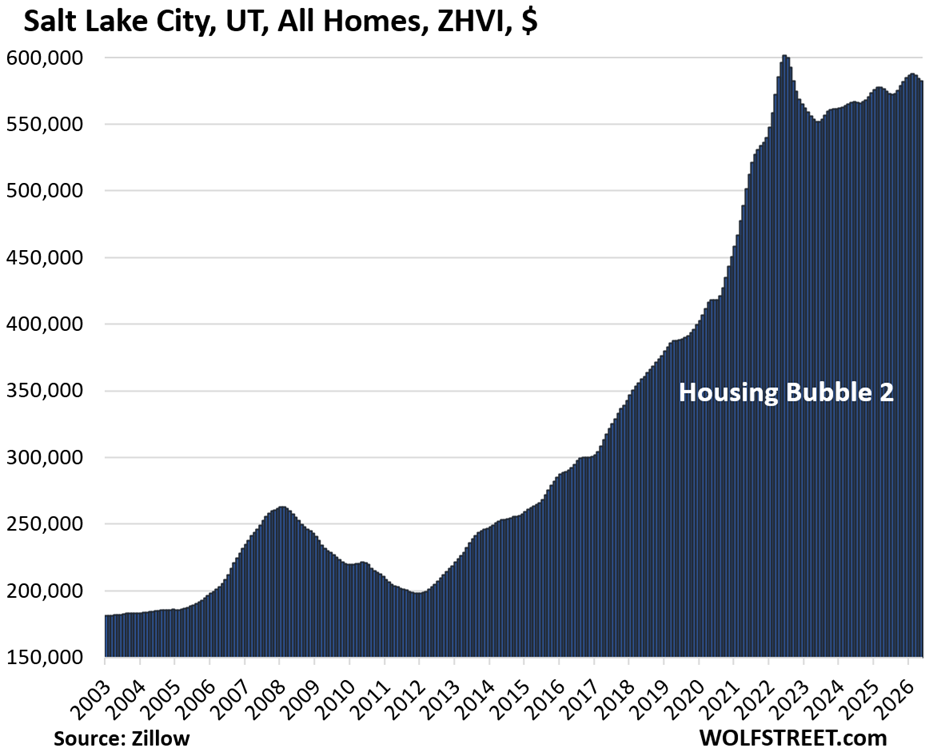
| Salt Lake City, UT, All Homes, Prices | |||
| From July 2022 peak | MoM | YoY | Since 2000 |
| -3% | -0.3% | 1.4% | 239% |
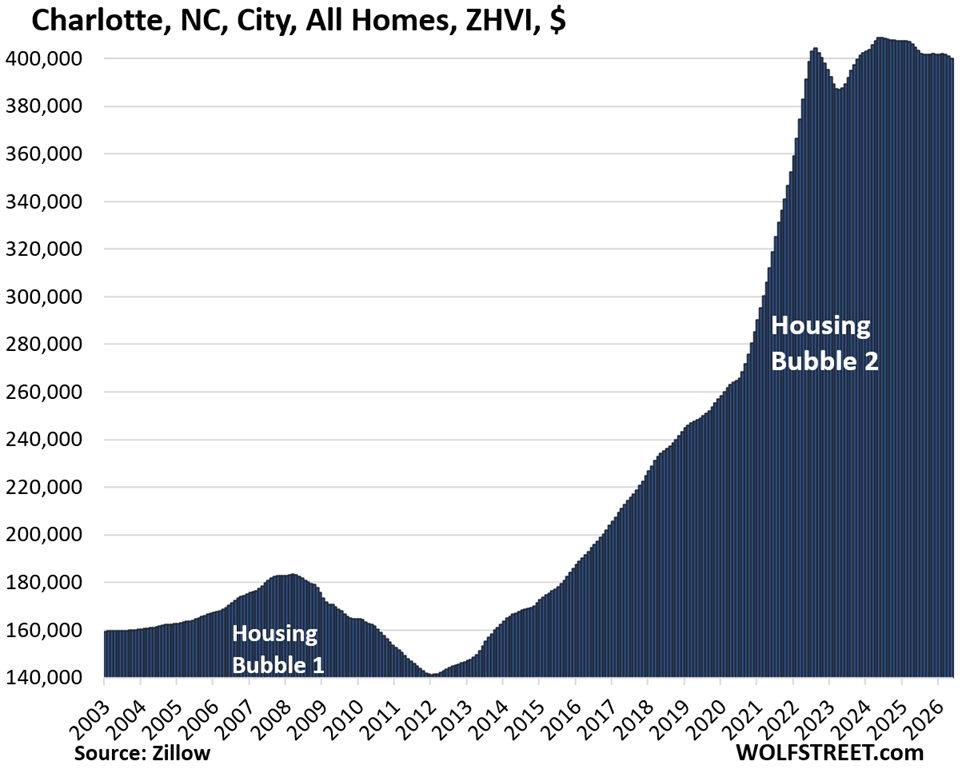
| Charlotte, NC, City, All Homes, Prices | |||
| From May 2024 peak | MoM | YoY | Since 2000 |
| -2% | -0.3% | -1.2% | 167% |
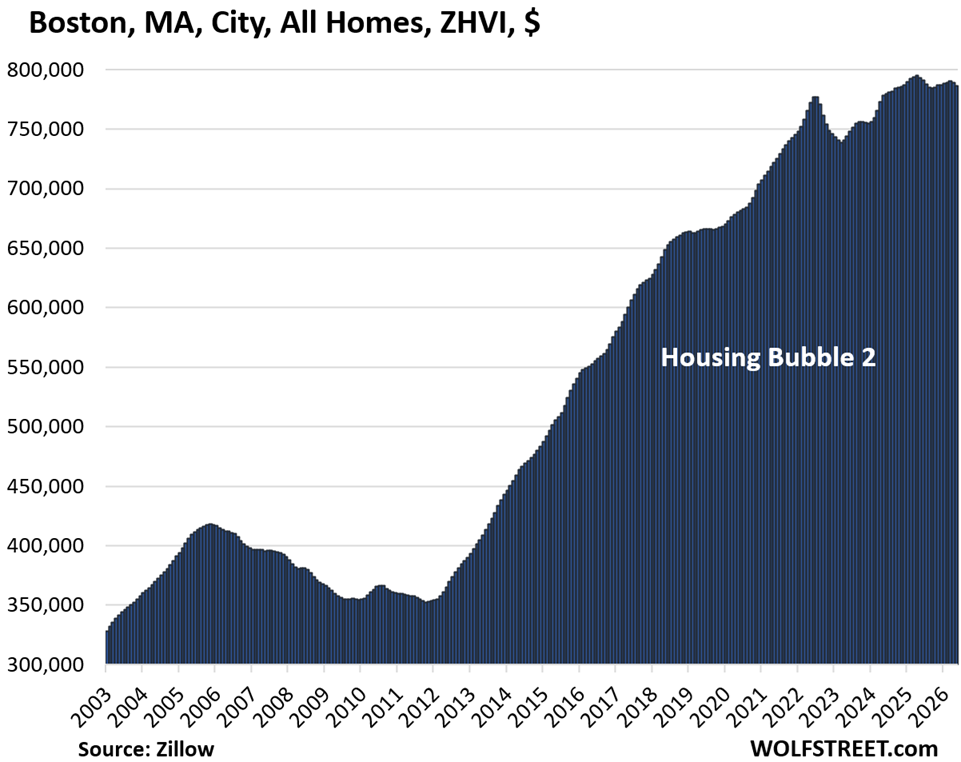
| Boston, MA, City, All Homes, Prices | |||
| From Apr 2025 peak | MoM | YoY | Since 2000 |
| -1% | -0.4% | -0.9% | 264% |
| Philadelphia, PA, City, All Homes, Prices | ||
| MoM | YoY | Since 2000 |
| -0.3% | 0.8% | 271% |
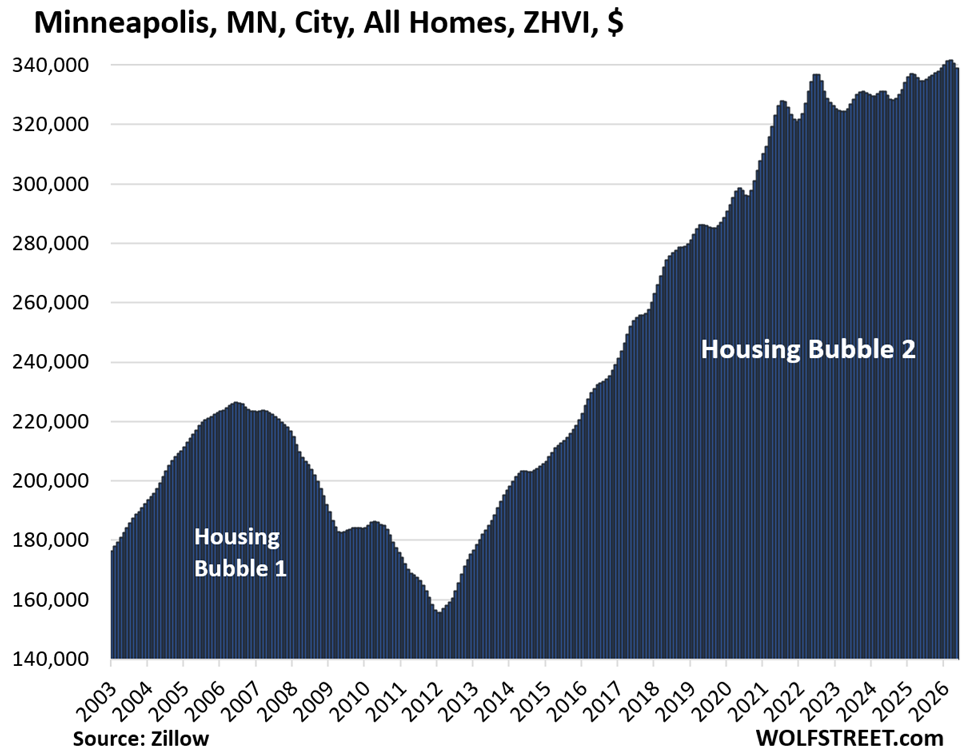
| Minneapolis, MN, City, All Homes, Prices | ||
| MoM | YoY | Since 2000 |
| -0.5% | 1.2% | 195% |
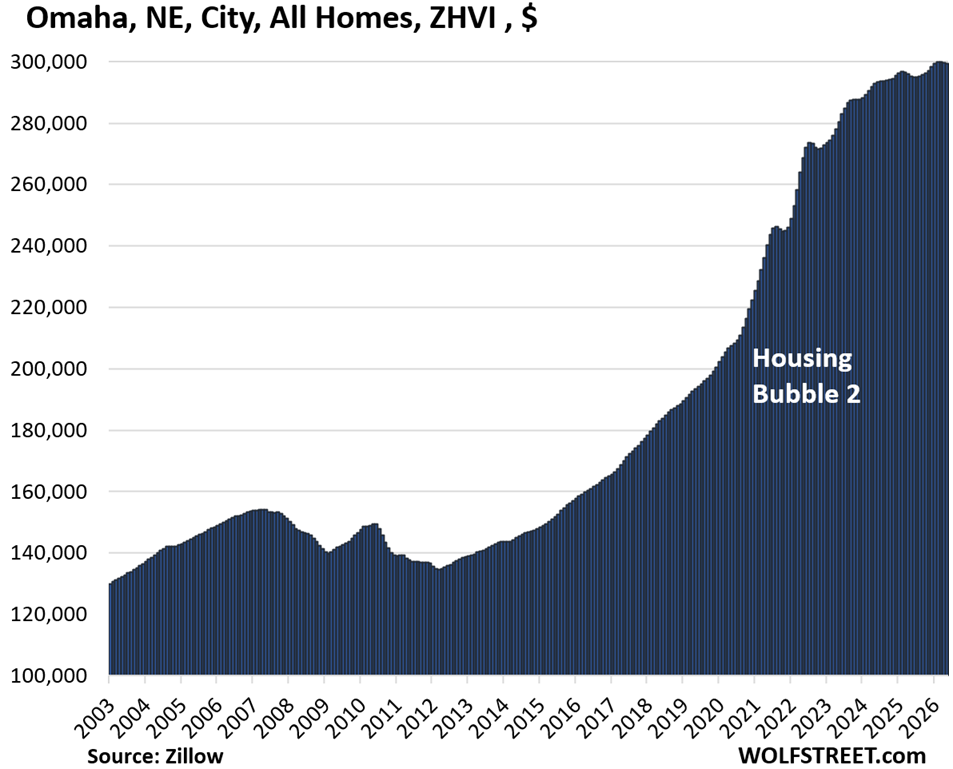
| Omaha, NE, City, All Homes, Prices | ||
| MoM | YoY | Since 2000 |
| -0.1% | 1.4% | 151% |
| Chicago, IL, City, All Homes, Prices | ||
| MoM | YoY | Since 2000 |
| 0.2% | 3.5% | 117.2% |
| New York City, NY, All Homes, Prices | ||
| MoM | YoY | Since 2000 |
| 0.0% | 4.2% | 240% |
In case you missed it: What Homebuilder Lennar Said about the Tough Housing Market: Average Sales Price Down 24% from Peak, back to 2017
Enjoy reading WOLF STREET and want to support it? You can donate. I appreciate it immensely. Click on the mug to find out how:

![]()
31 cities lower highs. 2 new all time high: Chicago and NYC,
1W SPX: June 15 a lower high. It might flop this week, or next.
Very useful graphs. Fremont in bay area should be added
It’s too small. Only the four big ones are included (San Jose, San Francisco, Oakland, Sacramento). The criteria for this lineup are big and expensive.
I have other lineups where the size range is much wider, and Fremont is mentioned in that one, but without chart because condo prices dropped by only 14%, and the minimum drop required for this lineup was -15%:
https://wolfstreet.com/2026/05/25/oh-dear-condo-prices-already-dropped-by-15-to-33-in-24-bigger-markets-some-back-to-where-theyd-been-20-years-ago/
In terms of bubbles, as we have scene with dot com 2001 housing 2008 then covid 2016 what effect if and when will the ai bubble have in San Francisco. So much condos where built for this production
Cmon Raleigh, you can fall more!
🎢 Need that sucker to fall.
These houses are in terrible shape with Lowe’s and Home Depot’s on every corner.
Pick up a hammer people. Haha
Sorry, this isn’t 2008.
The number of foreclosures won’t create anywhere near the same downdraft as in 2008 for most places.
No it’s not 2008 the price declines are happening with LOW UNEMPLOYMENT and a STRONG ECONOMY.
What do you think happens if unemployment trickles up? Or the stock market bubble bursts?
I agree with Wolf, who posted this below:
“Here’s an example of how it might work out: If in your city the price dips by 2% each year on average for another 10 years, after four years of these kinds of declines, so that’s 14 years of mild price declines, for a total of about 25%, and if over those 14 years nominal wages increase by 30% in total, you’re there. You don’t need to have a 50% price collapse all in one day.”
One of the issues is that Fed hates fast changes, because the losers in those markets end up in the hands of the gov’t, such as failed banks.
Wolf man – every time you release one of ‘these’ articles, I just lol. This one again shows that the U.S. has become a giant bubble factory. $2+ Trillion for a s**t company⁉️ Homes (in places like California) that almost no one can afford?
We are a banana republic on steroids. But life goes on and certain people pretend that this is the new normal.
Do you really think the U.S. is like Honduras, but worse ?
I mean, you can “buy” a crypto coin from the president’s family if you need policy changes, so yea I’d say it’s about as bad.
How does that work ? I happen to need a policy change. Please tell me exactly how I can get that policy change. That would be helpful to me.
1: Reach out and express an interest in buying tens of millions of dollars of newly minted cryptocoins from World Liberty Financial. Receive an invitation.
2: Attend an event at Mar a Lago or elsewhere, where you get to have a meeting with Trump family members or administration officials. Tell them what you want, and hand over that certified check.
3: Wait a month or two to throw off the short-term-memory crowd. Observer your requested policy put into effect, your requested no bid contract approved, or your requested military action occur.
The Trump family brought in over $800M in 2025 this way, and 2026 looks to be a banner growth year.
As baseball great Yogi Berra once said, “nobody goes to that restaurant anymore because it’s too crowded.” If nobody could afford those housing prices they wouldn’t sell.
Don’t these prices have to fall a lot more to become reasonable or affordable. Are these high prices destructive to social fabric of society?
How many Mayor Mamdani like figures do we need elected? People who are priced out realize that something is not right or fair with the results of macroeconomic consequences of the system, eg. money printing.
Here’s an example of how it might work out: If in your city the price dips by 2% each year on average for another 10 years, after four years of these kinds of declines, so that’s 14 years of mild price declines, for a total of about 25%, and if over those 14 years nominal wages increase by 30% in total, you’re there. You don’t need to have a 50% price collapse all in one day.
But that’s 14 years of life put on hold. And this type of adjustment is not a certainty with the Fed’s constant machinations to prop up the stock market.
The costs on young people and young families – along with the incredible amount of stress – is too exorbitant. And, as a society, there will be a huge bill to pay in the future.
You can and should complain to the Fed about that. You should advocate for very high interest rates and lots of QT for years to come, which would bring down home prices much faster.
What I outlined is just one of several ways of how this might turn out. I know that some people want an instant crash so that they can buy at 50% off tomorrow, but that’s not going to happen. Housing markets move slowly (normally, unless the Fed buys MBS).
There’s no easy way out. You either push the costs onto young people and young families by avoiding rapid prices falls, or you push the costs onto current owners by having rapid price falls.
This is why Trump keeps saying he wants policy that lowers prices while keeping prices high. He’s trying to tell both constituencies what they want to hear.
Young families and first-time homebuyers are not represented by lobbying firms in DC. That’s all you need to know about their lack of power.
In today’s America, you are either organized or you are powerless. The organized use government to take from the unorganized.
In this case, the elderly (AARP), the Realtors, the real estate investors, the NIBY crowd, and the banks lobbied for decades to enact policies that would push up housing prices. Because they were organized, they got what they wanted. There was no organized opposition other than some internet intellectuals worrying that this might be bad for society.
@Dan high home prices are not the only reason society is changing, young adults are not getting married as often as they did in the past and are having a lot less kids (the single 37-year-old attorney with a labradoodle does not need – or want to own a 3×2 ranch home in the suburbs). I was at a recent event with over a dozen 60 something Bay Area couples that ALL had kids, but NONE of their kids had any kids (no grandparents in the room). I think Wolf is correct in that without the massive numbers of foreclosures related to “liar loans” (as shown in the “Housing Bubble 1” drawings above) we will probably see small slow declines for years as people keep getting small raises every year to eventually get the price to income ratio back closer to the historical average.
A lot of real estate guys who have lots of homes in their portfolio say the same ie come what may prices wont crash but a no appreciation for few years till the wages catch up
I can see why do they say this as they are on one side of the trade
On the other side people who want to buy think prices need to come down a lot and will come down
Amazing graphs. Every picture tells a story X 10. A ways to go yet, but slow price declines across many markets beats the GFC collapse for sure. Remember jingle mail? Hate to see that again.
Off topic, but with the fed meeting on Wednesday, I can’t think of a good reason why they wouldn’t raise rates.
That would be a hoot if the Fed springs that kind of surprise hike on the market.
But that’s not going to happen. They might talk about a rate hike though.
Gather round kids!
Camp Master Warsh wants to tell you a scary story!
“Boo Boo 👻, there once was a mean man who raised rates!…”
Not under Camp Master Warsh, not ever!
😂
They should raise them today, it would be a perfect way for Warsh to start his term, showing strength as a contrast to Powell’s weakness.
But it won’t happen – sadly I just don’t have the faith in the Fed that some here do.
One good reason for the FEd to not raise rates is the reason that seems to dominate their policy: maintain strong employment.
I dont see lot of correction in Nashiville TN.
Is it because of ORACLE moving to Nashiville news?
why it is holding up after all run up in Pandemic.
Typo Nashville.
Nashville would go down a lot over time
Prices went crazy and inventory is climbing up with time
In all useless cities prices have gone down. Who wants to live in Texas, Louisiana type of states. Pretty useless states. But in livable states it has even increased. Not great news.
Since when are cities in Texas, Florida, California, etc. “useless?” Since when are ANY cities “useless.”
It seems we are getting conflicting information in the freak show otherwise known as the housing market. Wolf’s analysis seems to indicate price drops in certain markets/cities. The New York Post has a recent article showing that
“The median cost of a home in the Golden State reached $930,260 in May, a 2.3% increase from April and a 3.1% increase from the same time last year.” They also state that the median price in the Bay Area for a home that month was $1.45 million Insanity on steroids. They show their info is from the California Association of Realtors.
What used to be money is now monopoly scrip. What used to be affordability is mow an albatross around one’s neck.
The American dream has now become the American nightmare. What does that say when the median price of a home is close to $1 Million?
It is a freak show, nothing less! Is our money now worthless? $100,000 yearly salary is now poverty level. Prove me wrong. America is toast.
If you talk about a median price from the CAR, or any median price, you need to look at a 10-year chart. The price spikes and plunges month to month. Median prices are a terrible measure. They’re distorted by shifts in the mix. Some is seasonal, some is random. So don’t quote a median price unless you see the chart. I used to use CAR’s data, but it’s useless, prices in major cities can spike and plunge from one month to the next when everyone knows that home prices don’t do that.
Here is an old chart from 2023 when I was still using CAR’s data. Not even a three-month average irons out the spikes and plunges. Year-over-year is useless because part of the spikes and plunges are random, and one month you’re up year-over-year, the next month you’re down year-over-year.