But each market dances to a different drummer, and declines have been far bigger in many markets.
By Wolf Richter for WOLF STREET.
Home sellers have been nudging down more or less gradually the listing prices in many markets, including in the three biggest – Florida, California, and Texas – from the insane highs in mid-2022 when only the sky was still the limit.
The reality they’re now grappling with includes mortgage rates that have normalized, much less buyer demand than before 2022, and accelerating consumer price inflation of likely over 4% in May.
The median listing price of existing homes in May fell by 2.4% year-over-year, the biggest year-over-year decline in the data by Realtor.com, which goes back to only 2017. On a per-square-foot basis, the median price dropped by 2.5% year-over-year.
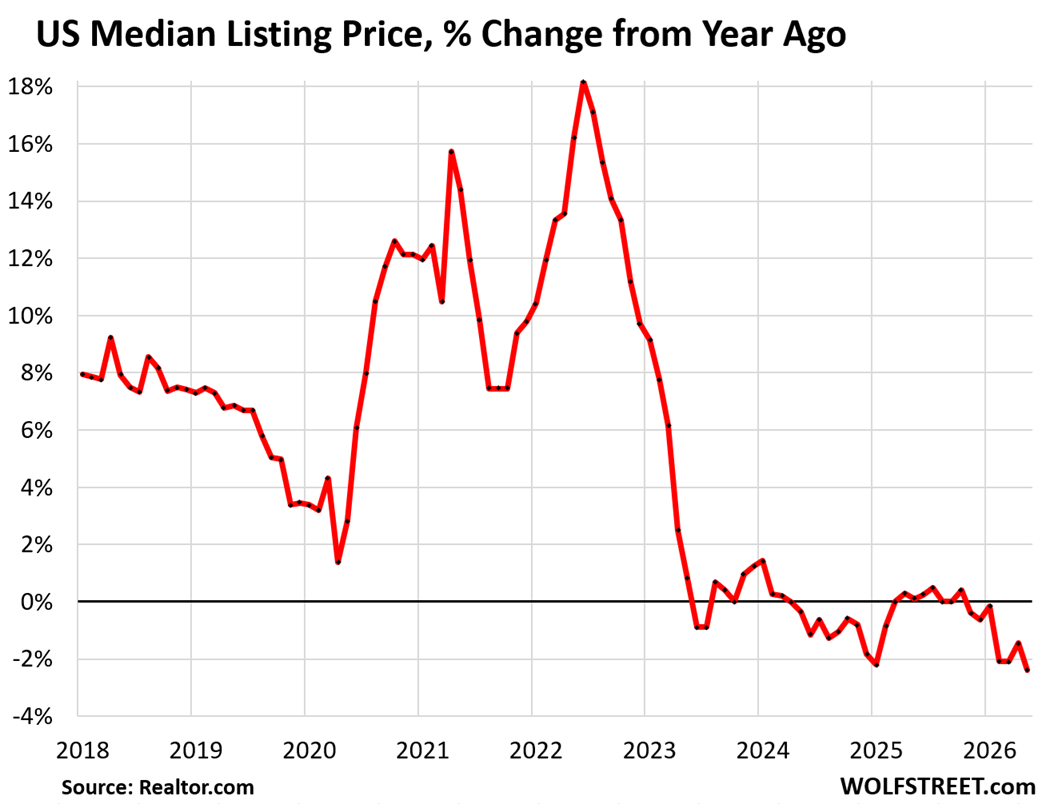
The chart above also shows the mania that reigned in the housing market from mid-2020 through mid-2022, topping out with a year-over-year increase of 18% in June 2022, by which time demand was already plunging, as buyers weren’t playing along anymore, and demand has dropped further since then.
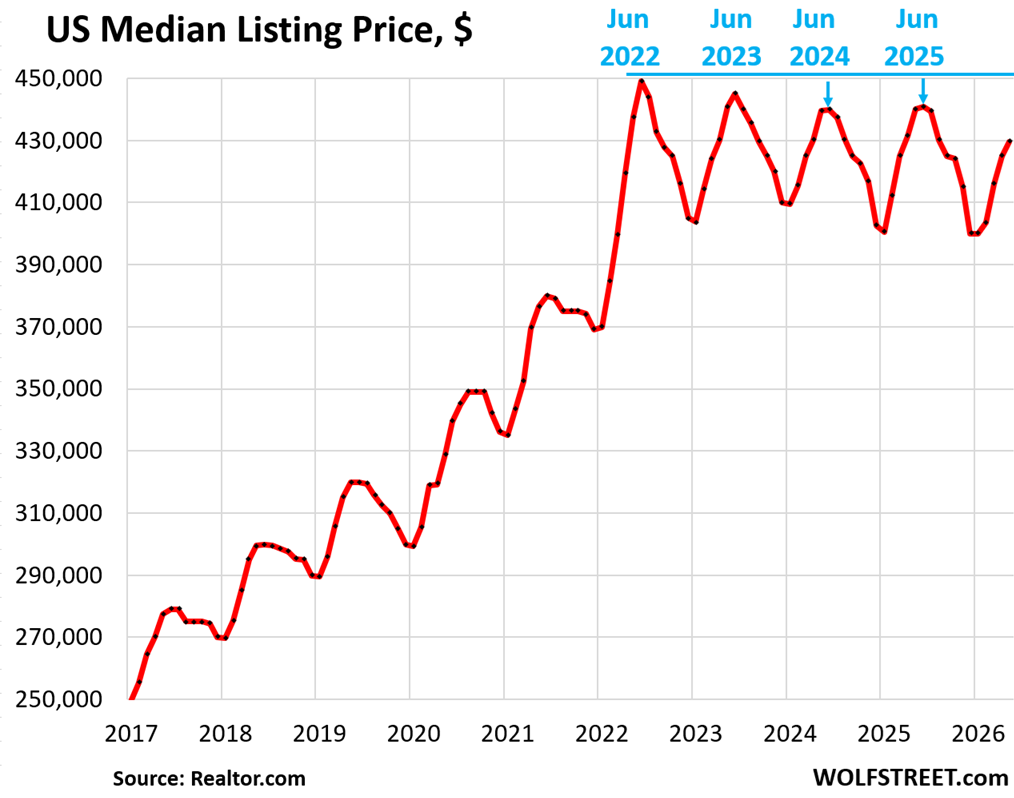
Median listing price in dollars. June marks the seasonal high points for the median listing price in the US. In June 2022, there was a huge price jump from May 2022, and June 2022 marked the absolute highpoint, as shown in the chart below.
But the highest May was May 2023. Compared to May 2023, the median listing price in the US fell by 2.6%, to $429,500.
But each market dances to a different drummer.
Listing prices fell in 35 of the 50 largest metros, and rose in 15. These are the 35 metros were listing prices declined year-over-year:
| 1 | Memphis, TN-MS-AR | -13.0% |
| 2 | Buffalo-Cheektowaga, NY | -11.6% |
| 3 | Austin-Round Rock-San Marcos, TX | -9.5% |
| 4 | Los Angeles-Long Beach-Anaheim, CA | -7.9% |
| 5 | San Diego-Chula Vista-Carlsbad, CA | -5.6% |
| 6 | Phoenix-Mesa-Chandler, AZ | -5.1% |
| 7 | San Antonio-New Braunfels, TX | -4.4% |
| 8 | Indianapolis-Carmel-Greenwood, IN | -3.5% |
| 9 | Houston-Pasadena-The Woodlands, TX | -3.4% |
| 10 | Salt Lake City-Murray, UT | -3.4% |
| 11 | Boston-Cambridge-Newton, MA-NH | -3.4% |
| 12 | Oklahoma City, OK | -3.3% |
| 13 | Columbus, OH | -2.6% |
| 14 | Baltimore-Columbia-Towson, MD | -2.5% |
| 15 | Jacksonville, FL | -2.5% |
| 16 | Minneapolis-St. Paul-Bloomington, MN-WI | -2.5% |
| 17 | New York-Newark-Jersey City, NY-NJ | -2.5% |
| 18 | Charlotte-Concord-Gastonia, NC-SC | -2.4% |
| 19 | Portland-Vancouver-Hillsboro, OR-WA | -2.4% |
| 20 | Orlando-Kissimmee-Sanford, FL | -2.3% |
| 21 | Louisville/Jefferson County, KY-IN | -2.2% |
| 22 | Richmond, VA | -2.2% |
| 23 | Miami-Fort Lauderdale-West Palm Beach, FL | -2.2% |
| 24 | Las Vegas-Henderson-North Las Vegas, NV | -2.1% |
| 25 | Detroit-Warren-Dearborn, MI | -1.9% |
| 26 | Cleveland, OH | -1.9% |
| 27 | Denver-Aurora-Centennial, CO | -1.8% |
| 28 | Nashville-Davidson–Murfreesboro–Franklin, TN | -1.6% |
| 29 | Cincinnati, OH-KY-IN | -1.4% |
| 30 | Milwaukee-Waukesha, WI | -1.1% |
| 31 | Dallas-Fort Worth-Arlington, TX | -0.9% |
| 32 | Providence-Warwick, RI-MA | -0.8% |
| 33 | Riverside-San Bernardino-Ontario, CA | -0.8% |
| 34 | Sacramento-Roseville-Folsom, CA | -0.6% |
| 35 | San Francisco-Oakland-Fremont, CA | -0.1% |
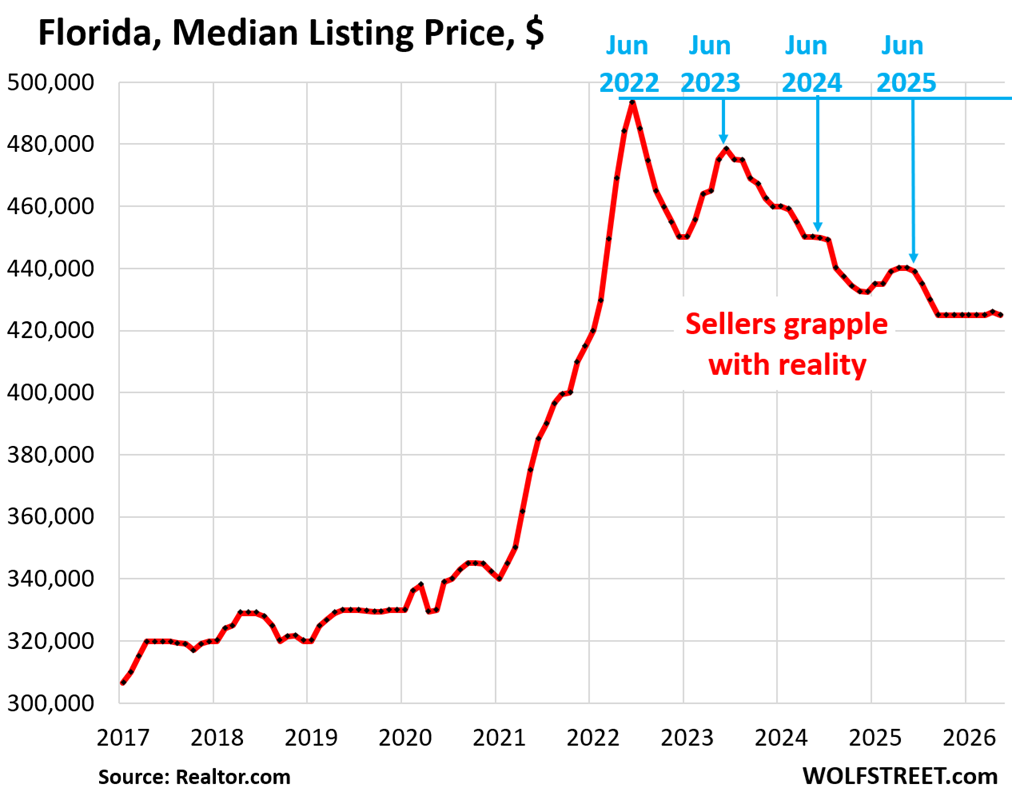
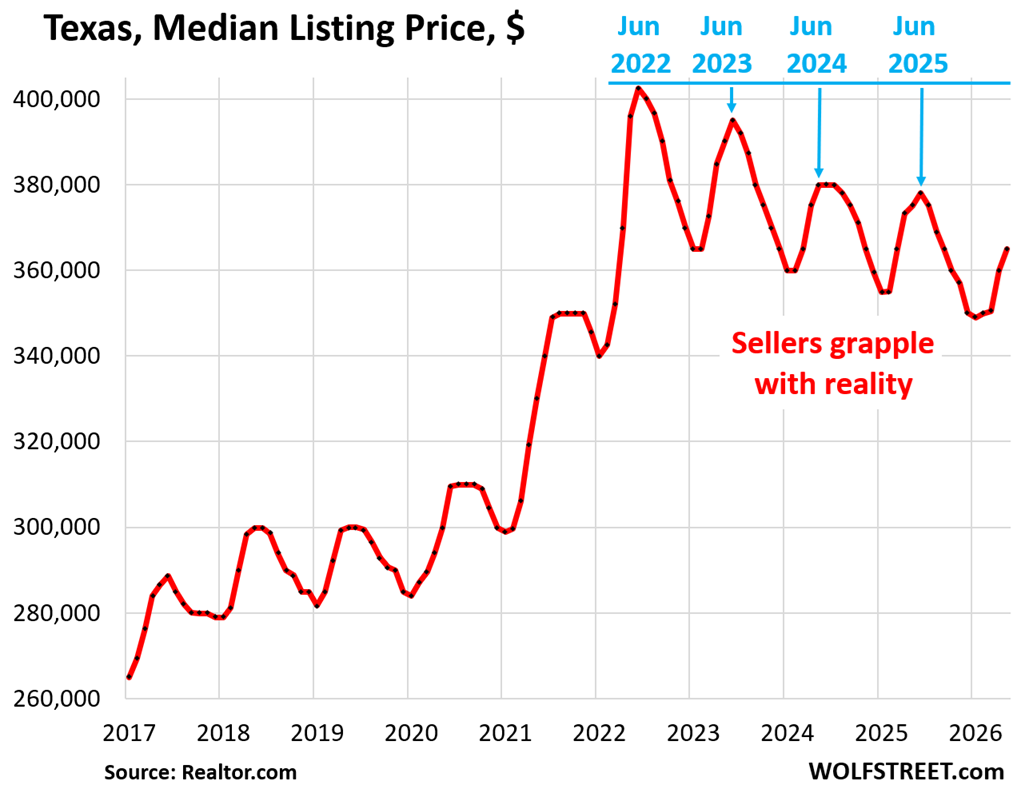
In the three biggest real estate markets by state – Florida, California, and Texas – median listing prices have fallen more than at the overall national level.
In Florida, the median listing price in May fell by 3.4% year-over-year and by 12.2% from May 2022 to $425,000, according to data from Realtor.com.
In Texas, the median listing price in May fell by 2.7% year-over-year and by 7.8% from May 2022 to $365,000. Those prices are very seasonal, with the summer months marking the high points:
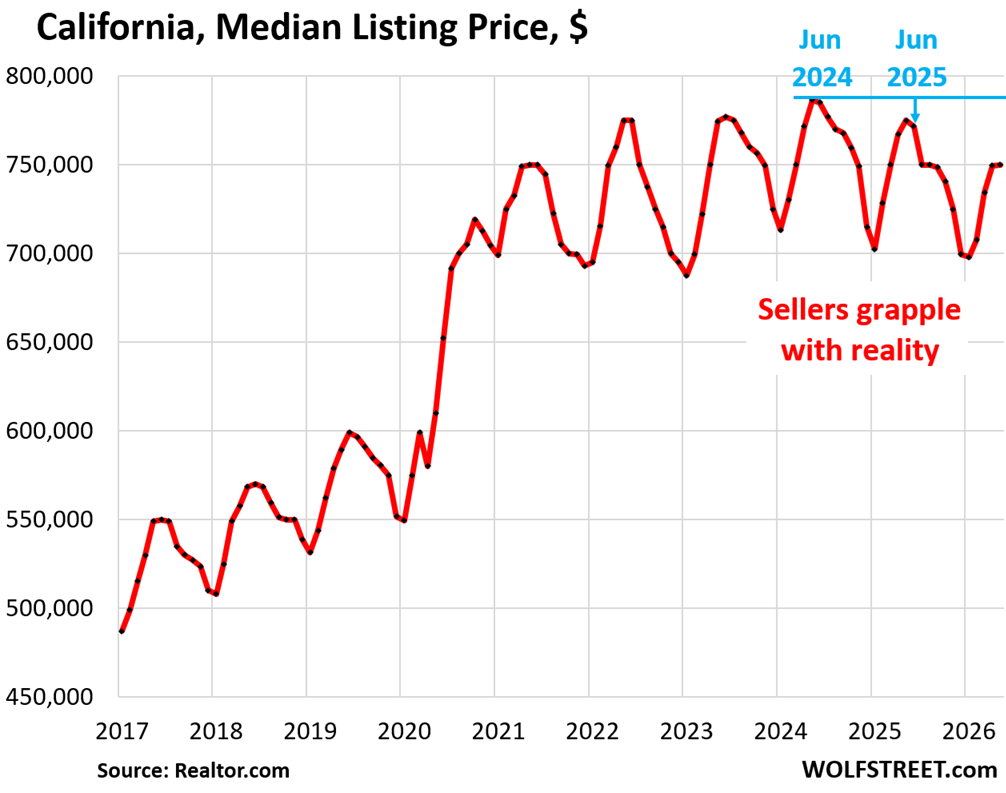
In California, the median listing price in May fell by 3.2% year-over-year and by 4.6% from May 2024 to $750,000, and is back where it had been in the summer of 2021.
California’s high, which occurred in 2024, lagged by two years the highs in Florida and Texas. Every market dances to a different drummer.
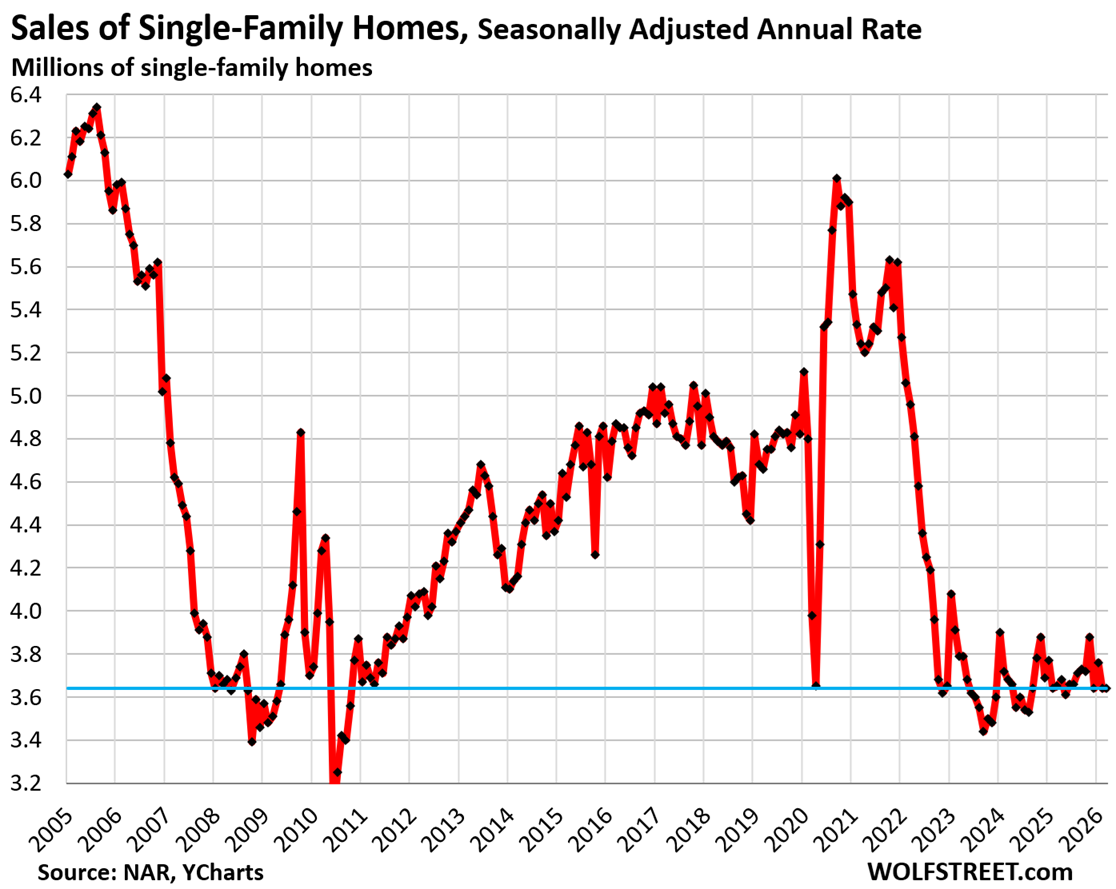
Lower prices stimulate demand. But prices haven’t dropped nearly far enough, and demand for existing homes remains utterly depressed, down by 22% from the same time in 2019 and down by 30% from 2021 (per latest data from the National Association of Realtors for April):
Listing prices are an indication of sellers’ initial expectations, of how sellers see the market, their wish price, so to speak; they don’t reflect actual sales prices derived from closed sales. Homes with too-high listing prices don’t sell and never make it into the actual home sales data. High initial listing prices can also lead to a higher rate of price cuts.
Pulling homes off the market when they don’t sell is now very active. These homes are then either relisted eventually for sale at a lower price, or are listed on the rental market, where they may languish for a while before they’re pulled again, and then are relisted for sale at a lower price.
And if renters do bite, those homeowners become accidental landlords, of which there has been a big wave.
Homes whose listing prices are on target do sell, and the sales prices of those homes then make it into the sales data. The buyers set that target, and they decide whether or not the seller hit it.
Sellers’ price expectations are important because they can stimulate or destroy demand – and demand has been destroyed by too-high prices.
In case you missed it: Housing Unit Growth Far Outruns Population Growth: Vacant Units on the Market and the “Accidental Landlords”
Enjoy reading WOLF STREET and want to support it? You can donate. I appreciate it immensely. Click on the mug to find out how:

![]()
Would be great to see how current real estate dynamics compare to other downturns such as 2008 and savings and loan challenge, etc. Do you have availability to analyze the percentage fall in prices from peak today vs other times, volume of sales, etc.?
Unless something really awful happens, like a nuke going off somewhere, this market downtown won’t be like 2008, where zero-down mortgage loans were going into foreclosure all over the place, especially now with job openings up at 2 year highs.
Gas prices are high, but so are job opportunities. I know someone in tech who quit his job today 2 hours before he was supposed to show up for work.
I thought the same in 2008
I am in tech and in general tech job market is abysmal
In my hood in san Diego one can rent a house for 4k per month but if you want to purchase it is priced at 1 million usd .
Already prepped for the nuke. Figure I would make an offer after the rain washes the fallout into the ground; no worse really than Utah in the 1950s.
IMHO one of the best places to buy right now is north side of Dallas, where builders haven’t stopped building and have 30% margins and are cutting prices 10-18% ( sacrificing half their profits) because that’s better than no profits, while existing homeowners can’t or won’t compete with that price-cutting.
As I told someone moving to Dallas just last week, when moving to Dallas, buy a new home and negotiate at 15% discount.
The Wolf can lead you to the water, but you’ll have to drink it yourself!
@MS: Historically, the job opportunities roll over AFTER the housing prices do. “Jobs were abundant” until the start the Great Recession in 2007… but in many places, house prices started falling in 2005-2006. There’s plenty of excess leverage, it’s just not as exposed yet as NINJA loans were in 2008. As for “buy where they’re still building like crazy”, it’s generally never a good investment to buy where supply is high. Those prices will fall further.
@Jim, there’s a sales volume graph in the article, which basically says sales volume has already crashed to the GFC lows.
Wolf has posted price history graphs for many cities here, many times. To find them, skim the comments (he reposted a few today), or look at other articles listed in the Housing Bubble 2 link on the top left of the site.
Sales volume is down everywhere, and prices in many markets have begun rolling over, but not all. To my eye we are at the equivalent of 2007 in the prior bubble.
The difference is that this time, all the major banks don’t have 35-40 $billion of MBS on their balance sheets. So, while a housing smash is certainly not impossible, it won’t have the same effect on Wall Street. A stock market crash would come from something else – probably from the AI bubble deflating a bit.
The real difference is that the MBS that banks have today are guaranteed by the government; they have about the same credit risk as Treasury securities. So it doesn’t matter to the banks holding these MBS if the homeowners default en masse.
There is still interest rate risk, same as with long-term Treasuries, which is what felled the banks in the spring of 2023, after interest rates had jumped.
What do you think will push housing prices over the cliff ? What will be the catalyst. War over Taiwan ? Investors deciding that Treasuries are too high risk and not buying unless they get higher rates ? Kamala getting elected as president in 2028 ?
“it’s generally never a good investment to buy where supply is high. Those prices will fall further.”
Yep, except homeowners are reportedly already showing up a county commissioner meetings about the supply problem, and how it is hurting valuations, and thus tax collections. I personally have a lot more confidence that local gov’t will do the right thing.
Sigh,as always,cash buyer desiring minumum of 20 acres and home,still on strike though missed two that were fair deals,realtor screwed me on second one.
My day will come or not,still not going to overpay.
I am on the other side
Sold my property in san Diego with large land and now want to move into a good condo complex
Want to live life then building property and take care of property
I only have few years left like all
While I understand Jon I want acreage to have some goats(milk and butter),a large workshop,a on the move shooting range,gardens,and,when I get the property set up would like a small scale critter foster/adoption home,how I ant to spend me final years,thus,20 acre minimum.
Best of luck with your new digs.
Land has not followed the decline in home values….at least not in my slice of flyover.
OT a bit
Interesting youtube
The Warsh Fed
“A Mercatus Center Discussion with David Beckworth and Tom Hoenig”
Covers topics discussed regularly here such as:
“The fiscal outlook is becoming a monetary policy issue. We touched on how rising government debt could eventually limit the Fed’s policy options and increase pressure to monetize deficits. These fiscal pressures may also constrain Kevin Warsh’s desire to shrink the Fed’s balance sheet.”
Maybe I am an optimist because part of my retirement is in rentals, but if you draw a line through 2017 to 2020 and keep it going to extrapolate until now, it indicates to me that it will start rising soon. We will see.
You wish!
The bubble was forming starting then.
If the bubble pops and you still rent your units, your units may not be able to have many rent increases for a good while.
You can donate to the next generations though, the poors need affordable housing!
😆/s
Jdavis
Which chart are you looking at? Only the first one?? Look at the rest of them. Every market is different.
There are a couple of cities as an example of actual home prices, not listing prices., Click on the links below. You will get to see more of those charts:
https://wolfstreet.com/2026/05/25/oh-dear-condo-prices-already-dropped-by-15-to-33-in-24-bigger-markets-some-back-to-where-theyd-been-20-years-ago/
https://wolfstreet.com/2026/05/22/prices-of-single-family-homes-already-down-10-to-26-in-these-15-bigger-cities-every-market-is-different/
I suspect you are correct, with job openings up at the highest levels in 2 years, we might be seeing the bottom, until baby boomer deaths pick up, which will really hurt all real estate by 2050.
What are you talking about, 2050? The average Boomer is ~71 years old. Most will be gone in 5-10 years. 15 for the lucky ones, and 20 for the extreme cases/youngest of the generation.
The Boomer extinction event is already underway. Advance your timeline by 15-20 years.
Boomers were a large cohort that spanned 19 years. The oldest are dying off, but the largest group was born 1955 – 1964. They are hitting retirement now through the 2031. They are less wealthy than the older boomers, many of whom entered the job markets back when pensions were still offered. The largest wave of retirements is over the next 5 years.
The boomers all wore themselves out riding regular bicycles and using roller skates. No e-bikes or Segeways.
You seem to assume that the average boomer will die at around age 75 or so. Not true. People who live to 70 don’t die on average at 75, most of them live into their 80’s.
And the “boomers” who are now 60, will on average live into late 80’s. There are a bunch of websites that show longevity of people, based on age.
So, the boomers will pretty much die out around 2050. Many authors have predicted a big real estate crash around that time.
And none of this is as optimistic as I am about the healthcare advances that are coming in the 2030’s that will extend the lives of many boomers.
The only thing I know is that I can’t predict housing prices. They always seem high…
But 2017-2020 interest rates were pretty low. Would probably need to take that into account for prices, plus nothing seems to high the logical “bottom” or “top” per a graph
As long as your renters keep paying rent you’ll be fine.
The graph analysis though….interest rates were lower then so your not comparing apples to apples. Home prices are based on people can afford. At 2.75% I can pay significantly more for the same house than at 6.5%. A better metric to track would affordability or required mortgage payment for the median house at current rates versus median income.
You and your housing articles have been on my mind recently, Wolf. You do have a lot if good info, no doubt. I do think that the current housing market is the MOAB (Mother Of All Bubbles). I wish your articles would explore this avenue. Is there proof – hard to say, but the man in the pale-colored house says he wants to keep housing prices high. I have a gut feeling that high-level manipulation is going on in the housing market.
One could say that this current housing bubble is the bubble that never dies, or the everlasting bubble. Bubbles, by nature, are fragile. This one is proving to be a juggernaut.
Markets are local. Look at the two pictures I posted in the comments above in reply to Jdavis. I also posted two links. Click on those to see the individual cities where the local housing market has been deflating with a big hiss.
https://wolfstreet.com/2026/05/25/oh-dear-condo-prices-already-dropped-by-15-to-33-in-24-bigger-markets-some-back-to-where-theyd-been-20-years-ago/
https://wolfstreet.com/2026/05/22/prices-of-single-family-homes-already-down-10-to-26-in-these-15-bigger-cities-every-market-is-different/
But not all markets are that way. Some HUGE markets (Chicago, New York City, Philadelphia, etc.) were still going up as of April. On a national basis, they still balance each other out, the declining markets and the still rising markets. But housing markets are LOCAL, you have to look at local markets.
Here are the 33 largest expensive cities, click on the link and look at the 33 pictures. It will open your eyes about local markets. Some have plunged, others continue to rise, including the big ones I mentioned. Click on it ⬇️
https://wolfstreet.com/2026/05/16/the-most-splendid-housing-bubbles-in-america-price-drops-gains-in-33-big-expensive-cities-april-2026/
Coincidentally I have heard from 3 realtors in the past couple weeks.
The current narrative is something along the lines of, “All the reasonably priced homes are getting bidding wars because nothing is priced low. Then the low stuff sells for higher than the dreams because of (psychology) or whatever.”
Locally I’m seeing the reasonable offerings go under contract nearly immediately. The turds in the 400k-1mil are sitting to be relisted every other month for 6 months now. The 1.5mil and up are sitting for a month or two then selling. The 10mil+ offerings are deadlocked and with buyers.
I’m on the fence. I can move on something now and prices aren’t god awful but I’m not an all cash buyer. Mortgages rates will likely go up and if they go down we have bigger societal level problems. Prices can remain sticky without a recession though. I’d have thought the stock market would have dipped 30% by now. Of course in that timeframe it has shot up 50%.
Rich get richer, poor get poorer.
Interest rates have normalized!!! Not at all there still 6.3/4 to 7. Percent up from 3 percent they need to be 41/2 to 5 percent max and the housing market will rebound period …
You only know QE interest rates. Before QE, before 2009, 6.5% was LOW:
As always, thank you for your tireless efforts with both these articles and being active in the comments Wolf.
And 1000x yes, this is exactly what the masses keep trying to ignore: current mortgage rates are now at a historically reasonable level finally. Judging by the bond yields it doesn’t seem likely they’ll sink much anytime soon either.
Do we have any historical reference for how long the market has to exist within certain interest rate levels before they begin to feel “normal” to the average buyer? I imagine that gradual acceptance/acclimation of modern rates will also play a factor in home sales picking back up eventually, but gladly welcome any corrections needed in my assumptions.
Lol, house prices usually are determined by amounts that can be borrowed that are determined by local income & insurance rates and national financing rates.
Local income for most places is growing pretty slow. Insurance rates is going up, which is bad. Financing seems stalled out, at least in the near term.
So, if rates plummet because the job market tanks (the recent jobs report shows how linked those too are right now)…that might actually suck for a lot of places.
Housing looks like a bad investment from an ROI perspective. At best, the gains were frontloaded during Covid, so we have to wait for inflation, especially wage inflation, to fix things and that will take a looong time. At worst, we get a correction because the labor market got beat up and people can’t service their mortgages.
Yeah, stock market is overpriced, real estate is overpriced.
I expected all of that fall significantly by now too.
Instead, the economy keeps getting juiced, and prices stay high.
In November of 2026, the new Fannie Mae regulations go into effect which will affect all Real Estate lender loans. The whole real estate market will “Blow up” as a result. Only cash buyers, investors and private equity firms like Blackstone will be unaffected by these new regulations. Anyone thinking of selling should do so NOW or face a market that will be illiquid and worse than 2007. Buyers who jump in now will face losses of 30% right out of the gate come November.
I looked up on the Fannie May website for updated info for 2026.
I did not see any new regulations that seemed too radical, But then again, I am not the smartest.
I am curious if you could specify the new regulations you are seeing that would have this impact.
Quick Google search:
In November 2026, two distinct sets of Fannie Mae regulations take full effect: the mandatory use of the Uniform Appraisal Dataset (UAD) 3.6 for all residential appraisal reports and the mandatory compliance with new servicing rules for temporary interest-rate buydowns.
November 2, 2026: UAD 3.6 Mandate
Appraisal Reporting: All appraisers must submit reports using the new UAD 3.6 data standard and forms.
Key Changes: This update replaces the previous “Location” rating with a more detailed “Site Influence” analysis, allowing for 28 specific view types and 20 site influence types reported in plain English rather than cryptic abbreviations.
Documentation: Appraisers must now provide more structured reporting on property condition, including internal structural observations and detailed inspection methods.
November 1, 2026: Temporary Buydown Servicing Rules
Borrower Notifications: Servicers are required to send advance notice to borrowers detailing pending interest rate increases 90 days prior to the payment change when a temporary buydown ends.
Fund Application: New guidelines outline how to properly apply buydown funds in various workout scenarios to ensure compliance and borrower protection.
Note: Other significant condo guideline changes, such as the elimination of Limited Review and the increase to 15% reserve funding, have earlier effective dates in August 2026 and January 2027, respectively.
___
It looks like more realistic appraisals will take away some of what remains of pockets of exuberance, ARM borrowers get notified earlier, potentially resulting in motivated sellers (instead of a long wait for foreclosures when borrowers are hot out of the blue and become delinquent), and condos get more expensive to own, so their price will do the opposite. Condos might be the canary in the coalmine here (as always). Maybe Wolf has an opinion on these regulations and their potential impact?
Nice update Drew.
Good to see a high-effort post.
What are the changes?
MM
The whole industry is in on this scam, so no information is put out to the average consumer who would be considering buying or selling a home. The regulations by Fannie Mae were put in during the Biden administration and carried over to the Trump administration. Trump fired the 4 top incompetent officials of Fannie Mae for the optics value, but left in all the regulations that will go into effect in November 2026. The goal of these regs was to make appraisals more bulletproof to eliminate fraud. But the side effect were regulations that were so burdensome that 30 % of Appraisers have already quit the profession. By November it will be over 50%. They have to complete a 70 page form to complete the appraisal and use AI tools to do regression analysis on many of the fields in the report. The fee structure was not changed to reflect the additional work required (up 300%) . The form requires the comps to be inspected using phony photos (photo shpped) supplied by REALTORS and rely on MLS data which often inaccurate. Also, the form is a boon for lawyers who will be suing appraisers down the road when prices plunge and the properties go into foreclosure.
AI is great for research and coding, but I’ve seen it make some pretty dumb math errors. Regression analysis? Maybe try Microsoft Excel.
Wolf, it might be worth revisiting Consensual Hallucinations?
I believe it is a Consensual Hallucination that housing is worth 2x more today than it was in 2016. Most people’s incomes have not risen 2x, and interest costs are now higher.
It is a Consensual Hallucination that stock prices should be 2-4x historical norms today, relative to earnings, dividends, sales etc. Growth cannot and will not match.
It is a Consensual Hallucination that cryptos are worth as much as a car. Cryptos do so much less!
All of these hallucinations are fed by the extraordinary popular delusion that you can get something for nothing, by simply buying “assets” and selling them later for a higher price.
The delusion is fed by biased media coverage, and it works for a while: rising asset prices increase the credit base and allow borrowing to buy even more assets, pushing the price up further.
But it stops working eventually, and then it runs in reverse. Buyers who cannot afford overpriced houses stopped stepping forward, and prices stopped rising. Investors, facing stalled prices and higher carrying costs, sell to book profits, and prices start to fall. As prices fall, the credit base evaporates. People lose the ability to “just buy more”, and to avoid further losses they sell even faster.
“Humans think in herds; they go mad in herds, while they only recover their senses slowly, and one by one.” (Modernized quote from _Extraordinary Popular Delusions and the Madness of Crowds_ by Charles Mackay – as true today as when written in 1841.)
Thank you! The Madness of Crowds has been my go-to reminder over the past year. The first chapter alone is a must read.
Casual Observer “The Madness of Crowds has been my go-to reminder over the past year. The first chapter alone is a must read.”
All 700+ pages of it?
A problem with “It is a Consensual Hallucination that stock prices should be 2-4x historical norms today, relative to earnings, dividends, sales etc. Growth cannot and will not match.” is that the S&P500 is earning about twice what it was in 2016.
https://www.multpl.com/s-p-500-earnings/table/by-year
If earnings are double then the price should not be up 4x.
Anyway, I didn’t say the price was up, I said the valuations (price to earnings, price to sales, dividend yield etc) ratios were all too high.
Those ratios are all at extremes only ever seen before in 1929 and 1999-2000, just before major declines.
It seems like the housing market has turned from crash bros/gals to a balanced market. Inventory levels are flat. Prices moved lower in many Texas and FL markets from 2023 to 2025. Now they are flat with inventories in FL off of the highs. At least that’s the case in SW FL. Not much to talk about. The fact that Berkshire is buying TM makes me think the bottom is in.
They’re buying a homebuilder, not a seller of existing homes. Homebuilders build and sell homes no matter what the price needs to be. Lennar’s unit sales are up about 30%, after having cut prices by about 25%. They’re running circles around homeowners wanting to sell — and new-home sales have been pretty strong, unlike existing home sales,
I am curious what it is costing the large builders to bring new homes on the market now. It can take years to develop the large “outer burbs” where many of the large subdivisions of tract homes are that the large corporate home builders are selling now. Land has to be acquired, permits and development agreements worked out with governments, streets and utilities put in, etc. It could be five years or more. What kind of rates did the builders lock in to finance the homes being sold now? I guessing they are still making profits now, or they wouldn’t be able to offer all the deals, buy downs, etc. Just not the crazy profits they were making a few years ago.
Lennar has given up about half of its pandemic-era profit margin… so that’s one step right there, a big one. Then costs have come down in various ways. Homebuilders have gone all out, like every company, trying to reduce their costs, including their costs of labor, making systems more efficient, etc. Prices of construction materials have come down from the spike in 2020-2022; more efficient construction methods; more manufactured products; designs that cost less to build; etc. Lennar is going after the affordability market. The land cost north of Dallas really isn’t that big. There’s lots of land in Texas. They talk about it in their earnings calls.
I think FL would be worst hit in due time.
I know a lot of people invested in CA and FL RE and think they are special and this time is different. Who knows.
I’m looking at homes in Santa Rosa, CA and Albuquerque, NM. Homes that are nice and priced correctly sell very quickly. Those that hang on to the pandemic gains sit and gather dust. If the owner bought before the gains, they have more wiggle room. It’s the ones that bought at the peak that are stuck. There’s a home I thought about in Santa Rosa that will eventually sell for a large loss because the purchase price was too much. The owner just won’t accept it at this point.
We sold our Mom’s condo last week. I consider us lucky to have gotten out of it so quickly (sold in the first week).
I am grateful to be out of that market.
The many times answer that all RE is local is just oh so true. Bang on. And not only that, local valuations vary to individual streets and neighbourhoods.
The comment about what an opportunity it is to move to north Dallas because housing prices are tweeked by builders made me cringe. Why would you move there unless you want or need to? Most people move to a place where they already have work….those buyers that need a mortgage, anyway. And if you really don’t want to stay there you rent or buy something that will sell when you can leave. If you are not in need of a mortgage and are a cash buyer you live where you want to live if your finances allow it. In fact, people often buy smaller to locate where they want to live. I have never met anyone who relocates to an area and then hopes to land a job unless they WFH or work away, anyway. And then you can live where you want. Just an opinion and free.
One quick suggestion for buyers. When you go through a place and it checks all the boxes, make sure to also go by there at night….in the very dark dark. A local builder passed away and estate is selling home and property. Someone will buy it from away. But across the street there is a rehabbed volunteer fire hall. Very few call outs so noise isn’t an issue but the lights sure are. The yard is now illuminated by some trillion lumen floods. A jerk built a monstrous home across the lane from my sister in rural Camano Island, WA. They have horrible security lighting everywhere, and everything is wifi controlled by the absentee owners who don’t know how to turn off the alarms, lighting, and when to do so. A smart home for dumb owners. It ruined the hood, actually. People are angry about it.
“north Dallas … Why would you move there unless you want or need to?”
just this last week, it was reported that there are more Fortune 500 HQ’s in Texas than in California.
So, more people need to move to Texas, including north Dallas, than any place else in the U.S. You should see the huge campus that Charles Schwab built on Hwy 114 north of Fort Worth. The freeway building is noticeable, with the state trying to keep up with the growth. I635 in east Dallas, I35E north of downtown Dallas, I35W north of downtown Fort Worth, Hwy 114 north of Fort Worth. I travel regularly, and there is nothing like it in the U.S.
Typically, Texas population doubles every 30 years, so the average house is relatively new, about 30 years old. My guess is that the Midwest has average house age of 60 years old. The northeast must be average age of 80 years old.
There are actually signs in north Dallas telling Californians to not move to north Dallas.
The growth is so robust, I even know a super leftist who is moving back here (who was fired from his last job in Texas for posting anti-Trump posters in the Dallas office). And a family from Sweden too just told me last month.
I am surprised you didn’t know about the Texas growth story.
If you move to Texas too, make sure you get a house with good insulation, like I did. That more than pays for itself in 3-5 years.
And WFH is so 2022. Recent study shows that young people are less interested in WFH than any other age group because they are not making relationships at the company when WFH.
If you are set, good for you, but I moved to Texas for work, and other than the hot summers, it’s worked out pretty well.
Still hoping that Texas secedes. Then we can leave the decrepit, debauched and bankrupt libtard states in our dust.
A slow return to normalcy?
yeah, I think you are on to something there. The predictions of a “crash” too optimistic. This really is different than 2008.
Aging population with high degree of homeownership just not interested in moving.
Dow, S&P 500 erase most early gains and tech stocks tumble
Seattle is not mentioned here (quick search). So, I guess the home prices actually went up ? Do you have a blog post for such cities ?
Not sure about listing prices, but here are actual selling prices:
down 8% from the peak, down 2.5% yoy
I am constantly blown away by many of these charts, including this one for Seattle.
Reminds me of the prehistoric creature, the megalodon. If we are to take the story of the megalodon at face value, it’s a good analogy to today’s real estate market. Most people think great white sharks are huge – they are, but a great white shark is normally 15 to 20 feet long. The megalodon was apparently 50 to 60 feet long, and ferocious at that! 🦈
The current housing market is a monster compared to the last one. Makes the last one look rather tame.
Great to see Buffalo showing America how it’s done. Burn those ill-gotten gains baby, burn!
My read of this article is that we’re experiencing the best-case scenario:
The deflation of house prices is occurring slowly enough so that homeowners aren’t going underwater to the point that it makes sense for them to default on their loans, like in 2008. Plus it is uneven enough, and local enough, so that a narrative doesn’t form about prices falling in the future under the weight of even higher mortgage rates.
We’ll have to wait and see whether these current Goldilocks conditions can continue for another 5 years or so.
Of course, price relief cannot come quickly enough for people who want to buy a home. But with inflation running above 4%, prices that are flat in nominal terms are falling prices in real terms.
I will say another thing holding up sales besides pricing and the rise in insurance is property taxes.
In New Hampshire you can have 2 basically same homes with same land,both decent schools etc. but taxes even though properties twins can be double in difference if not more,adds a whole nother can of worms.I always now when looking at potential home listing first look at property tax,saves me a lot of bother as I just move on if taxes too high.
Your article makes me lmao.
Sure, a guy climbs Mt. Everest and is on the peak – 29,032 feet high. He falters and falls down those last 32 feet. He still ‘higher than a kite’!
So yeah, those minuscule falls in price are quite laughable. I’m in California, so maybe I’m jaded. Most of the homes for sale are near that 29,000 mark. Wake me up when we no longer need oxygen.
California well never be cheap. If you want cheap housing, look in Tulsa, Oklahoma.
If you want to stay in California, check condos in Oakland, you’re just not looking enough. It’s just a short ferry or BART ride from San Francisco. They need your help propping up the market, down 31% from peak and back where they’d been 20 years ago, when wages were a lot lower.
Single-family not as far down, only -25% and only back to 2017:
California is GOING to HAVE TO get their act together. News just came out that Texas is now home to more Fortune 500 companies than California (57 vs 56). You can’t have sky high home prices with corporations saying ‘see ya’ for greener pastures.
And who said cheap homes prices? Not I. I just want reasonably priced abodes. Oklahoma???
Are you relocating Wolf Street Media Empire there? 😂😂😂 “Howdy, Wolf”
You won’t look back on S.F.
I lived in Tulsa for a long time, went to high school there, went to grad school there, worked there, owned a condo there. Nothing wrong with Tulsa if you like Tulsa.
I also lived in Texas for many years, went to college there (Wichita Falls), went to grad school there (Austin).
I encourage all Californians I run into to move there. Housing is much cheaper, gasoline is much cheaper, and the summers are nice and warm. Those two states are NOT full, I promise, despite what locals there will tell you here on this board.