April was another bad dud for spring selling season as supply continued to pile up.
By Wolf Richter for WOLF STREET.
Sales of existing single-family homes that closed in April seasonally adjusted were unchanged from March, at an annual rate of 3.64 million sales, near the very bottom of the deepfreeze range that has existed for the past three-and-a-half years, according to data by the National Association of Realtors today.
Compared to April in (historical data from YCharts):
- 2025: -0.3% (year-over-year)
- 2024: -1.1%
- 2023: -4.0%
- 2022: -26.6%
- 2021: -30.5%
- 2019: -21.9%
- 2015: -19.6%
- 2009: +3.7% (Housing Bust)
- 1996: -7.4%
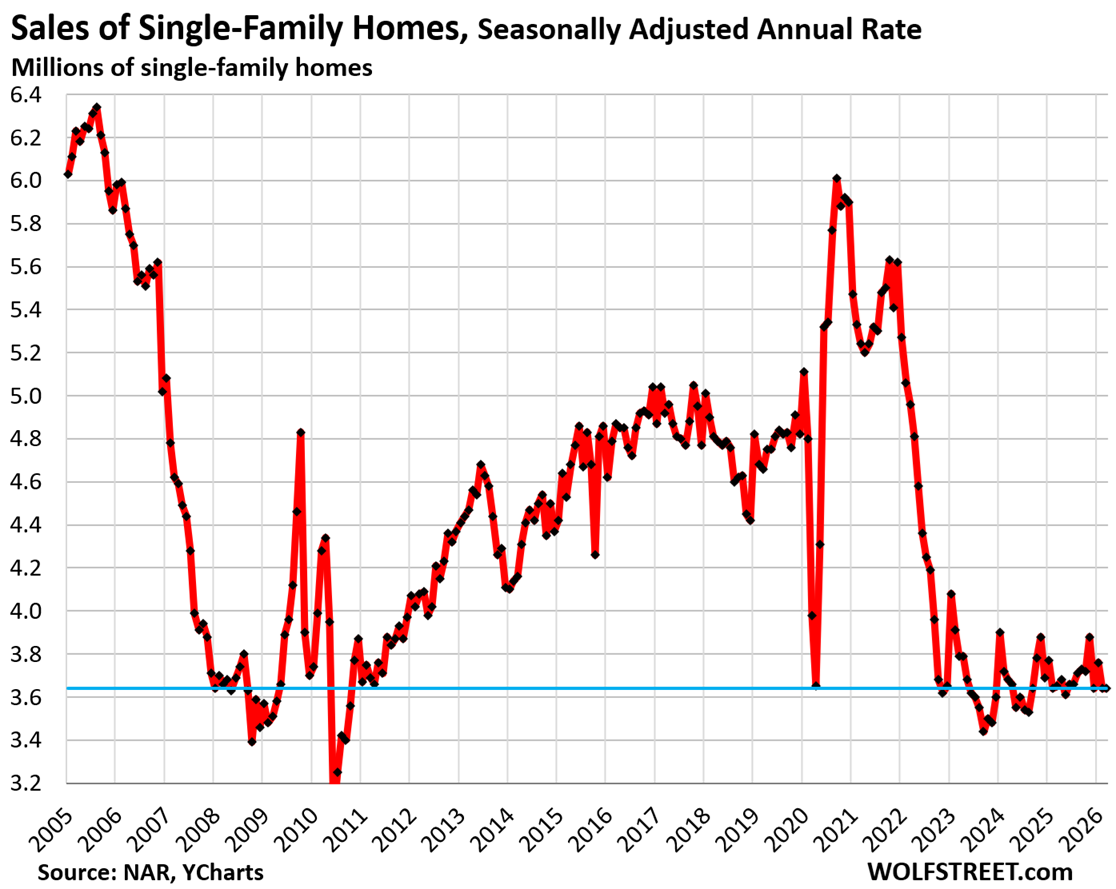
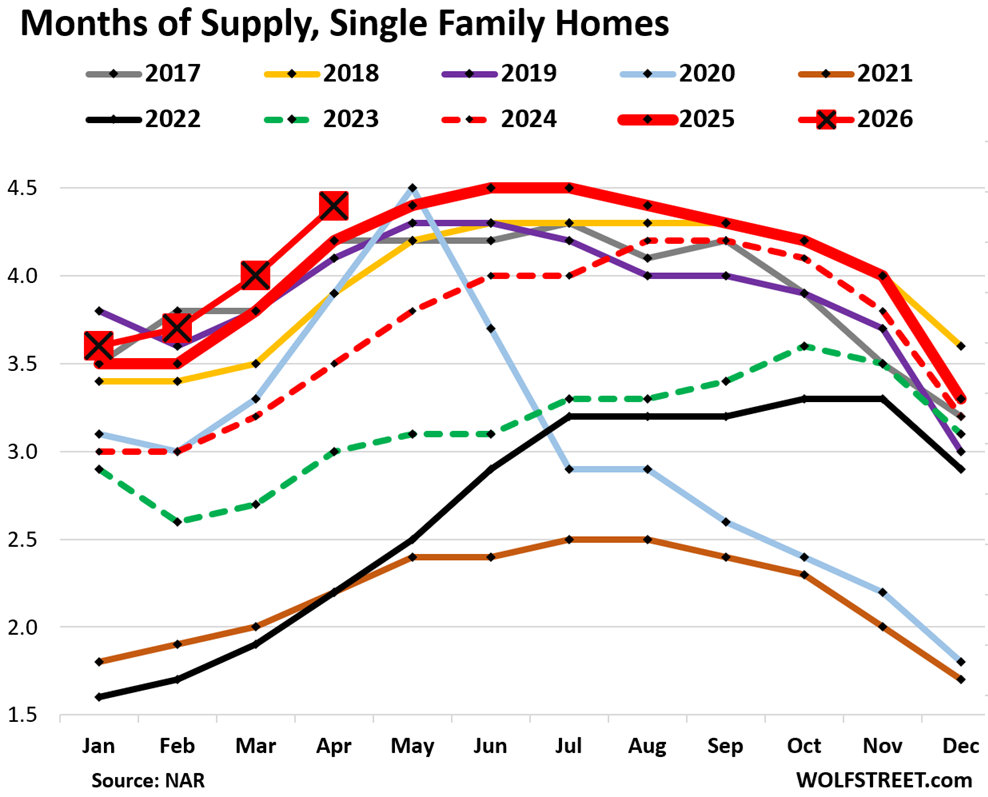
Supply of single-family homes jumped to 4.4 months in April (red line with big red squares in the chart below), the highest supply for April since 2016.
Supply is a function of inventory and sales (demand). Inventory in a vacuum doesn’t matter all that much; what matters is how much inventory there is in relationship to sales, and sales have plunged while inventories have been rising (historical data from YCharts).
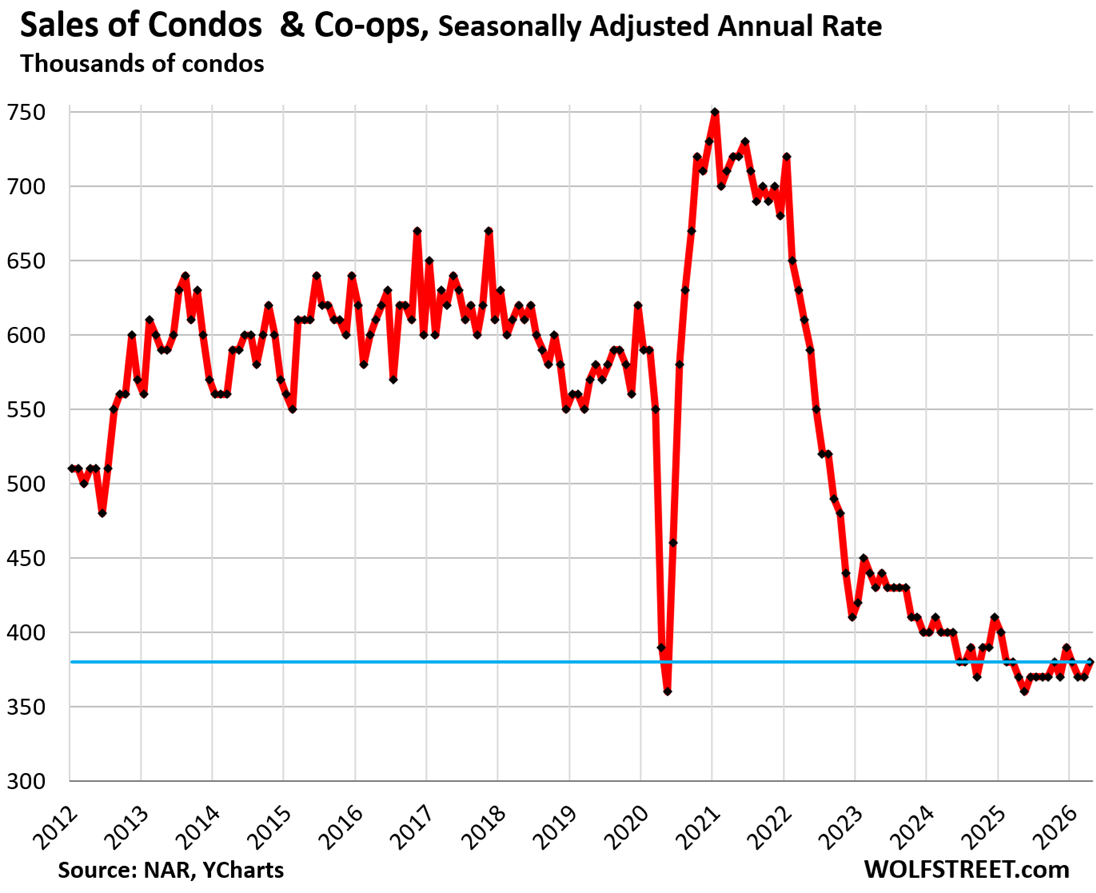
Sales of condos and co-ops ticked up seasonally adjusted in April from March to an annual rate of 380,000, near the very bottom of the data, which go back only to late 2011:
Compared to April in:
- 2025: +2.7% (year-over-year)
- 2021: -47.2%
- 2019: -33.3%
- 2012: -25.5% (first April in the data series)
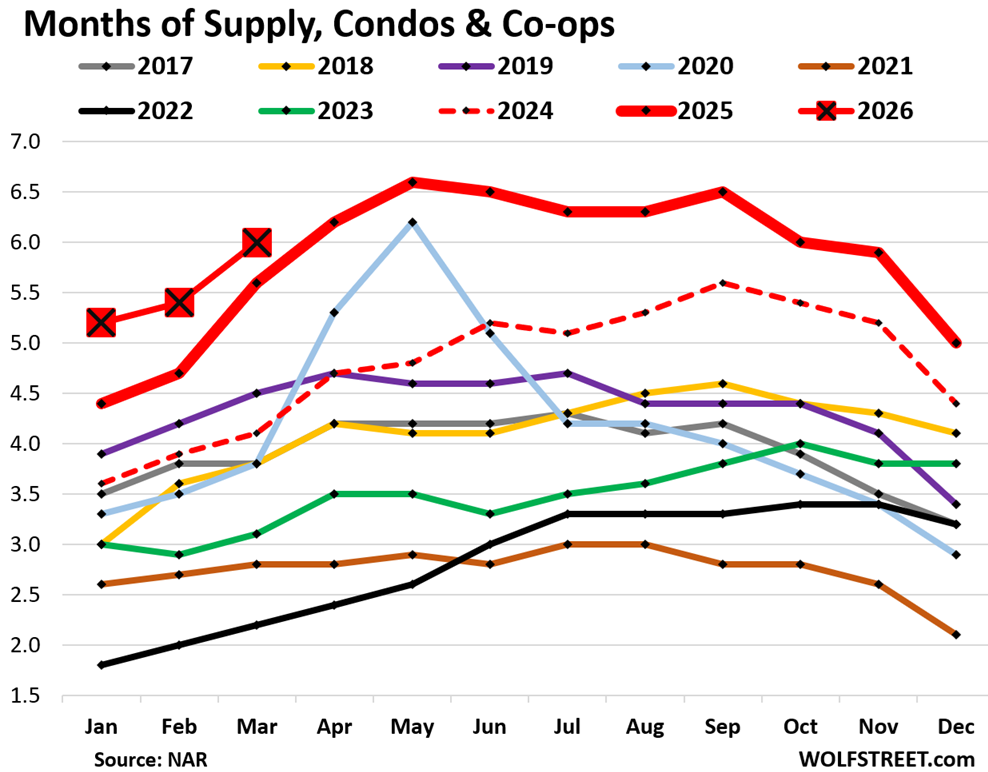
Supply of condos: The NAR has had a data issue with its condo supply figure that started this year. The originally reported figure has been much lower than the prior figures, but then a month later, it gets massively revised higher.
For example, a month ago, NAR reported supply for March as 4.3 months, a total outlier in the figures. Today, NAR revised March supply up to 6.0 months’ supply.
This has been going on for the past few months, with revisions adding close to 2 months each time. So I stopped reporting the original figures because I don’t want to look like a goofball a month later, but only report the revised supply figures.
So March, condo supply was revised up to 6.0 months, the highest for any March since March 2012, the first March in the data series (red line with big red squares in the chart below).

National median price v. local prices.
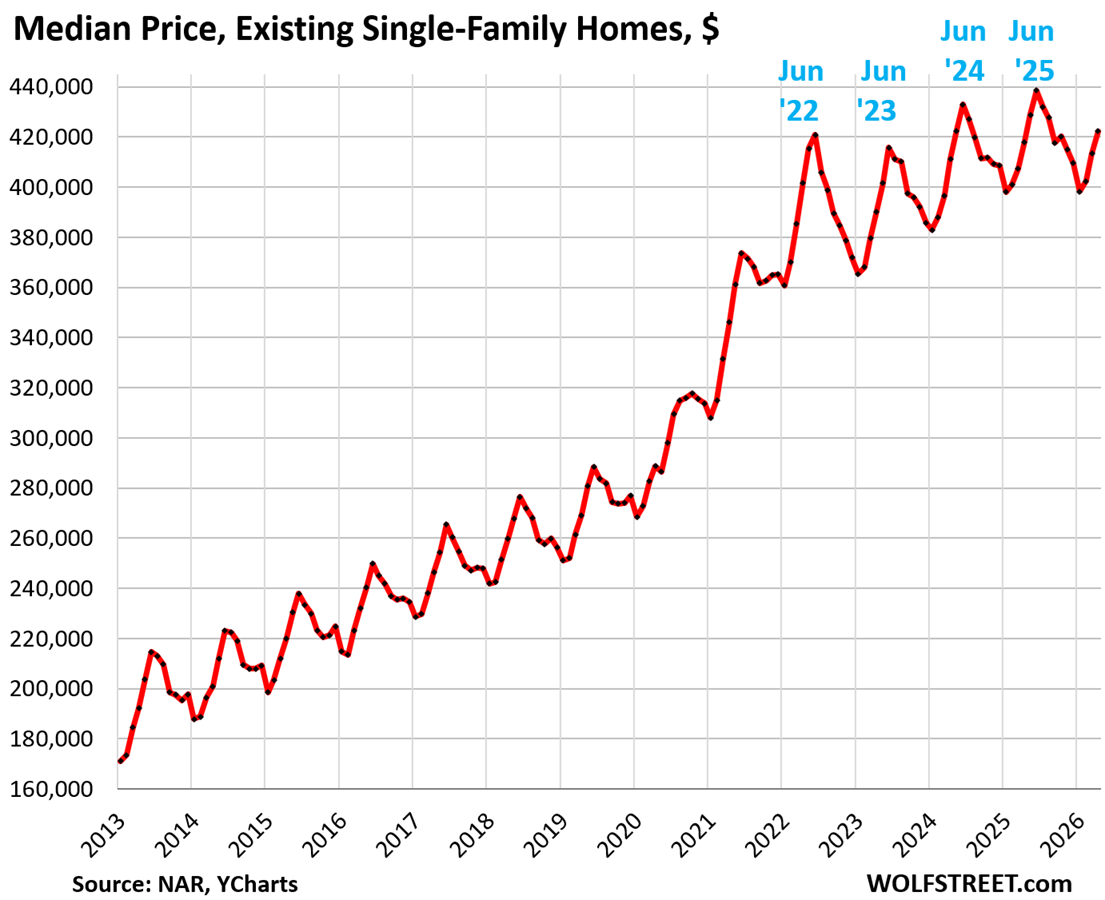
The national median price of single-family homes inched up year-over-year by 1.0% in April, not seasonally adjusted.
The median price of single-family homes had exploded by 41% from June 2020 through June 2022, from already high prices. Those now too-high prices form the core of the “affordability issues” that are dogging the housing market and are one reason home sales have remained in the deepfreeze.
But the national median price is irrelevant for people buying or selling homes, though they’re an interesting data point from an overall economics perspective. What matters to buyers and sellers are local markets.
Since mid-2022, prices of single-family homes have dropped in some cities, for example:
- Oakland: -25%
- Austin: -24%
- New Orleans: -20%
- Fort Myers: -15%
And in some other cities, prices of single-family homes have continued to rise, for example year-over-year:
- New York City: +5.3%
- Milwaukee: +3.7%
- Chicago: +3.9%
For more, see my city-by-city analysis of home prices in 33 big cities.
The national median price is very seasonal, rising and falling with the shift in inventories and sales, as a larger portion of expensive homes comes on the market and sells every year in the spring, thereby changing the mix of what sold, and shifting the median price up through June. In the second half of the year, the mix reverts, and the median price drops and bottoms out in January.
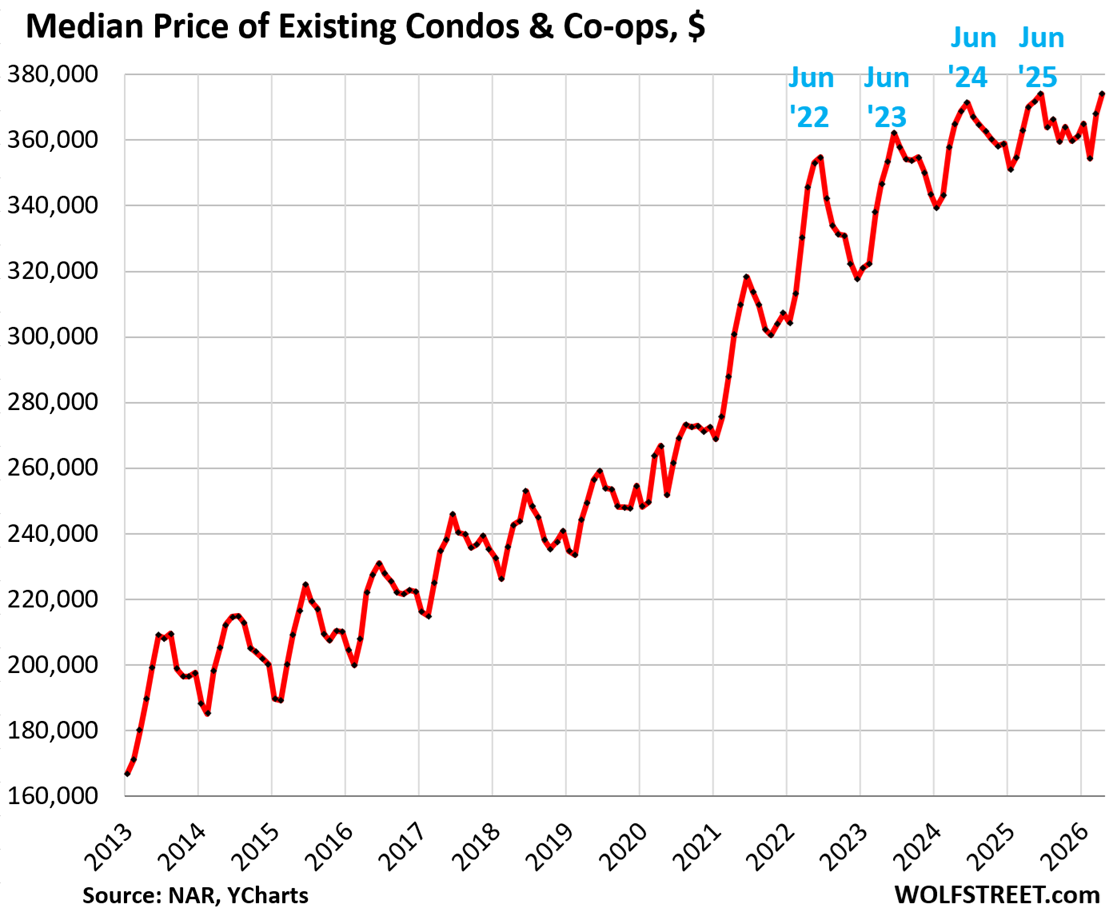
The national median price of condos and co-ops inched up year-over-year by 1.1% in April, not seasonally adjusted.
By local market, condo prices have plunged by 12% to 31% in 31 bigger cities or counties, topped off by:
- Oakland, CA: -31%
- Petersburg, Fl: -28%
- Austin, TX: -26%
- Sarasota County, FL: -24%
- Lee County, FL (Cape Coral, Fort Myers): -23%
In 51 markets, condo and co-op prices dropped by 7% or more, such as in Houston (-13%), Dallas (-11%), Manhattan (-17%). My report on these condo markets is here.
The national median price of condos and co-ops had exploded by 40% mid-2020 and mid-2022,
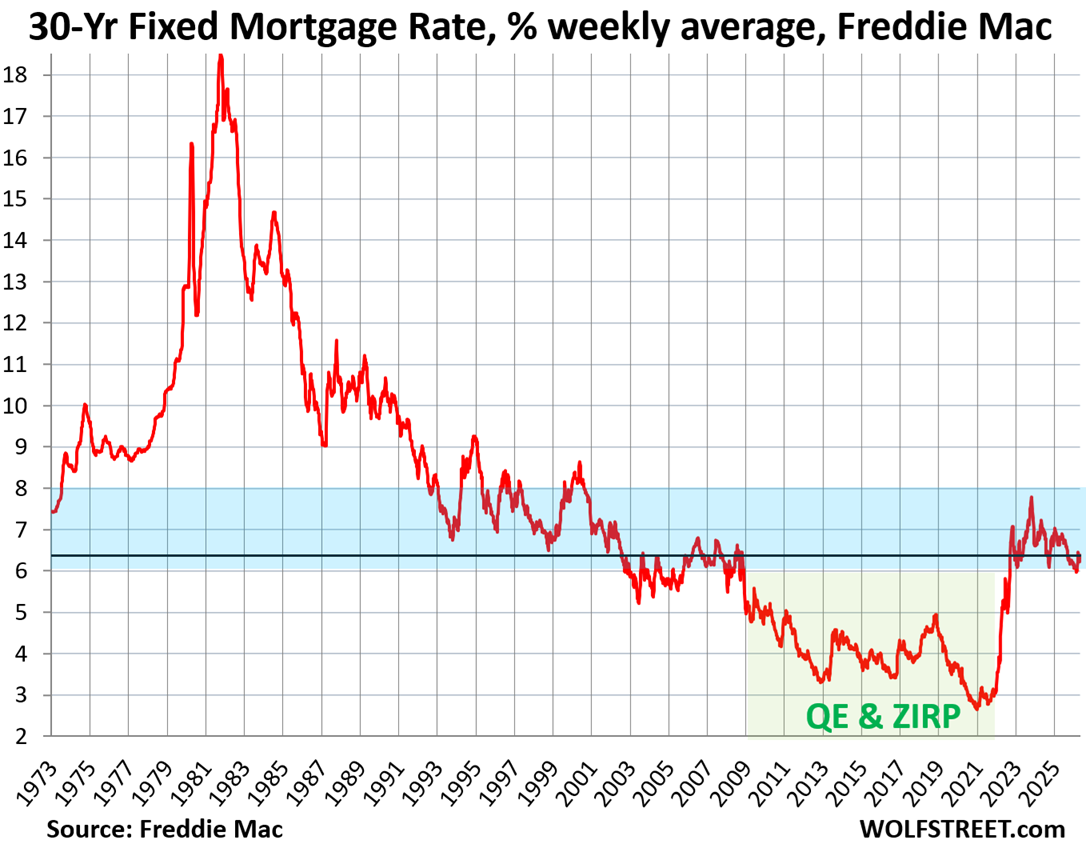
The average 30-year fixed mortgage rate ticked up to 6.37% as of May 7, after dipping barely below 6% for just one week in late February, according to Freddie Mac’s weekly measure of mortgage rates.
Mortgage rates are a product of the bond market. They roughly track the movements of the 10-year Treasury yield, but are higher, and the spread between them varies. The 10-year Treasury yield rose to 4.41% at the moment, and the bond market is on edge.
These mortgage rates are at the low end of the range in the decades before the Fed’s QE, before the Fed bought trillions of dollars of mortgage-backed securities and Treasury securities with the purpose of repressing mortgage rates. Powell’s QE during the pandemic was the primary trigger for the explosion in home prices from mid-2020 to mid-2022 that is now causing the “affordability” issues, and it also helped trigger the worst inflation in 40 years.
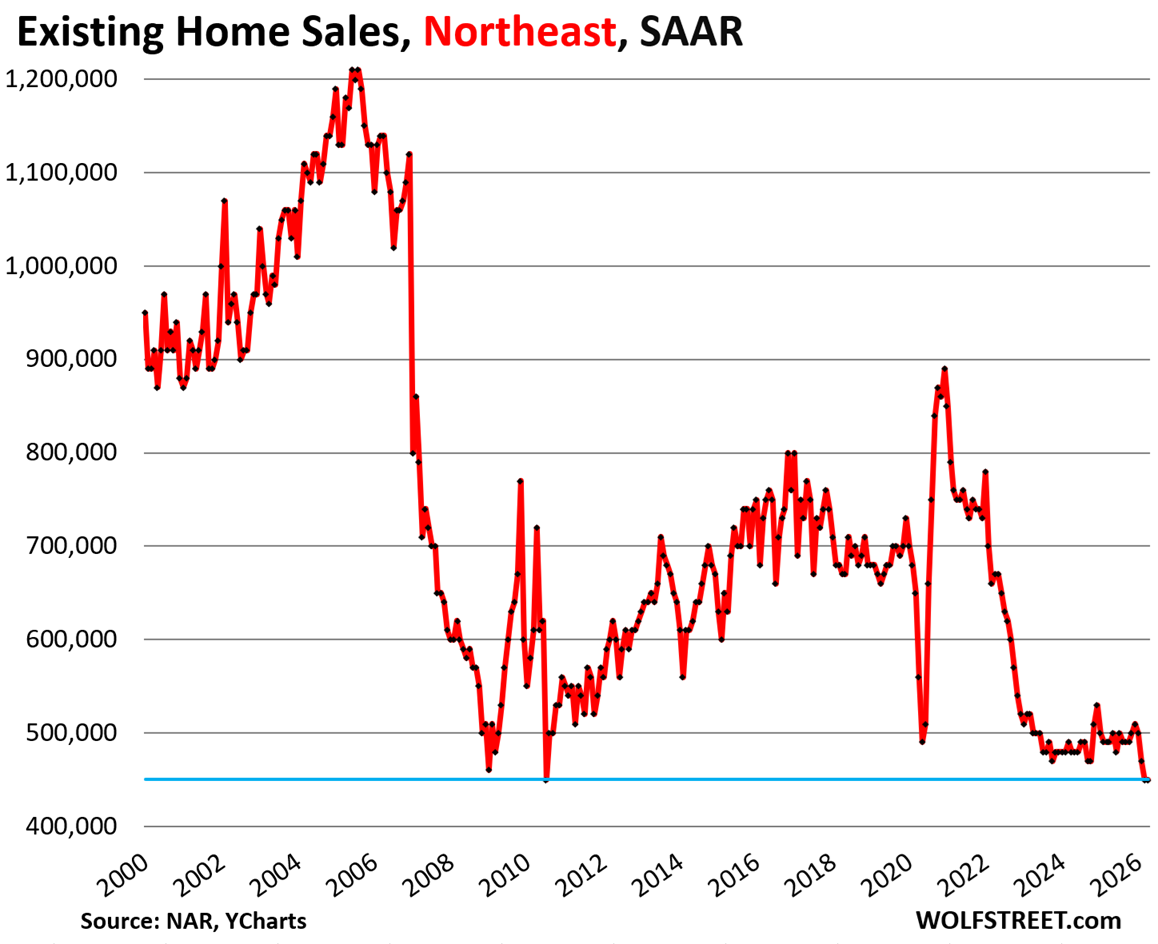
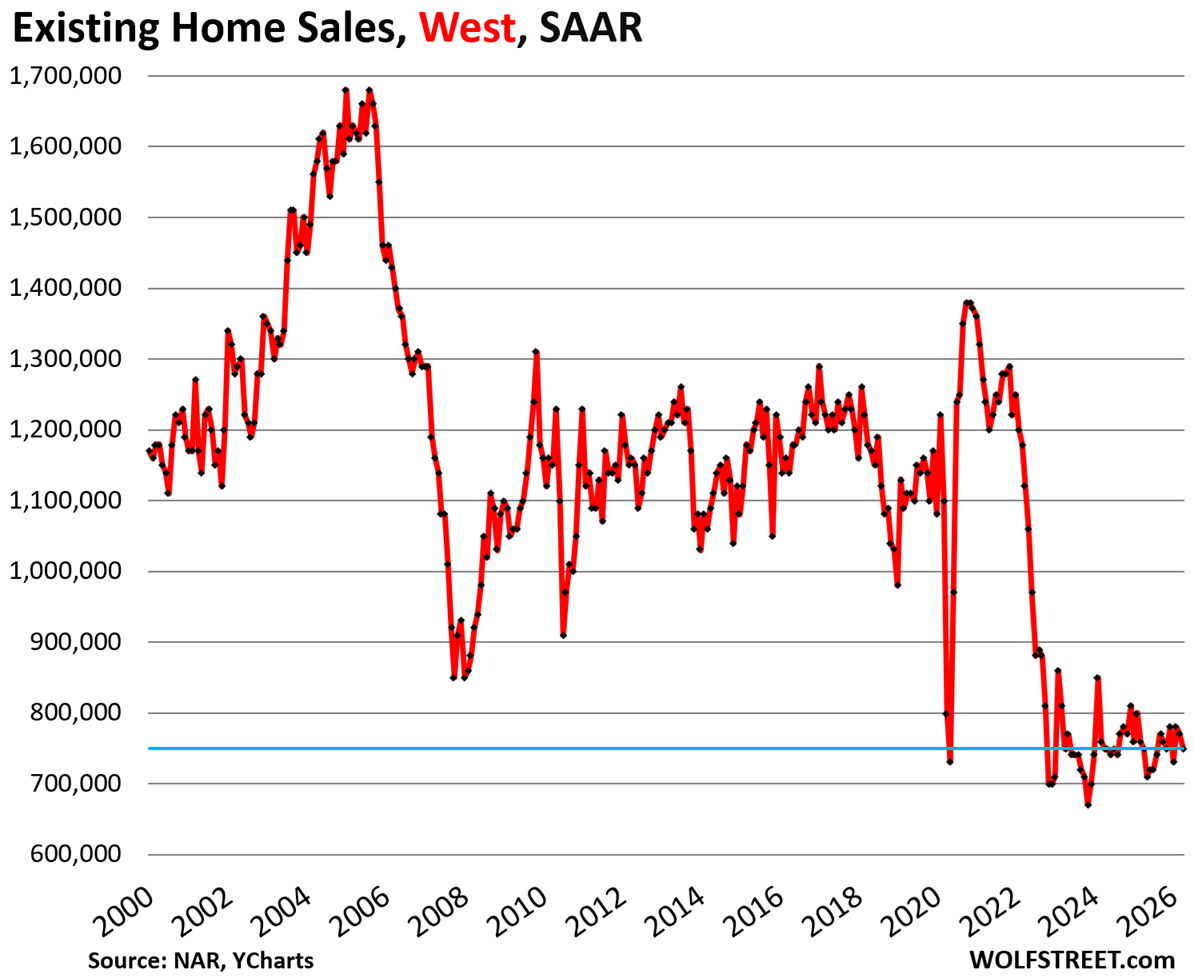
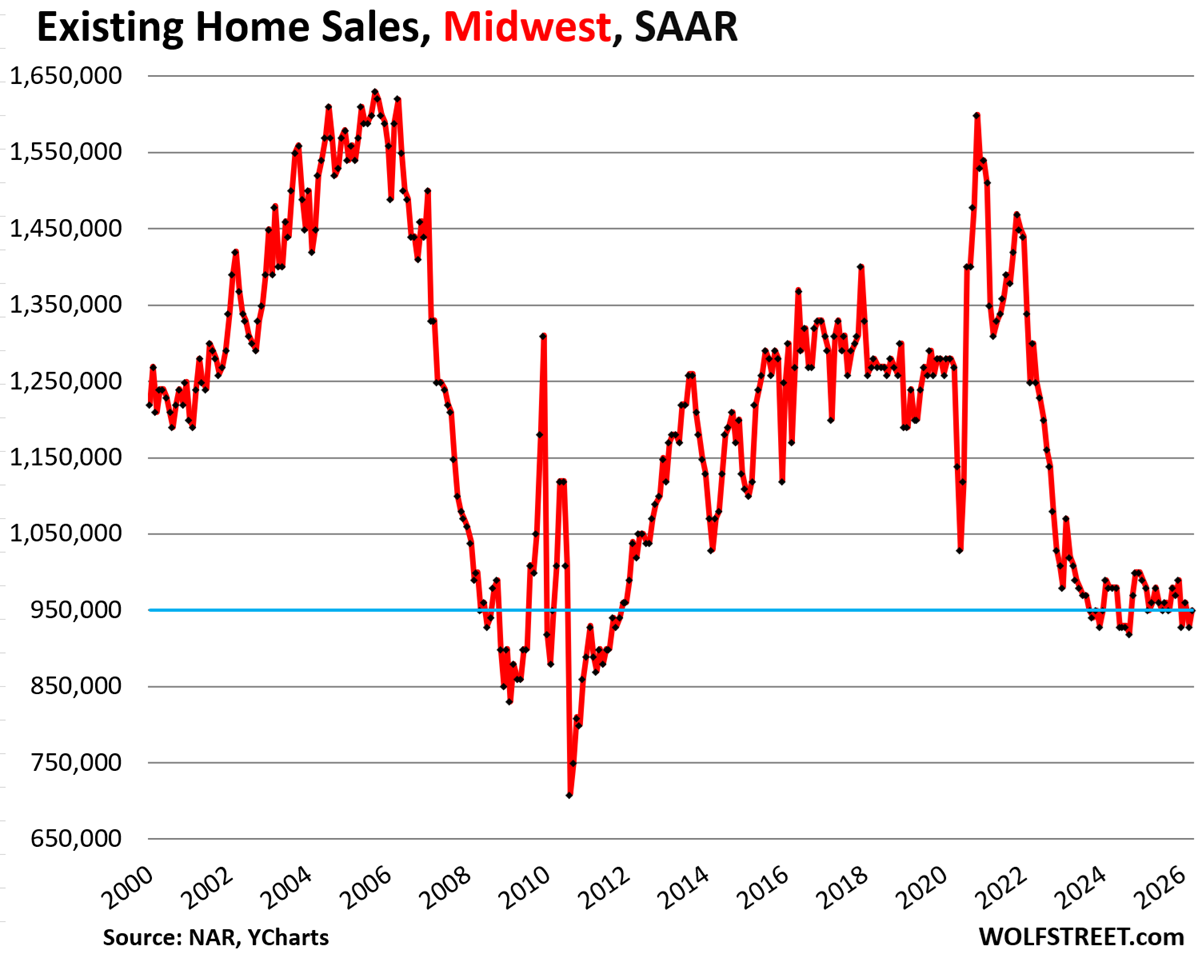
Sales of existing homes of all types by region.
On a month-to-month basis, sales of existing homes (single-family, condos, and co-ops combined) dropped in the West, were unchanged in the Northeast, ticked up a hair in the South, and rose in the Midwest, seasonally adjusted.
The charts below show the seasonally adjusted annual rate of sales (SAAR) in the four Census Regions of the US. A map of the four regions is below the article at the top of the comments.
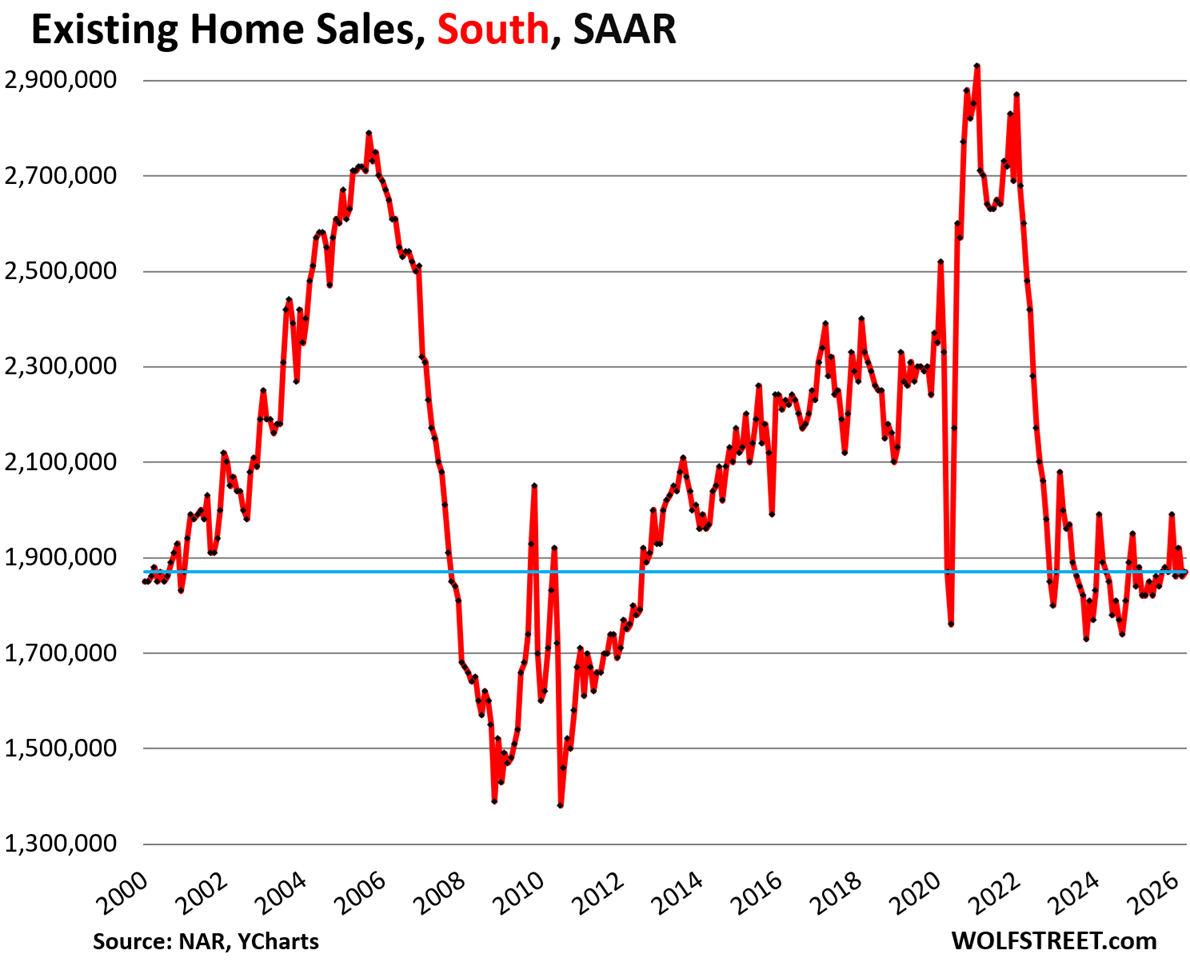
In the South, the seasonally adjusted annual rate of sales ticked up by 0.5% in April from March, to 1.87 million homes.
Compared to April in:
- 2025: +2.7% (year-over-year)
- 2024: 0%
- 2023: -4.6%
- 2022: -24.6%
- 2019: -17.3%
- 2018: -19.2%
In the Northeast, the seasonally adjusted annual rate of sales in April remained at 450,000, unchanged from March at the record low level of sales in NAR’s data, which goes back to 1999, after two plunges in February from January.
Compared to April in:
- 2025: -8.2% (year-over-year)
- 2024: -6.3%
- 2023: -10.0%
- 2022: -32.8%
- 2019: -31.8%
- 2018: -32.8%
In the West, the seasonally adjusted annual rate of sales fell by 2.6% in April from March, to 750,000 homes.
Compared to April in:
- 2025: 0% (year-over-year)
- 2024: 0%
- 2023: 0%
- 2022: -33.0%
- 2019: -32.4%
- 2018: -36.4%
In the Midwest, the seasonally adjusted annual rate of sales rose by 2.2% in April from March, to 950,000 homes.
Compared to April in:
- 2025: -1.0% (year-over-year)
- 2024: -3.1%
- 2023: -5.9%
- 2022: -26.9%
- 2019: -20.8%
- 2018: -25.8%
In case you missed it: Housing Market’s Crucial “Spring Selling Season” Is in Tatters
Enjoy reading WOLF STREET and want to support it? You can donate. I appreciate it immensely. Click on the mug to find out how:

![]()
Looks good, can only go up with inflation
Here is a map of the four Census regions of the US:
There ‘ain’t no more jobs’ to support SFH on a mass scale anymore, let alone beach condo’s. You have downsizers from huge homes moving into luxury apartments, and then kids at 30 living at home looking for their first real jobs. The Apartments being made today themselves tell this tale.
This is also known as a declining living standard. And it’s very likely just at the start. Maybe I’m wrong.
You’re not wrong, but there is the upper arm of the K shaped economy that is buying new real estate, new cars, new boats, new fashion, iphone whatever they’re on now, etc. The lower arm fights over their worn out scraps of old houses, used luxury cars with 200k miles, and declining neighborhoods.
Flat prices for another 6-8 years around that June 2022 price peak will do wonders for housing affordability and maybe let tiund people in the door again. Maybe the Fed will have sold off their last MBS by then too. 25+ years of a broken housing market due to Fed meddling.
It looks like the median price chart got put in twice for condos and coops?
Also the seasonal adjuster for the sales data in the South looks like January’s past adjustment doesn’t apply any more!
Can someone explain how it’s possible demand has cratered, supply has spiked, and we still haven’t seen halfway decent reductions in price? I get we’ve dropped a hair from ‘22 but that last little spike unwound then has flatlined for 3 years.
Sellers are in no need to sell now. They just want their peak’ish price hence not budging from their aspirational/asking price.
Prices wont go down but for recession.
These sellers also have locked in very low mortgage rates.
Prices going up still in Europe, I think we’re ready for a rally. /S
Cem-
It depends on the market; New vs. Existing are different.
New home sales (NHS) are doing rather well, because home builders cut prices and provided incentives to move their inventory. As Wolf has said previously, home builders are a business and they do what they have to to make sales happen. BTW, I don’t think incentives – including mortgage rate buy-downs – are included in the headline price reductions. Wolf has spoken to this also.
As far as used/resale/existing home sales (EHS) go, well, and as Wolf says in this article, sales are in the “deepfreeze” because used home sellers still want 2022 bubble peak prices, but those are gone, because mortgage rates are now more than 2x higher. They’re even pulling their listings if they don’t get their aspirational (read delusional) wish price. This is the current “rage” delisting. I’m guessing that NHS are maybe 20-30% of the market currently, while EHS are the remainder, so if EHS are frozen, then overall sales are going to be low, and they are.
As in Housing Bubble (HB) 1.0, prices are “sticky to the downside” due to said used home seller reluctance to cut prices. However, home prices are set at the margin, and sooner or later, some will have to sell due to the “3 D’s”: death, divorce, distress. For example, demographics indicate millions of baby boomers will pass on over the next 20 years, and ~70% of these properties will be sold by the heirs (children). That’s a lot of inventory coming soon to a market near you.
Anyway, expect prices to drop, as HB 2.0 deflates, but it will take probably 3-5 years. I’m expecting ~35-40% price drop, just due to the difference in 2-3% pandemic rates vs. current 6.49% (MND today) rate. P&I only. All of the other carrying costs went up also… Remember, the Fed and .gov did this.
Homes are mostly unaffordable to shelter-buyers. Neither are mortgage rates going back down to the 2-3% artificial pandemic range, nor are wages going up 35-40% anytime soon. That leaves price decline as the most likely option.
Finally, we’re in HB 2.0, as part of The Everything Bubble, aka The Central Bank Bubble. History shows that asset bubbles always burst; an inconvenient truth. Reference Tulip Mania, South Sea bubble, Mississippi Bubble, HB 1.0, Japan Real Estate Bubble, Dot-Com Bubble, etc. BTW, AI is also a bubble. Not a good way really to run an economy, but here we are…
Inflation. The housing market absorbed newly printed QE $$$. The big question is if wages can inflate to match in a timely manner. It would be nice to see a correction, but it’ll take years. The fed ruined some stuff after 08 and covid.
Many things are possible but a spike of wage inflation seems unlikely in the near term with the wave of white collar layoffs. Why do we think places like Oakland and Austin seeing price declines?
The economy seems stagflationy except for the AI capex. If that seizes up…uf for everything.
SFH price doesn’t look so high when compared with inflation. The lack of sale may be due to lack of wage growth and mountain of taxes. I certainly can’t afford my own house if I have to buy it again. I can barely afford the property tax, which has gone through the roof.
A lot of accidental landlords must be muddling through with low vacancies.
There are only so many housing units, so the people waiting for the market to crash are paying rent in the meantime, keeping the accidental landlords from having to cut their prices.
But paying rent saves them lots of money — thousands of dollars a month in expensive markets — and they don’t have to worry about property price declines and being stuck in an upside-mortgage. Accidental landlords have the carrying costs and the risks of property price declines, plus all the substantial risks of landlording.
There are JUST enough Buyers today. Any more reduction of Buyers and we will see prices start to really slip. My listings have for 2 years been underwhelming as far as showings but still sell. In the old days you would get 2 or 3 times the traffic and about the same amount of offers. Buyers must still think it is a Sellers market but from my observation it is clearly a Buyers market still buyers are behaving like they are going to miss out if they don’t act fast. Also the ” Spring Buying Season ” has moved up to February-April in the last 5 or 6 years as Buyers can look at listings on their phones with no need to call an agent along with the same thinking that if they look before June they will get a better deal. The reality is that this market is hanging on by a thread.
I eagerly await the incoming Fed chair and the midterms. Seems an awful lot of the future of the US will be decided after that period. I wonder if Warsh will cook up some new theory to sell out more of the poor and middle class to the rich or do a lazy about face and cut rates with the potential help of Trump firing voting members should the midterms go his way.
I having been leasing a SFM for the past 3 years south of Seattle and every time I look at what I can buy for the price of my rent it isn’t even close. Just re-upped for the 4th year. I figure if I had bought 3 years ago, I would have paid at least $70k more in mortgage than I have in rent. I also would have had to make repairs and lost out on the interest on my money during that time. Total opportunity cost over the last 3 years is probably right around $100k. I don’t think the appreciation and mortgage buy down would touch that. I hate renting, but will continue to do it until the math makes sense again. Just keep saving.