April was another bad dud for spring selling season as supply continued to pile up.
By Wolf Richter for WOLF STREET.
Sales of existing single-family homes that closed in April seasonally adjusted were unchanged from March, at an annual rate of 3.64 million sales, near the very bottom of the deepfreeze range that has existed for the past three-and-a-half years, according to data by the National Association of Realtors today.
Compared to April in (historical data from YCharts):
- 2025: -0.3% (year-over-year)
- 2024: -1.1%
- 2023: -4.0%
- 2022: -26.6%
- 2021: -30.5%
- 2019: -21.9%
- 2015: -19.6%
- 2009: +3.7% (Housing Bust)
- 1996: -7.4%
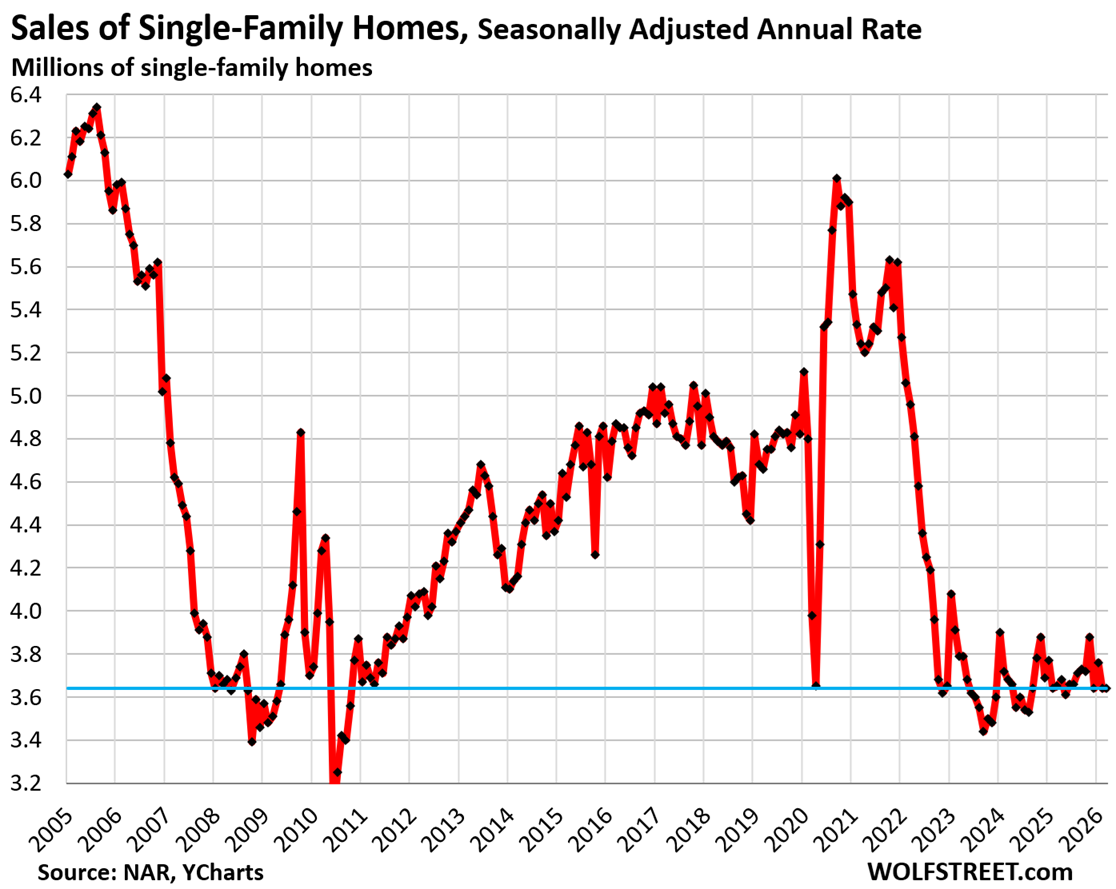
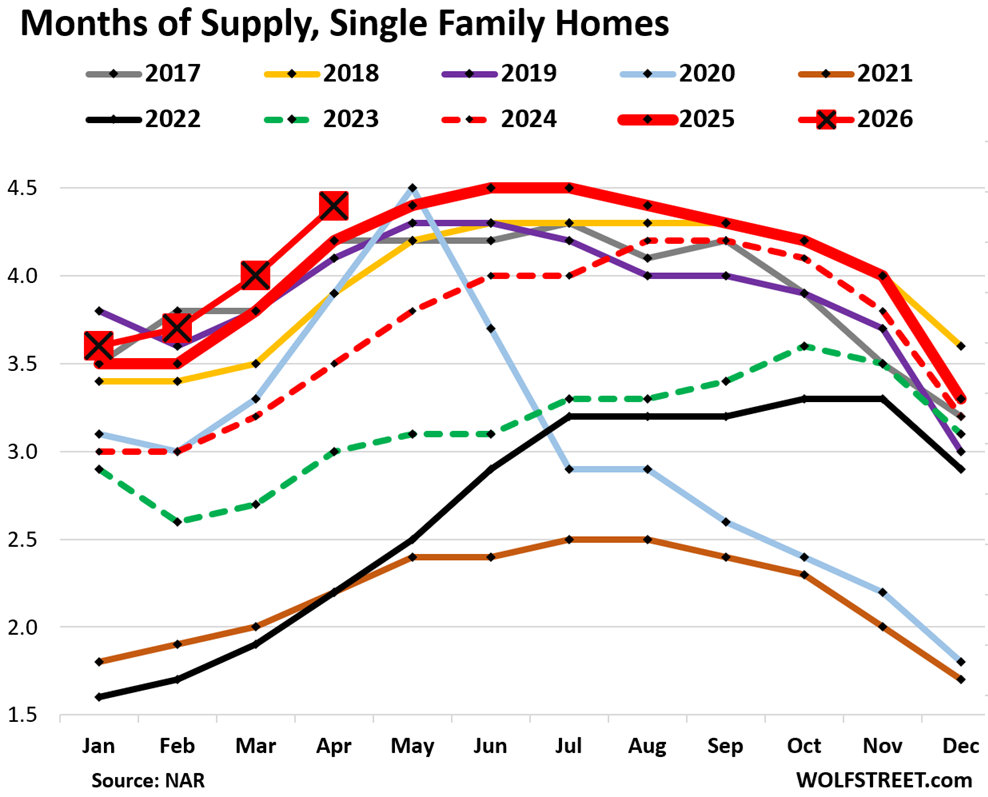
Supply of single-family homes jumped to 4.4 months in April (red line with big red squares in the chart below), the highest supply for April since 2016.
Supply is a function of inventory and sales (demand). Inventory in a vacuum doesn’t matter all that much; what matters is how much inventory there is in relationship to sales, and sales have plunged while inventories have been rising (historical data from YCharts).
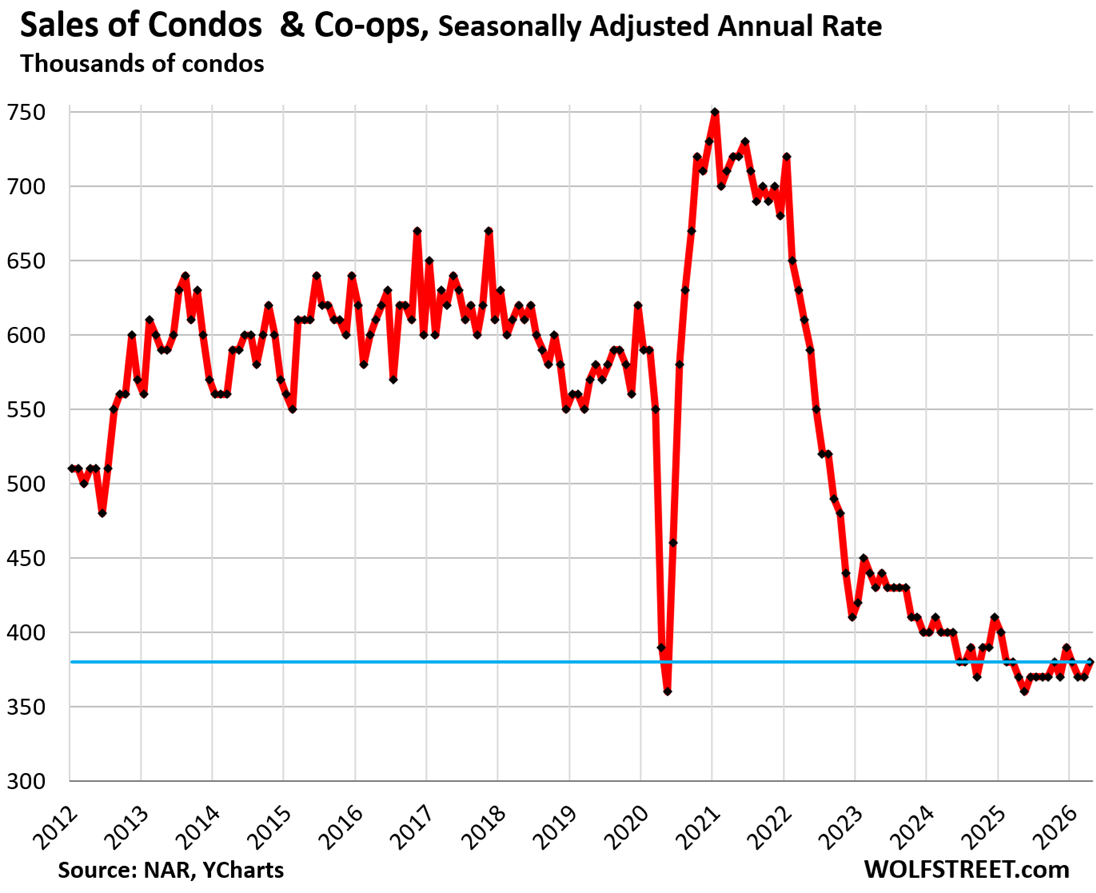
Sales of condos and co-ops ticked up seasonally adjusted in April from March to an annual rate of 380,000, near the very bottom of the data, which go back only to late 2011:
Compared to April in:
- 2025: +2.7% (year-over-year)
- 2021: -47.2%
- 2019: -33.3%
- 2012: -25.5% (first April in the data series)
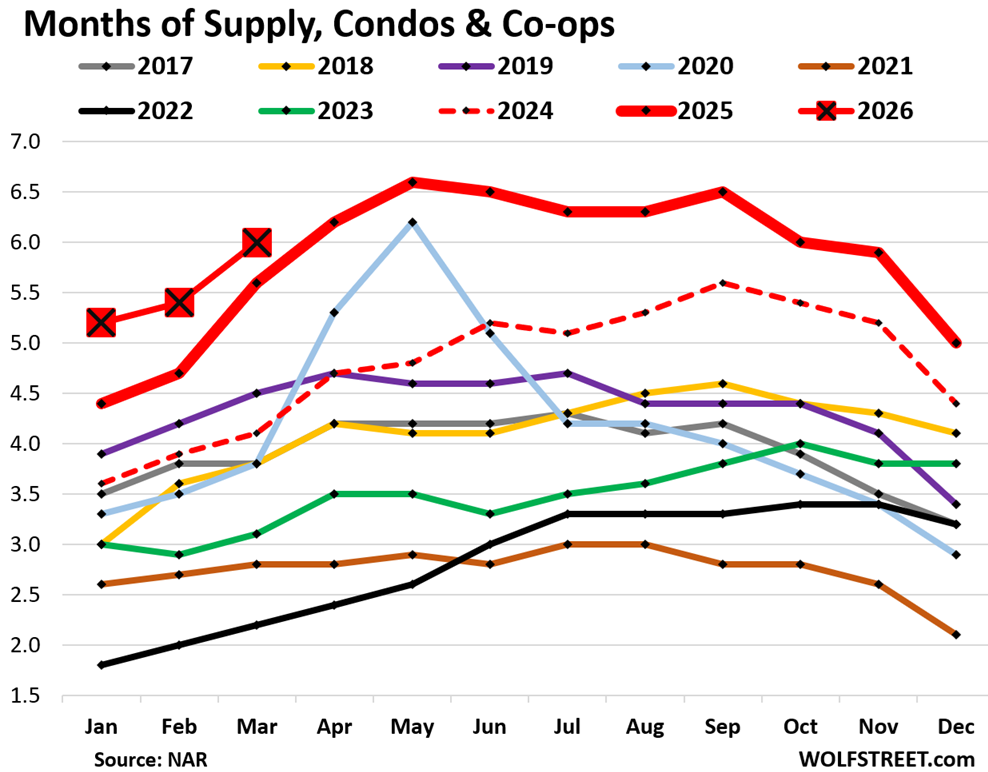
Supply of condos: The NAR has had a data issue with its condo supply figure that started this year. The originally reported figure has been much lower than the prior figures, but then a month later, it gets massively revised higher.
For example, a month ago, NAR reported supply for March as 4.3 months, a total outlier in the figures. Today, NAR revised March supply up to 6.0 months’ supply.
This has been going on for the past few months, with revisions adding close to 2 months each time. So I stopped reporting the original figures because I don’t want to look like a goofball a month later, but only report the revised supply figures.
So March, condo supply was revised up to 6.0 months, the highest for any March since March 2012, the first March in the data series (red line with big red squares in the chart below).

National median price v. local prices.
The national median price of single-family homes inched up year-over-year by 1.0% in April, not seasonally adjusted.
The median price of single-family homes had exploded by 41% from June 2020 through June 2022, from already high prices. Those now too-high prices form the core of the “affordability issues” that are dogging the housing market and are one reason home sales have remained in the deepfreeze.
But the national median price is irrelevant for people buying homes. What matters are local markets, though they’re an interesting data point from an overall economics perspective.
Since mid-2022, prices of single-family homes have dropped in some cities, for example:
- Oakland: -25%
- Austin: -24%
- New Orleans: -20%
- Fort Myers: -15%
And in some other cities, prices of single-family homes have continued to rise, for example year-over-year:
- New York City: +5.3%
- Milwaukee: +3.7%
- Chicago: +3.9%
For more, see my city-by-city analysis of home prices in 33 big cities.
The national median price is very seasonal, rising and falling with the shift in inventories and sales, as a larger portion of expensive homes comes on the market and sells every year in the spring, thereby changing the mix of what sold, and shifting the median price up through June. In the second half of the year, the mix reverts, and the median price drops and bottoms out in January.
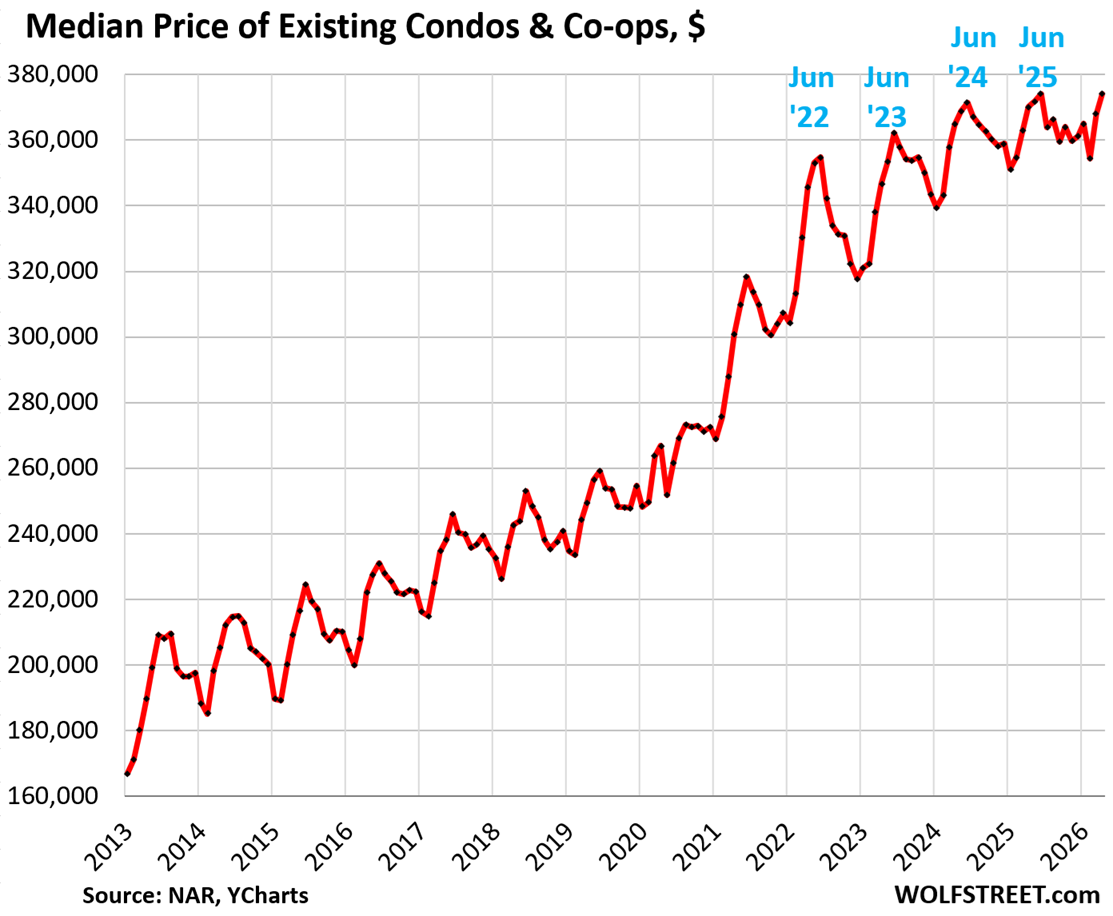
The national median price of condos and co-ops inched up year-over-year by 1.1% in April, not seasonally adjusted.
By local market, condo prices have plunged by 12% to 31% in 31 bigger cities or counties, topped off by:
- Oakland, CA: -31%
- Petersburg, Fl: -28%
- Austin, TX: -26%
- Sarasota County, FL: -24%
- Lee County, FL (Cape Coral, Fort Myers): -23%
In 51 markets, condo and co-op prices dropped by 7% or more, such as in Houston (-13%), Dallas (-11%), Manhattan (-17%). My report on these condo markets is here.
The national median price of condos and co-ops had exploded by 40% mid-2020 and mid-2022,

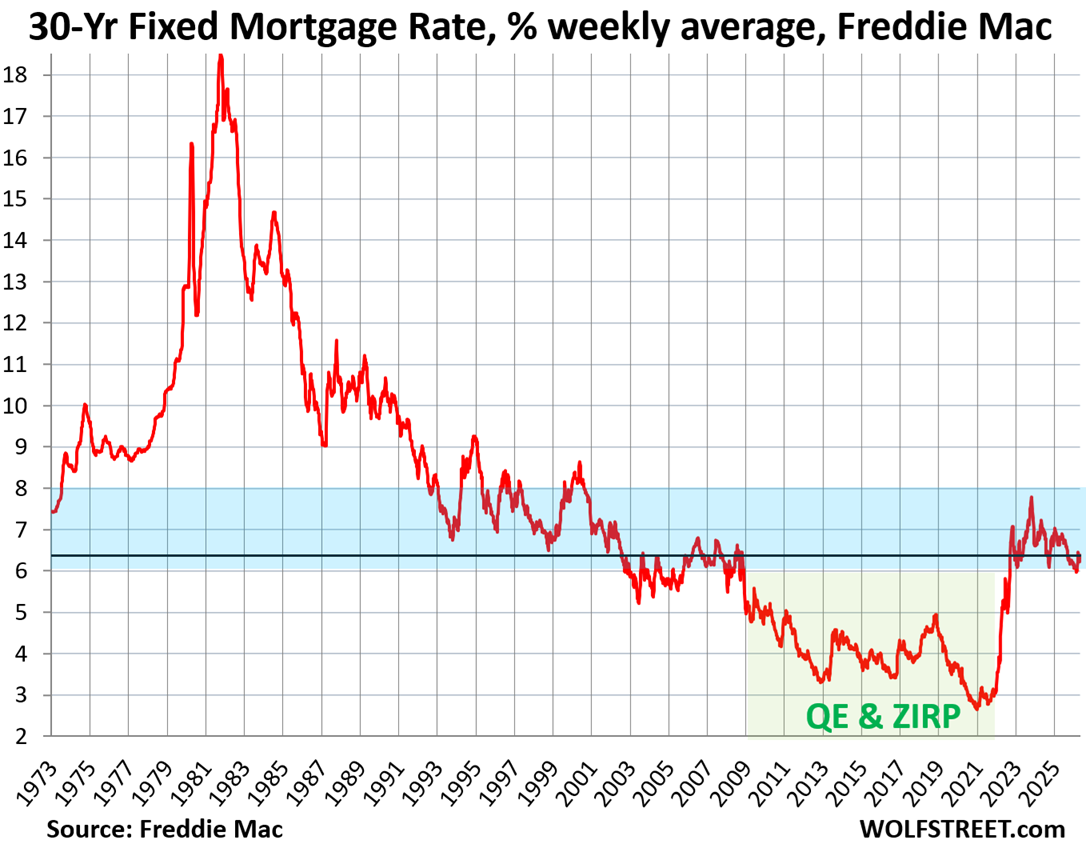
The average 30-year fixed mortgage rate ticked up to 6.37% as of May 7, after dipping barely below 6% for just one week in late February, according to Freddie Mac’s weekly measure of mortgage rates.
Mortgage rates are a product of the bond market. They roughly track the movements of the 10-year Treasury yield, but are higher, and the spread between them varies. The 10-year Treasury yield rose to 4.41% at the moment, and the bond market is on edge.
These mortgage rates are at the low end of the range in the decades before the Fed’s QE, before the Fed bought trillions of dollars of mortgage-backed securities and Treasury securities with the purpose of repressing mortgage rates. Powell’s QE during the pandemic was the primary trigger for the explosion in home prices from mid-2020 to mid-2022 that is now causing the “affordability” issues, and it also helped trigger the worst inflation in 40 years.
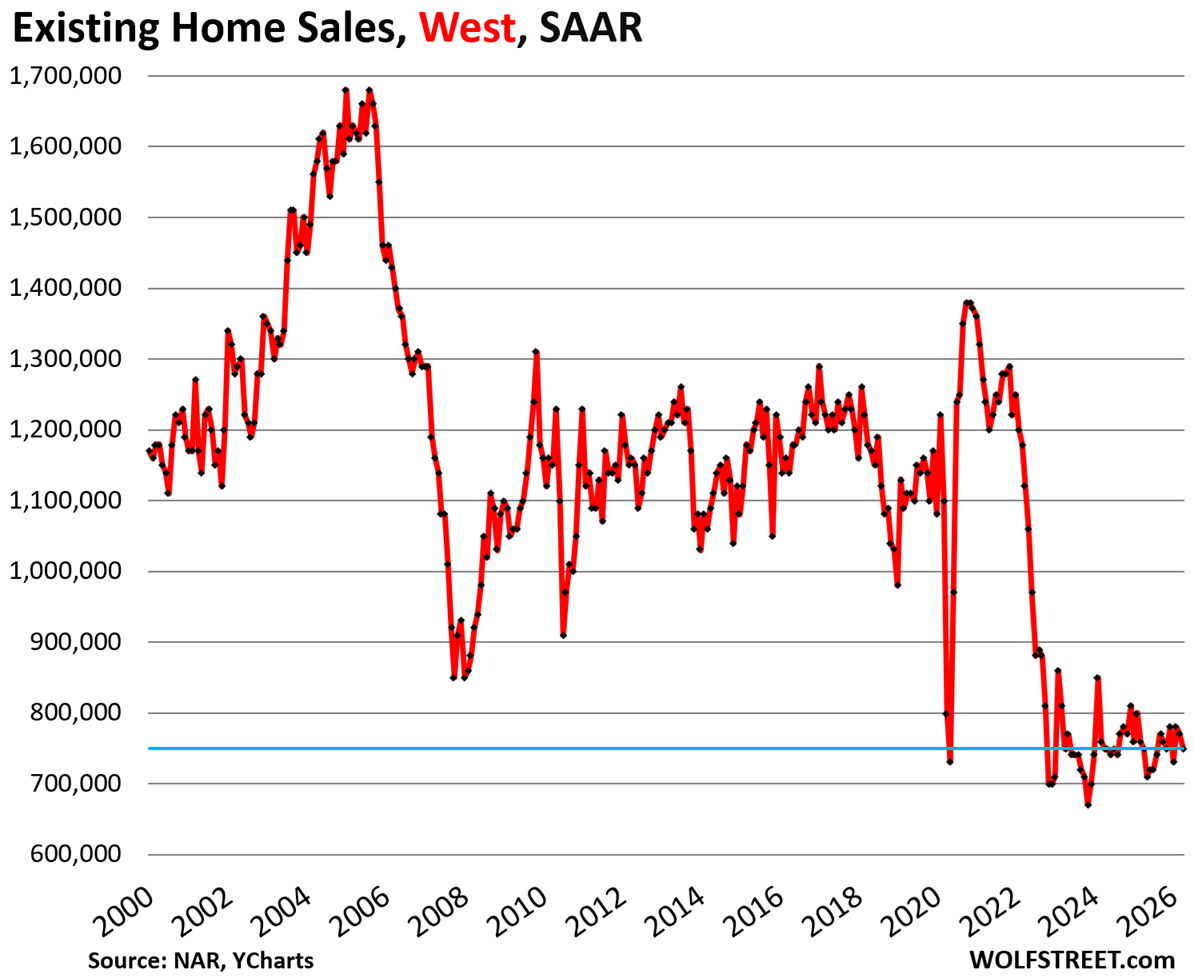
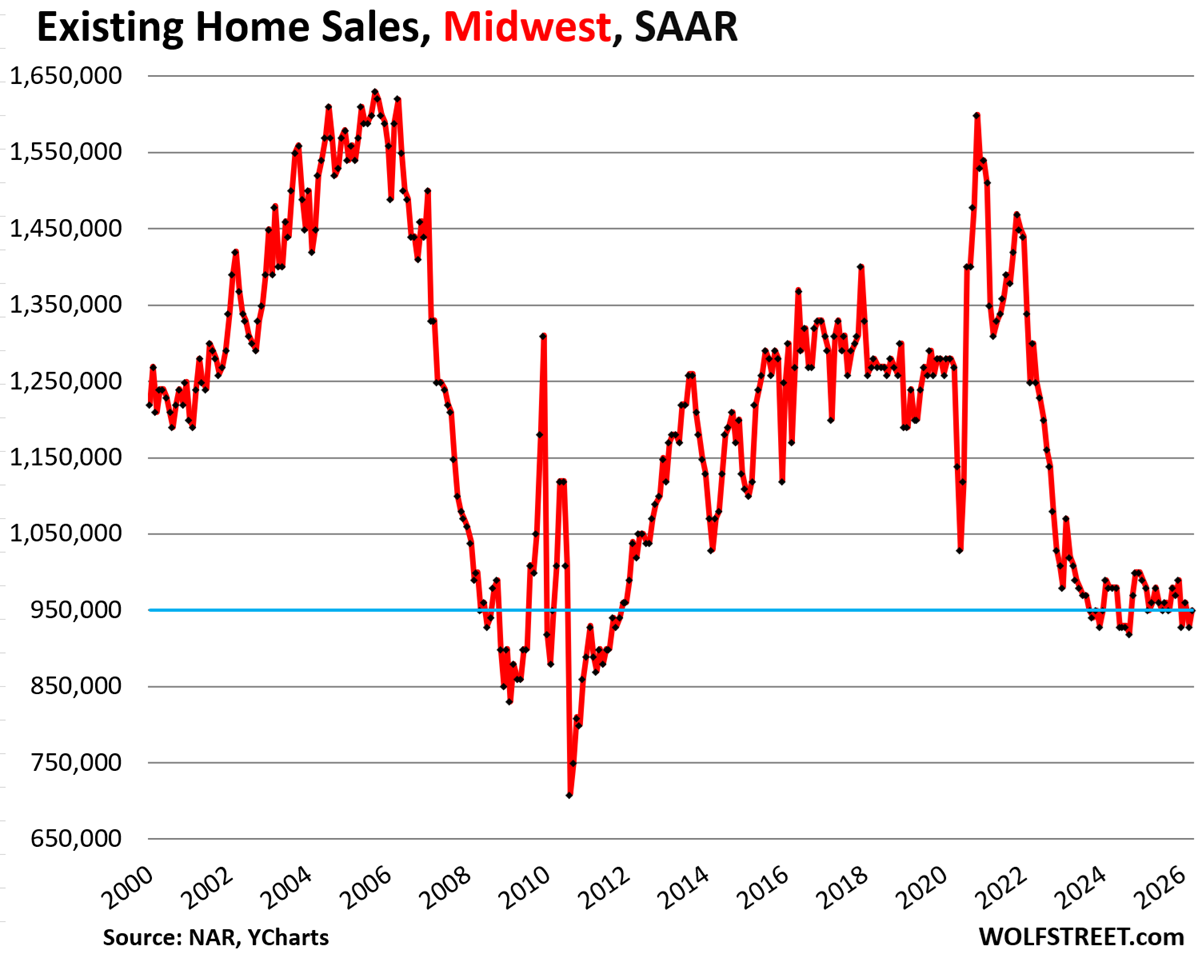
Sales of existing homes of all types by region.
On a month-to-month basis, sales of existing homes (single-family, condos, and co-ops combined) dropped in the West, were unchanged in the Northeast, ticked up a hair in the South, and rose in the Midwest, seasonally adjusted.
The charts below show the seasonally adjusted annual rate of sales (SAAR) in the four Census Regions of the US. A map of the four regions is below the article at the top of the comments.
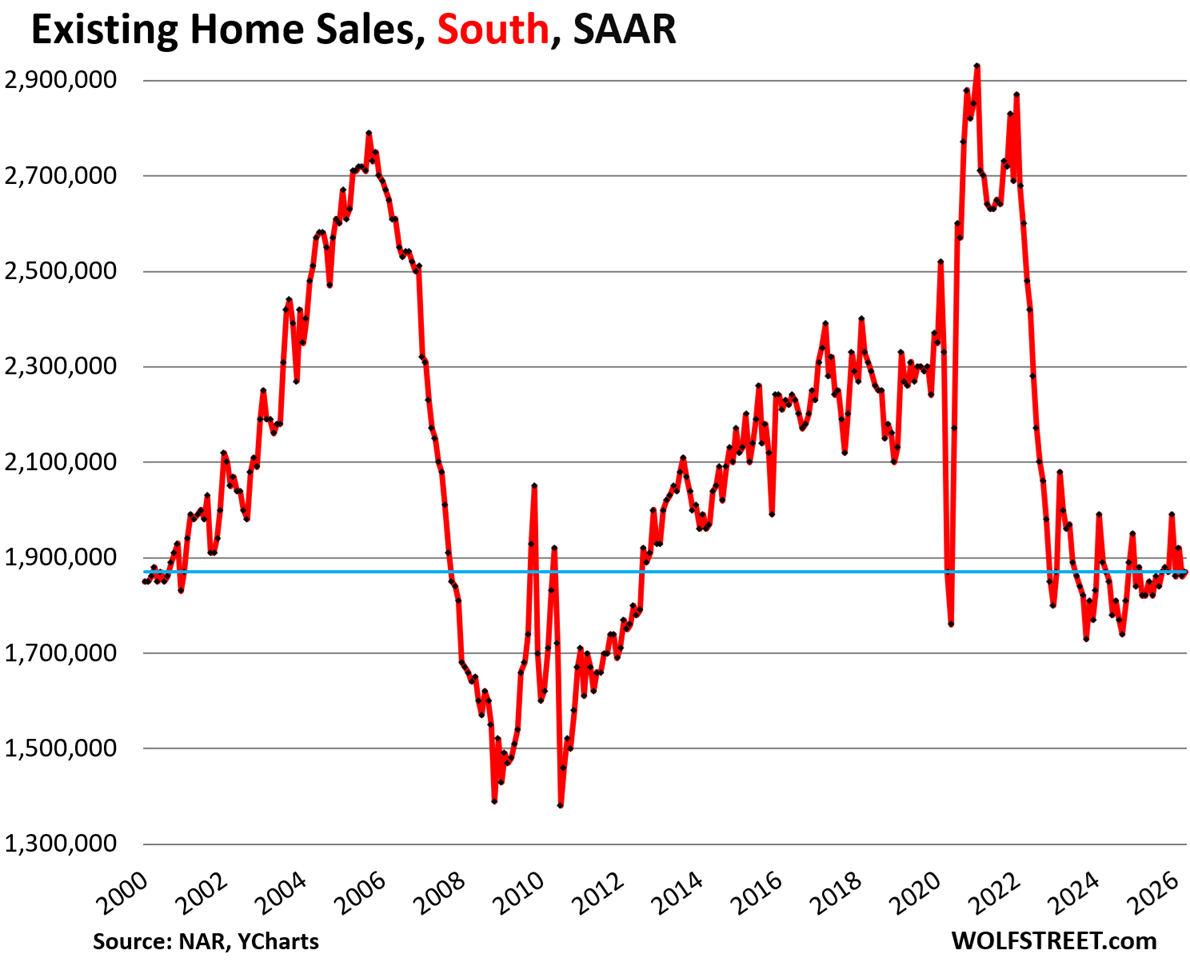
In the South, the seasonally adjusted annual rate of sales ticked up by 0.5% in April from March, to 1.87 million homes.
Compared to April in:
- 2025: +2.7% (year-over-year)
- 2024: 0%
- 2023: -4.6%
- 2022: -24.6%
- 2019: -17.3%
- 2018: -19.2%
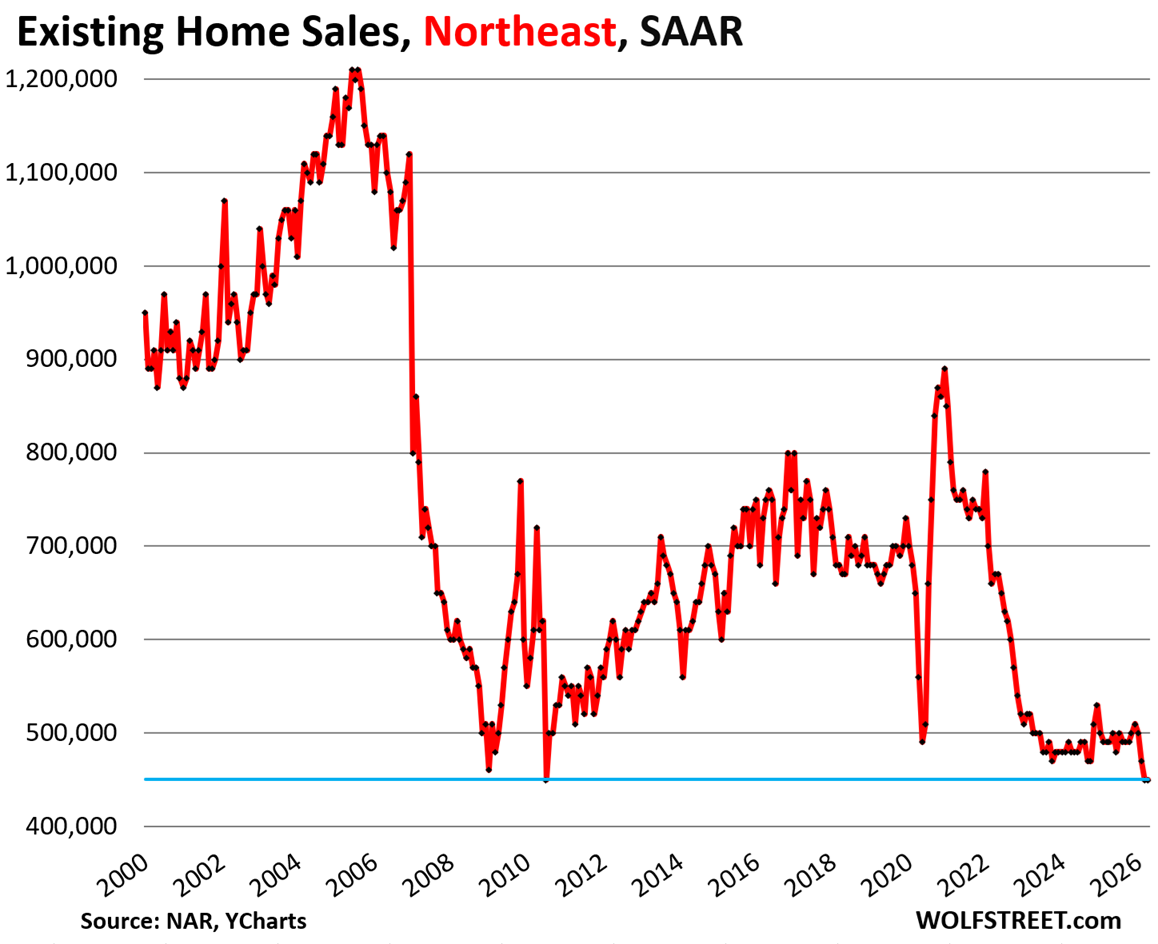
In the Northeast, the seasonally adjusted annual rate of sales in April remained at 450,000, unchanged from March at the record low level of sales in NAR’s data, which goes back to 1999, after two plunges in February from January.
Compared to April in:
- 2025: -8.2% (year-over-year)
- 2024: -6.3%
- 2023: -10.0%
- 2022: -32.8%
- 2019: -31.8%
- 2018: -32.8%
In the West, the seasonally adjusted annual rate of sales fell by 2.6% in April from March, to 750,000 homes.
Compared to April in:
- 2025: 0% (year-over-year)
- 2024: 0%
- 2023: 0%
- 2022: -33.0%
- 2019: -32.4%
- 2018: -36.4%
In the Midwest, the seasonally adjusted annual rate of sales rose by 2.2% in April from March, to 950,000 homes.
Compared to April in:
- 2025: -1.0% (year-over-year)
- 2024: -3.1%
- 2023: -5.9%
- 2022: -26.9%
- 2019: -20.8%
- 2018: -25.8%
In case you missed it: Housing Market’s Crucial “Spring Selling Season” Is in Tatters
Enjoy reading WOLF STREET and want to support it? You can donate. I appreciate it immensely. Click on the mug to find out how:

![]()
Looks good, can only go up with inflation
Here is a map of the four Census regions of the US:
There ‘ain’t no more jobs’ to support SFH on a mass scale anymore, let alone beach condo’s. You have downsizers from huge homes moving into luxury apartments, and then kids at 30 living at home looking for their first real jobs. The Apartments being made today themselves tell this tale.
This is also known as a declining living standard. And it’s very likely just at the start. Maybe I’m wrong.
It looks like the median price chart got put in twice for condos and coops?
Also the seasonal adjuster for the sales data in the South looks like January’s past adjustment doesn’t apply any more!
Can someone explain how it’s possible demand has cratered, supply has spiked, and we still haven’t seen halfway decent reductions in price? I get we’ve dropped a hair from ‘22 but that last little spike unwound then has flatlined for 3 years.