Where does the money come from? They now out-earn inflation, they earn interest income, and they dipped into their assets whose prices ballooned over the years.
By Wolf Richter for WOLF STREET.
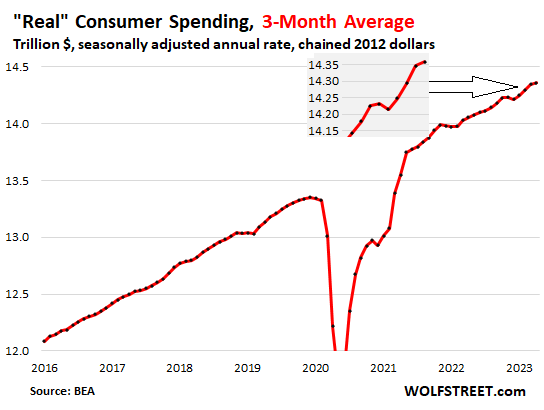
Consumer spending, adjusted for inflation and for seasonal factors jumped by 0.5% in April from March, after two months of declines and a huge spike in January.
Compared to a year ago, adjusted for inflation, consumer spending rose by a solid 2.3%, in line with the average growth rate in 2019 (2.4%). Americans continue to do what they do best: spending money, and they’re outspending inflation just fine.
To tamp down on the month-to-month zigzags and see the trend, we look at the three-month moving average of inflation-adjusted, aka “real,” consumer spending: It has been on a normal-ish Good-Times uptrend: Despite getting whacked by inflation, high interest rates, a credit crunch, layoff news, and bank turmoil, consumers picked up the pace so far this year, after the little slowdown late last year that you can see in the chart:
Now they out-earn inflation. Adjusted for inflation, aka “real” personal income rose by 0.2% in April from March and by 1.2% year-over-year, the biggest year-over-year increase in 13 months.
This “real” income is from all sources – including interest and dividend income and rental income – but excluding transfer payments (Social Security, unemployment insurance, etc.).
They got the biggest pay increases in decades. And they hold trillions of dollars of CDs, Treasury bills, and money-market funds, which now earn 5% and more, instead of 0.2% two years ago. And this sudden surge of interest income pushes up their overall income.
You can see how inflation outran personal income for much of 2022 and into early this year, and “real” income declined for that time. But over the past two months, “real” incomes rose again, and hit a new record in April:
![]()
They did mostly not borrow this money on their credit cards.
They spent bit and pieces of their massive asset gains. Real incomes without transfer payments (+1.2% year-over-year) rose more slowly than real spending (+2.3%). Most of the difference is drawn from the wealth in assets that Americans have, especially the big spenders that move the spending needle.
Capital gains, asset sales, and the cash flow from maturing CDs and bonds are not included in the income figures here. Pulling money out of brokerage accounts to spend on furniture or a trip is not included in the income figures either. Over the past decade, those asset accounts have ballooned with surging asset prices, and people are drawing on them. This is particularly the case for the large number of retirees.
It is nonsense to assume that when spending exceeds incomes, that this is borrowed money, that people are incurring more consumer debt to spend this money (though a few people do). In aggregate, people aren’t even dipping into their “savings” in the narrow sense. They’re using the gains on their assets, and those gains don’t show up in the income figures; but spending even a small portion of those gains does show up in the spending figures.
They used their credit cards mostly as payment method, not as borrowing method. Over the past 12 months, the rate of consumer spending in nominal terms, so not adjusted for inflation, increased by $1.15 trillion. In April, consumers spent at an annual rate of $18.3 trillion. These are huge numbers!
Over the same period, balances of credit cards and other revolving credit increased by only $153 billion, and a big portion of that increase is paid off on due date the next month and never incurs interest, though it does show up in the balances of the prior month.
Americans run about $5 trillion a year in spending through their credit cards as payment method, collect the 1% or 2% cash-back or get the mileage credit or whatever, and the majority of them pay off those balances every month and never pay interest on them.
And spending that is run through credit cards has surged this year, particularly on travels and “experiences” – experiences such as Taylor Swift concert tickets purchased from corporate scalpers for thousands of dollars each. The WSJ had a piece on that. Like drunken sailors.
The travel surge was confirmed by card companies, including AmEx. Practically all of this spending on travels and experiences is paid for via cards. Yet in Q1, credit card balances as a percent of disposable income actually dropped, thanks to surging incomes and thanks to the fact that the majority of cardholders are paying off their cards every month. We discussed credit cards in detail here.
Spending by category, adjusted for inflation.
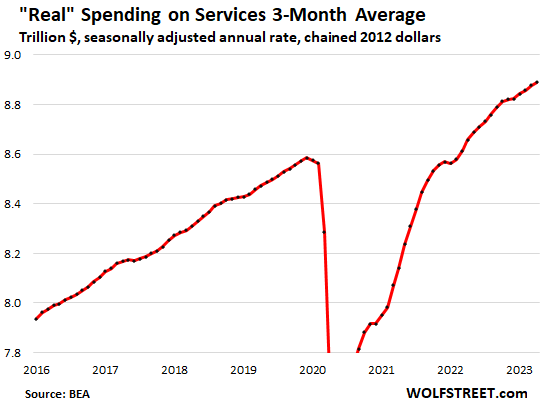
Spending on services, adjusted for inflation, rose by 0.3% for the month and by 2.7% year-over-year, exceeding the five-year average growth in 2015-2019 of 2.3%, driven in part by the surge in spending on travels and experiences.
Services accounted for 61.9% of total consumer spending in April. In addition to the Taylor Swift tickets, it includes housing, utilities, insurance of all kinds, healthcare, travel bookings, streaming, subscriptions, repairs, cleaning services, haircuts, etc.
To smoothen out the month-to-month zigzags and show the trend, here is the three-month moving average. Note the near-flat spot late last year, and the resurging growth this year, all adjusted for inflation:
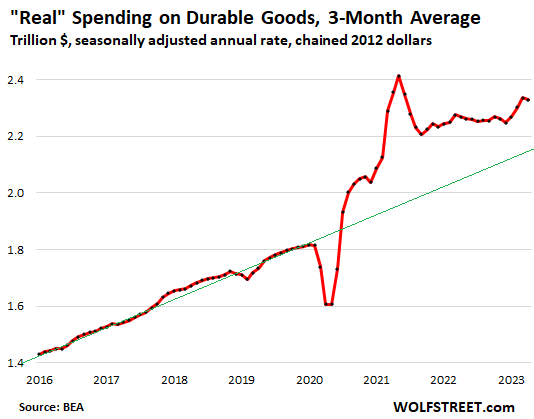
Spending on durable goods, adjusted for inflation, jumped by 1.4% in April from March, after two months of declines, and was up by 2.6% year-over-year. This includes new and used vehicles, appliances, furniture, electronics, tools, etc.
The three-month moving average in April shows the combination of the February and March dips and the April increase. The three-month average was also up 2.6% from a year ago. It is just astonishing that Americans, after the huge surge during the stimulus phase, are still buying durable goods at a rate that is substantially above the pre-pandemic trend (green line):
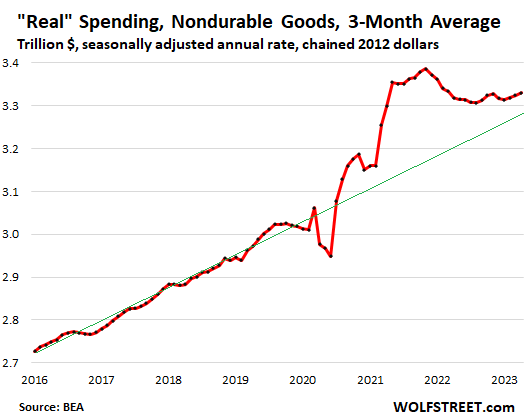
Spending on nondurable goods, adjusted for inflation, jumped by 0.4% for the month, but year-over-year was up only 0.8%. This includes food, fuel, clothes, shoes, and supplies. The three-month moving average is still well above the pre-pandemic trend:
Not even the banking turmoil and “credit crunch” or whatever slowed them down.
April was the first month that reflected consumer spending during the banking turmoil that started in mid-March, which was supposed to trigger tighter credit conditions – the “credit crunch”—that would slow down consumer spending, that’s what Fed officials from Powell on down have suggested.
But that hasn’t happened. Consumers are in no mood to slow down, they’re making more money from their labor, and they’re earning more in interest on CDs, money market funds, savings accounts, and Treasury bills – 5% instead of 0.2% two years ago. And they’re spending this money. And they’re spending some of their assets gains from the past 10 years.
And the tighter credit conditions, if any, haven’t slowed them down at all. Though they loathe this inflation, they have gotten used to it, and you live only once, and this inflation is now part of it, and spending must go on, come heck or high water in form of inflation, high borrowing costs, the credit crunch, endless layoff announcements, and the banking turmoil.
Inevitably, with consumers pushing this hard, inflation re-accelerated, as measured by the Fed’s favored core PCE price index, amid re-accelerating services inflation and suddenly jumping motor vehicle prices.
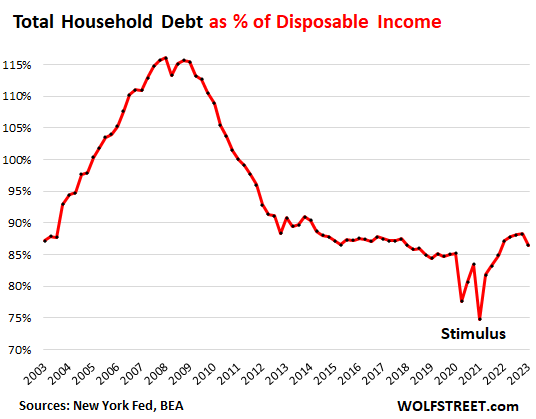
Not racking up debt in relationship to income.
And just for those who’re concerned about households racking up debt they cannot afford, here is total household debt as a percentage of household disposable income, based on data from the New York Fed. It includes housing debt. Note the dip at the end; it occurred because total household debt inched up 0.9% in Q1 from Q4, but disposable income (income minus payroll taxes) jumped by 3.0% — both in nominal terms:
Enjoy reading WOLF STREET and want to support it? You can donate. I appreciate it immensely. Click on the mug to find out how:

![]()
‘Yesterday’, the interest paid on my cash deposit purchased new tyres for my car, today it buys me a new car.
You spell tires like a Brit.
Lol!
Gotta love Brit’s tho, their society has been thru this sort of thing a time or two.
Now all they want to do is make pop hits and dress hip.
Haha, my Seattle area house went from $1 million to $1.7 million in 3 years as per Zestimates. My house now earns as much as median earnings of a Doctor in US. This in addition to all my earnings.
So I can splurge! Heloc baby, stick it to the taxpayers.
Also, an average beach resort in Maui went from $600 / night to $1500 / night.
So, now I go for 7 days instead of 14. You can see how my spending and GDP keep going up!
#Sarcasm
and as your house price goes
so do the property taxes and insurance
This is who the spenders are: The rich from houses people. The rest are broke from inflation. I know my business is completely dead(used trucks cash only no financing). When housing finally crashes who loses? what happens? The banks and their investors will fail for like this guy, I see many people spending their “forward” money or equity philosophy rather than actual cash holding philosophy. When housing officially stalls everywhere Id reckon everything just starts falling apart. I say most of the spending going on is not what I’d consider cash equity but debt money, TEMPORARY good job money, ponzi money and other misguided philosophy money. Id say these rich are oblivious to the current financial strain and condition of the bottom 70% and the upcoming/continuing ramifications of their hardship on the economy from ripping inflation. When equilibrium comes (mostly)all this spending forward money now becomes default amounts, to people but more importantly banks and lenders. I fully believe if everyone knew where this economy was going to be in one year, hardly anybody would be spending ANYTHING, except on essentials. Maybe people know and dont care, like before the end of the world comes or something, just going to have that last fun no matter what. After all there is enough bad news to justify that mentality, and with the experience of Covid, why risk it(not spending it)?
housing is the one asset that is purchased on debt and the debt bubble created by the Federal Reserve and other central banks is to blame for this mess we are in.
it is time to shut down the money spigot already. we should absolutely stop Fannie and Freddie Mae from putting taxpayers at risk for any homes purchased at this time.
Times are truly good. Economy strong, stocks ripping, inflation bearable. Seems like no landing is in the cards. For once the fed is correct.
Hahahahahahahaha
We could very well look back on these as the “good old days”.
Not sure how strong economy is if Fed government is running 7% of GDP deficit at end of economic cycle to try to keep the party going.
Your sarcasm is very suble, might want to add /s at the end of your comments.
20 months and ticking
Wolf, you are one of the few commentators who can make heads or tails out of Keynesian Economics. Speak.
I have. It talked to one person that feels this way. I live in arguably one of the top ten wealthiest towns in the country. The home prices range from just under a million to 12 million and there are people in my neighborhood who cut their own grass. More people that I can count did but go away for Memorial Day weekend this year, have been laid off (including nyself) after 20 plus years of consistent professional growth . Not to Mention earning a substantial salary of several hundred thousand dollars per year which does not provide for me and my family the way it did 10,15, 20 years ago…why because it hasn’t gone up and everything else has! Beyond Substantially! Imagine someone like my sister who earns 50K in NY, it’s poverty level at this point. This article is nonsense.
“Not to Mention earning a substantial salary of several hundred thousand dollars per year which does not provide for me and my family the way it did…”
🤣😍💖 If you cannot live on “several hundred thousand dollars per year,” it’s because of your choices. You’ve got a self-imposed lifestyle problem. Don’t blame others or inflation or the everyone-is-poor economy or Brexit or whatever.
You’ve got a spending problem — not an income problem. You’re the most drunken sailor out there.
So thank you for doing all you can to pump up consumer spending. It’s people like you that make “several hundred thousand dollars per year” and still live paycheck-to-paycheck that push up the spending numbers. You proved the point of this article 🤣
…entitlement and exceptionalism are where you find them…
may we all find a better day.
Julia,
Can your sister not leave NY?
Vote with your feet.
People *like* living in big cities with lots to do.
Also, one good strategy… is to take your “…several hundred thousand dollars a year” and invest it.
You pissed away your money and now your mad??? If you’d saved $150k a year at an average of 8% returns you’d be rollin in dough.
Also, sell your $1-12 million dollar home and pick one up for 500k elsewhere.
Are these thing fun? No, they’re not (unless you’re into cooking, horses, nature, hiking or w’e)
You can *choose* to live in a HCOL area… just don’t cry about YOUR decision.
This article is not nonsense.
This post IS nonsense.
To write something like this on Memorial Day is a disgrace.
One data set I have not seen in a while, is the % of people living paycheck to paycheck in various income category. Last I recall, even in 100k-200k income levels, some live on P to P. For those living on the edge, can this increased income earned be like “borrowing” money (at least till the inflation catches up with their increased income)? When consumers are used to spending/consuming, is any extra income just another source for gratifying the consumption craving, hence the continued exuberance?
These “paycheck-to-paycheck” headlines in the media are pure braindead BS. The NY Fed does a survey of this type, and it’s pretty good, but the headlines in the media are always the same braindead BS that people just keep spreading around without ever reading the actual NY Fed results.
But in the NY Fed survey, the question is: “How would Americans cover a $400 expense?” (Essentially the same as paycheck to paycheck).
This is what the New York Fed said:
88% can pay for it just fine.
Only 12% wouldn’t be able to pay for it right now.
They split up this way:
78% wouldn’t even have to borrow at all to pay for it. Of them:
— 45% pay with checking or savings account
— 35% pay with credit card as payment device that they PAY OFF in full by due date.
But the braindead headlines read that “55% cannot pay for a $400 emergency.” (100% – 45% = 55%) Do you see how stupid this headline is?
People need to quit spreading this BS.
I do pretty well staying at Hyatt hotels with my points from Chase Sapphire Reserve / Chase Freedom Unlimited.
They dilute those hotel rewards programs so often though.
Starbucks points has been diluted about 8 times since its inception.
The Christmas Starbucks app game was fun though.
So you’re saying these headlines don’t make a distinction between using your credit card only because you are loaded and never pay cash, or using your credit card because you have 5 cards nearly maxed out and make minimum payments every month?
I thought the surveys specified do you have the CASH, not HOW would you pay an emergency expense.
The NY Fed survey is a payments survey — how people pay for something. It’s not a poverty survey. It lists all the payment options, and you check off how you pay for it, and then what you do afterwards, such as paying off the card balance. Forever, this survey had generated the worst clickbait headlines. The articles themselves often spell out what actually the results are, but the headlines misrepresent it, and people only read the headlines – as you can tell from the comments about this topic. CNBC has a similar survey, and the headline always mispresents that actual text of the article. This is done for clickbait purposes. These headlines are just toxic BS, but that’s all people ever read.
I just received a refrigerator warranty quote for the next 3 years. It was $400.
My $999 refrigerator is in year 4 or 5 of its existence. I might entertain buying the policy for $199 but not any more.
Anyway if it broke, might have to bite the bullet on a repair of $650 or less. Which is prob better to have the cash to fix it, rather than buying a term insurance policy (extended warranty).
Extra warranties for appliances are rip-offs.
I’ve got an appliance warrantee package from Sears for $59/month. Covers all these crappy appliances I have dating back to 1987. What a great deal!!!!
Actually, the answer on credit card usage to cover the cost is NOT paying it off immediately but rather paying it off over time (carrying a balance).
Further, they ask levels of expense that could be payable solely from savings and that data looks pretty bleak. More than half responded they could only handle an emergency expense under $2,000 from savings alone.
The consumer is on a knife’s edge. The only thing keeping it going is employment security.
OK, now your BS talked me into writing an article about this over the weekend because I’m sick and tired of people slinging around this kind of BS.
So here are some excerpts, from the NY Fed, with updated numbers.
“When faced with a hypothetical expense of $400”:
63% of all adults in 2022 said they would have covered it exclusively using cash, savings, or a credit card paid off at the next statement (referred to, altogether, as “cash or its equivalent”).
That 63% is the same as in 2019
37% said they would have paid by borrowing or selling something, and some said they would not have been able to cover the expense. For these 37% of adults, the most common approach was to use a credit card and then carry a balance, although many indicated they would use multiple approaches.
Only 13% of all adults said they would be unable to pay the expense by any means.
And this:
“Some of those who would not have paid an unexpected $400 expense with cash or its equivalent likely still had access to $400 in cash. Instead of using that cash to pay for the expense, they may have chosen to preserve their cash as a buffer for other expenses.”
As with all inferential statistics, the answer is founded in the question.
Question 2. How would you pay a $4,000 expense ?
Question 3. How would you pay a $40,000 expense?
$400 isn’t even a few bags of groceries. Costco dogfood is up 100-200% over the past few years. No, we’re not eating dogfood (yet), but our dogs are getting worried.
I’ll have some answers shortly in a forthcoming article about the NY Fed data.
One question Wolf:
for how long, “all things must pass”?
“They got the biggest pay increases in decades. And they hold trillions of dollars of CDs, Treasury bills, and money-market funds, which now earn 5% and more, instead of 0.2% two years ago. And this sudden surge of interest income pushes up their overall as well.”
I’d like to know who “they” are. This is a rich man’s party, Wolf.
There are about $20 trillion in savings accounts, CDs, money market funds, and Treasury bills out there. Lots of people have them.
You’re not “rich” these days if you have $200,000 in CDs and T-bills, but you make about $10,000 in interest a year.
“You’re not “rich” these days if you have $200,000 in CDs and T-bills, but you make about $10,000 in interest a year.”
How many people have $200,000 liquid like that? Wolf, I’m starting to suspect you might be a bit out of touch with the working class.
I get tired of this stuff about “Americans are poor.” Some are poor. Some are not. The problem is the huge wealth disparity between the top and the bottom.
But there is a HUGE layer in the middle. So here are some tidbits that I could shake out of my sleeve just now:
— About 65% of the households are homeowners, and home prices surged over the past 10 years, and they have that.
— About half of households have directly or indirectly some ownership of securities.
— Close to 9% of the US adults are millionaires.
Per NY Fed data that I track:
— The top 50%-90% of the wealth spectrum – that’s 51 million households – have an average wealth of $760,000.
— Above them, the top 9% (11 million households) have an average wealth of $4.4 million.
— Above them are the 1% (1.28 million households)
In other words, 62 million of 128 million households are fairly well-to-do. Above them are the 1%, including at the top of the 1%, the truly wealthy.
If you have $200,000 in CDs and T-Bills, and that’s all you have and don’t own real estate or stocks, you’re not even in the top 50% in terms of wealth.
You see, there is the huge middle layer in the US. And yes, I see that middle layer everywhere.
A lot of people have that amount, but the point is that the resulting $10K doesn’t make you rich.
D.C.
I hear you. My modest nest egg is finally getting some decent returns but I’m keeping it aside. Asset profits, pay raises? Nyet. Rent increase? Possible dental work and car replacement upcoming? Da. I guess I’m the odd duck in the pond. A windfall isn’t something I squander, especially after hard times. I’ve seen the bottom fall out before on good times and it ain’t pretty.
I never said “Americans are poor.” But now you’re going straight into “homeowners,” “securites” and asset holders again – the recipients of the QE BS. See, you’re basically acting like everybody is spending like drunken sailors when it’s the people who the FED made richer. Again, this is a rich man’s party, Wolf. I believe this article is painting a rosy picture about the effects of QE, to be quite honest.
Best I can find, the median savings of the top 10% is still less than $200k. You need liquid assets to have $200k in CDs, treasuries, etc. You’re talking about rich people, Wolf. You just are. Because nobody but the rich have $200k liquid.
I do.
I know at least a dozen people who have 200k in liquid assets (myself included). My net worth is just under $3M, which doesn’t even put me in the top 10%. While I certainly recognize I am fortunate to be in this position in my late 30s, I wouldn’t consider myself to be rich. Doing well but certainly not some rich fat cat.
“I know at least a dozen people who have 200k in liquid assets (myself included). My net worth is just under $3M, which doesn’t even put me in the top 10%.”
This is called confirmation bias. Further, your assertion that you’re not in the top 10% with a net worth of almost $3 million is either ignorance or just a bald-faced lie.
“— The top 50%-90% of the wealth spectrum – that’s 51 million households – have an average wealth of $760,000.”
Whhhhhaaaaat? I thought “the middle class doesn’t exist”???
Depth C, I enjoy your stuff. Keep in mind that people in one income/wealth class just can’t imagine how people above them can be richer. Friends who are >99th percentile don’t think of themselves as that rich, and are amazed in wonder at “those truly rich people” with so much money. I think Wolf is right here, that the majority of the country is a lot richer than you think.
My sense is that it’s a bit rarer than these numbers suggest as well — unless the fairly broad cross section of gimpers I run with are all feigning below their stations as some twisted bid to noblesse oblige.
If, however, my lying eyes deceive, then this data essentially suggests that the engineers and overseers (Greenspan, Bernanke, et al) the last few boom/bust cycles are owed some kind of prize for making the middle class hyper-solvent and punch drunk again.
@Depth Charge,
The overall Debt Service Ratio (DSR) in the United States is less than 10%. I have looked for that data by income quartile or quintile for the US, and was unable to find it. If anyone can dig that up, I’d love to see it. With that data we could answer if it is a rich man’s party, or not. PS Quintile level DSR data is readily available for Europe, so it is odd I can’t find any recent US government or academic sources for that data anywhere.
“I know at least a dozen people who have 200k in liquid assets (myself included)”
How would you even know such things? Seriously, I never discuss so much as what my electric bill is with anyone let alone the details of my liquidity position. In my experience, people will more readily discuss whether they’re circumcised or if they killed a drifter in their youth before they’ll divulge about the decimal stuff.
I’m not biased. I don’t want anyone to be poor, and I also realize that lots of talentless dickheads fail upward every day. That said, I think, as is so often the case, it’s hard to reconcile the upward zigs and zags with the firsthand picture I assemble from my relationships with other working class family & friends throughout the territory.
I like to think that the millennials and Gen Z took a page from John Lennon’s antiwar slogan and respun it for the economy; what if the Fed threw a recession and nobody came?
Depth, they’re old. They played the game the silent generation left them. Which was Monopoly with no competition.
Now we get Tsunami the bubble game.
Their kids are just waiting for them to kick the bucket so they can kick their feet up.
No offense.
@Depth Charge,
{ I never said “Americans are poor.” … [those] spending like drunken sailors … it’s the people who the FED made richer. }
My final comment… I somewhat agree with you here, but not completely. It’s true, the rich folks are likely responsible for the bulk of the overall “pay whatever” inflation when they buy a $140K pickup truck rather than walking off the lot, as they should. That’s true. On the other hand, there are hundreds of millions of people out there that are paying a dollar more for their favorite food item because their COLA went up, or their minimum wage increased by 15% over the last two years, rather than finding a replacement brand that is cheaper. That also causes the “pay whatever” inflation, just in a different category. Like Wolf keeps saying, it’s a game of whack-a-mole among these categories that is causing inflation (including wage inflation) to move up ever higher.
Furthermore, as far as wages go, I live in one of the most expensive areas in California, three miles from the famous vacation beaches, and yet I live well below my means. The minimum wage in California is $15.50/hr, and the starting wage at the local burger joint is $19/hr up to $22.50/hr. If my wife and I went back to work full time at starting wage, we would make a minimum of $79K a year with medical benefits. Our rent for our 2 bed/2 bath 1000 sqft apt is $25,740/yr after last month’s rent hike. That would give us about $45K/yr of discretionary spending to allocate towards “pay whatever” while living the good life, which I’m sure all of our neighbors are doing with their money. So, every income bracket is contributing to inflation. But again, I agree that the very high earners that are dropping extra tens of thousands of free money on cars or extra hundreds of thousands of free money on houses without blinking, are the worst culprits in driving up inelastic inflation. Rents especially, are probably one of the hardest categories of spending to bring down once they have worked their way up.
Sorry. About $40K of discretionary spending at starting wage, but we would earn about $14k/yr more gross at the bump up wage. We own our (older) cars outright, so no expenses there.
There is some confusion about the net worth data. It treats people with illiquid assets equivalent to those with liquid or with ongoing earnings.
Someone may have a HH income over $250k and liquid assets of $1m. A house worth $500k with a $400k mortgage and a net worth of $1.1M.
Another has a HH income of $100k, liquid assets of $100k and a house now worth $2M with a mortgage of $1M.
They both are “millionaires” and will populate the survey in the top 10%. They are not equivalent, however, in functional or durable wealth.
You can also see it in the mega rich. Elon Musk vs Bill Gates. On paper Musk looks wealthier than gates but in reality, not nearly the case. Gates has dramatically more buying power and the cost of converting his paper wealth to actual cash (or buying power) is dramatically lower.
True “millionaires” in the US that aren’t relying on illiquid wealth that is massively leveraged (real estate) and have significant income and time to earn (eg under 50 and high earners) is less common.
In a strong economy, with booming employment, the distinction gets blurred as the levered act like the durably wealthy. As the economy weakens the distinction becomes apparent.
Don’t forget Pensions and Social Security Wolf!
Those numbers above don’t show the “poor retired teachers” who get $50k a year retirement.
Father in law retired in CA and got 100% of his salary FOREVER. He’s just a “poor blue collar worker” (who drives an Audi SUV now).
I agree with Depth Charge. The return on Money Markets just recently started going up since maybe March of this year (around SVB). Most don’t even know how to buy Treasury bills, so many simply will be putting cash in CD’s. Most CD are probably a year minimum, so that money haven’t even been paid, let alone spent.
I talked to a delivery driver, that plans to go on his own. HE is already counting money, before even starting working for himself. He bought a used Semi Truck using his 401K money. The rest he spend on vacation in Mexico. Then he cannot comprehend, why he had to pay income tax on that money, yet he understands early withdrawal penalty.
I can see older generation spending more, because most of them downsize, so selling a $500K house to move into $230K condo is nice chunk of cash. After-all, when are they going to spend it? Otherwise, I think most are spending by looking through their rose colored glasses – “My 401K is that much $XX, my bonus will be $XX much, so I can treat myself to buy a new car using my savings…” Except 401K is just a current market value.
“Most CD are probably a year minimum”
Not true – most of the CDs in my ladder have 3-9 month terms. I haven’t bought any with durations longer than a year.
Thanks to Wolf for pointing out the obvious backed up by statistics. No confirmation bias there! I actually agree with Depth Charge on most of his comments but it’s always about robbing the younger generations.
“…I’ve been broke plenty of times, but I’ve never been poor…” – Mike Todd.
may we all find a better day.
@JeffD
“The minimum wage in California is $15.50/hr, and the starting wage at the local burger joint is $19/hr up to $22.50/hr. If my wife and I went back to work full time at starting wage, we would make a minimum of $79K a year with medical benefits. ”
This (and your updated estimate) assumes that y’all would have a guaranteed 40/wk schedule, which is laughable. Try splitting that with four other minimum wagers so that none of you will be risks for paying out overtime, let alone benefits (which probably suck anyway). A pittance of sick days and a 21 year old manager who gets their kicks playing god with the hours your entire family depends on for dear life. A third of your earnings are taken out in taxes, and the other two thirds are split between rent (more like 50% if you “choose” to stay in CA), food, and other fixed expenses.
“And this sudden surge of interest income pushes up their overall as well.”. I think you are missing a word in that sentence. Overall wealth?
Income.
Thanks.
DC,
I always enjoy your comments. Here’s my own personal example of who “they” are. The Boston area firm that I work for issued a $5,000 one-time “inflation” adjustment bonus given to all employees below VP title. This comes on top of a 5% across-the-board pay increase and annual bonuses. This all payed out earlier this year and jives with Wolf’s analysis.
So what does this mean? Soft landing? No landing? All the recession indicators piling up are just an enormous head fake? Is it really different this time around?
As of now, no landing. Just cruising along at 33,000 feet.
So how does Fed bring down inflation then? Or do we just get used to 5% inflation?
People already have. NBD.
Maybe everybody had just been underpaying for everything for decades.
They are bringing it down. It was close to 9% and now it dropped below 5%. Nothing goes down in a straight line.
There is about 24 trillion in home equity out there that can be tapped as needed.
when money gets tight people will 1st use credit cards and then use Home Equty 2nd
The just have to wait. Does no one else think this is either the Roaring 20s or Weimar Germany? Both partied hard until the 11th hour.
Really seems like the Fed Funds Rate has to be greater than Inflation…
Imagine that…
/sarcasm
@ elbowwilham — quite.
Wolf love that statement. Hope engines don’t fail
The longer the can just gets kicked down the road, the harder the landing is likely to be. The Fed was aware of the housing bubble in 2004 but decided to raise rates very slowly, never more than 25 bps at a time. All the while it continued to inflate until it popped 3 years later
So many people have made so much money on asset bubbles over the last 30 years, a little inflation after missing out on life for 3 years during the pandemic is not going to stop them.
I dunno, I usually read about the generation X guy who was laid off in the Dot com bubble, lost his house in the 2007 debacle, just got out of bankruptcy right as Covid hit… and now he’s getting laid off from his end of career tech job.
That guy’s had it rough. So I’m not really sure who has surfed the last 30 years well. Maybe the boomers have done ok, but lots have been chopped up in their wake.
A lot of the homeless are boomers, plus Gen X too.
I know these people. There’s lots of them. If anyone thinks these peeps care about this country any longer with the hand they have been dealt… better learn Mandarin, real quick. And your spot-on, their not real high up on the boomers.
People better wake up,we produce very little. While the rest of world refuses to be our slaves ,for worthless FIAT
my observation has always been you need money and the free time to spend it to get a real economic conflagration – and we have both in vast quantities – every thing wolf wrote mixed with 3-4 day work weeks and you have our current reality – ( I know some dentists and doctors here going to 3 days per week – no reduction in income – this is for them and their employees to keep them from looking for the ultimate work con – wfh) enjoy it
In my nearest UK town (pop. 9000) the medical centre is staffed by:-
11 x GPs (primary care physicians)
2 x Nurse Practitioners
1 x Matron
2 x Nurses
2 x Health Care Assistants.
Of these, only one person – a Health Care Assistant – works a full 5 day week.
I go from $20,000 in annual interest income to $80,000 in annual interest income in one year. The money comes from the change in Treasury rates. It comes from Treasury (the government). This sounds a lot like stimulus. It certainly is not going to put much of a crimp in my contribution to inflation. C’mon Powell, raise rates faster, higher, longer.
Dumb question but would the inflationary pressure of earned interest be more dependent on the difference between the rate an inflation or the total amount earned.
IE
100k at 5% gets you 5000 a year to spend, but inflation is 6%
100k at 1% gets you 1000 a year to spend, but inflation is 2%
In which of these scenarios would the interest feed inflation more?
But your $80,000 only buys $40,000 worth of goods now.
Effectively cutting your interest income in half.
Then inflation is still gnawing on it. You should phone up Powell and tell him to raise that rate to 20.
Not sure where you get your numbers. I have never bought $40,000 of goods, real or nominal. My biggest goods outlay is food, about $6,000 a year, maybe up $1,000 from a year ago. I drive a 12 year old low mileage Honda Accord, paid for long ago. Inflation affects people differently, sometimes very differently.
I think you are under calculating.
The ego takes over sometimes.
Let’s get real! :)
I think I know my own budget for goods. So tell me, what do you spend annually on goods, by broad categories.
“My biggest goods outlay is food, about $6,000 a year” Gas alone would be more than 50% of this number for American driving roughly 13,000 miles. Utilities, groceries will be far more than $3000, unless you are drawing electricity from your neighbor without him knowing.
Yes lets get real please.
One more time. I said my biggest goods outlay is food, about $6000 a year. I don’t need to drive much, so maybe $500 for gas. Maybe I’ll buy $500 of furniture and clothes. Utilities are sometimes defined to be a service (there is some debate about this). So let’s add $1500 for utilities. That’s about it for goods. Now add let’s say 10% for inflation, so I am spending about $850 more a year because of inflation. That is quite a bit less than the $60,000 more I get this year compliments of the Treasury Department.
Go ahead and cut those numbers in half yet again. Interest income is not tax-deferred.
Ever hear of I-bonds? IRAs? Inherited IRAs?
Aaaand the tax on interest income is not 50%. At least not here in the U.S. The top rate is 37% and it’s bracketed and it hits only the portion over $578K.
Inflation impacts people differently. It all depends on your spending habits and expense structure. Our income is up dramatically (our YTD interest income exceeds the past two year total combined). Ya’ know what’s funny? We haven’t changed our spending habits at all. We’ve always lived by the “don’t eat the seed corn” mantra. But we also never spent money only because we had it. Money is a tool to be used with precision and thought. That’s the difference between people of similar incomes and backgrounds. Some get it… some don’t.
Interest income is taxed as ordinary income, so it would be subject to income taxed much lime W-2 or 1099 income. If the poster had no other sources of income, that $80,000 would be his income for the year that would be subject to taxation.
Wiliam…
agreed.
Fair return for the holders of dollars IS a consumption engine. It seems unusual today as it was missing for 14 years.
And for those 14 years it was the Government that received the “benefit” of the lack of “fair return”. They held the ball for 14 years……and the national debt went from $9 Trillion to $31.5.
But even in the past year, the return did not cover inflation….and really fell short when taxation is considered.
I do wonder how this will affect inflation. Most of the people earning 4x interest income now are people with cash, ie savers. I can’t see them going out and blowing the extra income on Lambos and Vacations like the crypto or stonks crowd.
I imagine some people who like to save are like El Katz and me. But we will buy a little more and not really worry about prices this year, like we might have once done. We will not likely substitute down for something that now costs 10 percent more because of inflation (substituting down helps keep inflation in check). And then there are people who really like to spend when they get a bunch of money (from any source). I like them, because they really jack up inflation, which eventually increases my interest income. So to all consumers: spend, spend, spend. To Mr. Powell: raise, raise, raise.
@Depth Charge
“How many people have $200,000 liquid like that? Wolf, I’m starting to suspect you might be a bit out of touch with the working class.”
I got this data from Forbes. Wolf can shed more light on it.
– The Fed’s most recent numbers show the average savings for the age group that includes 25-year-olds is $11,250. The median savings is $3,240.
– The Fed’s most recent numbers show the average savings for the age group that includes 30-year-olds is $11,250. The median savings is $3,240.
– The Fed’s most recent numbers show the average savings for the age group that includes 40-year-olds is $27,900. The median savings is $4,710.
P.S. My own observation is that the average savings for all these groups is negative if they are male and divorced, or they got a new girlfriend who loves to eat out and travel.
“SAVINGS”????? This Forbes stuff is some stupid BS you’re posting. In terms of liquid assets, consumers own $10 trillion in savings accounts and CDs. They own trillions in Treasury securities and money market funds – none of which are “savings,” jeeesus! That’s on top of the cash they have in their brokerage accounts (their dry powder), which is not “savings” either.
I just gave you some averages of the wealth of the 50% and up, by wealth category (in reply to Depth Charge above), and you feel compelled to post this Forbes BS about “SAVINGS?”
It’s good you got warmed up on him, because you’re going to be exploding on me up above because I said “savings,” too.
I have read your previous columns on net worth in our country and they, like many statistics, can be twisted to fit your argument.
Average in my opinion is a poor gauge as it skews the numbers net worth – as we all know is top heavy.
Apologies I don’t have recent numbers, but using median, in 2020 the 50% median net worth was approx. 121k, and the average was approx. 747k
75 percentile was median 403k in 2020.
To say the net worth of the 50-90% is 760k I don’t buy, as it is probably all in the 80-90%.
As just as importantly, most of the middle classes net worth is in housing, which with rates now at 7%, and as any risk manger knows would be (like zillows asking rent) a mythical number if everyone ran for the exits as in 2009, the true liquid net worth for the 50-90% group is less than the 200k mentioned above one of your readers has in CD’s
You really need Asset, Debt, and Income information to make any assessments, and you need it across *all* account types, including real property. You also need the debt-term information, because 10yr loan vs 30yr loan has different implications. For some reason, no one ever does a decent job of diving deep on this, probably because the government doesn’t make all the information available.
I get a kick out of these people that think that Americans, or most Americans, are poor or broke, and that they’re all charging up their credit cards to buy groceries, because they’re paying with a credit card at the checkout, instead of writing a check, LOL. With these blinders on, these people will never understand the US economy. And that’s what we’re talking about here — the US economy, not the poor guy down the street.
“To say the net worth of the 50-90% is 760k I don’t buy, as it is probably all in the 80-90%.”
“Apologies I don’t have recent numbers, but using median, in 2020 the 50% median net worth was approx. 121k, and the average was approx. 747k”
From the data you provide net worth at the 50th percentile is $121K. Everyone above that point has a higher net worth all the way to the 90th percentile. Thus, all the wealth is probably not “in the 80-90%.” You’re correct that averages are skewed by the top, but that doesn’t mean you should ignore the fact that from 50-80 there is still real wealth.
“I get a kick out of these people that think that Americans, or most Americans, are poor or broke”…
American’s are far from being broke, but most are not financially smart. In fact, I always wondered (way before this mess), how people in top positions making, top dollars have so little to show and panic the most when they get laid of or fired.
“With these blinders on, these people will never understand the US economy. And that’s what we’re talking about here — the US economy, not the poor guy down the street.”
Nah, I think we understand it quite well. It’s a rigged joke that just handed obscene amounts of wealth to the already wealthy, who are now carrying the entire thing with the modern day version of the Roaring 20s.
Brian Murphy – my pet peeve is using “average” versus “median” also, as such can twist base reality unless the top and bottom are thrown out in the process to get a better ” true average”.
Perhaps Wolf will address the top 1% “rich/wealth” debate in a future article, the confusion runs supreme with the American populace in terms of “wealth”. I know he has talked “wealth” and “Percentiles” in the past, yet there are a few specifics that could help people understand the multiple variances.
For example, “wealth” depends on age, so at age 18 you can be “Top 1%” with only $435k in wealth, yet at age 50 you need to have around $12 million in wealth to hit “Top 1%”.
Then you have “income wealth” (versus asset wealth) “Top 1%” which starts at about $500k/year. To hit Top 0.1% is about $2M/year, top 0.01% is about $10M/year. That is why you hear the saying “Land rich, cash poor” in rural America, as you might own $10M in land, but only make $200k/year via a 2% return on the land. That would place a person in the top 20% income group, yet top 1% wealth group also.
And then you have location, location, location. A top 1% home in Monaco will cost $26.4M, New York $3.6M, Miami 1.9M, Mumbai $600K, etc.
Plus everyone’s definition of “wealth” is different. For example, I think those who can do “what they want, when they want” are the true wealthy.
To each their own, life and let live is my motto…
i enjoyed this post. I think perspective is a variable that must accompany any thought of wealth. What I am saying is if equilibrium was played out fully to par in all assets, what is my wealth? We all talk of today but things will change. Will my wealth change? It went up recently. Will it go down? If stocks and housing go down 50%, what will my wealth be? If AI replaces my tech job what is my wealth in a year. Thinking of today only is short sighted. Equilibrium always comes and we are in an everything bubble. Paper wealth is not real. Everyone knows that. But to spend according to your current wealth as opposed to your remaining wealth after equilibrium comes, this is perspective which might develop prudence. They spent like crazy and partied like crazy…in the roaring twenties. Did they know it was a time of bubble, unsustainable and equilibrium was coming? With the right perspective they may have and prepared and preserved wealth. My point is wealth without good perspective may be just denial or folly, in hindsight. Everyone seemed rich in 1999, and in 2007. Then equilibrium showed up. And no one seemed rich anymore. Reality has a wide perspective. Foolishness and denial…narrow.
It seems like continuing to increase short term rates is just going to be net stimulative for consumer spending and maybe even a little inflationary (it sounds stupid when I say it aloud).
Should the Fed just pause the rate hikes and instead focus on increasing QT (at least remove the monthly caps)?
No I don’t think so. Debt, especially for real estate is a big driver. When a young person leaves the nest and borrows to buy new construction, he has just put the price of the house say $500,000 of economic activity into the economy.
If banks slow lending it tightens things up real quick.
One wonders if inflation is stubborn not in spite of JPow’s policies but because of them (ie all that extra interest income).
I don’t think the average person is making enough interest to keep fueling inflation. There’s a lot wealthy people but it’s not all liquid. I have 450k in cash which I think isn’t VERY common (maybe it is?) and I’m making just under 5% and this translates to paying for one of my kid’s daycare a month. It’s not mind blowing amounts of money.
After 20 years of printing money, people have forgotten what is normal and what is not. The normal thing is for the lender (the saver) to receive interest for his money and for the borrower to pay for the use of this money.
Is it fair to say that us “drunken sailors” spent more not in spite of inflation, but BECAUSE of it, to some degree? I mean, I just spent $20k on a Chrysler with 150k miles on it. What would that have cost 10 years ago? $5k? True, the taxpayers are giving me “clean car” money to soften the blow, but doesn’t that still come across as spending like I did when I was a drunken sailor?
Inflation is to blame for some of the nominal increase, but Wolf’s charts show that spending increased faster than inflation.
20K for a vehicle with 150k miles on it? Thats insane. You can get a new subaru for probably 28K and that will do 150K easy if you maintain it.
But he’d have to drive a Subaru…..
We’ve got a Chrysler fan here.
Subaru… Always a good choice.
That is crazy. I just bought an Infiniti with 50k on it for 23k at Carmax. Who talked you into that deal?
All this spending Speaks to Charles Schwab Modern Wealth survey 2022 qualifiers, who keep the ball rolling, doesn’t take genius to figure who’s in this crowd. They don’t cash their paycheck at the liquor store that is for sure.
People with the top 1% of net worth in the U.S. in 2022 had $10,815,000 in net worth.
The top 2% had a net worth of $2,472,000.
The top 5% had $1,030,000.
The top 10% had $854,900.
The top 50% had $522,210.
The top 50% are well off, per your numbers. That’s a LOT of people. That’s a 166 million folks!
Per NY Fed data that I track:
— The top 50%-90% of the wealth spectrum – that’s 51 million households of a total of 128 million households – have an average wealth of $760,000.
— Above them, the top 9% (11 million households) have an average wealth of $4.4 million.
— Above them are the 1% (1.28 million households)
In other words, 62 million of 128 million households are fairly well-to-do. Above them are the 1%, including at the top of the 1%, the truly wealthy.
Also, people forget about pension. It is probably not included in net wealth or savings.
I have a friend who is a retired teacher from chicago. She gets $90k a year pension that started at age 57. If she lives to 77, she will get paid about 2 million after including all the COLA increase along the way. So in theory, she will receive more money in retirement than she received while working 30 years. She has very little savings but she is doing just fine.
From Chicago + Public Pension = Set For Life.*
*until the whole house of cards implodes
And do not forget the “free healthcare for life” with zero co-pays and deductibles.
Here’s my guess where a good part of this new cash is coming from:
The Fed printed a ton of money between 2008-2015 — that did not result in noticeable inflation because it went to rich people as the Fed was buying assets–mainly to prevent a run on those assets. FDIC for the rich. It wasn’t spent because much of it was just replacing assets that were already being held. No need to spend it because inflation was low. The FED then concluded that helicopter drops of money (on the rich) DO NOT cause inflation.
But this time— the covid helicopters dropped their loads on zip codes with people that really needed money to spend–which DID cause inflation. I’m guessing that is scaring some of that money out that was went into storage in those early years now being brought out of the closet and is buying stuff. I suspect that’s why a lot of extra spending came from higher income people–also accounting for the particularly high price and demand we saw for expensive cars.
I think any increase in the money supply, even if it supposedly only ends up in “assets” is ultimately destined to end up in goods and services too. It’s just a matter of timing.
At the beginning, maybe not, as people are less willing to “spend their gains” when they think those gains might evaporate. But the Fed has spent the last 14 years inflating assets, and people, rightly or wrongly, believe that will continue forever, so there is no need to hold back anymore. That’s why they are doing what you are referencing with respect to cars, boats, houses, etc.
Maybe I am connecting the dots all wrong, but is this just the baby boom demographic shift to retirement playing out? Especially since those with most accumilated wealth are those entering retirement, I can see the argument based off what you wrote that it is their time to spend down the wealth in assets they got over a lifetime unleashing money velocity. Would also explain the lower unemployment
So let me just distinguish here:
Millennials are now in their peak earnings years, and they’re spending bigly to furnish their new homes they bought, and to pay for all the stuff the baby needs, and to pay for daycare and all the other stuff. THEY are the big spenders. But they’re spending their income from labor, mostly, not investments.
Retirees are not the big spenders. But their spending increased because they can now spend their interest income that was zero before. And they’re also dipping into their assets, which is what they’re for. And yes, as you said, that sends money circulating.
Wolf– Some of those millennials spending big bucks for new homes–probably getting assistance from parents and grandparents who are baby boomers–glad to help with money they hold that is not being used, but being is attacked by inflation.
“He who gives while he lives knows where it goes.
– Percy Ross
A total of about eight trillion dollars in 401ks with Boomers hitting mandatory MRDs and lots of Covid millionaires created by PPP, EIDL etc. are also adding fuel to the fire. Wall Street knows the next leg up is coming unless the Fed decides to call it off, which isn’t going to happen. Fed independence is a myth.
RMDs, not MRDs. These are taxed when distributed, so maybe the 8 trillion (if that is the number) is really about 6 trillion after taxes. Still a lot, but not as much. Sorry kids.
X’er son. DIL got new job. Combined they are now making $500K.
Millennial daughter unit just got an 18% raise. January she’s scheduled for another that amounts to an additional 25%ish.
Explains a lot.
As the lyrics from Crosby, Stills and Nash claimed: “Teach your children well”.
This is so crazy. What will break the American consumer first; continuing higher inflation each month or higher interest rates. Nice job, Wolf, bringing in Taylor Swift. There were stories of people paying up to $5,000/ticket. Madness
Is the consumer being whacked by high interest rates?
With inflation as measured by the rather benign BLS measurement around 5% ind interest rates around the same we still have real interest rates around zero. It is no wonder consumers have adopted a drunken sailor behavior.
Jerome Powell is certainly no Paul Volker.
If you use Wolf’s figures, the top 49% (excludes the top 1%) have $83 TRILLION in wealth!
If they now earn 5% more on only 25% of that money, it’s an extra $1.0 TRILLION sloshing around the economy … every year!!
That’s a lot of drunk sailor money to spend. 5%, 6%, 7%, even 8% fed funds isn’t nearly a big enough sponge to soak up all that beer!!!
“it’s an extra $1.0 TRILLION sloshing around the economy … every year!!”
Yes, remember that someone (or something) has to PAY that interest to them.
According to a recent paper by the St Louis Federal Reserve, “ The bottom 50% of households by wealth had $59,000 on average. As a group, they held only 3% of total household wealth.” They aren’t benefiting much by increased interest rates but are getting killed by
inflation. In other words , the rich are getting richer and the poor, poorer. That’s what fuels
revolutions .
Just remember, you can make $400K/yr income for 40 years and still be in the bottom 50% of households by wealth. Yes, some people (a lot?) blow pretty much their entire paycheck each month at *all* income levels.
Tis why one party starts with Demo…
Demolish also starts with Demo…..
Yes.
Americans, Brits, and others are raiding their assets to spend spend spend!
Gross wealth per-head (2022) is a key stat that shows true spending power.
* US = $470k
* Canada = $240k
* UK = $190k
* Germany = $130k
* China = $40k
As long as house prices, savings rates, classic cars, and the Dow keep on going up and up, for us to dip into, we’re all good :-)
Maybe I travel in a weird circle, but I know of no one “raiding their assets”. Some are simply enjoying additional cash flow from getting a return on their deposits after getting screwed for over a decade.
Don’t eat the seed corn. If you don’t, you’ll always be able to eat.
Are the “Adjusted for Inflation” spendings represented in today’s dollars? If so, does this adjustment lift up the spendings of the past years? For example, if todays spending is $1.00, then in the graph in one year would show today’s spedning as $1.05?
inflation adjustments are via 2012 dollars. The not adjusted amounts are in today’s dollars, but they’re not listed here since it’s all inflation adjusted data.
For example, total spending:
Not inflation adjusted: 18,268 billion SAAR (not shown)
Inflation adjusted in 2012 dollars: 17,845 billion SAAR (shown)
Congratulations for being the most bullish “bear” on the planet. It cracks me up that accurate reporting is usually characterized as “bearish”.
Ha, yes that’s true.
Watching the Nvidia AI surge in the stock market this week reminded me of the dotcom surge. I know the market is flat for a year and down from Jan 2022, but with the debt ceiling drama that pushed the market down 20% in 2011 hanging over its head, the market is elevating. For example, QQQ is up 30% this year. There is still a massive amount of excess liquidity, or liquidity potential (RRPs, excess reserves) and speculation, in the system. The Fed has a lot of work to do to bring the rate down to 2%.
Looking at monthly long term charts on the SPY Qqq. Smh. It’s breath taking. The huge negative divergences are gob smacking. This is a much worse blow off than 2001 and a handful of stocks leading and holding it all up. It’s taken 23 years and a new generation of investor speculators who will soon learn the hard lessons of those who suffered in 2000 to 2003. Just sitting back and watching the Algos lead the markets up to new heavens. Then Toonces takes the wheel
Many ways to value the stock market, but most long term measures still show it more than 2X over valued.
“They’re using the gains on their assets, and those gains don’t show up in the income figures; but spending even a small portion of those gains does show up in the spending figures”.
I must be missing something here, but how does someone “spend” an increase in asset values – by realising some gains (selling some assets), or by borrowing against increased asset values?
Ain’t “rocket surgery”.
I have a CD. CD pays monthly. I have $200K….. at 5%. $10K per year (simple interest). Have an additional $825 is per month to spend (with an allowance for taxes).
No need to sell bupkus.
My FIDO account (non-IRA/401K) pays enough in monthly income to pay our nut. But then there’s Merrilledge… and SS…. and other sources of income. I’m actually not liquidating, I’m buying.
Maybe some people need to go find a 60’s vintage “home economics” book to figure out how it’s done. Starts with having a budget. Next step is sticking to it.
1) Real consumer spending is up from 14T to 14.35T in the last 18 dots.
That’s 19B/month. Tranquility in the last year and a half, before volatility.
2) Real personal income, without transfer money, is up from 14.6T to
almost 14.7T in the last 18dots. That’s 5B/month. To prevent from falling
and losing their balance employees keep moving on their bicycle.
3) Real pending on service : the widest breadths was done between 2020 and mid 2021.
4) Real spending on durable goods and non durable goods are down for
two years. Business owners are struggling, hanging on, keep moving. All they need is a trigger to start laying off expensive, unproductive workers, in dead horse businesses and sectors. They beg for a trigger.
You don’t need NVDA to learn from Wolf data.
Interestingly enough, I polled some Swifties (AKA true Taylor fans) and they said they only spent $200-$300 on her tickets.
Only?
Well everyone thinks they were 10x that number.
I thought it was 10x too. But a good number of her fans have jobs and no one gives them much. So they bought their own ticket.
When I was coming up you could go out to a festival in CA for $50 with parking.
See a regular touring concert for $30-40.
Soon after Nixon took us off the gold standard, I saw my first big concert, 1972 San Diego Stadium, Quicksilver Messenger Service, J. Geils Band, Dr. Hook, Jesse Colin Young, Foghat, and others, with tickets for a whopping $1.01. Also in that time frame saw an early (if not first) Comic-Com here, and heard Rod Serling speak, where you were inches from the all-time greats, for almost nothing in admission costs. Vegas was similar.
10-12 dollar concerts ,when I grew up 70s ,then prices went way up 100-150 ,I only paid for top bands eagles,Rolling Stones
I just buy the albums… and a superior audio system. I can listen to it over and over for the cost of the electrons.
I went to a meeting of the University of California Regents back in the late 60s. It was free. No weapons checks. I sat directly behind Governor Ronald Reagan, about two feet behind his head. He had very greasy hair.
Mr. Reagan knew well that it was more important to look good for the camera’s eye than the up-close and personal. My younger sister’s best friend at age 14 (who was afflicted with severe childhood-onset arthritis) noted the governor’s heavy stage makeup when introduced to him at a charity event in the ’60’s…
may we all find a better day.
The stealthy Anti Regulations Act allowed the Fed, the ECB, the BOE, the BOJ, the PBOC, the bs global central banks in their trading rooms, imitating each other, raiding in and “borrowing” for funfunfun from checking accounts, saving accounts, CDs… shorting them ==> to finance gov spending that create the global debt tsunami.
Thanks Wolf, this is a great website. I love your work and the comments are generally intelligent without too much acrimony.
I am trying very hard not to spend and looking for safe investments that keep up with inflation and will mostly hold their value during hard times which I believe will come.
In a downturn ,everything depreciates but I say take 9k divide in 3 trades 20% off 35% off and 50% off .has worked well
Wolf, do you now see that the Fed has in fact been stoking inflation all these past months? I remember you defended Powell’s “disinflation” comments. What disinflation? It looks like what we have is the mother of all bubbles about to explode, if he pauses in June, and if the debt ceiling is raised. YOLO, right?
What kinds of BS are you fabricating here about what I said? Don’t say from memory what I said a few months ago, if your memory is this shitty. Everything is in writing in public, and you can just go find what I said, and then cite it. But you’re too lazy to do that, so it’s easier to make up stuff because it fits your agenda?
“Disinflation” = inflation that is lower than it was before. And if you look at the overall CPI and PCE numbers, that’s what Powell et al were referring to a few months ago, because overall CPI and PCE have come down, thanks to the collapse in fuel prices, and the drop in used car prices, and some other things.
Here is what Powell actually said — not me!!!
https://wolfstreet.com/2023/02/01/what-powell-actually-said/
And here is the same chart as in my inflation article yesterday, but with the “disinflation” period marked in green, for you so that you can understand what “disinflation” actually is:
“What kinds of BS are you fabricating here about what I said? Don’t say from memory what I said a few months ago, if your memory is this shitty. Everything is in writing in public, and you can just go find what I said, and then cite it. But you’re too lazy to do that, so it’s easier to make up stuff because it fits your agenda?”
Wolf,
I deeply apologize for my error(s), and for dragging braindead b.s. in here. You are right, I am wrong, and I shall henceforth be more accurate in my comments.
Signed,
Michael Santos
Mr Santos,
Disinflation is declining CPI as in
CPI going from 5% to 4%.
Deflation is simply a negative CPI, like -2% or -4%.
Often confused.
I had assume disinflation was the same as deflation, but that definition makes more sense.
Late to the comments here Wolf, but I just wanted to mention how this article describes me pretty well. I’m 61 and started working part time last year. My mortgage and all debt is paid off. My net worth is close to $1.5 million. My part-time income runs about $70k. Not what it used to be, but I don’t have to save anymore. My wife and I live fairly modestly, and with no debt, all of that money is available to spend, and I now have the time to do it. Just got back from a week long, 30th anniversary trip to Manhattan. I’d never had a chance to go and thought it would be fun. And it was! Home for a couple of months, then it will be a couple of weeks on the beach in Cocoa Beach. Let the good times roll.
What type of health insurance do you have? What are your premiums? Still too young for Medicare to kick in.
A blue Cross plan through Obamacare. $4500 deductible per person and $155/month. Pay for it through an HSA which saved me about $800 in taxes.
Are you waiting to take Social Security Kent?
Will you be able to have a side income if you do?
I suggested to a parent to wait till 65 and man that was a hard fight. Everyone wants it ASAP.
Nope. Living off my part time income. I will quit altogether next year when I can take my pension without penalty. Plan to take SS at 65 (or 67) depending on how things are rolling.
Nice!
By then the boat might have left,but u can stand on shore and wave
“My part-time income runs about $70k”
Since there’s been a bunch of comments about income inequality on this article, I’ll throw out this anecdote: I make about the same before taxes, but I work two jobs and 50+ hours a week to do so.
Wolf: any stats about the % of the working population working multiple jobs and/or >40 hours per week? How much of the extra income being discussed is a result of OT or a second job, vs a higher hourly?
MM,
I heard that lots of Twitter employees had two full-time jobs working at home, and some had three full-time jobs, and went skiing a lot. It was one hell of a gravy train, these multiple jobs and side gigs by people working from home. No wonder that there are so many multiple job holders.
But side gigs are good. People love to have them because two income streams are fabulous.
I work easily 80 hours a week (I don’t count), and love nearly every minute of it. I’m working right now, Saturday, replying to comments, LOL. I spent hours today working on an article that I will publish in a little while. Then I gotta do some clerical work around the shop…
Look, MM, I understand your situation, and I’m not making fun of it. But I am making fun of your manipulative leading question. That stuff belongs on ZH, not here.
I hadn’t considered the multiple WFH jobholders – that’s a good point, I was just thinking about in-person jobs. These people likely didn’t need that extra income, but did it because they could.
Work certainly spans all kinds of activities; that said one of my jobs involves being on my feet for 10-14 hours a day. Its not an easy life, but I understand n=1 and this is just my perspective.
I also used to be a two jobber when I was with the Fed Government. Took off every Friday and worked another job doing RE Appraisals. I was double dipping. I still had over a year’s worth of unused sick leave when I retired. My boss once got on my ass about not being there on Friday. He never figured out what the f.ck I was doing. One year before I retired, I even started playing golf every morning before going to work. Got up to the tee box at dawn, 6AM and played 9 holes before showing up at work at 8:30AM. I am proud of everything I did.
MM, perhaps you know statistics from your “n=1”. You should be able to find a cushier job.
I actually know a lot of advanced math, but sadly have nothing to show for it.
Long story; had to drop out junior year due to being severely injured in a car accident at school, hence n=1.
I dunno, when they pump boatloads of free money into a system thereby pumping up the stock and real estate markets and throw it on the public debt, how is this not “borrowed money”?
We’ll be paying for it via inflation for awhile, seems like.
Saving the best comment for last, Natron nails it.
Natron did nail it.
Easy Monetary Policy for the past 20 years is the culprit.
Huge deficits can never be paid back –
The US Government will just inflate their way out of debt.
Yes, some bond and debt holder will take a loss, along with the US Taxpayer.
Labor will demand pay raise to offset inflationary pressures.
High prices and lowered purchasing power will last a long time.
It could possibly be a change in economic strategy for the next 25 years we are seeing.
Bernanke’s policies looked fun and felt fun but then I am not sure they worked. If the Era of free money is any indication.
It’s just you have to retool the economic machine now. There is transition pain.
To anyone with a sliver of common sense, Bernanke’s policies didn’t look fun or feel fun. I can understand his reaction to the crisis, but his mistake is that he didn’t stop. He had no exit plan. His stimulus became a long-term alteration of the markets. That’s not stimulus anymore. It’s an addiction. And the system is still addicted. He did more damage to this country than anyone else in can think of, and I don’t think we have any idea yet how big the damage is.
Wolf, Thanks again for a good column with accompanying stats. You have made me rethink what type of “landing” th US economy will have over the next year. Would not argue with certainty that there will not be a recession.
Lot to think about here. Investment allocations change bigly if the likely worst outcome is a soft landing.
About those statistical polemics, I’m from Brazil but acording to the 2021 US Census, the MEDIAN net worth is 140.800. The interesting information is that it has a net worth excluding home equity (46.870).
Age of Householder Median NW Median NW ex. HE
<35: $22,000 $11,500
35 – 44 $97,740 $41,400
45 – 54: $166,600 $63,020
55 – 64: $230,900 $88,100
65 – 69: $285,100 $106,00
70 – 74: $326,700 $118,000
65+: $300,000 $94,050
75+: $292,800 $77,750
By quintiles, the median net worth is:
1st quintile – $6,770
2nd quintile – $55,780
3rd quintile – $113,000
4th quintile – $241,100
5th quintile – $676,200
Remembering that this is median net worth, it says nothing about the abilty of the average american to spend like a drunken sailor. One can live up to or even over his means for quite some time before his luck runs out, and net worth is affected by home and student loans that have relatively low interest.
It also has info about median assets and median income. The most striking thing I found was that the ratio of net worth/income of most americans is close to 1 until age 55+, when it takes of. The oldest americans have a ratio of 5+.
Sorry, missed info: the first table is by individual, the quintile information is by household.
There are 128 million households. According to your numbers:
64 million households have a wealth of over $140,800. 64 million households!!!!
51 million households have a wealth of over $241,000
26 million households have a wealth of over $676,000!
People need to understand this. This is not a few people. It’s a huge layer of Americans that make and have plenty of money, they’re the big spenders, they move the needle, and it has been that way forever.
The poor and the homeless people don’t move the US need on consumer spending, never have.
Wolf, I’m not disagreeing with you.
As I live in a country far unequal then US, I’m used to this perception bias: I’m among the top 3% in Brazil, but my coleagues all consider themselves struggling middle-class and blame all on “those rich fat cat bastards”.
And yet, even here the greatest part of the spending in my country is done by the middle 2-4 quintilles. People here tend to forget that even tough “the poor” earn far less then you, they are much, much more numerous. In terms of the economy, it has quite an impact.
Take out house equity and tell us the numbers.
Depth Charge, the last collum of the first table is exactly that, median net worth ex home equity…
“Depth Charge, the last collum of the first table is exactly that, median net worth ex home equity”
I’m responding to Wolf’s reply. He is including house equity.
I think the wealth held in the house’s value needs to be considered apart from purely liquid cash or near- cash equivalents. CDs etc.
Example: I have a relative with a very nice, paid for house, worth about eight hundred K, who just got his prop tax bill for 3000. This is about ten percent of his pension. You can borrow against yr house, but you can’t chip off part of it to spend, like you would take a coin out of a bag of coins.
In Vancouver where a decent, basic. detached house is worth about 2 -3 million, some folks wealthy on paper are not liquid and can be literally taxed out of their houses. Of course this does not make them poor, but the wealth in the house is of no use for living expenses.
You can get a HELOC… you absolutely can take a piece out of your house and live on it. With the rise in house prices many people have a significant chunk they can pull out, with interest of course.
Big assumption… what if they aren’t approved because credit has tighened? What if they can’t get a reasonable rate?
In some US states, the municipal gov’t can sieze your home and sell it out from under you over unpaid property taxes.
Taxing a home based on its “appreciated value” is the same as taxing unrealized gains on stock.
HELOCs, unless you take the funds out, can be canceled. I know of several high income / high net worth people that had their HELOC’s cut to whatever they had drawn off as of the review during the last downturn.
You can’t chip off a piece of your house. You can, however, put your shelter security at risk.
The other thing to consider is that HELOC’s and refi’s are often recourse loans. Original purchase loans are often not (depends on the state law). Go sour on a HELOC or refi and it can follow you to your grave.
My home is worth less than half that and my property tax bill is $6500/yr…
U in Nebraska
Around 20 yrs ago, my wife and I had a US visitor with a house very like ours. Our prop tax was about 2K, in Nanaimo, Van Isle, BC. Roads, services etc. good.
Hers were 10K in West Orange NJ, which shocked us.
In her opinion, the roads there were not great.
close to 50% the US received some form of Government entitlement and about 50% did not pay any federal income tax.
It is just the way it is. Wealth is being accumulated at the top and the government is trying to redistribute it.
The 1% have never been so wealthy but you need to make sure the rest of the people doing all the heavy lifting work are happy otherwise they will riot in the street
I am sick of this stupid meme. 25% received Social security, including SSI. There are no other significant entitlements. Pensions are all funded through current contributions plus investments. Food stamps are a joke, Section 8 housing has eternal waiting lists.
We need millions of subsidized senior barracks for the old poor. And yet these memes of welfare queens persist.
ru82,
Retirees (a ballooning number these days) with Social Security benefits are included in that “entitlement” figure. This includes the wealthy, who ironically get the biggest SS checks when they retire.
1) About 65% of household are homeowners. Price surged over the past ten years. Not all are mortgage free.
2) Home owners have a target on their back. They pay police detectives,
firemen, school teachers and bureaucrats pensions and salaries, adjusted to inflation. They pay their banks and the insurance co. As long as C/S was rising vertically homeowners didn’t care, but beyond peak they complain
about the toxic assessment that pays 90,000/y for a retired Chicago school teacher.
3) MCD hit an all time high. AAPL and MSFT almost reached the top, but the banking crisis isn’t over and XLY, the consumers discretionary ETF, is down.
Fred : home owners equity is 31T. Regulations allows banks to raid in with new mortgage assessment . If u don’t pay your bills the banks might sell your house.
4) Less money for crumbs spending, more for school teachers, police detectives, firemen and bankers.
I thought social security was funded via the trust fund in to the 2030.
Why would it be cut if current debt ceiling not extended . We already have the money tonn nn pay out.
Don’t we? Was t that we were told?
Some misconceptions here.
1. The Trust Fund is the accumulated surplus of more money paid in than benefits paid out over the decades. If in a year there is a deficit (more paid out than goes in), then only the deficit comes out of the Trust Fund, not the total payments.
2. No one is going to “cut” Social Security.” That implication is just nonsense.
3. Due to the debt ceiling, the government might not be able to make a batch of SS payments to retirees in June. If that is the case, the government will make those payments as soon as the debt ceiling is lifted.
I wonder what impact mortgage rates have on this?
Anybody planning on buying, forget it. They can’t afford the mortgage on the house they were aiming for any more, so that deposit they might have saved is now excessive and available to spend like their wounds. Similar story for anyone who was planning on upsizing, or simply moving elsewhere and had cash ready for transaction costs.
Also had to be at least some people who refinanced when rates were low or some other mechanism to cash in on their increased house price.
What we have now with mortgage rates are reasonably low standard mortgage rates of around 6.5%. Do you not realize that? Any lower rates just previously are what are (were) totally abnormal.
The Fed raided in other people money to DISTRIBUTE wealth to the poor and the middle class.
Restaurants owners got drunk on whisky and free PPP loans. Mamma got 10K cash and spent it on her boys that got in troubles with the law and the top 1% got millions of hollowed IOU divided by two after their ugly divorce. They still send their money to the gov for 5% dividends divided by twelve months.
No, the Federal Reserve has nothing whatsoever to do with out-of-control US government spending largely fund by massive additional debt issued as a result of selling US Treasuries.
Hussman on the O/N RRP: “This way, the Fed can keep holding the securities instead of investors and money market funds holding them. It’s as ridiculous and contorted as it sounds.”
It’s one of the big reasons why we can earn 5% interest on CDs and in money market funds. ON RRPs are one of the transmission channels. It forces banks to offer competitive interest rates or lose deposits to money market funds or Treasuries.
The whole is not the sum of its parts.
Another great article that challenges the headline thinking of much of the media.
It does square with my experience in the middle of nowhere Wyoming, where nobody seems to need money. Everything is booming. Partly due to influx of refugees, but it seems to go beyond that.
Lets keep the interest rate thing in perspective. It’s been 12 years earning <1% and 1 year earning 4%. It would be great if that 4-5% interest rate would continue, but how long will that be sustainable. I guess we just wait and see.
What is your take on the idea that bank credit creation is contracting. Is that an illusion also ?
So the thing to watch is employment and asset prices. No Job, no income. Asset price decline, reverses the wealth effect ?
I think reality is Fed has hurt real economy by facilitating high debt levels, asset price distortions, and boom – bust cycles. They have allowed government to fund wars that people would not fund with taxes. Burning up resources in wars kill a lot of empires.
Well if they didn’t burn up resources in ongoing forever warmongering to fatten the fat cat’s wallets, they’d have to burn up resources on the public good… Can’t have that now, can we?
I will stand by my theory again. This is asset driven inflation. Unless risk assets and housing drop by another 30% minimum, no landing.
I just had a thought and ran a calculation. If the US has 31 trillion in debt and it must pay 4% interest rate on that debt, what would the yearly interest payment be? 1.24 trillion
our economy is truly built on sand. there is very little real productive capacity and a whole lot of financial speculation going on in America. the clock is ticking for when it falls apart.
I believe Wolf has said that this isn’t (as much) of an issue due to the accompanying wage inflation and increased income tax receipts, which make up for the increased interest burden at least partly.
That said, higher interest rates on federal debt are an argument for why the Fed wants a ‘goldilocks’ level of inflation: enough to reduce the debt burden, but not enough to cause unrest among the population.
The government pays interest on treasuries by issuing more treasuries. And they have guaranteed sales through the primary dealers or, as a last resort, the Fed itself. This is infinitely sustainable as long as the government can keep the growth in deficits generally in line with the growth in the world’s productive capacity.
A view from Montevideo, Uruguay. Once investors start pouring funds into restoring the Palacio Salvo you know we’re at the end of the economic boom. Tick tock. Now that’s some predictive analytics for you.
I do not think that current yield levels of wow 5% do contribute to real personal income as inflation has been higher than 5% during the past 12 months…
If somebody holds treasuries as only asset and uses the interests for personal consumption. The real value of the treasuries goes down every year by the inflation rate.
In fact real values of both US stocks and US bonds went down considerably since January 1, 2022.
The US real estate market also looks fragile to me…
Real compensation is stagnating the best.
Conclusion: The question should be asked if the real personal income statistics are calculated wrongly as they do not take into account of the devaluation of assets by inflation.
Asset price are NOT included in income. Interest and dividends are included. Income from rentals are include also. But not the property price changes.
When there is inflation, EVERYTHING loses purchasing power. With Treasury bills at least you get 5.2% and no capital losses. With stocks you get capital losses and 1.6% dividend yield (S&P 500). Take your pick. Inflation is a bitch.
I think Chris’s point is that nominal interest at 0% real rates should not be counted as income.
I seem to remember that back in the high inflation 1970s there was talk of adopting “inflation accounting”, which would adjust for inflation, so (among other things) only real (inflation adjusted) interest received would count as income. Eventually inflation declined and the idea was dropped.
1. Then your salary increase should NOT be counted in income either?
2. EVERYTHING IN THIS ARTICLE IS ADJUSTED FOR INFLATION. Don’t people ever read anything?
Exactly Richard, that is my point. As long as there is no income from real interest rates it should not be included in personal income at all. That negative or zero real interest rates can be counted as income is an illusion. Inflation accounting is the correct method.
Second, both realized and unrealized capital gains, losses on assets eg real estate, equities bonds should be taken into account as they impact personal income significantly.
In my opinion the personal income statistics need some major adjustments before beeing used for personal consumption forecasts.
Wolf, with the handling of income from salaries and transfer payments I have no complaints. This is done correctly by the statistics.
If you’re earning 5% interest on savings, and inflation is 5%, then your real (inflation adjusted) interest rate is zero. If you are spending the nominal interest instead of reinvesting it, then you are drawing down your savings by 5% per annum in real terms.
I suspect that some of this drunken sailor spending is from people drawing down savings in real terms.
Keep in mind that inflation effects people differently. That 5% is never 5% across the board. It hits different products. Some are actually deflating. Rent is a huge driver of inflation. But homeowners don’t feel it because they have a fixed mortgage. Your favorite restaurant may increase their prices by 20%, so you go to a new place that’s far cheaper and find out they’re just as good. Now you might be actually spending less. This inflation is a tax on renters and people unwilling to try different brands.
EVERY single asset is the same way, not just savings: 5% inflation knocks down 5% of the purchasing power of stocks, RE, gold, bonds, and what not. There is no escape from inflation.
I would slightly disagree with this.
I think stocks handle inflation much better than almost all other asset classes. When I say stocks, I am talking about the underlying business behind the stocks.
This next statement is going to be a gross generalization, but over the LONG TERM, a profitable business doesn’t care about inflation.
The reason is that inflation hits both the inputs (wages and/or raw materials) and outputs (product or service sold). The business makes as profit the difference of sales minus the cost of the inputs (basically profit margin).
A business doesn’t really care if both the costs of inputs and the value sales go up 10% yearly over the long run due to inflation or if they both increase only 2% yearly over the long run due to inflation. The profit margin stays the same.
Like I said, this is a generalization over the long term. In the short term, inflation can affect the input costs and value of sales differently (I e. labor contracts are on a different time frame than sales contracts to customers or raw material prices spike), but over the long term, a business is going to pass along any inflation increases in its inputs to its customers.
You didn’t get the two principles here. Lots of people don’t get them. But that’s how it works:
1. Every asset loses purchasing power due to inflation. By definition. $100 in stocks is going to buy less a year from now than a $100 in stocks buys today. That’s the #1 principle here.
2. With stocks, you’re HOPING that market price gains will compensate you for inflation — and that’s #2 principle here, the HOPE that stocks will go up with inflation. But it’s not guaranteed, and it sure as hell hasn’t worked this time around as inflation ROSE and stocks FELL.
For example, the Nasdaq is down 20% from Nov 2021. On top of that, it lost 9% due to CPI-inflation. So you’re down close to 30% in purchasing power since Nov 2021.
I disagree with those principles.
#1. For a business, if in the long term the inputs rise in price by the rate of inflation and then sales increase by the rate of inflation and profit margins stay the same, the earnings will also rise in the long term also by the rate of inflation.
So held at a constant P/E, the stock price would also rise with the rate of inflation. Long term of course.
As for #2, I am not hoping on anything about the market price. I only care about the long term earnings. As long as those keep up with inflation than eventually the stock price will rise to keep up with earnings. Or if it doesn’t, smart owners will take it private, or the company will get bought out, or something. I don’t have to hope for anything because I know that in the long run, eventually a business is valued on the earnings it generates.
Please note that I don’t think anything that has happened in the stock market in the past few years is normal or reasonably sane in any sense of the word. Like most financial assets, the stock market (in total) has been generally in a valuation bubble for a very long time. Sometimes a very large valuation bubble. So doing any comparison between stock prices and inflation with starting or ending points in the past few years is silly because valuation bubble matters more than anything else.
I should also note that I think there is often a huge disconnect between the value of a business and the price of its stock. To me, market price is not equivalent to the value of the business. I also generally take a longer term view when buying stocks.
Actually I guess I could have made my point clearer and should differentiated between owning a business and owning stocks. I tend to think of them as being the same (I wouldn’t buy any publically traded stock that I wouldn’t consider owning the whole business). I sometimes forget that other people don’t think like that.
So my words were more geared towards a business as opposed to stock prices. Stock prices go up and down for lots of reasons. However the value of the underlying business is generally unaffected by inflation.
Let’s take a privately owned company (to avoid the noise of stock prices) that takes $9 million dollars worth of inputs (labor, raw materials, etc), uses the labor to somehow process the raw materials into products that it sells for $10 million dollars. It makes $1 million in earnings and has a 10% profit margin.
Over time inflation will affect the cost of the inputs but will also affect the cost of the outputed products sold. Businesses pass on the inflationary input cost increases.
In this regard businesses are generally like an inflation protected bond paying a fixed rate (the profit margin).
Now don’t get me wrong, there are an infinite number of other things that can affect the value of a business: supply/demand, innovation, changing customer preferences, government subsidized competitors, etc. Lots of things can affect the value of businesses, inflation isn’t generally one of them.
I have realized that I have strayed far into the wilderness in talking about market price versus actual intrinsic value and other such stuff on valuing businesses. That isn’t the purpose of this website.
I apologize for dragging it so far off topic. I have gotten a ton of value in reading many of the articles here and have learned a lot from not only the articles themselves but in reading some of the comments. I don’t want to ruin that by straying too far off topic
Is raising the debt ceiling equivalent to printing more money?
No, opposite. It will drain hundreds of billion of dollars in liquidity from the market as the Treasury will issue lots of securities to replenish its very much drawn-down checking account, the TGA.
Thank you Wolf! Are we going to see any relief from inflation due to this any time soon?
This relief would have to come from actual spending reductions by the government. This would help a lot in cooling inflation. But I’m not seeing that.
Looks like a pretty good economy in aggregate — so why all of the kvetching?
Aside from the fact that our individual lives don’t necessarily parallel the aggregates.
So far it looks to me like Mosler is right — higher interest rates result in fiscal stimulus.
If I am reading this article correctly, I would summarize it as showing consumers are spending at a higher inflation adjusted rate than they are making in inflation adjusted income (including interest), yet consumer debt isn’t increasing. This means consumers are tapping into their wealth (assets) to find the extra money to spend.
As someone who thinks that there has been a long term bubble in many asset prices, I think that this extra spending by way of tapping assets is a good thing. The reason I think this is good is because the primary*** way of turning assets into spendable cash is to sell those assets (or drain cash, or near cash accounts). This increases the selling pressure on those asset prices.
The first step in “normalizing” the market price of bubble assets is to see increased selling pressure on those assets.
*** Note: yes there are other ways of tapping into the value of some assets without selling them, one method is renting out the use of the asset but rental income was included in his income calculation so it the extra income used for spending isn’t from this.
1. Agreed. Spending some of the gains of your assets is an age-old practice that makes a lot of sense. If you had a good year in cryptos, why not buy a Lambo with some of those gains? If you had a good year in stocks, why not buy some living room furniture or a nice car? Lots of people do this. It’s called the WEALTH EFFECT: people with assets spending some of their gains from those assets to create demand in the economy. It was the official policy of the Fed during QE, and Bernanke explained all this to the astonished American public in a Washington Post editorial.
Sometimes, they don’t even sell assets. They increase their margin loans now backed by higher-priced assets. This is a risky strategy, but it works until the market tanks, and then it can lead to forced selling and total wipeouts of erstwhile millionaires.
Personally, I spent over three years traveling around the world (Oct 1995 – Feb 1999), paid for by stock market gains. Best thing I’ve ever done. Met my wife that way too.
2. The income figures I cite here are WITHOUT transfer payments, which are primarily Social Security payments for retirees, but also other transfer payments, such as welfare and unemployment insurance payments. I wanted to focus on the gains in wages, interest income, and rental income, compared to inflation.
I knew your income numbers were without transfer payments, but initially I didn’t think transfer payments mattered. Employment is historically low and there are no longer any special unemployment insurance payments (i.e. COVID) so I just assumed unemployment transfers were low enough that they were pretty much irrelevant when looking at economy wide spending. That is probably a true assumption.
My second assumption was probably wrong though. Social Security transfer payments generally do not vary that much. They have grown, but gradually and at a generally constant pace. So it is easy to ignore Social Security transfer payments when looking at economy wide spending as it was almost a constant (not quite, but close enough). However that has changed with boomers reaching retirement age en mass.
Without looking I am guessing SS transfer payments have grown much faster the past few years. I am also guessing that SS transfer payments are at a historical high. I was wrong to ignore SS as being a constant and therefore canceling itself out in any yearly comparison.
Now that I think about it, I think SS transfer payments are likely the source of much of the excess spending compared to the income classes you included.