New delinquencies way below the pre-pandemic lows. Bankruptcies at record lows. The OMG stuff in the media about household debt is funny.
By Wolf Richter for WOLF STREET.
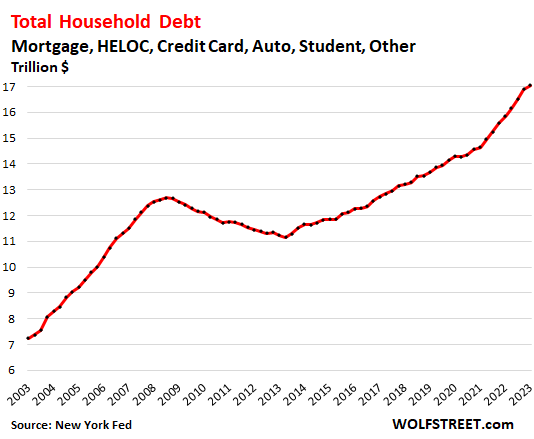
A big to-do is being made out of total household debt in the first quarter rising to a new record and exceeded $17 trillion for the first time, OMG. But the burden of debt matters in relation to income, and these are inflationary times, and there has been a lot of inflation, including wage inflation, and incomes went up, and disposable income (income from all sources minus taxes and social insurance payments) went up, and it went up proportionately faster than household debt.
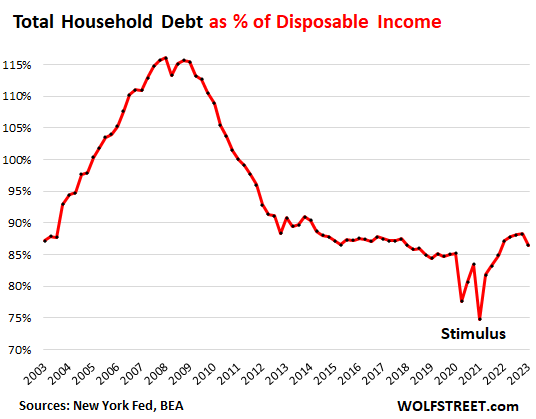
So hang on to your seat: Despite all the breathless OMG headlines about household debt, total household debt as percent of disposable income actually fell in Q1 to 86.5%, just a hair above the pre-pandemic lows of 85%.
This dip occurred because total household debt inched up 0.9% in Q1 from Q4, to $17.05 trillion, but disposable income jumped by 3.0%:
The household credit data is from the New York Fed. The disposable income data is from the Bureau of Economic Analysis.
Note the stimulus payments in 2020 and 2021 that for the quarters in which they occurred heavily inflated disposable income, and thereby pushed down household debt as percent of disposable income. This was the free-money era of the pandemic which caused delinquencies, foreclosures, and bankruptcies to plunge to record lows.
The record high burden of debt-to-disposable-income occurred in Q1 2008 at 116%, after a five-year-long steep run-up when consumers went binging on debt. The binge then came apart during the Great Recession and the debris got cleaned up during the years that followed. Recessions have that kind of cleansing function, where the mess from the excesses gets written off.
But this time around, consumers are relatively little indebt compared to their incomes.
We discussed this yesterday in detail with credit cards, with credit card debt burden having dramatically declined over the years, with delinquencies at around the Good Times lows before the Pandemic, and with third-party collections at record lows.
If we get carried away with these absolute numbers of debt levels in an inflationary world, we will be tempted to think that the consumer is “tapped out,” and we will be tempted to underestimate to what extent consumers are able to spend and help drive inflation forward.
Total household debt includes mortgages, HELOCs, credit card balances, other revolving balances, auto loans, and student loans. Here is the OMG chart:
You may have read in the headlines that households are getting “stressed” because their delinquency rates have ticked up. But wait a minute…
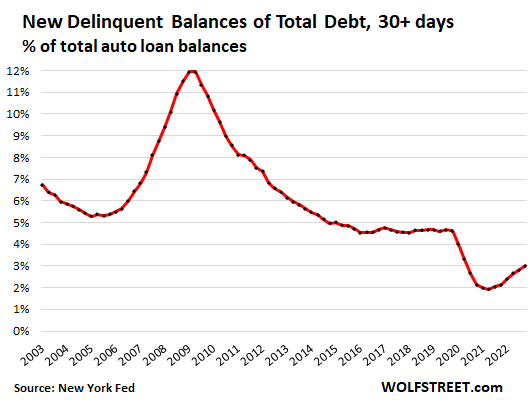
Newly delinquent balances of total household debt crept up to 3.0%, but that was an increase from the free-money historic lows during the pandemic. The delinquency rate of 3.0% is still far below the pre-pandemic lows of 4.5%. During the Great Recession, it topped out at 12%.
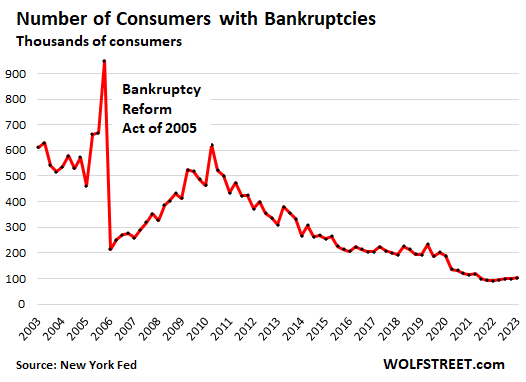
And consumer bankruptcies remain at historic lows. During the free-money era starting in 2020, the number of consumers with bankruptcy filings has fallen by half, from the Good Times level just before the pandemic of 200,000 to the current level of around 100,000:
It’s almost funny how the financial media constantly wants to show that households are in trouble, that they’re tapped out, that they’re wrecked by huge piles of debt that they cannot deal with, etc. etc., and that consumers cannot possibly go on and keep spending, and keep fueling this inflation, when in fact consumers are just fine, they’re loving the extra money they’re making, and they have largely stopped grumbling about the rising prices and have gotten used to them and they’re paying them.
Enjoy reading WOLF STREET and want to support it? You can donate. I appreciate it immensely. Click on the mug to find out how:

![]()
Fear porn about some fantasy imminent economic collapse is everywhere. Meanwhile, in the real world, inflation rages and the economy remains grotesquely overheated.
nice
Respectfully, I’ve argued this before, but I’ll do so again. I don’t think the economy is overheated. Or if it is, if <2% GDP growth is overheating, then wow. It's not economic growth that's smokin'…. it's inflation, which in this case isn't about the economy but rather the money supply, long-time suppressed rates, etc., used to (mostly unsuccessfully) goose the economy. But perhaps this is just semantics.
It isnt a fantasy. Home Depot just had the first quarter of year over year declines in consumer spending.
Wolf is correct, the average consumer is not overly stressed but all of these averages are thrown off by the upper middle and upper class, which have done great in this cycle. There are alot of consumers that are tapped out by inflation.
Broad-based wealth equates to a more robust economy.
I’m not saying we are at a critical stage now. But the economy is slowing and more companies will report weak revenue growth or negative growth.
HUGE GAINS in ecommerce sales in April, big gains elsewhere, despite PRICE DECLINES in many goods. If you extrapolate from one store to the rest of the economy, you end up with BS.
Wolf,
I agree that it’s a mistake to extrapolate from one event. There are leading and lagging indicators. What do you think is a leading indicator of a broad based slowdown?
Wolf, is the growth in % of Disposable median or average. Meaning, can the top 10-20%, who have a lot of disposable income be compensating for the bottom 80%? I know that inequality of income and assets is also at record levels.
elbowwilham,
It doesn’t matter for the overall economy who makes and spends the money, as long as it gets spent. This is not a social studies report.
Nunya,
“What do you think is a leading indicator of a broad based slowdown?”
I’m not economically savvy, but Steven van Metre i believe claims freight goods transported is one such leading indicator. I can’t vouch for his quality (or lack thereof) of predictions but he certainly is currently pessimistic as concerns our economy going forward. He references a lot of charts in his presentations but honestly I’m not that familiar with them and he proceeds a bit briskly so I can’t tell how many type one or type 2 errors he might in effect be committing (think false positives, false negatives medical tests).
There are probably a number of such indicators… again what is the rate of FPs (predict recession but one fails to materialize), FNs (fail to predict recession when one does occur) historically attributable to this factor ?
See test sensitivity, test specificity for more info.
Randy,
“Steven van Metre i believe claims freight goods transported is one such leading indicator.”
This is BS, if that’s what he actually says. Goods that are transported as freight are a small part of the US economy. Two-thirds of the US economy are services. Plus, there are big categories of goods that are mostly not transported domestically as “freight,” such as oil and gas, which are transported by pipelines.
There have been lots of declines in the freight industry — “freight recessions” — and I documented them here. They’re fairly frequent (every few years), but they have not led to an overall economic slowdown.
If you want to look for leading indicators, you need to look at metrics that are associated with services.
We know 100% for sure that there will be a recession eventually. So predicting a recession is a breeze. It will come eventually. But predicting WHEN the recession starts is just a game of luck.
…mebbe time to rethink the old (pre-‘social studies’?) saw: “…a recession is when your neighbor is out of work, a depression is when YOU’RE out of work…”?
may we all find a better day.
You conveniently left out the reality that credit card debt has declined in Q1 every year for 20 years as consumers pay down large balances from holiday spending.
Not this year. Credit card debt was flat in Q1.
Just turn on CNBC or read wolf street. Both will never mention a problem with the fake narrative we were handed on 911 and both will cheerlead the economy is perfectly fine.
LOL. Just because you didn’t read it doesn’t mean I didn’t feature it massively in my huge article on credit cards.
RTGDFA:
https://wolfstreet.com/2023/05/15/households-far-from-tapped-out-credit-card-balances-burden-credit-limits-available-credit-delinquencies-collections/
Credit card balances went higher on a HUGE boom in spending on travels. Nearly all travel expenses are paid by credit card. And travel is booming, and this spring more than ever. That’s why the balances went up. Nearly all of it will be paid off when due, as it always happens.
People who confuse credit card balances with interest bearing debt don’t know what they’re talking about. $5 trillion in spending is run through credit cards a year, and nearly all of it gets paid off in full every month. People need to understand that credit cards are PRIMARILY a payments device, and they’re used to a much smaller extent as a borrowing device.
So I repeat, RTGDFA:
https://wolfstreet.com/2023/05/15/households-far-from-tapped-out-credit-card-balances-burden-credit-limits-available-credit-delinquencies-collections/
It could be that many shoppers are just not shopping at Home Depot due to prices. Many shop around and other box stores, and even some small shops, are beating Home Depot prices.
Ace hardware is toast ,they can’t conpete
We’ll see.
My annual auto insurance just increased over 30% – holy smokes. No tickets for many years. Retired – limited driving. Two autos – 2008/2009 vintage.
Home insurance rates are expected to increase soon.
Daughter who recently graduated is experiencing the same. Who picks up the delta when her wages don’t increase proportionally to inflation? Yup!
I’ve done the math now that I’m retired. There’s enough disposable income for the next few years if inflation persists. Have adjusted to reduced consumption funded by debt unless absolutely unavoidable. Eventually the options become a mix of cutbacks in consumption (i.e., reduction in standard of living), more aggressive investment mix (i.e., greater risk), withdrawals in savings, return to work…..actualized anger.
Were one to take a gander at business cycle models, say on Wikipedia, one will discover there are multiple schools of thought; one will discover there are few golden rules (for example, for recessions in the last 60 years, time between yield curve inversion and declared recession has varied anywhere from one month to 18 months); one will understand that outcomes are not linear; one will discover extreme complexity.
From where I sit (and many in my social groups align), the idiot class has its hands on the economic tiller. The indices favor the idea that only the wealthiest are benefitting. Technology operates on its own time cycles (most especially innovation) and does not appear at this time to be the white horse many believe it will be.
As Batra Ravi explains: “What matters is the size of the wage-gap”.
Batra, pg. 142, “Greenspan’s Fraud”:
“If demand and supply are to be balanced over time, then either wages rise in sync with productivity, or productivity growth must be matched by the growth of wages plus debt.”
Yes, apparently inflation is here to stay for a long time
Inflation has always been here. Your just now noticing.
I’m talking about runaway inflation that hurts the economy
Inflation always hurts the economy. You just don’t notice. Like the proverbial frog in the pot of slowly boiling water.
The inflation that the free money of the covid era caused has not been seen in 40 years. I’m talking about her
“This dip occurred because total household debt inched up 0.9% in Q1 from Q4, to $17.05 trillion, but disposable income jumped by 3.0%”
If my math is right…1.03^4 =12.5%+ Y/Y run rate for disposable income?!
Have fun getting back to the inflation target of 2% when disposable income is rising at 6x that.
The main stream media is crying for FED pivot and they are peddling inflation going down …
The FED is fully buying this story else they’d have raised rates by 50bps and not hiked.
I also don’t believe the lag effect of hikes. The rate hikes are transmitted immediately tot he economy in may ways.
The FED is a bunch of PhD’s who analyze tons of data, and form their opinions from that,
pass it up to the FOMC, and Board of Governors for action. I believe many of them barely even follow MSM, never mind “buying” the MSM story. It is the other way around, MSM is buying the story presented by the FED. It would probably be better if the FED members paid more attention to main street and wall street than some of their own papers, which are often based on massively complicated formulas and theories, rather than evidence in front of our eyes (see GFC, fall 2008).
” It would probably be better if the FED members paid more attention to main street and wall street than some of their own papers, which are often based on massively complicated formulas and theories, rather than evidence in front of our eyes (see GFC, fall 2008).”
You are assuming the FED works for the general populace. I dont think FED works for common Joe. You don’t need to take my words on this, just look at FED actions for last few decades. Then look which class these policies has benefitted the most.
Just look at the widening wealth gap in last few decades or so which are facts, not opinions and everything would be clear to all of us.
The middle class keeps shrinking; now only 50% of the population. If you’re part of the underclass; it doesn’t really matter what disposable income you have, you’ll spent it all on shelter and food.
That’s not true, josap told us so.
Do they count student loans in the debt service as a % of income? When they restart student loan payments, if they ever do, would that cause a sudden spike?
Student loans are included. From the article: “Total household debt includes mortgages, HELOCs, credit card balances, other revolving balances, auto loans, and student loans.”
I think the flaw in your argument that Americans aren’t struggling with debt or delinquency is simply because it’s much harder to get debt in the first place. Lending guidelines for everything except student loans is much more strict than in the past which prevents many from over borrowing or going delinquent, at least until unemployment goes back up. However I would argue Americans are dealing with poverty that doesn’t show up in debt or delinquency.
Good article.
Also, I have seen the “The living Paycheck to Paycheck” articles recycled by the media every year for the past 20 years. LOL
If you adjust the Total debt for inflation, in 2023 dollars, the total debt in HB1 (2008) would be 18 trillion. We also have about 30 more million people in the U.S. So one has to wonder what per capita inflation adjusted total debt would be? But the chart of disposal income as a % of total debt probably sums up all the above.
You’re not taking into account how many people don’t have debt simply because they don’t qualify for debt. Debt levels are low because its much harder to qualify then in the past.
The dollar amount of debt is important, but also important is the higher interest rates being charged/paid on the debt.
1. Most mortgages are locked in at the rates when they were taken out. Only the small number of people who purchased a home over the past year have higher rates. Mortgages are by far the biggest portion of the debt.
2. Credit card rates are always huge, and the rate increases didn’t make a huge difference. Lots of people had 30% APR before the rate hikes. But not that many people use their credit card to borrow. Here is more:
https://wolfstreet.com/2023/05/15/households-far-from-tapped-out-credit-card-balances-burden-credit-limits-available-credit-delinquencies-collections/
3. The $1.3 trillion in federal student loans are in forever-forbearance, stopped accruing interest, and borrowers haven’t made any payments since early 2020. I’m still waiting for them to start making payments. Waiting for Godot.
4. Auto loans are more expensive and cars are more expensive, for people who bought recently.
5. We don’t have the Q1 data on household debt service payments (interest and principal) as a percent of disposable income, but in Q4, it was 9.7%, the lowest in history except for the free-money pandemic years.
I thought the forbearance ended and first payments are due
September 1 ?
It varies. My wife’s servicer is extending the payment pause for a year (but not the interest freeze), my servicer is not.
How many hours or how many jobs must people have to pay off debts and expenses?
Carlos, you’re in Argentina with 100% inflation right now. So if you owe money in pesos, you just wait till it goes away. If you owe money in dollars, you’re screwed.
In terms of the US, you can do your own math. Here are some numbers:
Median household income in 2022, per year (Census Bureau):
San Francisco: $126,187
California: $84,097
Miami: $47,860
Florida: $61,777
Houston: $56,019
Texas: $67,321
New York City: $70,663
New York state: $75,157
Everyone is a millionaire now, haven’t you heard?
Yes, but credit millionaires or those on paper
It’s true. I don’t know anyone who’s broke/poor/scraping by anymore. They’ve all woken up on the right side of the decimal. Everyone’s gone from sneaking by on the skins of their teeth to wallowing around the deep end of fat-n-happy town. It’s kind of a drag, too — since people tend to be a lot more likable when they’re a little hungry. Comfort is the enemy of character and imagination.
bul – well-said. (…a culture’s true memories of how it got to the dance often seem to be the most ephemeral…).
may we all find a better day.
Someone on here submitted an epigram — maybe you? — that went along the lines of ‘the smart ones are smelling the coffee while the no-knowthings are still lining up for the punch bowl.’
bul – a good one, but can’t take the credit. Best.
may we all find a better day.
Consumers’ debt-to-income may be falling, but government’s debt-to-GDP is rising fast. If you combine them, I think debt-to-income ratio might be rising as a whole.
The clear strategy was to transfer debts to the government’s balance sheet, where it can be serviced via money printing and inflation.
This is no way to run a society.
Yes, that is why their will be a recession, and there are rougher roads ahead. The gloom and doom is not transistory, just like the inflation hasn’t been transistory.
…the revolution will not be transistorized…
may we all find a better day.
Yep. Government debt to GDP close to all time high and corporate debt to EBIT close to all time high.
Last I heard total debt to GDP was 3.67.
Bobber you have hit the nail on the head. This is what is happening and it is not sustainable.
Love the unbiased, thoughtful, rational analysis of data here on your blog.
‘Love the unbiased, thoughtful, rational analysis of data…’
Yes, that’s what makes Wolf’s articles point on! But, I’ll admit, being an optimist or pessimist can sometimes be rough going on this site.
DEL – ah, the eternal struggle (and to reprise an old joke):
“…the pessimist sees the glass as half-empty; the optimist, half-full. A good engineer wonders why it’s the wrong size…”.
may we all find a better day.
Agree. Thanks Wolf for reporting the facts without the usual hyperbole. I’m really sick of the constant scream fest we see on *news* entertainment sites.
My favorite junk story, constantly recycled is some huge percent of consumers don’t have a small amount of savings for an emergency. Hellll lowww — everybody has a credit card or 4. They’re all fixing their cars or buying that winter coat without too much trouble. They’ll pay for it as long as they have a job.
Nothing a few more interest rate increases cant fix … maybe by 2024.
Household debt is the mortgage amount, not the amount that will be repaid.
That amount just went up significantly for those on variable rates because of mortgage interest rate rises.
And my understanding is that disposable income does not take mortgage payments into account, it’s just gross income minus taxes.
The actual amount people have to spend each month on goods and services other than their mortgage (for those on variable rate or new mortgages) has gone down, because their wages are not rising as fast as their mortgage payments have in dollar terms.
1. To supplement or correct your understanding: Disposable income = the income you have left over after taxes to pay for stuff, such as food, mortgage payments etc. So the ratio relates the size of the debt to your after-tax income level.
2. The article was about the household debt and the stupid headlines about it.
3. In terms of debt service payments (interest and principal) — the actual amount people pay every month for their mortgage, auto loans, etc. — that’s a different data set, and Q1 hasn’t been released yet, but in Q4, total household debt service payments (interest and principal) as a percent of disposable income was 9.7%, the lowest in history except for the free-money pandemic years.
4. Since Q4, mortgage rates have remained roughly the same (6.5%), and other loans have not significantly gone up, if at all.
The problem with the headlines and such is that they never put the numbers in perspective (except for Wolf). We are a large wealthy country. Evey statistic appears large because we compare to our humble own household experience. CC debt is xxx million, well, anything in the millions seems large to the individual. But is it really large compared to our economy???
No context…..
The US is the MOST INSOLVENT country in the world and is drowning in excessive debt across all sectors of the economy including 1) private, 2) corporate and business, and 3) government.
A government that controls its own currency and borrows in its own currency can never be “insolvent,” by definition.
All it can do is create raging inflation, LOL.
Now that’s a great point.
Exactly! Which is why this debt ceiling “crisis” is nonsense.
LOL, Frank mentions “no context” and you provide “no context.” How do you define insolvent? Generally, I understand it as a ratio between debts and assets. Saying the US is “drowning in excessive debts across all sectors of the economy” tells me nothing about insolvency. Nice soundbite, but it’s nothing more than a platitude.
According to NPR which cited Kansas City Fed…
60% of inflation was caused by corporate profit increases.
I dug up the Fed Study:
https://www.kansascityfed.org/research/economic-review/how-much-have-record-corporate-profits-contributed-to-recent-inflation/
(I think Wolf allows Fed links)
“Greedflation” or “Price Price Spirals.”
Keep on buying people. Get those debt levels back up!!!
Spend till you go broke for the corporate overlords. It’s the American way!!!
Consumer price inflation = rising prices. Prices rise because companies jack them up and get away with it because consumers pay whatever. There is NO inflation without rising prices. Rising prices are the core of inflation. Companies jacking up prices is how inflation works. I have no idea why this is suddenly is news.
Because they typically blame Wages!
P.s. – it’s 50%+. Either NPR got it wrong or I misremembered.
Companies raising prices = 100% of consumer price inflation, not 50% and not 60%. People need to understand this. It’s how consumer price inflation happens.
Peter Schiff said that wages are prices too. It’s the cost of labor! Guess what, just like any other prices, inflation affects them too!!!
Around 100% of all so-called ‘inflation’ is being caused by reckless and greedy price gouging, and nothing else.
Go back a month. Go back 2 months.
Seems to me everyone (but me) at THIS website wanted to blame inflation on Powell and to a lesser extent the Biden Administration pandemic spending. On them EXCLUSIVELY.
I wrote… what about business leaders raising prices ? I mean how could the obvious be overlooked.
Nobody disagreed. Nor agreed.
But now I am reading here how inflation is caused by folks raising prices. Wow what an amazing insight.
In reality it’s not just the business leaders raising prices… the extra $ created demand that allows the business folks to increase prices.
Business leaders, pandemic stimulus, low interest rates, maybe a few other minor items… all have contributed to greater inflation.
So no its not really 100% companies raising prices; only yes if viewed in a narrow technical sense. You can’t raise prices if the demand isn’t there to support it.
Randy,
OK, let me try again, maybe this time you get it. Businesses ALWAYS want to raise prices. But their customers will not let them in normal times; they’ll buy somewhere else (competition) or refuse to buy at all (buyers strike). And so a business that raises its prices might lose a lot of sales, which keeps businesses from raising their prices in normal times. So businesses very carefully weigh their pricing strategy against their sales goals.
What happened under the doctrine of free money is that these customers suddenly just started paying whatever, and the resistance to price increases fell off, and businesses got away with price increases, and then they jacked them up, from auto dealers to insurance companies. That’s where consumer price inflation came from.
I started screaming about it in early 2021, when consumers started paying whatever for new and used cars. That was a clear sign that the “inflationary mindset” had set in. Consumer price inflation = price increases, always. And inflation takes off when businesses get away with price increases because the inflationary mindset changed.
The questions you need to ask:
1. What changed the inflationary mindset? The answer: Free money (from the Fed and government)
2. What will change the inflationary mindset back to where it was? The answer: Costly money – Fed tightening and government restraint.
It’s not that simple. They cannot just jack up prices if there is competition that will undercut them. We are seeing this inflation, rather suddenly, because of the pandemic and gov’ts reaction to it. There are still worker shortages and chip shortages. Supply is restricted, so you get greed from those who have the supply.
But, of course, NPR wants to make this about evil corporations. Instead of painting an honest picture the way Wolf does.
Bingo. In my city, if I want a car battery, I can choose between 3 stores. Autozone, AAP, and o Reily. For some reason, the battery prices are the same. They do not seem to want to undercut each other. Same with hardware stores. Home Depot and Lowes. It goes on and on.
A town I moved from several years ago had 3 mom and pop grocery stores. Now the only grocery store is a Walmart.
Most industries have have monopolistic control or oligopoly, (two or more companies control the market, none of which can keep the others from having significant influence)
You don’t have a Wally*mart? They’re cheaper than any of those and there aren’t that many battery manufacturers in the country, so the difference in the “brand” label is relatively immaterial. Often you can peel off the brand sticker and find out who really made the battery.
I went through the battery boogie last fall. Ended up at Costco with a more robust battery than the other outlets and about $60 cheaper.
Those auto parts stores are definitely price fixing. They all wanted $70-90 for a fuel pump relay I needed. I found the exact same item online for $15. You know that online seller made a healthy margin.
Harold,
You’re totally wrong.
These are “feel facts.”
The professor literally focuses on supply chain disruptions and said the same thing happened after WWII.
Even the Fed economist admitted that prices spiraled based on companies projections for inflation and not real supply chain disruptions or input costs. I linked his paper above.
They address it as consumers know that there are supply chain disruptions and are more accepting of price increases. Even when there are in fact no supply chain disruptions.
TLDR: Consumers expect price increases and so don’t question them. Even when they are, in fact, not warranted.
“Greedy corporations” didn’t shower the population with $timulu$ – Uncle Sam did that. People then went on a spending spree, and companies raised their prices as a result of increased demand.
Don’t hate the player, hate the game.
It’s all of the below:
1) The FED and .gov dropped a zephyr of free money
2) People took said money and started spending like drunken sailors
3) Greedy corporations jacked prices into the stratosphere to soak up said money
Except without number 1, numbers 2 and 3 don’t ever happen.
One reason I posted the deleted link was to alert interested minds to what happened to savings during and after Covid.
For similarly minded folks, business maximization strategies in the context of monopolies and oligopolies can be more complex than raise prices with impunity cuz we’re greedy bastages.
Anyone who has ever been involved in gov’t contracting understands how outcomes can be driven by (often unnecessary) regulations and ancillary objectives = higher prices (the flip side of higher costs).
Yes, bloated gov’t spending; ridiculous QE predicated on dubious MMT. Wars, gov’t delays in approval/certification, ESG, gov’t energy policies, fraud (none of that wrt pandemic payouts), etc., etc.
The notion that markets these days are competitive and that mechanisms exist for true price discovery is ludicrous.
The US with it’s fixed rates are probably behind the curve, but if not already then soon enough;
Will not the cost of servicing that debt be the highest ever, even adjusted for income?
In countries with largely floating house mortgages, like here in Norway, it’s harder times for consumers – and they’re cutting back on spending.
“Will not the cost of servicing that debt be the highest ever, even adjusted for income?”
You mean “lowest ever?”
In terms of debt service payments (interest and principal) — the actual amount people pay every month for their mortgage, auto loans, etc. — that’s a different data set, and Q1 hasn’t been released yet, but in Q4, total household debt service payments (interest and principal) as a percent of disposable income was 9.7%, the lowest in history except for the free-money pandemic years.
“Household Debt as % of Disposable Income Fell to Good-Times Lows”, only because this consumer debt was heavily subsidized (paid for) by the huge increase in U.S. government debt!
This is why we’ve got the big ongoing controversy about extending the government debt limit! The government has basically absorbed what would have been a big increase in consumer debt, by increasing its own debt.
In countries with largely floating house mortgages, like here in Norway, it’s harder times for consumers – and they’re cutting back on spending.
A few concerns:
1. The last 2 years of both the Debt-to-Income chart and the New Delinquent Balances chart most resemble 2006-2008 (yes, at a much lower level but the pattern is unmistakable).
2. This data appears to be total national amounts, including booming profits from large corporations, rather than median or individual instances.
3. The end of student loan forbearance is going to make a much bigger impact than what is continually glossed over here.
4. While at a low rate, bankruptcies have been steadily rising for over a year
5. Personal credit card debt has been steadily growing at a historical brisk pace for the last 2 years. Even with wage increases this is unsustainable.
“This data appears to be total national amounts, including booming profits from large corporations, rather than median or individual instances.”
BS. It’s all household data. READ THE ARTICLE. Nothing to do with corporations, large or small.
“While at a low rate, bankruptcies have been steadily rising for over a year”
This is precisely the kind of relentless bullshit that inspired me to write the article. When something is at record lows, and has plunged by 50% from the prior record lows, and then it ticks up by an imperceptible hair, suddenly it’s alarming? Bankruptcy filings will have to DOUBLE to get back to the Good Times LOW!
So I’ll just repost the bankruptcy chart from the article above so you can contemplate the meaning of your words and my words:
Too much doom/gloom. It’s happy hour in Babylon again — just accept it.
Is there anyway to drill down on this data and analyze it by economic class? That is, poor, lower middle class, middle class, upper middle class, and wealthy (or what ever terms they use these days to divide the US population by economic means/wealth).
I would assume that the ratios for the bottom half of the country are significantly different than the next 40% and then the top 10%. What I’m worried about is skewing of the data and ratios as a result of the high income earners and the wealthy. Stripping out these parties may provide a bit more insight on the relative strength of 90%+ of the US population.
Also, it does not appear rent obligations are considered in this analysis. I understand that lease/rental agreements are not considered formal debt (per the analysis completed) but if you evaluate rent from an “implied debt” perspective, it could provide further insight on just how much debt and equivalent obligations are outstanding (and change the results).
BTW and years ago I mentioned to a business associate that basically the Fed and Government has one of two ways out of their debt mess. They can attempt to inflate it away (which we’re seeing now) or deflate and default it away. If you inflate it away, the powers that be will probably just lose their jobs (and become wealthier along the way, at least on paper). If you deflate and default it away, they will not only lose their jobs but also their lives. Fairly easy choice for our so called leaders on Wall Street and in Washington.
Is total household debt as a percentage of disposable income figured on a year’s disposable income, as in if a person or family’s disposable income was 100K a year, their total debt would be 86.5K? And what percentage of this total debt is their mortgage? If the debt service payments were 9.7% of disposable income, that person or family with a disposable income of 100K would have $8,333.33 of disposable income each month and a service debt payment of $808.33 a month. This seems very reasonable.
The other way around. A debt service ratio of 9.7% means that 9.7% of the $100k income would be for debt service, so $9,700 a year in interest and principal payments.
These are average figures. But:
– About 33% of homeowners own their home free and clear and have no mortgage debt.
– About 35% of all households are renters and have zero mortgage debt.
– About 54% of all households have no credit card debt.
– Lots of households have no debt of any kind.
But then there are some households with lots of debt and very high debt service ratios.
If the democrats refuse to make any concessions and Republicans hold their ground we will default, moving the blame to the Republicans for a major market event. Otherwise it will be on biden’s watch.
Will we actually default or will there just be forced spending cuts? I’ve heard conflicting views on this.
Oh goodness, the mere thought of Democrats holding their ground made me laugh.
I can’t think of one instance in the past 30 years where the Democrats didn’t cave.
Aggregate data doesn’t paint an accurate picture. Income differential as increased, and those with the lowest income have disproportionate amount of the non-mortgage debt. When they need to start repaying their student loans (~160B annually, 43M people with an average of $400 per month payments, which is about 10% of the savings rate) they will have to stop all of their consumption and probably start defaulting at a much quicker rate. Once letters are sent stating repayment must start (June or July), then we will really know how strong strong the economy is. I expect fed rate cuts shortly after.
Wolf, is looking at debt to saving rate a better metric, since disposble income is getting offset by inflation? People generally eat and pay rent before paying their debts.
Aggregate stats can still mask underlying weakness if for example a lot of the income growth is in upper percentiles while debt/income may be higher for a majority of the rest. I don’t think it’s available, but would be nice to see the ratios broken out by income quintiles …
Debt service doesn’t include tax increases or insurance premiums
does it ? I just got hammered on both auto and homeowners despite
shopping the rates and recently had a nice sized property tax increase.
Disposable income hah!
You need an income before any of it can become disposable.
Bozo, knows what is coming as he has seen it all before as I did during the .dotcom bubble.
The Fed is spent…. This time around there will be no Greenspan rate reductions nor any helicopter ben money flying around to save the housing/banking market.
Today’s debt ceiling discussion are being reported as cordial. That joke will prove to be just as ridiculous as the numbers the govt. is currently providing.
Along Arnold’s lines…who isn’t to say that the Fed’s promotion of allegedly “good” 2% inflation wasn’t actually 12% inflation stacked on top of what otherwise would have been a 10% *deflation* (read savings) gifted to the US by the historically unprecedented entry of Chinese supply into world markets 2002-2020?
DC/Fed has been diddling the US economy (and savers) for a long, long time…they know how to act in the shadows when it suits their purposes.
Good to know. What made me think that many are struggling is the person who cut my hair kept talking about how broke she is and a family member unable to pay her car.
If this is the state, then I hope the Fed will push rates up.
Looks to me like incontrovertible proof that consumers remain, on average, very healthy. Delinquencies and bankruptcies near all time lows with household debt remaining at historically low levels as well. Not sure this looks like the kind of economy that is nose-diving into a recession.
68% of households without any mortgage debt with many homeowners sitting on a giant pile of equity from years of household appreciation. This all points to inflation remaining sticky with many consumers in a strong enough position to handle some economic volatility. Very disappointing news for those hoping for an economic calamity.
I am calling Bullshitt…..income for high earners exploded. They are highly leveraged into “assets”. Stocks, Homes, Crypto….
It’s coming down
During the Dotcom bust, the Nasdaq composite plunged 78% over a span of 2.5 years, and the S&P 500 by over 50%, and it eventually triggered a mild brief recession. We’re maybe only 1/3 of the way there. You gotta be patient. It takes a very long time and a big decline before falling asset prices hit consumer spending – and even then, they don’t have a big impact on spending.
Yahoo got me with that chart, credit debt remains at all time high. They forgot to mention the debt is not interest bearing. Lol
Where are these higher incomes exactly? Professionals? Upper management? Workers for whom $15/hr is a raise?
And how is debt being paid down or avoided? Raises? Living wages? Payday loans?
Without a breakdown, this post is deceptive and dishonest.
Do you think everyone in America lives in a cardboard box? Americans spend about $17.5 trillion a year. You need to get a refresher on the US economy.
This post was about the overall consumer credit and the overall consumer incomes, and not about some dude who got in trouble because he borrowed too much. That always happens, in any economy.