Inflation Whac A Mole. Housing Inflation may be peaking at 8%+, but rents re-accelerated.
By Wolf Richter for WOLF STREET.
The Consumer Price Index (CPI) for April, released today by the Bureau of Labor Statistics, was marked by a very unwelcome reversal in durable goods prices which suddenly jumped again month-to-month. This was driven by a spike in used vehicle prices. A month ago, we explained why this spike would happen, based on underlying dynamics in prior months and called it a “turning point” in used vehicle prices. Today, it looks like a U-turn.
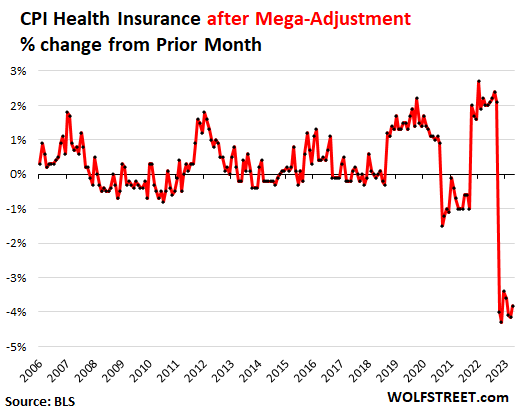
Services inflation remains red hot, but was somewhat moderated by a sharp drop in airline fares, rental cars, and by the infamous and huge adjustment of the health insurance CPI that started in September 2022 and will continue to wreak havoc with services CPI through September 2023.
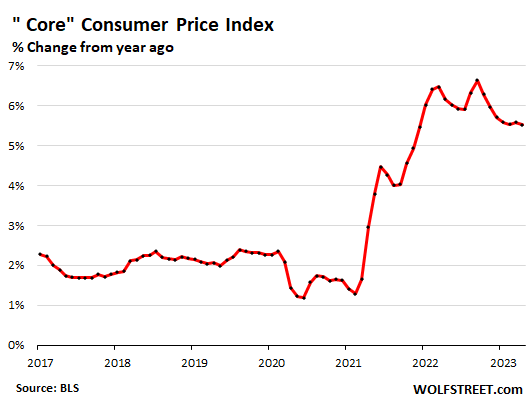
This combination of the month-to-month jump in durable goods and the slight moderation in month-to-month services caused the “core” CPI (overall CPI minus food and energy) to remain stuck for the fifth month in a row at around 5.5% — it’s now higher than overall CPI.
Inflation, once it reaches this level, is a game of Whac A Mole. As you hammer one category down, another one re-pops up.
The huge “base effect” is something we’re going to be talking about here a lot over the next few months because it is now pushing down year-over-year CPI readings through June, but will reverse in July and push them up in July and in the entire second half.
This “base effect” is the result of the surge of CPI last year through June, which forms the base for the year-over-year comparisons now. But last July, the index kinked with a month-to-month negative reading (on a plunge in energy prices and dropping durable goods), and the overall CPI curve then flattened out for the rest of the year. This flatter curve will be the base for the year-over-year readings in the second half, and the reversing “base effect” will push up year-over-year readings. This is already baked in. Something to look forward to.
Inflation at a glance by major category:
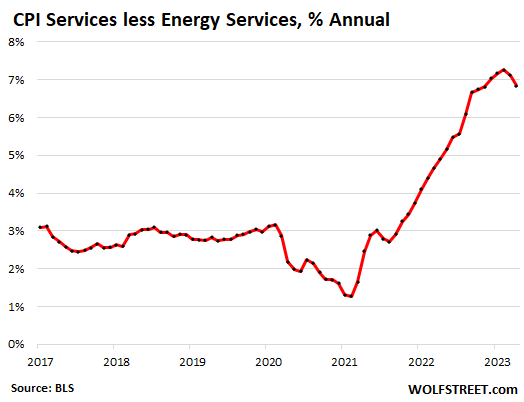
- Services without energy services jumped by +6.8% from a year ago – after +7.1% in March and the four-decade high of +7.3% in February – fueled by housing, food services, auto insurance, auto repair, pet services. But declines in airline fares and rental cars pulled the other way. The infamous and huge health insurance adjustment also pulled the other way and will continue to do so through September.
- Food at home: inflation dipped in April from March, the second monthly decline in a row (-0.2%). Year-over-year, prices increased (+7.1%) at the slowest rate since January 2022.
- Energy inflation month to month rose (+0.6%) which slowed the year-over-year decline (-5.1%). Prices of gasoline rose for the month, but were still down (-12.2%) from a year ago.
- Durable goods CPI jumped month-to-month (+0.8%), the second month in a row of increases, after six months of declines, driven by a huge spike in used vehicle prices. This whittled down the year-over-year decline toward the flat line (-0.2%).
- Core CPI, on a month-to-month basis (+0.4%) has been in the same range for the fifth month in a row. On an unrounded basis, April was a little hotter than in March. Year-over-year, core CPI (+5.5%) has been stuck in the same range for the fourth month in a row.
- Overall CPI (CPI-U) accelerated month to month (+0.4%), but year over year moderated to +4.9%.
- Core CPI higher than overall CPI for the second month in a row. After the plunge in energy prices and the softening food prices, overall CPI has come down a lot, to +4.9% in April, while core CPI has gotten stuck at 5.5%.
“Core” CPI – which excludes the volatile food and energy products that consumer buy – jumped by 5.5% year-over-year in April, compared to 5.6% in March and 5.5% in February. Unrounded the difference was even smaller: 5.52% April versus 5.59% in March. Core CPI has been stuck in this very narrow range of 5.5% to 5.7% for the past five months without any meaningful improvement. This is what’s called “sticky inflation”:
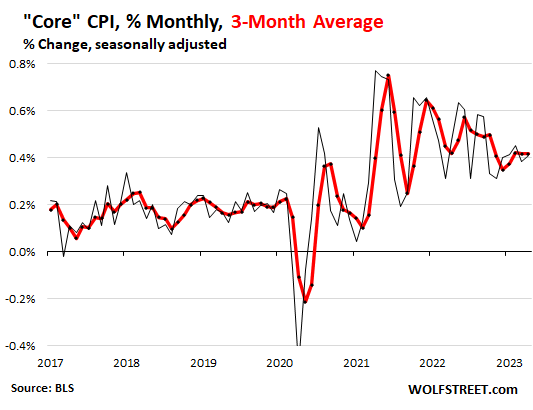
Month-over-month, core CPI jumped by 0.4%, same as in March. Unrounded, April (+0.41%) was a little hotter than March (+0.38%), shown by the black line in the chart below.
The three-month moving average of core CPI smoothens out the big monthly ups and downs and shows the trend a little more clearly (red line):
Core Services inflation (without energy services) jumped by 6.8% year-over-year in April, compared to 7.1% in March and the 40-year record of 7.3% in February. Nearly two-thirds of consumer spending goes into services.
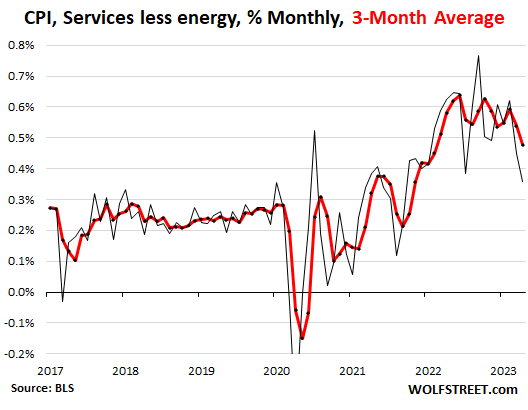
Month-to-month, services inflation without energy services jumped by 0.4% in March (0.36% unrounded), down from the 0.45% jump in March and 0.62% jump in February (black line). The three-month moving average is the red line.
The infamous adjustment to health insurance is included in medical care services, and pushed the otherwise surging medical care services index into the negative for the month, and toward the flatline year-over-year. This adjustment ends in September:
| Major Services without Energy | Weight in CPI | MoM | YoY |
| Services without Energy | 62.1% | 0.4% | 6.8% |
| Airline fares | 0.6% | -2.6% | -0.9% |
| Motor vehicle insurance | 2.6% | 1.4% | 15.5% |
| Motor vehicle maintenance & repair | 1.1% | 0.5% | 13.3% |
| Pet services, including veterinary | 0.5% | 2.7% | 10.4% |
| Food away from home (food services) | 4.8% | 0.4% | 8.6% |
| Rent of primary residence | 7.5% | 0.6% | 8.8% |
| Owner’s equivalent of rent | 25.4% | 0.5% | 8.1% |
| Postage & delivery services | 0.1% | 0.2% | 6.9% |
| Hotels, motels, etc. | 1.0% | -3.4% | 3.5% |
| Recreation services, admission, movies, concerts, sports events | 3.1% | 0.2% | 5.8% |
| Other personal services (dry-cleaning, haircuts, legal services…) | 1.4% | 1.5% | 6.3% |
| Video and audio services, cable | 1.0% | 0.6% | 5.7% |
| Water, sewer, trash collection services | 1.1% | 0.3% | 5.4% |
| Medical care services & insurance | 6.5% | -0.1% | 0.4% |
| Education and communication services | 4.9% | 0.1% | 3.1% |
| Tenants’ & Household insurance | 0.4% | 0.5% | 1.4% |
| Car and truck rental | 0.1% | -3.2% | -11.2% |
Health insurance mega-adjustment understates CPI, core CPI, services CPI, and Medical Services CPI through September.
BLS undertakes annual adjustments in how it estimates the costs of health insurance and then spreads those adjustments over the following 12 months. For the 12 months through September 2022, CPI overstated health insurance inflation (+28% yoy in September 2022). That overstatement has been getting deducted every month, starting with the first mega-adjustment in October 2022 (more here),and this will continue through September 2023.
The Fed’s favored inflation measure, the PCE price index, figures health insurance inflation differently and doesn’t suffer these adjustments.
The CPI for housing as a service.
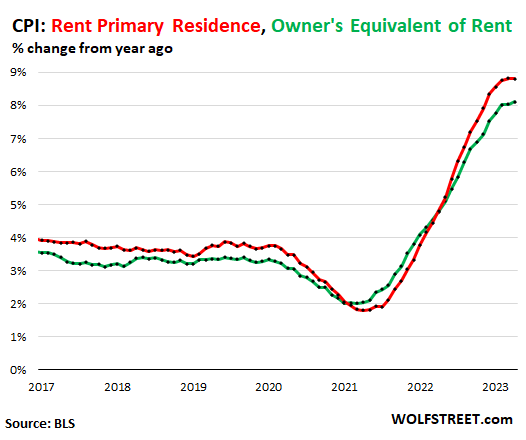
The CPI for housing as a service is based on rent factors, primarily “Rent of primary residence” (weight: 7.5% of total CPI) and “Owner’s equivalent rent of residences” (weight: 25.4% of total CPI).
“Rent of primary residence” tracks actual rents paid by tenants in houses and apartments. The survey follows the same large group of housing units over time and tracks what their tenants, who come and go, are actually paying in these units.
No-no-no… not “asking rents.” Other rent indices, such as the Zillow rent index, track “asking rents,” which are advertised rents of vacant units on the market. The huge double-digit spike last year in asking rents never fully made it into the CPI indices because rentals don’t turn over that much, and proportionately not many people actually ended up paying those spiking asking rents. Now those asking rents have backed off from that spike, but this backing off won’t be fully reflected either since the spike wasn’t fully reflected to begin with.
Both CPI rent factors jumped:
- Rent of primary residence: +0.6% for the month, an acceleration from the prior month; + 8.8% year-over-year, same as in March and February, and the worst since 1982 (red).
- Owners’ equivalent rent +0.5% for the month, +8.1% year-over-year, a new record, and the worst in the data (green).
We can now see that the month-to-month increases are less hot than they were, and that year-over-year increases are peaking. I spelled out here why, based on data from landlords, CPI for rent may not back off nearly as much as now taken for granted by just about everyone, from Powell on down.
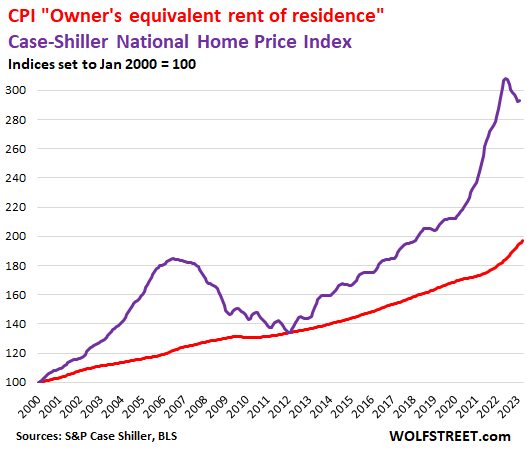
Compared to home price inflation: The Case-Shiller Home Price Index peaked with the report named “June” then started to decline [by city: The Most Splendid Housing Bubbles in America].
Nearly every spring, there is a seasonal uptick in the Case-Shiller Index, followed often by declines, and you can see this in the little wobbles between 2010 and 2019. The pandemic-surge blew up any seasonality. But now, in the cooling market, the seasonality is back with the first little uptick in the most recent data point (purple line).
The red line represents “owner’s equivalent rent of residence.” Both lines are index values, not percent-changes of index values:
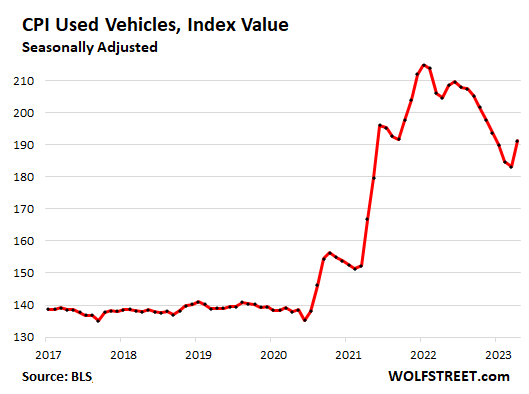
Durable goods prices jump as used vehicle prices blow out
A month ago, when the first month-to-month uptick in the durable goods CPI appeared, after two flat months, and after several months of sharp declines, I called it “a very unwelcome development.”
And in April, used vehicle prices blew out and pushed up overall durable goods by 0.8% for the month. This reduced the year-over-year drop to just -0.2%, so essentially flat.
Used vehicles CPI spiked by 4.4% in April from March, a huge jump. A month ago, I explained why this would happen, based on wholesale prices which had been surging for months, and based on inventories, which remained very tight, and based on demand, which outstripped supply, with not enough vehicles from fleets and lease returns coming into the used vehicle market.
Enough people – not all – have gotten used to the still sky-high prices and are once again paying whatever, it seems, a very unwelcome development for overall inflation dynamics. This chart shows the used vehicles CPI as index values, not percent change, and you can see the U-turn used vehicles made.
New vehicle prices have started to dip, amid growing supply and higher incentives by automakers and big price cuts by Tesla and some other EV makers, after a ridiculous surge in prices over the past two years. So now, new vehicle prices may decline for a while, as part of the inflation Whac A Mole game, only to pop up again, used-car like, in the near-ish future.
| Durable goods by category | MoM | YoY |
| Durable goods overall | 0.8% | -0.2% |
| Used vehicles | 4.4% | -6.6% |
| New vehicles | -0.2% | 5.4% |
| Information technology (computers, smartphones, etc.) | -0.1% | -9.4% |
| Sporting goods (bicycles, equipment, etc.) | -0.3% | 0.0% |
| Household furnishings (furniture, appliances, floor coverings, tools) | -0.4% | 4.8% |
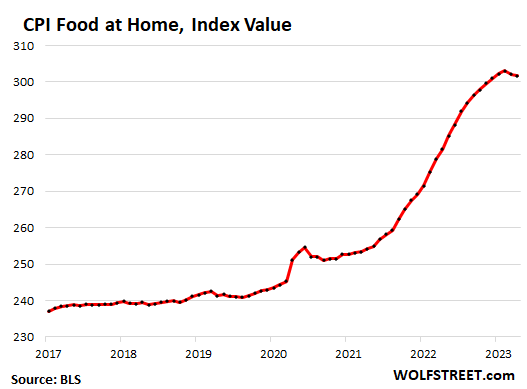
Food inflation.
The CPI for “food at home” – food bought at stores and markets – dipped by 0.2% in April from March, after the 0.3% dip in March.
Year-over-year, the CPI for food at home rose by 7.1%, the least-hot increase since December 2021, after a year of double-digit increases.
This chart shows the index value of CPI food at home. Note the surge through August last year, then the less-steep curve through February, and the kink in the curve in March and April. The index is 18.6% higher than two years ago:
Many of the major categories declined on a month-to-month basis.
| Food at home by category | MoM | YoY |
| Overall Food at home | -0.2% | 7.1% |
| Cereals and cereal products | 0.2% | 11.3% |
| Beef and veal | 0.3% | -0.5% |
| Pork | -1.2% | -2.2% |
| Poultry | 0.6% | 5.0% |
| Fish and seafood | -0.7% | 2.0% |
| Eggs | -1.5% | 21.4% |
| Dairy and related products | -0.7% | 8.0% |
| Fresh fruits | -0.5% | -1.8% |
| Fresh vegetables | 0.3% | 1.4% |
| Juices and nonalcoholic drinks | 0.4% | 10.4% |
| Coffee | -1.4% | 6.6% |
| Fats and oils | -0.4% | 13.8% |
| Baby food & formula | 4.3% | 8.8% |
| Alcoholic beverages at home | 0.0% | 3.6% |
Energy prices:
The biggest part here is the month-to-month surge in gasoline prices, that pushed overall energy CPI up by 0.6% for the month. But year-over-year, all major energy components except electricity are down sharply. Energy was a big contributor in the surge of the overall CPI in 2021 and the first half of 2022 and it is now a big contributor in moderating overall CPI.
| CPI for Energy, by Category | MoM | YoY |
| Overall Energy CPI | 0.6% | -5.1% |
| Gasoline | 3.0% | -12.2% |
| Utility natural gas to home | -4.9% | -2.1% |
| Electricity service | -0.7% | 8.4% |
| Heating oil, propane, kerosene, firewood | 0.0% | -15.2% |
Enjoy reading WOLF STREET and want to support it? You can donate. I appreciate it immensely. Click on the mug to find out how:

![]()
The stock market thinks inflation is coming down and thus up.
I don’t see any asset market going down a lot unless some shock happens to the system.
You must be blind. Residential and especially commercial real estate are crashing in an historic fashion.
What we have is stagflation. Fed needs to raise rates another 1-2% to break it, but at this pace that may take another year. Tbills are the place to be.
Agree w/ NYguy on timing.
I read that people still have their Pandemic “Excess Savings” $$$.
FED expects them to burn the “excess savings” down this by the end of this year.
That means consumer spending stays high till they burn it all :(
Slow motion correction is slow.
It’s hard to believe that there are still “excess savings” left after the population at large has been spending like drunken sailors for the last 2 years.
Perhaps “excess savings” simply means that too many people possess at least 1 penny in a bank account somewhere and aren’t living month to month on credit cards.
This is why too much, 5-6% is a lot and we feel it. No hope is on the horizon
35% excess money printed since the pandemic, maybe 50% of it has been burned by inflation already. Other half still sloshing in asset markets. Markets won’t deflate until 401ks get pulled out. Things must get messy to get there.
See M2/GDP for money demand.
Pandemic excess savings?
I was considered an essential worker and worked through the whole pandemic.
You’d laugh at what I’m making an hour and no I didn’t even get the special $2 or whatever for working during that time.
All I got $3,200.
And you’re going to tell me that’s a pandemic extra savings?
I guess out of League of anyone on here.
Thank goodness other worldly gov’t spending the last many years hasn’t impacted the economy, markets, inflation, etc! /s
Also there are millions of people who haven’t paid on student loans since spring 2020. That’s about to end.
The stock market is up 20% from October lows, so are other asset classes.
I am talking about the asset markets. The prices in both real estate and stock market and other assets are very sticky.
Apple , epitome of discretionary spending selling $1K plus iPhones is at all time high.
Apple is a cult stock owned by crazy cultists.
Jon,
“The stock market is up 20% from October lows”
Nah. S&P 500 is up 15% from that Oct low but is still down 13% from its high. It has not gone anywhere since January. It has been FLAT for four months.
Flat or not, it’s still 20% higher than the pre-pandemic bubble high, so it needs to come down quite a bit more.
@NYGuy,
Residential in 8 or so of the highest overpriced markets have dropped, on average, about 13%. The rest of the country is down about 5% and is starting to turn positive.
CRE isn’t crashing yet either in terms of national YoY comparisons. A lot of people are worried about it, but it’s not through the floor just yet.
I don’t disagree with the stagflation point, but the Fed is not going to raise rates past 6%. Even to get to 6%, we’d have to see a significant rise in core CPI upwards of 6.5% over the next 3-6 months.
Inflation is crashing. Look at the charts. The top is in on every single chart except housing. And since every article here about housing says it’s crashing too, inflation and consequently interest rates, must definitely be headed a lot lower.
Just give it a little time. We’ve all become too accustomed to instant results.
It isn’t working.
We’re drowning.
I continue to say that this is really just about too much money chasing assets and that once the debt ceiling fight is over, the Treasury will issue hundreds of billions in debt to “catch up” and that will finally cause the markets to fall.
The pace of global balance sheet reduction is virtually nothing, compared to the pile of assets they collectively own (ECB, BOJ, Fed and others)
@gametv I agree with this 100%, the new debt issuance is going to shock the markets at some point in the summer and send the 10-year up like 100 bps from here.
The WSJ Fed whisperer Nick Timiraos wrote a piece today suggesting the Fed will pause in June, I think they should hike again here but it’s looking like they won’t, FedWatch odds went from about a 25% chance this morning to about 5% tonight. It won’t stop financial conditions from tightening though.
Very puzzling set up. Stagnant inflation numbers with mediocre numbers posting from most with many just scraping by. Market perception is the most disconnected I’ve ever seen it. Slow walking into the bonfire disconnected.
I can confirm that used truck prices shot up second month in a row. The dichotomy is not me or any dealer I know can sell hardly anything(some can still sell certain economy cars). This business is so dead now down about 75% at least and I’ve lowered my prices 25%. Still no calls. What I conclude is this: There are a handful of rich(dealers) buying everything still reeling with pandemic era profits still pricing in consensual hallucination levels refusing to let go able to still sell some to the 20% rich home owners by financing only. These small % of buyers pay whatever. All others buyers have given the bird. The rest of the smaller dealers like me are getting squeezed out. This is stagflation, soon to be hyper stagflation imho. This stagflation is caused by the rich and this small rich cohort are wiping out the poor and middle classes through THEIR inflation(greed). Until stocks and housing crash, I surmise they will continue to do so, because they can. So goes the greed of the rich from the historic era of cheap money.
6 million vehicles of pent up demand Wolf article stated this about a month ago. I got a Big Ford Truck stuck in the mud commercials driving FOMO. 6 inch lift lifts and 35 inch tires all the rage in USA. There is a fear that the 6.2L and 6.6L big V8 are getting phased out with all the EV goals. GMC and Chevy faithful followers are worried about the future…$30k plus for trucks overs 100,000 miles. I never seen so many used vehicles with to 2/3 owners, previous accidents damage selling like hotcakes.
Yep. It was a stupid fantasy of central bankers that they could print trillions, causing massive asset inflation, and have the money just stay there, hoarded in assets, without affecting the prices of things people actually buy.
Sell your inventory at the auction,sounds like big money. By the way you guys shoved it up our a** ,now I hope the dealers burn in hell,die or starve
Not just the rich buying the vehicles that are still moving off lots, if you look at the employment stats wolf publishes people are still working and average wages are also climbing, even if not at the pace of inflation. On the ground I still see guys splashing on new trucks, these are mostly people that have owned their home for a number of years so they’re still positive on equity, their mortgage payments are a lot lower compared to more recent buyers but they’re enjoying pay increases along with the rest of us. However, on the whole there’s more hesitancy than reckless spending and more people I talk to are holding off switching/upgrading vehicles so I think you’re right.
About pickups, curious if the Section 179 tax write off has affected pickup truck prices/demand.
Know of a few who bought giant honkin trucks in the past year or so ‘for business’.
the drop off in sales is because most of the bottom 70% who are the buyers of the older units simply dont want to spend the money, dont have the money or refuse the current prices now.
Thanks WR for taking time to write this report.
Going by the spirit of the headline of this report, you really feel that inflation is UP and not going down.
But looking at the animal spirits of the market and actions of Powell, looks like we have inflation coming down.
There is a disconnect here and one side is wrong for sure!
“…you really feel that inflation is UP and not going down.”
The applicable term is “stuck” at a high level.
It sounds like Powell is going to be looking like a fool in a few months.
The savers and financially prudent are looking like a fool and have been screwed for last fee decades because of the elite friendly decadence policy of CBs..
Even if the influence goes to zero the price stays at permanent high plateau especially prices of life essentials
Powell is happy serving his elite masters and making 100s of millions for himself
They are not looking like fool but we are for sure
Powell has been saying in recent months that measures of core inflation — especially his PCE “core services without housing” — have gotten stuck at very high levels and aren’t really coming down.
That “dis-inflation” talk was like so January.
Agreed, this article came just in time. I clicked on a random news feed off of tradingview that claimed inflation is coming down, tech stocks are up etc… I scratched my head because after looking at the chart for SPY even that doesn’t look like anything is improving.
Wall Street is now fully pricing in a 0.25% lower federal funds rate by September, and 0.75% lower by December.
Wishful thinking and pure desperation. Wallstreet is the enemy.
Time to inch up the monthly QT a bit more.
Rent is why NY Fed Williams wants higher rates to attract banks money,
your money, to the Fed to finance our gov during the debt ceiling crisis.
US10Y > US5Y. The mid cave in.
The MSM and market gurus sure seem to be cherry picking their data to make the actual amount of inflation seem to be less than it really is. The other thing overlooked by most is the fact that even if by some miracle inflation falls to zero next month, this in no way means that prices have come down – it only means that they have stopped going up. The only way to get back to pre-pandemic prices levels will be via a very nasty recession.
Yes, for example average hourly earnings. This number used to be reported in the main CPI report, unadjusted for inflation. In reality, April’s increase ($33.20 to $33.36), was a larger jump than in previous months.
Now it’s reported in a separate document, “Real Earnings Summary,” adjusted for inflation to make the +0.5% M/M increase (+0.1% inflation-adjusted) appear smaller than it really is.
Of course, the financial media is a cheerleader for Wall Street, and most of the MSM is a cheerleader for the current government.
We’re not going to “get back to Pre-pandemic prices”. That’s not how inflation works – unless deflation sets in, 1990s Japan-style (this would be a much worse development than anything we’ve seen over the past 2 years).
The way this ends is for month-to-month price increases to moderate over time (this is disinflation, which is good – but not to be confused with deflation, which is terrible). The hope is that prices level out somewhere around an average monthly rate of increase of 0.16%, delivering the 2% annual rate the Fed is targeting.
If, in other words, history is any sort of guide (and if we’re lucky enough), there will not be a year or two of pricing declines (deflation – usually much “stickier” than inflation). That’s what would be necessary to deliver us “back to pre-pandemic pricing levels”. With any luck, instead, we’ll just “get used to” new pricing levels, which will be permanently higher than those from the pre-pandemic era. The hope will be that those (higher) pricing levels don’t begin to accelerate again, beyond the moderate (2% p.a.) rate targeted by the Fed.
Put another way, disinflation (which the Fed is trying to bring about by tightening credit) will get us back to a moderate annual inflation rate of 2%. We should all hope they can accomplish this without triggering the catastrophic bout of deflation that would be needed to get us “back to pre-pandemic pricing levels”.
I’d say deflation is a good thing. Needs to happen.
How do you explain 15 percent or so home price decline from the peak ?
Is this not deflation
No, it is not.
Deflation is not a function of price changes within a single good or service category (energy has also risen and fallen many times, during generally inflationary periods, without giving rise to what any serious economist would call “deflation”).
Deflation is an economy-wide trend towards lower prices, across a sufficient range of goods and services to cause the overall index of prices to fall.
Such a trend invariably results in sustained stagnation, as economic activity is disrupted by the rational decisions of millions of consumers, who delay purchases due to the expectation that they will spend less if they wait.
Deflation has been experienced, in the United States, most importantly during the early 1930s. We tried it again, between 2007 & 2008. It sucked, both times. It’s not something anyone should be anxious to try again.
Adam Smith,
Annualized CPI in 2007 and 2008 was 2.9% and 3.8% respectively, as reported by the Minneapolis Fed. The only calendar year with a negative CPI since 1955 was 2009 at -.4%. I think the housing crash “sucked” because of all of the absurd excesses, particularly mortgage lending, that preceded it. I don’t think it sucked because of the very low level of deflation reported in 2009.
The CPI was also slightly negative in 1949 and 1955 at -1.0% and -.3%. Nobody talks about how horrible those years with minimal price declines were, though I think in 1955 the US was coming out of a recession. The point being that we really haven’t “tried” deflation since the 1928 through 1933 when it was zero or negative 7 years in a row, peaking at -8.9, -10.3%, and -5.2% in 1931-1933. Now that’s trying deflation, and I will agree it sucked. It simply doesn’t compare to anything in recent history.
The invisible hand of the market would produce more deflation. I would think someone named Adam Smith know this.
Deflation is only bad for those caught in bubbles.
Look, the reality is that both inflation and deflation represent price instability. Neither one, if sustained, is good for anyone.
During inflationary times, there’s too much demand for the available supply, while during deflationary periods there’s insufficient demand – again, in relation to the available supply.
Inflation, at least, has a “self-correcting” dynamic to it. A common expression holds that “the solution to high prices is high prices” – meaning that the punishing effects of high inflation tend to push the economy back towards price stability, as excess demand is sapped by less affordable goods and services.
On the other hand, the effect of prices trending downward (deflation) tends to fuel the underlying instability in prices; it becomes rational to delay purchases in anticipation of a better deal next week, or next month, or next year (reinforcing, rather than counteracting, the demand-side weakness that is the cause of a downward trend in prices).
Japan – despite consistently strong exports – suffered two decades of economic stagnation as a result of a deflationary environment. While this might not happen in the US, it’s not an experiment I’d be very anxious to carry out.
2 more years of rate increases, eventually levelling @ 8 to 9 percent.
In your dream only I guess.
Another solid win for Joe’s Inflation Reduction Act.
It really broke the back of this thing at exactly the right time.
Wolf, were inflation figures higher in the ’70s than now because they weren’t massaged with techniques such as hedonic quality adjustments, or was inflation really just that much higher then? Not that they aren’t high enough for me now.
Inflation was HORRIBLE back then. It was a true fiasco. What we have today is bad enough, but it’s relatively mild compared to back then.
That’s helpful, thanks. I’ve read (and believe) that rising prices are a symptom of inflation, but the inflation itself is the devaluation of the currency, usually caused by profligate government borrowing and spending or central bank tomfoolery. Or both, in our current scenario. When I try to research causes of the “Great Inflation” of that period, nearly everything I find points to soaring oil prices as the culprit. But that doesn’t jibe with my theory here.
Brendan, the ’70s showed that any major supply disruption to critical pieces of the economy can create inflation, even if that disruption isn’t caused by excessive government spending and borrowing or actions of the central bank. The OPEC countries deciding to slash production to hurt the West was as much a market manipulation as anything the Fed or USGov’t could do and did essentially devalue the dollar within the petroleum market (which is just the flip side of saying that oil prices went up) which then spread across the board as business and consumer costs for basic functioning both went up. It was a manipulation, just not from the two sources you normally look to.
There’s no hope of reigning in government overspending, if only because of entitlements and that like 60% of GDP is government spending. The only out is more inflation. But not too much to lose the dollar and hegemony. It’s very tight and bumpy road ahead.
Soul/Funk group Cameo had a song called “Inflation” in the 70s.
Chorus]
Inflation
Sweeping ‘cross the nation
Inflation’
(Can’t get enough food to eat, yeah)
I ain’t got no shoes on my feet
(What?)
Inflation
(Even make a preacher steal, yeah)
Got my woman on the pill, hey
Inflation
(Taxes going up so high, well)
I can’t afford to die
Agree. Inflation in the 1970s was HORRIBLE.
Few people forget, but a lot of people weren’t there.
If stagflation goes on for 10 years, it will rearrange the political landscape.
The Central Banks are pushing on a string.
They’ve run out of road.
If they reverse and make $$$ cheap again to refloat the sinking ship have your wheelbarrow ready cuz you’ll need it to haul your $$$ to the shop to buy a loaf of bread.
If rates remain high – and they will – eventually something will give and the global economy will implode.
They have chosen option 2 and will continue absorbing the body blows as bank after bank fails. At some point they will run out of fingers to plug the holes in the dam. And it will come crashing down on the village along with billions of tonnes of water.
This will end badly. Guaranteed. There is no way out this time.
Digital dollar deflated to 10 cents on the dollar ,if you’re a billionaire it won’t matter or cyber attack knocks out banks, or electricital grid goes down . They have lots of options,before there on there jets to new zealand
Core CPI stuck in 5-7-5 range:
Inflationary
Prices increase every day
But not with your pay
Chairman Powell, where’s the deflation?
You said inflation should average 2% over time. It’s averaged 6% the last three years. We need a period of deflation to offset that, not more inflation.
Quit moving the goal posts on inflation!!! Be consistent. Operate with integrity.
Start by reducing the balance sheet at a faster pace so the last three years’ inflation does not entrench.
“The biggest part here is the month-to-month surge in gasoline prices, that pushed overall energy CPI up by 0.6% for the month. But year-over-year, all major energy components except electricity are down sharply. Energy was a big contributor in the surge of the overall CPI in 2021 and the first half of 2022 and it is now a big contributor in moderating overall CPI.”
SPR drawdown has restarted since the beginning of april 2023. We went from ~600m barrels to ~375m barrels in 2022, with a pause during the first three months of this year. We are down to 362m barrels currently.
The US consumes ~140m a week, drawdowns are running at about ~2mil per week. For 2022, the drawdown rate was ~4.3m per week.
At a drawdown of ~2m per week, SPR can last for 3.5 years. A drawdown of ~4.3m per week will zero out SPR at the end of 2024.
What if we get real inflation, not this 10-20% gig, but something more akin to Argentina?
If you open your eyes and look beyond Government inflation metrics the real inflation in ground is much worse than these made up manipulate metrics
Just some silly musings to a serious blog post, sorry… it came to me that the current situation is slightly analoguous with the Chernobyl scenario.
Most know from their own lives, history books, or streaming shows how that one happened: xenon poisoning was reducing reactor power – not realizing this, operators removed the control rods way too far – eventually, the xenon burned away and power spiked – the SCRAM “safety feature” completed the disaster because of the positive void coefficient that actually, and perversely, increased reactor power for the first few feet of insertion from the completely withdrawn position.
On the other hand, in the economy something was stalling the system since the 2008 housing crash. Due to this, none of the “control rods” – not ZIRP, not even QE – initially had the expected impact. Finally, the economic “xenon”, whatever it was, got burned away by the massive pandemic QE, and suddenly there was the risk of runaway inflation. Emergency interest rate hikes and QT are started.
The question that comes to the idle mind is, do interest hikes from zero actually have an initial “positive void coefficient”, increasing the inflation because of increased borrowing costs throughout the economy? Quite soon they of course start to have their desired impacts…
Sorry again, I know analogies lead you astray if taken too far.
That is interesting. The “big one” might just be yet to come.
32 Trillion made up dollars?
“rents re-accelerated.”
I said that a few articles ago. Phx rents re-accelerated for sure in April. And the stonk market (casino) continues to live in denial as usual.
Can we really trust them and the numbers being put out there? Was looking for your explanation today Mr Wolfman. YOU did not disappoint.
THANKS
Vi is meaningless because it postulates that people spend a dollar once.
This report shows that the quarter point rate hikes are doing practically nothing to bring inflation down. Maybe Powell should take a page out of the Bank of Mexico’s playbook? With MX’s benchmark interest rate now at 11.25% (a record) core inflation is coming down here much more rapidly than in the U.S., from 6.85% in March to 6.25% in April. This has certainly been helping drive up the peso’s value vs. USD as well.
Increasing rates will help slow the roll, but there is still plenty of liquidity out there, which the the banks wish they had more of right now. The key will be the Fed keeping to QT, and the banks using normal means of borrowing to keep (solvent? Ha!) the doors open.
I wouldn’t be surprised if we have a car glut soon, and that means used car prices will collapse like a house of cards. People won’t keep paying ridiculous prices for used cars. I’m starting to see TV commercials for new cars offering lower rates for financing. If car dealers want to sell cars, prices will have to come down, it’s that simple.
The damage from a decade+ of ultra easy money has been done. If the inflation rate were to suddenly drop to 2 percent, you’re still paying $100 to buy what you were able to buy for $50 fifteen years ago. My cable provider just notified me of another 10% increase starting next month.
The Fed should have done a surprise inter-meeting .50 basis point rate hike and let it be known that they are serious about bringing prices down. There is a lot of price gouging going on too. I see it whenever I buy groceries.
Seven large cap tech stocks are responsible for over 80 percent of the S&P’s gains this year. The Russell 2000 is near a 52 week low.
Things are very screwed up right now. Something has to give.
Wall Street is convinced that Jay Powell has no intention of being Paul Volker; he’d rather be Arthur Burns or William Miller. Inflation will persist until the massive COVID stimulus works its way through the US economy, which is a multi-year process. Inflation expectation will be reset higher by the time this “transitory” process is completed. Neither the current political class nor the current population have the fortitude for the Volker treatment.
Occam, your comment, “Neither the current political class nor the current population have the fortitude for the Volker treatment,” is sobering. A January 6th event was unimaginable back then. Massive shootings, a super-abundance of semi-automatics were unknown then. The deplorables were still lurking under the rocks.
“People are crazy and times have changed. I’m locked-in tight, outta range. I used to care but, things have changed.”
I would like see us replace “Stagflation” with “Triflation” as a description of the current economy.
Inflation + Recession + Bank failures = Triflation.
When the CMBS collapse occurs we will have “Quadflation”
Inflation + Recession + Bank failures + CMBS meltdown” = Quadflation
I hope so. I hate so much what America has become that I want it to fail.
So after a pause, the Fed might have to raise rates rather than cut them. So we should sell our house during this little spike and become renters of choice.
Something odd I’ve noticed since home prices spiked is people bragging about all their equity, but I know of no one who has actually realized their gains.
Because they are ignorant. If they sell, they buy higher and at higher rates eliminating the only pos asset most possess. Wolf discusses this.
3% rate people should rent their homes then live in another rental. Doing this now for a girl at work. She will have a $500/mo cash flow turn around while someone else pays off her house.
I have benefitted tremendously. My rentals are paid off and cash flow is up 33% due to equity (inflated prices) because you still can’t buy them with a payment cheaper than the rent.
I don’t have debt, truck is 2017 with 50k miles, raise my own beef and chicken, and have free health care from army retirement so inflation is meh. If economy crashes…fine, i’ll lower rents because i didn’t leverage them amd then i will buy more. Just like last time…
I think Hanke has been the most correct about this situation the past few years. Look at the money supply to see what will happen to prices in 6-18 months.
Prices are the effect of monetary expansion/tightening.
What Jerome Powell and the FED have done to pricing is unforgivable. They should be in prison awaiting trial. For an entity whose mandate is supposedly stable prices, they actively created rampant inflation in a willful, deliberate act of dereliction. There is simply no good excuse to explain why they did what they did. Nothing passes the sniff test.
The covid lockdowns.
It’s been argued that inflation of the 70s and 80s was caused at least in part to the deficit spending to fund the Vietnam war.
The lagging and lingering affects took some years to kick in. Not to mention the non-economic costs to veterans and families that cannot be pencil-whipped on a ledger.
Iraq and Afghanistan wars were famously ‘off budget’ as well.
The immediate causes of the current inflation can be pinned on the actions of the fed and others in the last 15 years.
Though, I wonder if it’s even possible to tease apart how much of the current inflation is due to policy and due to war.
Maybe that’s why inflation some of this inflation is ‘sticky’ and the fed’s tools are inadequate; they’re only affecting half the problem. How do you undo war? How long before wars wasteful effects leave the economy?
There’s no undoing all the covid $timulu$ showered on the masses… well I guess you could argue inflation is (un)doing that.
Current inflation and bubble asset prices are the direct result of loose monetary and fiscal policy
Not only funding the Viet Nam war; remember LBJ’s Great Society program. In effect LBJ tried to establish a garrisoned welfare state. Is it any surprise we got the inflationary 70s?
It’s hard to imagine the pain this caused. You’re right if you think a 5%-6%-7% mortgage of today is painful. But try to imagine what 10%-12%-15% mortgage of the 70s felt like.
In my opinion, this is why LBJ didn’t even bother running for reelection.
So much blame on the Fed! By saying the Fed created inflation, we are confirming that we the people have a behavior problem. That problem is that we feel entitled to the lattes, expensive cars, dining out even the size of our homes. The Fed did indeed make all that easier. And they gave the PE crowd free money to get even more wealthy. The PE titans loved that last tax overhaul. I certainly don’t need a 4 bedroom house anymore. We still give our adult child whatever is asked. ugh. But we don’t want to go backwards – Oh no! And so it goes with everything we all buy. Therefore until the people feel less entitled, they will pay higher prices and complain, blame, protest, and call others names. We really should all appreciate our standard of living because it’s the best in my lifetime.
You seem to have a fundamental misunderstanding of what inflation is.
Stockholm syndrome.
I don’t remember all the details, but I thought that the Federal Government’s debt gets “refinanced” on average roughly every 5-7 years. With the debt at whatever tens of trillions it is (30+) is it safe to say that time is the Federal Reserve’s enemy in this inflation battle? They are 1.5 years into this rate hiking cycle with little to show – meanwhile, the interest cost to the government keeps rising as debt is issued at higher interest rates (I have some 5% treasuries for example). Is there a net benefit to the government to drag out inflation to devalue the debt, despite the fact that their interest cost is going up?
The only power that can impose discipline on Congress are much higher interest rates. We need 10 years of 8% rates, to where the interest payments zap everything, until the ONLY thing Congress discusses is how to cut spending and raise taxes to end the budget deficits, that by then will be horrendous, and that elections are won by those with real plans and commitments to solve this problem.
Do you think that will happen? Do you see 8% rates in the near future?
Nah, Congress doesn’t want that kind of discipline. They’d keelhaul Powell on a daily basis worse than Trump had done. Senator Warren already hates him, and lets him know every chance she gets.
But if core inflation measures head to 8%, or higher, folks might get scared enough, and we might see 8% policy rates. Not sure how likely that is, though. Not high on my probability list.
Wolf, would you consider writing an article about your probability list? I think many readers would be very interested :-)
Warren hates him for the wrong reason. She’s worse than he is.
Elections are not won by those with real plans and commitments to solve problems. At least, historically this has been my observation.
I strongly disagree! Oh, do you mean the country’s problems? Because winning politicians have plans and commitment to solve their own problems, and maybe a small subset of their electorate’s problems.
Dollar debasement will be the end game; runaway inflation is how this story eventually ends. Debt growth keeps accelerating as do unfunded liabilities, and thirty two trillion dollars of existing debt is an immense number. Once everyone knows the dollar can be created at will, the government can no longer say no to any significant financial blocs, interest groups or worthy causes. Creating trillions has become too easy and reflexive; that’s why Covid spending got so out of hand. The genie is out of the bottle.
I agree, JW. It’s either a slow-boil or austerity which is a political non-starter. Currency inflation is global and as long as that continues, and inflation is gradual enough, the frog won’t jump out of the pot. Not unlike global warming.
The Federal Home Loan Banks will keep the inflation party going, already loaned out a trillion dollars to regional banks including such fine names as Silicon Valley Bank just before the collapse.
Perverted from their depression Era purpose of making home loans to house the population, they apparently now make loans to banks sloshing inflation with “liqudity” to make the depression Era descendants homeless.
There is nothing inflationary about debt changing hands like that. The FHLBs borrow money from investors by selling them bonds. The FHLBs then lend the money to banks. In other words, they take money from Peter to pay Paul. Peter could have paid Paul directly, but refused to. So now there’s a middleman with a guarantee, and the money transfer from Peter to Paul can happen.
But there are government policy problems with that, however – unrelated to inflation.
Looking like another 0.25% increase is in the cards for June.
Meanwhile the yield curve does insane snake gyrations at the short end of the curve, the likes of which I’ve never seen:
1-mo: 5.50%
2-mo: 4.99% ?!
3-mo: 5.24%
4-mo: 5.24%
6-mo: 5.13%
1-yr: 4.70%
2-yr: 3.90% ?! (80 basis points lower if you want semi-annual payments)
3-yr: 3.55%
5-yr: 3.37% (213 basis points lower than than 1-mo?!!)
7-yr: 3.40%
10-yr: 3.43%
20-yr: 3.88%
30-yr: 3.80%
Wolf, I know you don’t think the yield curve is indicative of much (based on a previous comment to me), but from my perspective… auction results today indicate the smart money– big money– is remaining very defensive and keeping the long-end of the curve well bid (pushing yields down, and keeping them down, as they have been for a year)… and the short end whipsaws around wildly, with the whole curve as inverted as I’ve ever seen it.
I don’t see a soft landing, I see a bull trap… and a nasty crash coming.
If by the end of this year I’m wrong, then ok, I “only” earned 5%+ APY on my investments in ultra-safe T-bills. I can live with that.
I see no significant of yield curves honestly.
It has been inverted for quite quote some time and at one point in time recession would come
Even a broken clock is right 2 times a day
Disagree. The significance is in the very long end of the curve bubbling up. The bond market is not going to let the 2% inflation target change without making the US govt pay a hefty price.
Bond market got screwed last year taking heavy losses. So much for bond market is never wrong :;)
Bond market can be controlled easily by FED via QE. In essence, there is no free bond market. It’s all manipulated.
You might consider taking a walk on the wild side.
The SPX daily graph looks like a classic head and shoulders top with the left shoulder higher than the right shoulder.
SPXU on sale! 13.25
yield_curve_believer,
This is what a nation gets when its CB goes certifiably insane with more than a decade plus of non-stop QE. Expect the curve to get bent, twisted and contorted further in the years ahead. Lots of “never seen before” stuff.
The best way I know of to gauge inflation is to look at the total compensation package provided to the Federal workforce.
Total compensation packages including take home pay, full benefits including retirement( 20 Years ) compared to what the private sector offers today is much more telling.
The Govt. puts out numbers that reflect a narrative while the total compensation packages provided to their employees suggest inflation is considerably higher.
It is an insult to anyone who lived during the 70’s and $.39 gasoline prices to pretend that things were somehow worse back then.
Correction: $.27 gasoline. And, things were “worse” back then, except for anxiety. That’s inflated greatly.
According to Useless A Today, gasoline in 1970 was $.36 per gallon and was $1.19 per gallon by 1980.
$.27 per gallon was so ’60’s.
$.19/gal, briefly, during SoCal “gas wars”. I bought $1 at a time.
HA!, I remember gas ” price wars” ,in the late 60’s or early 70’s ? on vacation w/ family in Kentucky, $.09/ gal.
Also 1975 ish, I was a teenager working at a gas station and the price broke $1/ gal. but the pumps only went to $.99.9. The owner had to buy new pumps.
good times..
M2 money supply has rolled over and decreased for the first time in 60 years according to the St. Louis Pred’s chart…..down 7% or so from its peak. Serious recession dead ahead with CPI as low as 3% by the end of the year. Look for the political Pred to panic and douche rates to 2% or less (NIRP) in early 2024…..especially with an election coming up. The first rate cut will be telegraphed by insiders piling into TLT (20 year bond proxy) based on privy info.
Meanwhile… in the “political press”… more whistling past the graveyard.
Title… I kid you not… 5 Things to Know About the Best Inflation Report in a Long Time
The war is inflationary in many obvious, and far less obvious ways; homeshoring or friendshoring is inflationary, because it’s disruptive, because it requires huge capex to build new mfg plants, and because the new production will come from a higher wage country ( U.S. Canada, Mexico etc ) than China; weather instability is inflationary, think flooding of the Central Valley in California, think dire water shortage on east side of Rockies; changing basic power sources from carbon to ‘other’, may be reqd but is inflationary now, less so in the future; banning pipelines and insisting oil be transported by train, is inflationary ( and stupid); the remarkably inefficient U.S. medical system is inflationary, including the drug companies and their highly protected patents which they have learned how to extend almost forever….costs you happy campers nearly 20% of your gnp….unbelievable, inflationary, and, apparently, untouchable; and, yes, govt overspending/undertaxing is a part of the problem, as is/was the extra liquidity during covid.
What I’m saying is, this is a highly complex challenge, with some aspects of inflation likely to be a factor ( climate instability for example, and homeshoring ) for a long time.
Meanwhile, no govt, in the U.S. or anywhere else, wants to tax appropriately, and all want to give us more of what we want, than we, our economy, our govt, can afford.
It’s that old Pogo comic strip ……he finds ‘the enemy’ after years of searching…….and, surprise, it’s him, it’s us.
Just one more comment, though i’m a died in the wool free enterpriser, capitalist if you will, to see the wealthy and ultra wealthy escaping paying a fair share of their income in taxes ( my idea of a fair share) …….infuriates me………and sours my view of the whole economic and political structure…….and, in my view, may ultimately produce a political reaction that will destroy the free enterprise economy, and that would be tragic.
Cheers.
Good points! Can Humpty be put back together again?
Tax reform is simple. Wealth tax on those with assets in the 99th percentile. Not income, not on a computation of unrealized gains. No estate tax gimmicks that allow step-up in basis and other BS structured to entrench (largely) unearned wealth.
Drop the highest marginal tax rates and create social mobility and a true meritocracy. Something sorely lacking, even in the US.
What exactly is this “fair share”? 50%? 60%? The problem isn’t revenue it’s spending. Entitlements must be reformed.
“Fair share” is nowhere near 50% or 60%, but it would have to involve some sort of tax on unrealized gains, so that the wealthiest people on Earth cannot escape tax for an entire lifetime.
I’d be happy if one fourth of unrealized gains in stocks, bonds, RE, etc. were taxed each year, with unlimited loss carryforwards and carrybacks. The brokerages already compute the unrealized gains each year.
Alternatively, why not get rid of estate tax exemptions and clamp down on estate tax evasion? Many wealthy people out there won’t even agree to pay taxes when they are dead. That’s ridiculous. They want to create family dynasties.
We already have taxes on unrealized gains – they’re called property taxes.
Are your “insurance” policies “Entitlement policies”? Are payouts for claims “entitlements”? If so, then call the money invested by workers for 50 years into the Social Security system an entitlement. Otherwise, it is what it’s always been, an insurance policy.
For what it’s worth, when Im in my Manhattan house I have to eat out nearly everyday to satisfy my young friend. And shop at wholefood for “organic stuff”. I can say without any doubt that prices are way up. I don’t keep track but maybe 20-40% over 2-3 years. Absolutely hate it.
Used car prices jumping was an aberration in a consistent downward trend. New car prices dropped – the more noteworthy trend reversal as discounting starts to kick in after years of markups.
The report also can’t be taken in isolation. Every other leading (not backward looking) indicator shows what we expect. Lagged impact of hikes. The Fed raising further would smack of incompetence of a level difficult to comprehend.
LOL: “The Fed raising further would smack of incompetence of a level difficult to comprehend”
You’re talking your book? Wall Street Crybaby? You’re funny. The EFFR should ALMOST NEVER be under the rate of inflation. It should be substantially above it.
People who complain about high rent and food prices or can’t afford, still pays $1000+ for over-hyped over-priced iPhone! Dumb, dumb, dumb!
Wolf,
Thanks.
Had to chuckle at the nonsense headline from Redfin on Thursday (which was blown up by ZH here on Saturday) regarding a decline in asking rents. Another attempt to suggest that rent declines are imminent. So tired of this continued cheer-leading nonsense that 2% inflation is just around the corner.
Elevated inflation will be the norm for the balance of the decade unless the Fed gets serious about attacking it. We’re still stuck with NIRP for Pete’s sake. FF must be set at least 150 to 200 bps above core inflation in order to have any real impact. If they don’t want to go there then at least remove the monthly caps on balance sheet runoff.