“Even more damning than our initial report”: Carson Block of Muddy Waters.
By Nick Corbishley, for WOLF STREET:
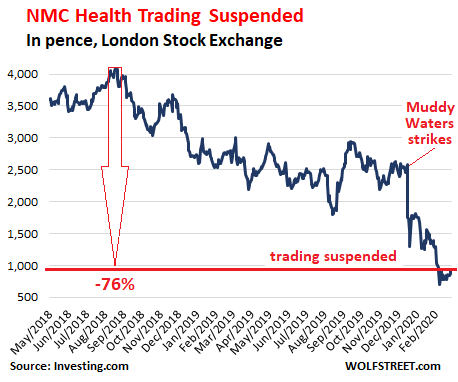
The shares of NMC Health, a component of the London Stock Exchange’s FTSE-100 Index, were suspended on Thursday after an internal review revealed a morass of fraudulent accounting and fiduciary shenanigans. The CEO of NMC Health — which has health-care operations in 19 countries and is based in the UAE — was fired and its CFO placed on extended sick leave. The UK’s Financial Conduct Authority is investigating.
At the heart of the scandal is an arrangement that apparently enabled other companies controlled by NMC’s founder, the Indian-born billionaire Bavaguthu Raghuram Shetty, and two Emirati shareholders, Khaleefa Al Muhairi and Saeed al-Qebaisi, to raise £260 million in secret off-balance sheet financing, without the knowledge of the company’s board. There are also indications that the company’s shareholder register was falsified, and that some 20 million of the shares supposedly held by Shetty, worth around £185 million, are actually beneficially owned by his two Emirati partners.
“These arrangements were not disclosed to, or approved by, the board and were not disclosed to as related-party transactions in accordance with the listing rules,” the company said in a statement, adding: “The arrangements were not reflected on the company’s balance sheet.”
The “temporary” suspension of NMC’s shares ahead of the publication of the internal review prevented the annihilation of NMC’s shares, which have already collapsed by 76% since August 2018.
On December 17, 2019, short-seller Muddy Waters had targeted the company: “We have serious doubts about the company’s financial statements, including its asset values, cash balance, reported profits, and reported debt levels,” it started out. NMC was engaging in a raft of accounting irregularities, including overpaying investments, materially overstating cash balances, and reporting profit margins that “seem too good to be true.” And it concluded, “We are unsure how deep the rot at NMC goes, but we do not believe that its insiders or financials can be trusted.”
Shetty’s other listed company, Finablr, a financial services firm, has lost over 70% of its market value since December 2019.
NMC initially dismissed the accusations by Muddy Waters as “principally unfounded, baseless, and misleading.” But to its credit, the company set up an internal review of the allegations, and that review, published this week, ended up not only corroborating almost all of those allegations but uncovering a whole host of other irregularities.
In one of the most damning admissions, the review notes that the holdings of Mr Shetty and his two Emirati partners, Saeed al-Qebaisi and his relative Mr Muhairi, may “have been incorrectly reported historically to the company and the market.” That was enough to invite a blistering riposte from Muddy Waters’ founder, Carson Block: “At this point, the company’s announcements speak for themselves and seem to be even more damning than our initial report was.”
The announcements also raise big questions about the quality of the job performed by NMC’s auditor, Ernst&Young.
Reverse factoring is a form of financial engineering, an arrangement with a lender that turns the company’s trade accounts payable into debt that is owed to a financial institution. But that debt does not have to be disclosed as debt, and the company appears to have less debt than it actually has, giving the company the outward appearance of robust financial health.
“That’s the whole point of financial engineering, to take something that’s not flattering and to hide it,” said Carson Block.
In the case of NMC Health, the company’s founder and his two main partners appear to have taken out hundreds of millions of pounds in reverse factoring deals under the company’s name with the sole aim of paying that money to other companies they own.
The lion’s share of that money ($274 million) came in the form of trade-finance securities provided by two supply-chain finance funds belonging to Credit Suisse. Those securities were sourced and warehoused by Greensill, a London-based, SoftBank-backed start-up that has come from nowhere to become the main player in the supply-chain finance market. Another $83 million facility was stumped up by a little-known underwriter called Channel Finance SA.
For the moment, it’s unclear where all that money actually ended up. But one thing that is becoming clear is that NMC’s clash flow situation, after years of internal plunder, is in critical condition. According to the FT, things have gotten so bad that the company recently resorted to pledging future credit card payments from customers to secure new bank funding.
For NMC Health’s shareholders, there’s little choice but to sit tight and wait to see what other punishment awaits them. James Vane-Tempest, a Jefferies analyst who was the first to rate NMC as “sell,” says that in the worst case scenario, in which the healthcare group’s governance problems blossoms into a full-scale liquidity crisis, the existing shareholders could be wiped out altogether.
With reverse factoring deals growing in popularity among cash-strapped companies — Greensill acquired $150 billion of receivables last year alone — and much of the resulting debt worming its way into funds that are sold to yield-hungry investors, investors may actually begin asking themselves how many of the companies they invest in might be in a similar situation. By Nick Corbishley, for WOLF STREET.
These days, markets forgive and forget anything except the suspension of share buybacks. Shares dive. Read... HSBC Announces Mass Job Cuts, Huge Write-Down, Asset Sales, Halt of Share Buybacks. Warns of Coronavirus Impact on Credit Losses & Revenues in China & Hong Kong
Enjoy reading WOLF STREET and want to support it? You can donate. I appreciate it immensely. Click on the mug to find out how:

![]()
Don’t worry the virus will save them. /sarc
And so… trust is eroded at all levels of society – Governance, Finance, while the moral and ethical foundation that we all depend on fades… Anyone watching these antics, and then watching the perps get away scott free… time and time again.. has to start wondering – The Tinder is drying out, and the right spark – risks igniting a whole forest fire of resentment… We really need to stand up for real Justice here…
This, precisely. Poll after news article after discussion after debate, I see faith in capitalism crumbling. To a degree that concerns me, to be honest, because I know people WON’T stand up for justice, they’ll just let it build up and then over-correct. Imagine The Cultural Revolution, with millennials. ::cringe and shudder::
“The announcements also raise big questions about the quality of the job performed by NMC’s auditor, Ernst&Young.”
LOL now THERE’S a shocker….
However, apparently we mustn’t regulate because that reins in the ‘wealth creation’.
And we really can’t have that, can we now. Best stick with the legalized fraud. It can only end well.
They probably hired former Arthur Andersen auditors left over from Enron. I suppose everyone has a ‘price to look the other way.’
Fish begins to stink at the head, not the tail.
problems start with people at the top and slowly spread down.
government finances are worst than any company and no one is in jail for that.
Max-If you’re suggesting business is at the ‘tail’ of anything in a nation where the reach and power of corporate lobbyists is legend, I suggest you have another think. The rotting situation, as well-defined by Morty and Change, above, is endemic in our population-not an ‘us’ and ‘them’. A house-cleaning ‘Cultural Revolution’ with it’s concomitant pulling down of the whole tent and collateral damage is a very real possibility, one growing more real by the day.
May we all find a day to be better, eventually…
The Institute of Chartered Accountants, by its Charter, has the power to suspend immediately the operations of E&Y, and to order the police to place the CFO under house arrest. The Exchange has similar powers for the rest of the senior management. The taxation authorities have the power to close the offices of NMC, on grounds of suspicious transactions leading to possible tax evasion. A fraud of this magnitude is sufficient to kill E&Y, much like the Enron fraud killed ArthurAndersen. So, let’s see the ‘regulators’ get to work. [note to Wolf: next time, please provide links to the annual filings, the audited statements, and the trading symbol].
Well said Grune. But you and i both know that the Institute of Chartered Accountants are weak and toothless (same as all Govt departments). Nothing will be done to E&Y except for maybe a class action that will be settled out of court. And so it continues
For the record, the Institute has a Charter, and thus is independent of govt. The protection of the public interest is supposed to be paramount. True, we must see if the Institute will wield its power judiciously to protect the public interest. Were I a CA in England, I would call upon the Institute to suspend immediately and investigate the CFO and EY, leading to disbar. The disrepute affects all auditors worldwide.
What are these ‘regulators’ of which you speaketh ??
Seems that tbe only one’s in control are the 4 horsemen .. oh, excuse me .. I meant horse ‘persons’. Gotta keep up the pc allusions ….
Anyway, all regulators .. as such, as far as I can tell .. are always out on Brunch !
Carson strikes again. I am a big fan!
Have a look at The China Hustle.
I’m a fan too.
Carson Black’s Sino Forest assessment was the classic, but they kept fighting to the bitter end, and the believers hung on even after the end was long gone – the posters on bulletin boards were going on a year or more after the end. Blind faith, a common symptom of the patsy.
You have to have thick skin to research short reports; you will be relentlessly attacked.
…
The only worthwhile indicator (i.e. SELL) as it pertains to auditors is when the client ‘changes auditors’ or when they resign because even they can’t stand the stink and sense liability issues. The final straw was when auditors claimed that they were not responsible for detecting fraud (ostensibly the original reason for their existence); their only job was to make sure everything the company told them added up.
But that’s the problem with any consultantcy. You look around the room, see who’s writing the check, and agree with what they say unless you want to be looking for a new client.
You have to give Muddy Waters credit.
They are very good at seeing clearly through muddy water!
Truly Enron is alive and well !
Outright criminal fraud.
But no perp walks? No handcuffs? No appearing before a judge? No threat of criminality and jail?
More “too big to jail” companies?
“to raise £260 million in secret off-balance sheet financing, without the knowledge of the company’s board. There are also indications that the company’s shareholder register was falsified, and that some 20 million of the shares supposedly held by Shetty, worth around £185 million, are actually beneficially owned by his two Emirati partners.”
NMC Healthcare is floated in London but, here is the extraordinary thing, is incorporated and headquartered in Abu Dhabi.
While Dubai has a well deserved reputation for all sorts of financial shenanigans, Abu Dhabi may actually be worse under that point due to the climate of complete impunity that is the norm in the Emirate.
In the past I covered how Etihad, the airline “vanity project” of the Al Nahyan family, the Abu Dhabi rulers, has been caught engaging in all sorts of accounting scams and admitted losing $4.6 billion in three fiscal years. Trust me on this: it was simply too big to keep under wraps and I still feel we aren’t being told the whole story. In another country Etihad would have entered bankruptcy protection, or perhaps even folded already, and lawsuits would have started flying in all directions. No more champagne and caviar for a lot of people.
But in Abu Dhabi… it’s (almost) business as usual. Comatose oil and LNG prices however have dictated a long series of cost-cutting measures, such as the cancellation of of large orders with both Airbus (A350-1000) and Boeing (777X), starting to sell off the whole 777-300ER fleet and storing all the A350 delivered so far.
What does this mean for NMC Healthcare?
If the Abu Dhabi shareholders are somehow tied to the Al Nahyan, they will not merely get away with it but will be fully protected from the law. What they and their Indian associate/accomplice, Mr Shetty, have committed is “corporate misconduct”, basically the same stuff Enron did.
UK regulators and the London Stock Exchange will torn them to ribbons… with ther tongues, but there’s very little they can do without the co-operation of Abu Dhabi authorities.
Given the traditional subservience of British authorities towards Gulf potentates (chiefly because of large “defense contract”, aka corporate welfare schemes) it’s likely not much pressure will be put on Abu Dhabi.
And all Mr Shetty has to do is stay put in India and keep a low profile for a year or two.
Fiat inflation constantly reduces the purchasing power of money.
To some extent, it is possible for people to protect their savings against this trend, but this requires thorough financial knowledge, the time to constantly supervise one’s investments, and a good dose of luck.
People who lack one of these ingredients are likely to lose a substantial part of their assets. The savings of a lifetime often vanish into thin air during the last few years spent in retirement. The consequence is despair and the eradication of moral and social standards.
As one writer observed:
These effects are “especially strong among the youth. They learn to live in the present and scorn those who try to teach them ‘old-fashioned’ morality and thrift” [emphasis added]. Inflation thereby encourages a mentality of immediate gratification that is plainly at variance with the discipline and eternal perspective required to exercise principles of biblical stewardship — such as long-term investment for the benefit of future generations.
Even those citizens who are blessed with the knowledge, time, and luck to protect the substance of their savings cannot evade inflation’s harmful impact, because they have to adopt habits that are at odds with moral and spiritual health. Inflation forces them to spend much more time thinking about their money than they otherwise would.
We have noticed already that the old way for ordinary citizens to make savings was the accumulation of cash. Under fiat inflation this strategy is suicidal. They must invest in assets the value of which grows during the inflation; the most practical way to do this is to buy stocks and bonds. But this entails many hours spent on comparing and selecting appropriate issues. And it compels them to be ever watchful and concerned about their money for the rest of their lives. They need to follow the financial news and monitor the price quotations on the financial markets.
The spiritual dimension of these inflation-induced habits seems obvious. Money and financial questions come to play an exaggerated role in the life of man. Inflation makes society materialistic. More and more people strive for money income at the expense of other things important for personal happiness. Inflation-induced geographical mobility artificially weakens family bonds and patriotic loyalty. Many of those who tend to be greedy, envious, and niggardly anyway fall prey to sin. Even those who are not so inclined by their natures will be exposed to temptations they would not otherwise have felt. And because the vagaries of the financial markets also provide a ready excuse for an excessively parsimonious use of one’s money, donations for charitable institutions decline.
https://mises.org/library/morality-fiat-money
Max:
This is why history strikes with periodic financial “depressions” that tend to inflict that kind of pain and “future” fear to everyone including the young about living a bit more prudently.
Good god, hope this isn’t the tip of an iceberg!
Are there more companies around doing this ?
Guess we’ll find out, won’t we.
Since “reverse factoring” has a name…don’t be surprised if it somewhat widespread.
The scandal lies not in what the law/accounting stds forbid…but in what they allow…
Looking for a bright side…
Every large corporation has an immensely complicated web of convoluted contractual, regulatory, and statutory obligations…even if a Corp manages to thread the needle of legality in a narrow sense on something like this…it does not mean that such accounting f*ckery pokery has not violated some other legal obligation – even the most careful law firms are not going to know every possible obligation that a corp is subject to.
There are a million torts that can be incurred and a lot of parties outside the reverse factoring transaction itself have interests that are negatively impacted and who have an incentive to act.
Just because a deceptive Corp appears to get away with something on the front end, does not mean they don’t get heavily dinged – or dismembered – subsequently.
It just may not be as widely publicized.
Even the worst offenders – TBTF banks – ended up paying billions in fines and lawsuits…it just took years.
It may not have ended them (which it probably should have) but they didn’t get off 100 pct Scott free.
Depends what generally accepted accounting principles means to you. If leaders – banks and countries – create money out of thin air, while maintaining the position no one else can, it leaves an unpleasant taste. Naturally entrepreneurials will manipulate to award themselves the same privileges. When individuals discover how to create money out of thin air and do so in large numbers, then accounting such as this will be generally acceptable. Until then it is generally unacceptable and any fine is not a deterrent since money can be created.
THIS – Designed by the fox for the fox while hens strut feeling protected
John Vermeer,
We have covered “reverse factoring” for a while, including some companies that have used it and have collapsed.
https://wolfstreet.com/tag/reverse-factoring/
reverse-factoring is simply proof the exchange, market, and reporting standards are frauds.
Giving Carson any credit after the fact you didn’t talk about it while the stock was high it’s funny brought it out after the stock it already gone down another Gone Girl short-seller that should also be tarred and feathered
Naresh,
Not sure I can decipher what you’re trying to say, but are you saying that we should have given Carson credit BEFORE he announced his short?
Why the sour grapes with Carson (if I understood you correctly). Why not be angry with the CEO of NMC, Bavaguthu Raghuram Shetty, and others that perpetrated this scam?
And we’ve warned many times about what reverse factoring does:
https://wolfstreet.com/tag/reverse-factoring/
Informative article
The question becomes how many more companies in the US and Europe engaging in fraudulent activities
It was Muddy that blew the opening whistle on one of the largest scams on the Canadian Toronto Exchange.
Red flag 1: the Chinese based outfit Sino-Forest got it’s listing via the backdoor: buying a shell just for its listing.
Red flag 2 to the n: the forests it supposedly owned were in China! Muddy tried to count them and verify ownership and this proved impossible.
Muddy and Sino had a slanging match for a while with Sino making the usual bleats of outrage etc. So the stock drifted until the referral to the RCMP. Then it was de-listed. Arrest warrants have been issued for some guys in China but this time the Mounties aren’t going to get their man.
NB: one investor had a ‘stop loss’ in at $16. Then came the criminal referral. He got out at 6 and change which soon turned out to be pretty good.
Madeoff was uncovered in the DEc of 2008
There will be more financial fraudulent actions/events will come unhinged in the months ahead
Just wait for the tide to recede!
Sure looks like the tide is going out…
A 10% market pullback in a week!
Madoff was exposed in 2008 in the big down move in the market. Had that not happened he may well still be operating today, as he had for the 30 years before 2008.
He was actually uncovered in 2000, but no one would listen, which is what happens when almost everyone is in love with your story because they (seem to) make money.
When members of the SEC would visit Madoff’s office after warnings from Harry Marcopolous (sp?) author of ‘No One Would Listen’ they would gaze at Madoff’s maze of screens supposedly carrying out orders ( all fake) and satisfied they’d leave but would often drop off their resumes.
Madoff didn’t trade AT ALL. All that was necessary to unmask Madoff was to confirm the trades, an hour’s work for the SEC.
Short this baby NMC. Buy puts in Muddy Waters!
They broke the 11th commandment: Thou shalt not get caught.
Deregulation makes this sort of thing common, even if it’s not to this extreme. The reason we have regulations is because bad things happen when you don’t, so with deregulation you can expect things will continue to worsen.
For big corps in the US it appears to be pretty much a free-for-all because the laws let them get away with too much, from the malign Citizen’s United decision on down. Watchdog groups get ignored too much. Suits against corps are hopelessly backlogged and it takes years for victims to get any kind of redress. Regulatory agencies mostly just clean up the messes after something blows up.
Tax dodging seems pretty universal for just about anybody who can go through the motions. It’s a $450 billion dollar industry in the US alone.
Russ Mokhiber’s Corporate Crime Reporter has had it’s hands full for 33 years. Tracking corporate shenanigans is a substantial cottage industry but there’s just too much of it to cover more than certain stories.
So criminal fraud was deregulated?
Tax evasion was deregulated?
Money laundering was deregulated?
Embezzlement was deregulated?
Sorry. Those are still on the books. Try again.
I will give you a hint…”too big to jail.”
“Deregulation makes this sort of thing common, even if it’s not to this extreme. The reason we have regulations is because bad things happen when you don’t, so with deregulation you can expect things will continue to worsen.”
Maybe there will be some pardons? :-) Oh right, can’t do that in a parliamentary system. Wrong venue.
Pardons?
You need to be convicted of something to be pardoned.
“Too big to jail…”
Those are still on the books.
And lightly enforced, occasionally. Investigation and enforcement have been systematically defunded for years. Your last president let millions of fraud cases go but rewarded the banks for crashing the US economy, and the one you have now is an established perpetrator. But you knew that.
It gets worse the more you look at it, and I’ve been looking at it for decades.
Tax evasion was deregulated?
How many people named in the Panama Papers went to jail or paid full restitution?
Any?
Ten trillion in unpaid taxes in twenty years is quite a lot of cheese, and that’s the bottom estimate.
2Banaba – Yes criminal fraud had been legalized. See Eric Holder, and our Ivy League educated Supreme Court’s ruling on bribing public officials, essentially legalizing bribery.
2banana:. Sorry to tell you this but Congress legalized all of these crimes!
Unamused,
The goal is to get caught at the right time in a corrupt system. In America you typically “this is also applies to corporations” cannot be found guilty and punished twice “double jeopardy”.
So if you are corporation.
1. Steal money “in various ways.
2. Get caught every once in a while, when a favorable outcome is certain.
3. Get a fine equivalent to 1%-30% of the money you stole, admit no wrongdoing, downplay damage you caused, and the level of money you stole then no-one important will ever go to jail.
4. Once the public stops paying attention, get the fine lowered hugely, then and only then pay it.
5. You got a clean slate now. So start stealing again. It’s the American way.
It’s important to have this cycle, because then you have a clean slate. You don’t want to have an enormous amount of crimes to surface all at once, you gotta have controlled releases.
There are plenty of consultants available to handle these things for a modest cost. It’s been increasingly industrialised since the 1980s. Lawyers, accountants, strategists, elected and appointed officials. It was disappointing to see a billionaire DINO candidate admit to having a collection of legislators in his pocket, but completely unsurprising.
I don’t think deregulation is an invitation to commit Enron style fraud, which is what this appears to be. And conversely, regulations don’t prevent fraudulent behavior. And has the UK been in a deregulatory environment? I think you’re projecting your political bias to this situation, which appears to be straight up garden variety fraud.
The UK, under Gordon Brown as finance minister, promoted “light-touch” regulation, at about the same that he put an end to “boom and bust”, and sold off the country’s gold reserves at a low point which chartists still call “the Brown bottom”.
Warren Buffet does a really good job at explaining the complex financials of a big company in his annual report. He also tries to instruct on a few topics each year. He also drops hints when the stock is under or over valued.
This year he explained why many boards are useless when it comes to overseeing a company.
He also tries to explain some of the problems with GAAP earnings. For example GAAP earnings were around 80 billion BRK as now unearned capital appreciation gets reported as income, but in reality the holdings only earned something north of 12 billion so in reality total earnings were roughly 40 billion. Not too many CEO s would tell you they only earned half of stated earnings.
I think “deregulation” is a completely mythical creature, like Sasquatch or the Loch Ness Monster. Everybody talks about it, there are thousands of websites devoted to it but nobody has ever seen it in the flesh, let alone brought back proof of its existence.
All that’s missing is a nifty souvenir, such as one of those cool Sasquatch stickers or adorable Nessie plush toys. ;-)
It is mythical.
Deregulation in many, or maybe most cases is where the entity gets to pay inputs at market prices but whose selling prices are still regulated to ‘protect the consumer’, in other words, politically acceptable. Think of the S&L ‘crisis’ in the ’80s, or power in California years later.
Come to think of it, that’s why businesses were regulated, or just as often, confiscated by the government in the first place – votes.
One thing to keep in mind regarding US corporations:
The City of London is the place where they handle business that is too dirty to handle in the US because of the tight UK rules …
What happens in the City of London (and similar pirate coves worldwide), stays in the City……usually.
Think of this as a bunch of pirates sailing out and taking too big of a prize, bringing the wrath of the powerful but “law abiding”. Who are themselves just pirates with less “animal spirits”.
I’m sittin’ here in Houston and all I can think of is Enron…. (and the auditors) LOL
Except they went to jail and the auditing organization went bankrupt…
That was a simpler and more just time, if enron happened today Kenneth Lay “founder and CEO of Enron”. Would be celebrated as a innovative job creator, be bailed out, and become a candidate for president of the United States of America.
How could a company board not see hundreds of millions being shifted off? I suppose it was a real OMG moment when the news came in? Yeah right. These dang company boards are bringing in CEO’s and CFO’s with specific qualifications: Financial Engineering. Boeing, Wells Fargo, etc.
How could a company board not see hundreds of millions being shifted off?
Motivated blindness is the only necessary credential for a board member in all the best corporations. Sometimes all you need is a name. No experience necessary.
To get along, go along. You know how it is.
Nod nod. Wink wink.
Placed on sick leave? Why isn’t he in prison? Why hasn’t he been arrested? I know Eric Holder formalized not charging the US corporate elites like Boeing’s manslaughtering CEO with crimes, but isn’t this Britian?
Timbers:. CFO went on sick leave because the CFO made dam sure the policy was always fully paid up!
Just milking the cow, on the way out, one last time!
“Honey, I just fraudulated hundreds of billions of securities and helped bring about one of the worst recession in history.” – WIFE: “Oh, that’s too bad, dear. You better call in sick and take some sick leave. You know you’ve earned it, Jamie, dear.”
Sadly company balance sheets mean whatever you want them to mean.
These days you can’t even tell if a company is cash flow positive!
https://www.journalofaccountancy.com/issues/2009/dec/20091793.html
It seems to me that if Blackstone investor SoftBank invests in companies A and B, then A and B are bound to become one another’s customer. But they invest in the whole alphabet.
In the immortal words of Ricky Ricardo… “Ernst&Young, you got some splaining to do”
I’m currently shorting another Muddy Waters target, Lukin Coffee which they called “a fraud”.
Very good to see they hit the bullseye this weekend with this health company
Luckin Coffee may not be an outright fraud, but it was sure to attract Mr Block’s unwanted attentions.
Block has made his name, a fortune and a ton of enemies exposing the, let’s be charitable, cavalier approach to financials of many Chinese startups, especially those that took the step of going public outside of China, where local authorities cannot artificially prop up share price.
Luckin Coffee has come from seemingly nowhere and grew too much too fast in what is a market with extremely low enter barriers. In just 18 months they had already gone public in New York… and then came the maxi announcements of thousands more new coffee shops, the mega deal with Schaerer (I was in Solothurn when it had just been announced and you could feel the buzz since manufacturing in the area was already in full hangover phase) for an enormous number of vending machines…
I suspect Block has contacts at Schaerer or at the parent group (WMF) keeping him updated on the situation. The second payments start arriving late, or a few thousands vending machines are cancelled or delayed Muddy Waters will make sure everybody knows it. Block doesn’t care if Luckin Coffee is bailed out or not: all he cares about is the yups who bought their tiny slice of the Chinese dream in New York get cold feet and start selling.
With Luckin all they may need is a little push.
Financial corruption is everywhere.
Ordinary people are hurt by insane financial fraud & chicanery and it’s only just beginning.
Soon, in the coming great financial debacle, many will lose their pensions, homes, savings, everything.
Then comes bloody revolution.
There should be a list because what goes around comes around, if there is any justice.
Financial corruption stems from political corruption; they are joined at the hip.
In July 2015 on another web site I proposed that career politicians be replaced by the random selection of citizens, similar to the juror system.
Fixed terms, good salaries, job guarantees, jail time (no option) for transgressions…and more.
I wasn’t debated, harangued, abused or ridiculed. Worse. I was ignored (actually, I quite liked that, being a bit well ..odd)
Just 2 weeks ago I heard on a BBC News report that Belgium and (I think) Germany were seriously considering a similar proposal.
OK, it was to be a ‘Citizens Council’ with no direct power BUT the pollies would ignore it at their peril. That was the theme. A work in progress. Any one in Europe know of this?
We know our system is broken. The only way forward is:
1. have the inevitable collapse
2. clear the decks
3. Get rid of career politicians and replace them with YOU & ME!!
A totally absurd concept right now. But just wait and see.
I think the Fed’s put has caused problems with generally everything going up in value and people getting lazy about due diligence of their investments. For the most part you just can’t hand your money over to someone and expect them to have your best interest at heart. An honest, shareholder friendly and highly skilled CEO is a good find.
The problems might happen if (though probably it’s ‘when’) attempts are made to repeat the rescues of 2008. The popular narrative of the post-GFC era is that it was “rescue for the fat-cats, austerity for everyone else”. It’s a hard narrative to refute.
It always surprised me (or, rather didn’t), that when governments & CBs introduced ZIRP and QE, they didn’t think ahead to the probable surge in asset prices, and put some capital gains taxes in place to claw back at least some of that gain for taxpayers – had they done this, asset price inflation might have been less extreme, and/or less “austerity” would have been required.
Not only the auditor, what about the Nomad? (supposedly FTI Consulting) All fee based feeders with very little accountability – pardon the pun.
Problem with having a Premium LSE listing (mind you!) and ops in countries with limited visibility/transparency shld always be approached with scepticism. Why be listed on LSE if your primary funding market or s/h are resident elsewhere?
The UK has a murky relationship with Gulf states given the economy’s overreliance on military hardware and consulting revenue, so don’t hold your breath for a forensic audit to actually bring the culprits (and service providers ) to book.
Good grief, have we lost all connection to the real world? In 40 years of commercial credit, one HUGE red flag, causing fireworks, and screaming sirens, were vague things like a high or increasing “other payables”. This would insure a dead on arrival credit or finance deal.
You can’t tell me that a summer finance student intern, working part time for the finance department, couldn’t notice or call out “other payable” at this level as being a big four alarm fire, a deal breaker, a “stop the presses” on any potential credit line or financing. If not, they would be relegated to mail room inventory work only.
Is this how bad financial analysis has become? If so, perhaps it helps explain UBER, WeWork, Tesla, and other “pretty facade” frauds. If so, I’m extremely happy to be out of the circus.
God help us all.
Oh, the invisible hand of the market at it’s best. The hand is invisible because theft is better committed if it is not in plain sight.