
How Americans are handling their debts.
By Wolf Richter for WOLF STREET.
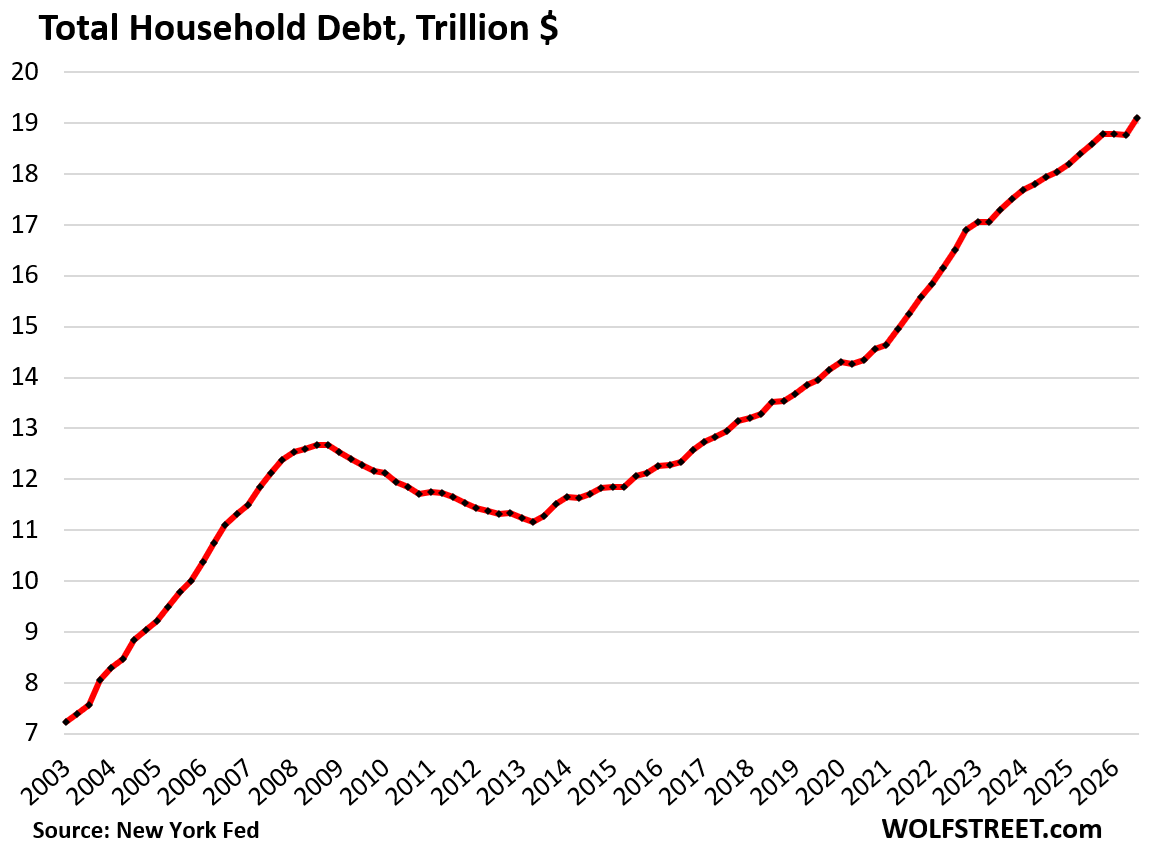
Total household debt outstanding in Q3 rose by $334 billion from Q2, or by 1.8%, to $19.1 trillion, after having been nearly unchanged for two quarters in a row, according to the Household Debt and Credit Report from the New York Fed, which obtained this data via its partnership with Equifax. Total household debt includes mortgages, HELOCs, student loans, auto loans, credit card balances, and other consumer loans such as personal loans and BNPL loans.
The quarter-to-quarter increase was largely driven by mortgage balances, which jumped by $257 billion, after declining in Q2. The unusual decline in Q2 had been “due to a temporary gap in the reporting of mortgages on credit reports due to a transfer of servicing,” the New York Fed had explained at the time. And now the missed data from Q2 was included in Q3, causing the Q3 mortgage debt to jump from the under-reported Q2 balances.
Year-over-year, total household debt rose by $520 billion, or by 2.8%, the second smallest increase since Q2 2021, behind only the prior quarter.
The burden of the debt.
Total household income has risen over the many years, as more households were formed, and as incomes increased per household. In addition, there were years of wage inflation, consumer price inflation, and home price inflation. So total household income has grown over the years since the Financial Crisis far faster than total household debt, and the burden of that debt on households has declined over the years.
The debt-to-income ratio is a classic way of evaluating the burden of a debt. With households, we can use the debt-to-disposable-income ratio.
Disposable income (by the Bureau of Economic Analysis) consists of after-tax wages, plus income from interest, dividends, rentals, farm income, small business income, transfer payments from the government, etc.
But it excludes capital gains, which is where rich households make most of their money. Excluded are thereby income from stock-based compensation plans and capital appreciation where billionaires make their billions.
The debt-to-disposable income ratio in Q3 ticked up to 78.9%, as disposable income rose to a record while debt balances increased slightly faster. But the Q2 ratio had been pushed down by the above-mentioned gap in mortgage reporting. Q3 simply ironed that out.
Both Q3 and Q2 were the lowest in the data going back to 2003, except for two quarters during the stimulus era, when disposable income was inflated by the stimulus checks, PPP loans, and numerous other government handouts.
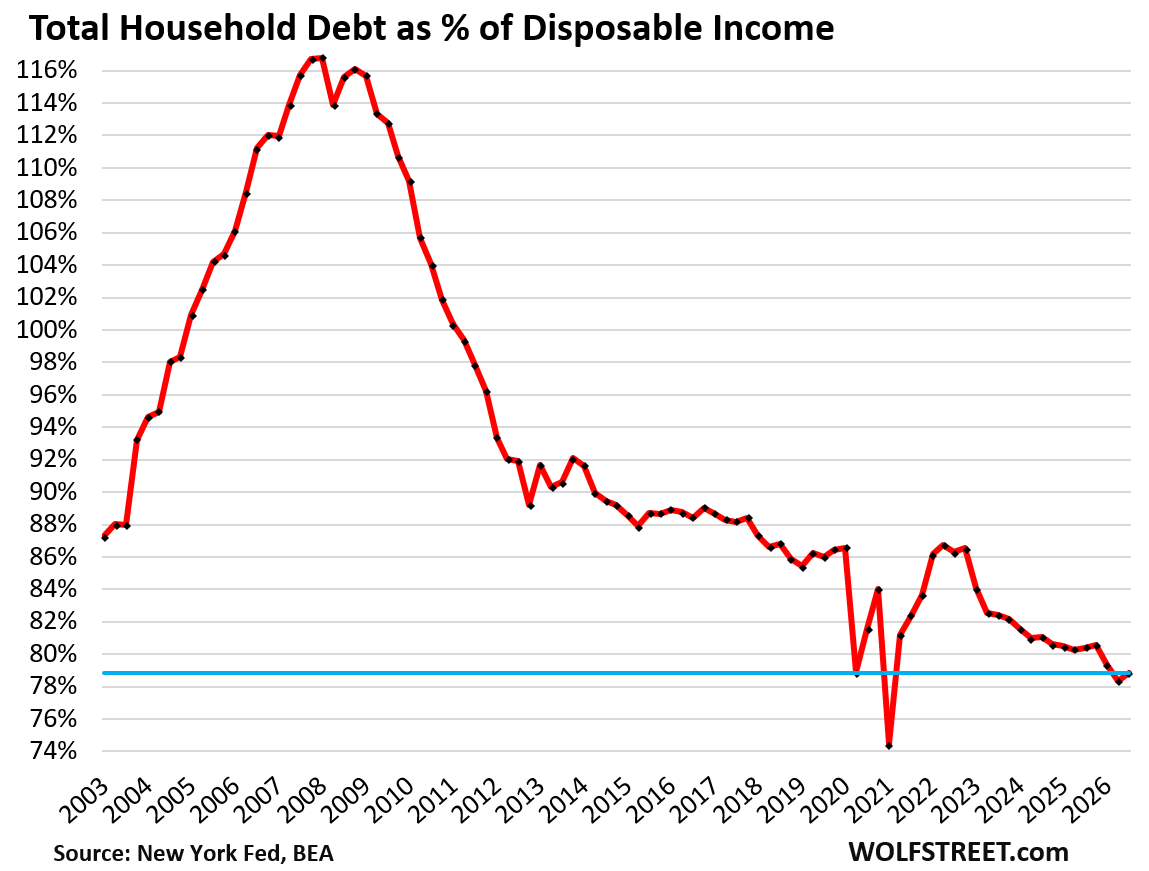
It’s obvious where the problems were leading up to the Financial Crisis: Consumers were way overleveraged, and banks were on the hook for this debt, which came on top of all the risks banks had loaded up on over the 10 years since the Glass-Steagall act was repealed. When the debt-to-disposable-income ratio passed 100% in 2005, all red alarms should have gone off at the same time.
Household balance sheets are now in good shape overall. 65% own their own homes, and home prices soared over the years through mid-2022, and these households are sitting on huge amounts of home equity. About 40% of homeowners own their homes free and clear. Another big portion of homeowners has only a relatively small balance left on their mortgages. Over 60% of households have at least some equities, and their values have skyrocketed over the years. Households hold precious metals and cryptos. And households have over $5 trillion in money market funds and a large pile of CDs.
The leverage risks today aren’t with households but with overleveraged businesses, including those in the AI trade, and the massively over-indebted federal government.

Delinquency rates.
Federal student loans that had been covered by the government’s forbearance policies since 2020 came out of forbearance in 2025. While in forbearance, borrowers didn’t need to make payments, and their loans weren’t counted as delinquent, and student loan delinquency rates plunged to near zero.
But in 2025, when forbearance ended, loans showed up on credit reports as delinquent again when borrowers failed to restart the payments, and serious delinquency rates for student loans exploded back above 10%, where they’d been before the pandemic. This once-again high delinquency rate pushed up overall delinquency rates.
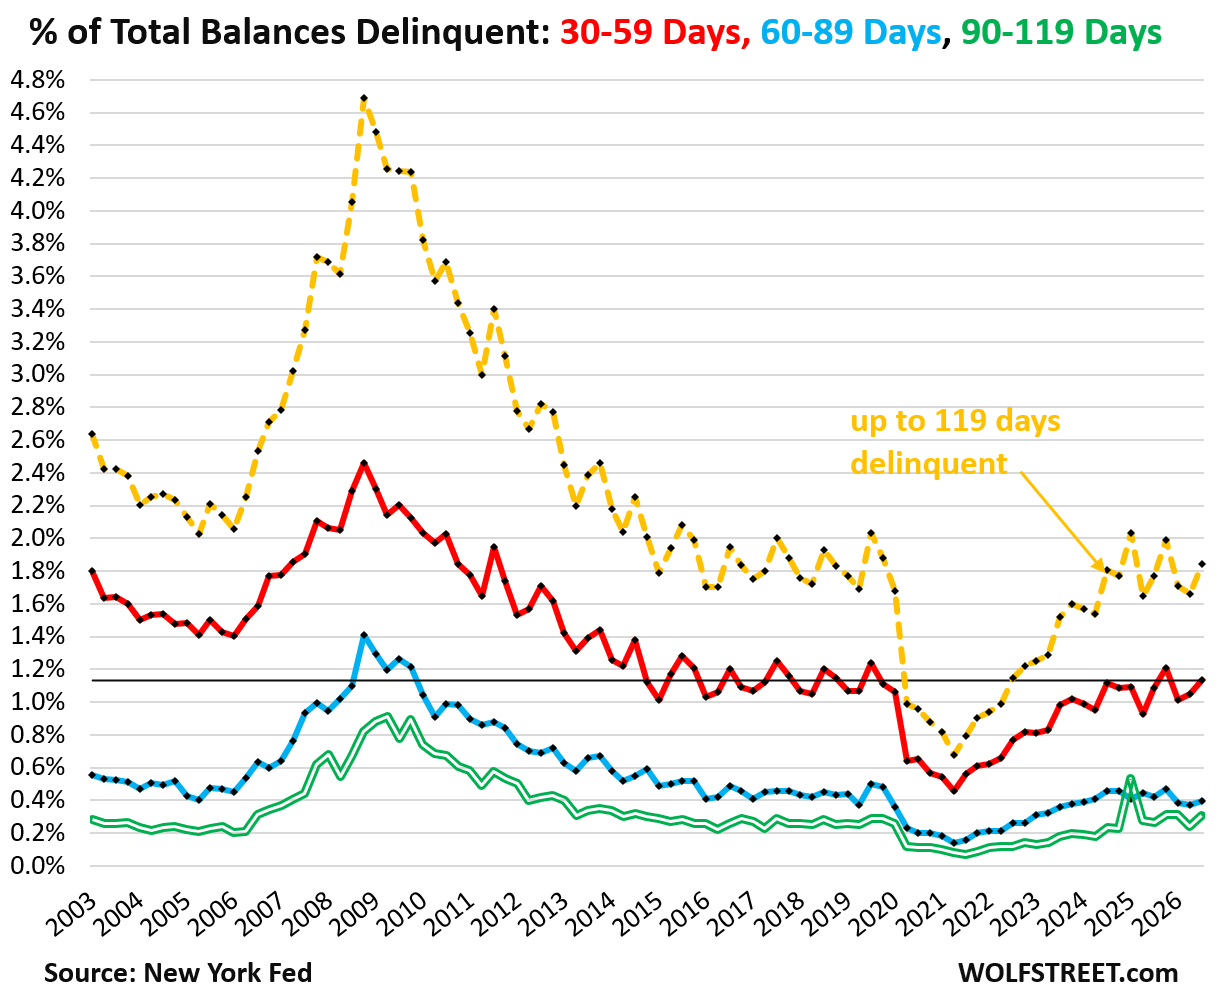
Delinquency rates for total household debts by delinquency status:
- 30-59 days (red): 1.1%
- 60-89 days (blue): 0.4%
- 90-119 days (green double line): 0.3%
The dotted yellow line shows the combined delinquency rate for the three categories, all debts delinquent up to 119 days: 1.8%
Delinquency rates are at or below where they’d been in the three years before the pandemic, and far below the prior years. They have risen from the near-zero rates when delinquent student loans and mortgages were in forbearance and didn’t count as delinquent.
Mortgages make up 70% of total household debts, and they have low delinquencies. Delinquency rates are substantially higher for other loan types and huge for student loans (we’ll get to each debt category over the next few days, so stay tuned).
In the category of 120+ days delinquent, there is a lot of old, charged-off stale delinquent debt on credit reports that hasn’t been removed yet. The New York Fed, in a blogpost a few months ago, clarified this issue with regards to credit cards, and summarized:
“We find that the stock delinquency rate is rising because of a pool of stale, charged-off debts that lenders have been reporting for longer durations, rather than a fundamental worsening in the incidence of delinquency.”
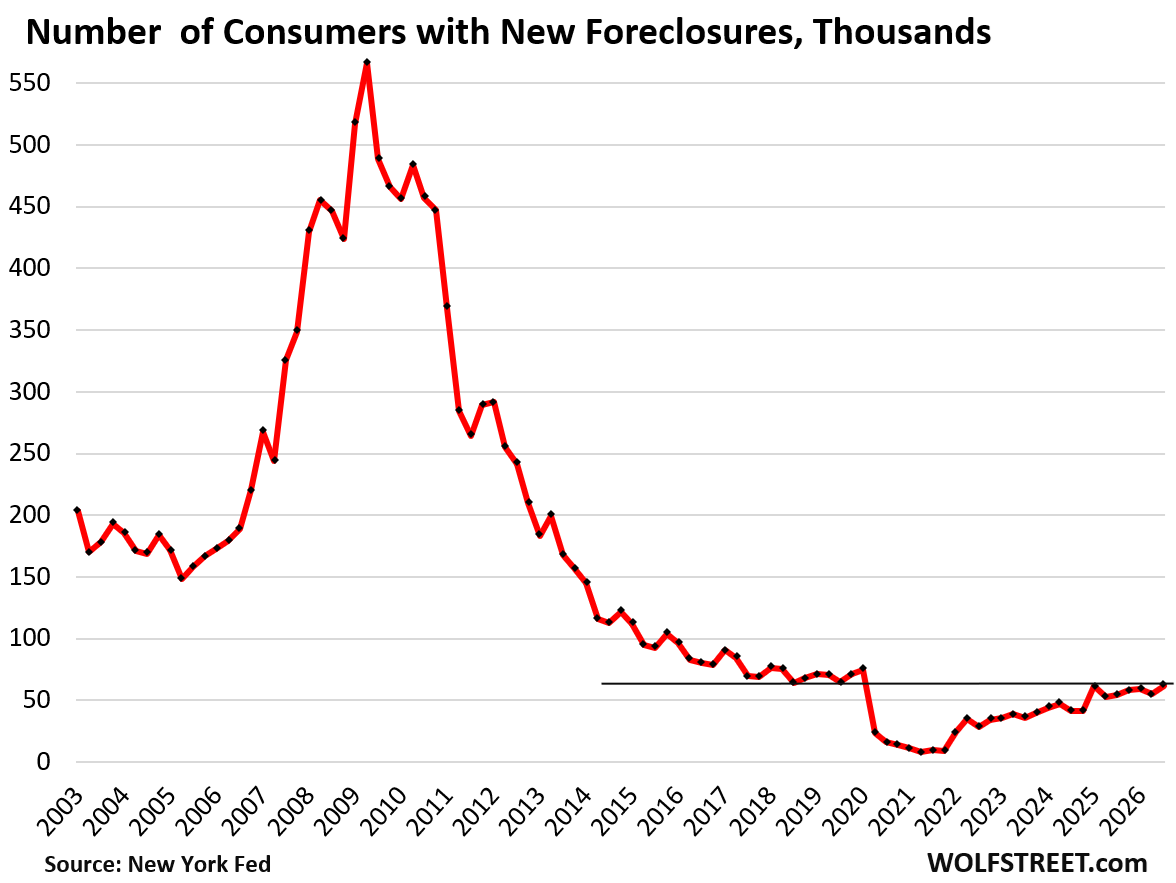
New foreclosures in Q3 edged up to 61,900. During the era of mortgage forbearance and foreclosure bans, foreclosures were near zero because they were essentially impossible.
Foreclosures are now at the very low end of the three years before the pandemic, far below the number of foreclosures in prior years, and historically low.
Condo prices have plunged in many markets and condo supply has shot up, while sales have plunged, and walking away from the condo and the mortgage would seem to be the next logical step. But that hasn’t shown up yet as a visible uptick above the pre-pandemic years in foreclosures.
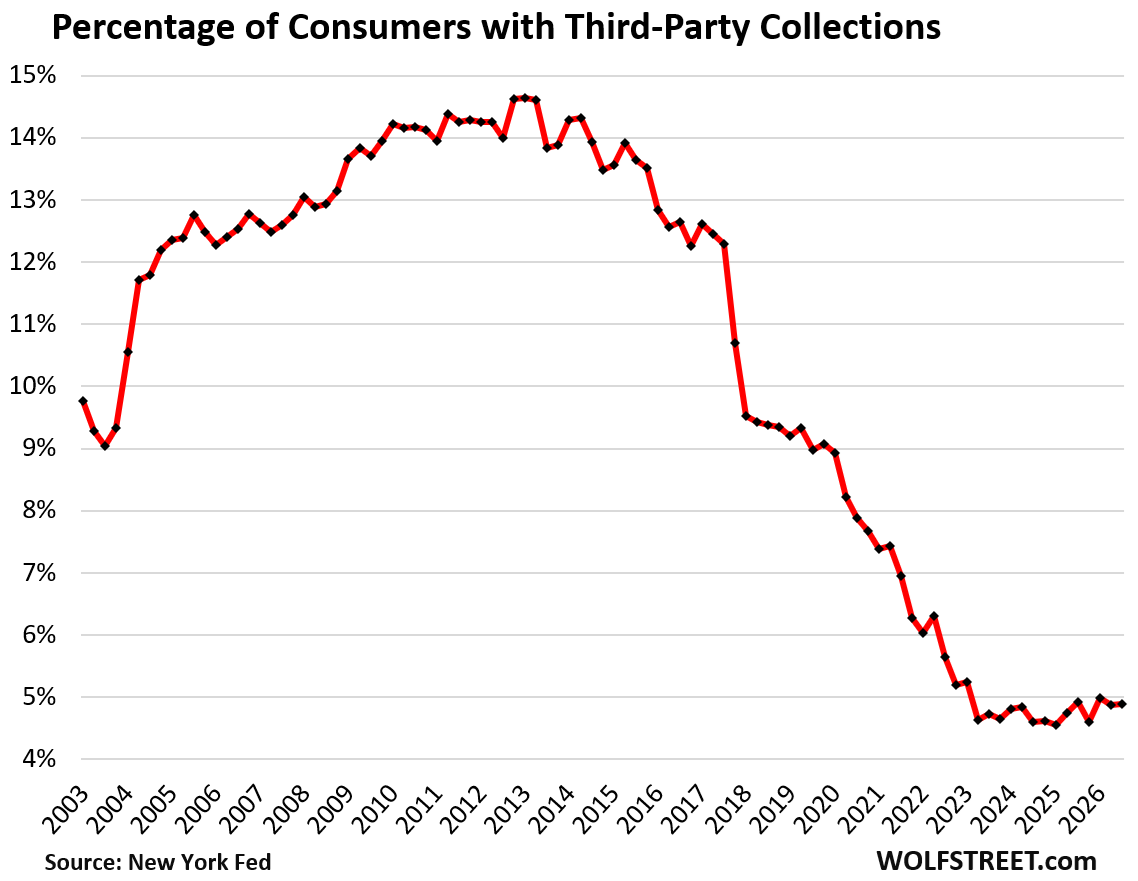
Third-party collections were essentially unchanged from the prior quarter. The percentage of consumers with third-party collections on file within the past 12 months remained at 4.9%, stuck at rock-bottom.
The collections data is based on public records and credit reports. The majority of collection actions result from unpaid medical bills and utility bills, according to the New York Fed’s Data Dictionary. Credit accounts, such as credit cards, make up only a small proportion of collection actions.
The share of households with third-party collections on their records had exceeded 14% from 2008 through 2015 as a result of the mortgage crisis, the Great Recession, and the unemployment crisis, during which many households fell behind on their bills, and those arrears were eventually turned over to third-party collections.
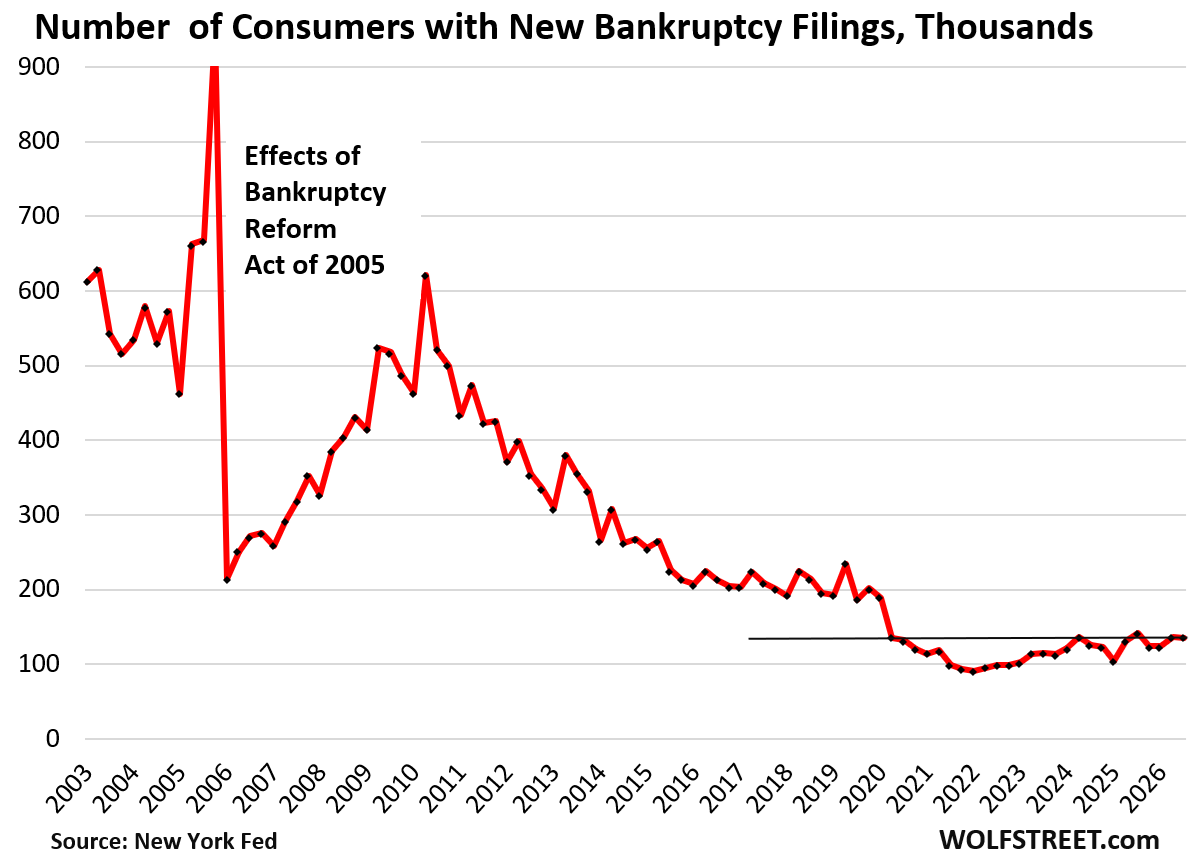
New bankruptcies remained at rock-bottom. The number of consumers with new bankruptcy filings in Q3 edged down to 135,220, far below the low end of the Good Times before the free-money pandemic.
I will discuss housing debts, auto debts, and credit card debts in three separate articles over the next few days. Next one up is housing debt.
Enjoy reading WOLF STREET and want to support it? You can donate. I appreciate it immensely. Click on the mug to find out how:


The last time debt to DPI was this low was 1998!
So it only took 7 years to get to out of control “red alert” territory?!
I don’t understand. It’s been in fairly normal territory since 2012. Or are you taking about the drop from the peak (which really only took about 4 years or so)?
Oh, I get it now. You’re talking about the way up to spike. Most of it happened right there on the chart between 2003 and 2008. So 5 years really.
Nice work. Thanks! Seems eerily quiet from the household perspective.
…like preparing for …
Thanksgiving. Then Christmas. Things matter.
Really good news about 40% owning their homes free and clear. Very solid information. It is the best safety prep out there and a sound foundation for retirement.
Now, if the pesky medical debt issue could be addressed as according to every article I have just read on the subject medical debt accounts for 2/3 of all bankruptcies.
But the number of bankruptcies is MINUSCULE. See last chart. So it’s 2/3 of minuscule = nanoscule?
Great report – Lotta good data – Two sides of the balance sheet – YEP.
SO – How did the midterms swing so hard left on campaign rants of “affordability” – Americans have Low debt – Low BKs – Low Foreclosures – Low Collections – Record HIGH hourly pay $38 – Record HIGH median salaries $88,000 – Record LOW poverty – Record LOW child poverty – Record LOW layoffs – Americans are working, shopping, spending, traveling, at RECORD pace.
And how is it a bad thing to FINALLY stop Iran once and for all from having an active nuclear program – preventing them from becoming the N. Korea of the ME and having the weapon to actually live up to 40 years of chanting “Death to America”… And if forever = 8 months with zero “fighting” since July then there really is a tooth fairy and an Easter bunny.
Carry On…
Carry On…
Because most people feel like leave is unaffordable. 75% think the economy is fair or poor.
People feel like life is getting more expensive, and they’re not getting ahead.
It’s not that difficult to understand.
Why are we allowing this complete BS pro maga stuff here? Smh
@ DP Penn,
Good points. I’m still not sure why the election skewed as strongly as it did. But I think the Iran “war” was the main item. Wolf has pointed out that Americans HATE inflation.
I think that hatred is amplified when the inflation is clearly evident in staple items like gasoline, even when household finances are in fine shape overall. And some people (right or wrong) think the Iran situation is directly correlated with gas prices and voted accordingly.
One other item may be that some Americans (regardless of political affiliation) are sick to death of US involvement in the Middle East. And they are equally sick of the US spending enormous amounts of taxpayer dollars in that area when we have more than enough problems to solve right here at home. Like our ballooning national debt.
I read that Gen Zers supported Harris by 4 points, and the Democrats in last week’s election by 50 points. A 46 point swing among younger people shows where the discontent is.
Records mean nothing. If I make 5% more next year, I’m making record money for my lifetime. If everything cost 6% more, then I’m effectively making less.
The people hit hardest by inflation are those in captive labor markets, so small towns or rural areas. They have limited upward pressure on wages while inflation still reaches them. These areas are largely red, and it’s no surprise that they’d be pissed off about inflation and their lives being harder while those up top make out like bandits.
Bingo. It’s human nature that people judge their station in life relative to other people around them. That’s why no struggling American cares if he has it good compared to someone in the third world or compared to what a wealthy American had in 1950.
Because affordability is a serious concern with inflation running hot for years and real earnings lagging inflation for a good part of that. If you cannot see this out there, you are blind. The attitude of this administration is “got mine, eff you”, and that was never going to be popular.
That was the same two years ago, where the previous administration was telling everyone how great things were.
D.P. Penn asks” …How did the midterms swing so hard left on campaign rants ….”
I thought it was a swing hard to the right. Voters were tired of hearing about the corruption and pedos in government. They want to see career criminals behind bars.
Wouldn’t that be a swing in favor of Law and Order ?????
DP Penn,
Definitely get an app for taking your meds and don’t miss.
B/c Rising interest rates mean plenty of people can’t even *afford* to take on debt — they just do with less. (Both in terms of day-to-day spending, and big-ticket financed items like houses). Those that got on the wealth ladder decades ago (housing and stocks-wise) are doing fine. This 100% tracks with what I witness in my own life, as an elder millennial, seeing Boomers all ’round with houses and stacks and stocks, while my cohort and younger have little to none.
But hey, if you want to play this data up, thank Biden! Looks like the numbers firmed up and even got to current levels in some cases over 2021-2024. What good economic mojo we have, Trump seems to have inherited. The data don’t lie!
Thanks to Wolf Rickert he is nearest to Bob Brinker who hosted the nationally syndicated radio show Moneytalk for 32 years, from 1986 to 2018. Brinker pretty well timed the market except for the housing bubble. Fortunately I pulled out just losing 7%. Which allowed us to retire early.
Thanks Wolf for your detail reports it gives confidence and the window we need to keep moving along in this investment jungle.
Thanks for bringing up Bob Brinker, was a big fan of his radio show and news letter.
So Jensen slept with two women and Nvidia stock is down $2 Trillion from where it was just a month ago. That’s what happens when a nerdy guy gets popular with the ladies. $2 Trillion goes poof.
I’m sure many folks on this forum can relate to losing significant wealth as a result of a failed relationship. It’s all relative.
He’s been banging them for a while. $2T goes poof when the powers that be let the rest of us know. The question to ask is who wins and who loses when they tell the rest of us?
What that shows — sleeping with a Chinese spy and sleeping with a direct report — is that part of his brain is missing. That missing part is responsible for judgments. And he can no longer make them. He does just whatever. I wouldn’t be surprised if all kinds of other stuff comes out of the woodwork where he lacked judgment, but company specific stuff, maybe related to circular financing or stuff we haven’t even thought about.
Perhaps this Tiger Woods moment is the prick the AI bubble needs to pop.
In my mind I compared this to the fall of Tiger as well.
He is out. Gone. Kaput. Toast. etc..
This stuff had to be known by the boar. Weak board of directors imho. Musk has one toooooo. This is kind of what happened to the republicans they exercised almost no oversight of the executive branch. Had they done there job maybe they would not have been swept out…..moral of the story history will repeat itself.
These tech bros were strutting around like gods the past few years, arrogant beyond belief. He probably thought he could get away with anything.
Correct…. hubris!
Did you see that they ordered every dish at that restaurant?!
That’s just excess
The man cannot be trusted!
/s haha
I see nothing but green lights in these data.
With so many people locking in low interest rates for mortgages and the housing market in a standstill, the biggest cost for families isn’t increasing for most. So, income increases even with inflation give a lot of wiggle room for these people.
Insurance, taxes, health care, child care are still unaffordable for many.
If American households are in such good financial condition, why are housing prices weakening in so many markets?
Well, “Total Household Debt” includes mortgages and if less young people are taking out mortgages a good chunk of debt disappears and debt to income calcs loo0k much better.
They’re in good condition largely because they have historically low housing costs. Either own outright or have a sub-3% mortgage.
Housing prices are falling because those historically low housing costs make it difficult to justify changing houses and resetting to today’s carrying costs.
Because prices exploded by 60% and more in just two years through mid-2022 on top of already high prices in those markets, and a price explosion like that gets unwound. Just because you’re doing well doesn’t mean you’re willing to $100,000 for a Toyota Corolla. To sell lots of Corollas, the price has to be right. Toyota figured that out. Current homeowners that want to sell are very slowly and reluctantly coming to grips with that.
Really ?
No, just kidding.
I work with lots of young people. They see the shameless grift and greed in the open with this administration. They also see no path to the American dream regarding affordability of those standard measures older folks like me have attained. It is the direction of the future that counts. “They are getting filthy rich, and I got no chance”. It’s very simple
As far as the Iran war, “the end does not justify the means”. A botched job, still undone, more lies coming.
Boomers were abjectly poor by today’s measures when they were young. Unless you’re born with a silver spoon in your mouth, you’re essentially poor when you start out, and as you get older hopefully your income and assets are rising. Many boomers are still poor, some live on the streets, many have minuscule retirements…
Many younger people are up to their gills in cryptos, prediction markets, options trading, meme stock trading, and all kinds of other forms of gambling. they have money to do this stuff. Quite a few of them also have very high incomes, including stock compensation. Young multi-millionaires and billionaires are being created even as we speak.
They definitely have a chance, just gotta work hard and stay out of major debt, save. Live below their means. They should be taught that in school and parents should teach their kids that.
Real gDp rose 3.4% in the 3rd. qtr. Atlanta GDPnow latest reading is 3.5%. The economy continues to show strength in spite of higher inflation.
All numbers come from the government. Under prior administrations the numbers were vaguely credible as “independent”. Any “independence” has been fired and the numbers no longer come close to matching what people “feel”
This data is private sector data, zero to do with the government. RTGDFA.
The recent election has shown us that the American people feel the cost of living is too high despite what Wolf’s charts proffer.
My gut tells me to be afraid, as the new party is not going to measurably lower costs but instead is offering subsidies for health care, housing, and childcare…
I may have missed it, but all this will do is provide some relief now, but place the burden of paying for the lower costs on future generations.
It seems the new boss is the same as the old boss.
Yeah, the black pill – if you will – is that they will do nothing or likely make it worse. There are no adults in the room. American government is dysfunctional and neither party has any intention of fixing the many problems, nor would they have a clue how to.
You people keep looking in the wrong corner for problems. Households, despite having been pissed off about everything for a while, are fine in terms of their debts. What is not fine is business and government debts.
Wolf has the correct thinking on the conditions. Inflation is making it possible to begin reducing the 40T debt all are worried about. Conditions have made it possible for someone like me to gradually crawl up the scale. Like some of you I’m invested not only in the market but into cash CD’s and the like. This isn’i money available to big investors who run our economy, but to workers striving to make ends meet. They also need help as we all move along.
Wolf being a prude and a old Marine, I’m one who doesn’t appreciate the RTGDFA comment, even if it is correct as used. Bad lanquage has crept into all sections of life an will continuely push use downhill.
Just my two cents!
I should just delete those comments and block those commenters forever. I’ve been thinking about it. If people cannot force themselves to read the article, they should not post stupid BS about the article. Commenting Guidelines #1. I should switch to “first violation and you’re out forever.” But instead, I’m kid-gloving them with the RTGDFA to teach them how to do this here, but that’s a lost cause.
Separate topic……….I donated to Wolf Street…..check is in the mail…..enough for a mug………
………to Wolf……..thanks for your analyses and presentation….good luck
Thank you!
‘I guess the sky is not falling. There was a movement ’17-’19 everybody doing the snowball. Quite a few people have their house paid off.
I’m just going out on a limb here, but is there any evidence that delinquencies have decreased simply because of unwillingness to collect on them? Would inflation be lower if bad debts were more aggressively consolidated?
Maybe this is the wrong thread to be posting this on, because I agree with the sentiment and the data doesn’t lie, but could the banking system is a whole benefit from simply letting debt slide? Have we shifted from collecting on household debt due to tighter lending standards and pushed everything to Afterpay? Wouldn’t that minimize how much debt could even be potentially accumulated by most?
Thanks Wolf. Great stuff as usual, I hope someone is paying you.
Wolf,
I am dumbfounded. I was doing a little research, taking bits of info from your website and others, and came back to this article for the second time. Your chart at the top shows total household debt has gone from about $7 Trillion in 2003 to $19 Trillion today, a 2.7x increase. Your next chart shows total household debt as a percentage of total disposable income, and showing that it has decreased from about 87% to about 79%. Is this even possible, especially after household debt has increased 2.7x❓❓
I DID go back and make sure to read your article – you mention some good points, including the fact that consumers were way over leveraged back then. You also say that total household income has risen. The other point you list do not reflect disposable income (home equity, for example).
Color me skeptical – I just cannot believe that total household debt has increased 2.7 fold, but total debt as a percentage of disposable income has fallen.
I ask this respectfully – is there a logical or rational explanation for this? It’s just seems so illogical, I can’t wrap my bead around this one. Please explain.
Just basic math:
Since 2003, disposable income has soared by 192%, on population growth, job growth, and income growth per household.
over the same period, total household debt has increased by 164%. So since 2003, the burden has dropped.
Since 2008, the debt has increased 51% and disposable income has soared by 126%. So the burden has plunged.