
In another 35 bigger cities, condo prices dropped by 8-14%. How the mind-blowing Condo Bubbles deflate in 34 charts.
By Wolf Richter for WOLF STREET.
Condos are subject to different dynamics than single-family homes – dynamics that fueled eye-watering bubbles in specific markets through mid-2022 where prices exploded in two years by 50%, 60%, or even 70% in some cities, on top of already high and soaring prices from the prior years. In the 10 years to their respective peaks, prices had soared by 180% to 350% in these markets. And those bubbles have started to deflate, in some markets brutally.
Prices of mid-tier condos through August have dropped by 15% to 34% from their respective peaks in 34 bigger markets, depicted in the 34 charts below. The vast majority of the peaks occurred in mid-2022. A few occurred in 2023 and 2024. These peaks topped off one of the most impressive price explosions in US condo history, and those bubbles broke under their own weight.
In 9 of these 34 markets – from Oakland via Austin to Jacksonville – prices of mid-tier condos dropped by 21% to 34%, including 3 markets with 30%-plus drops.
Further price deterioration in Glendale, AZ, brought the price decline from mid-2022 through August to 15%, and it was added to the list. In July, Houston, TX, and Tempe, AZ, were added to the list. No market came off the list in August.
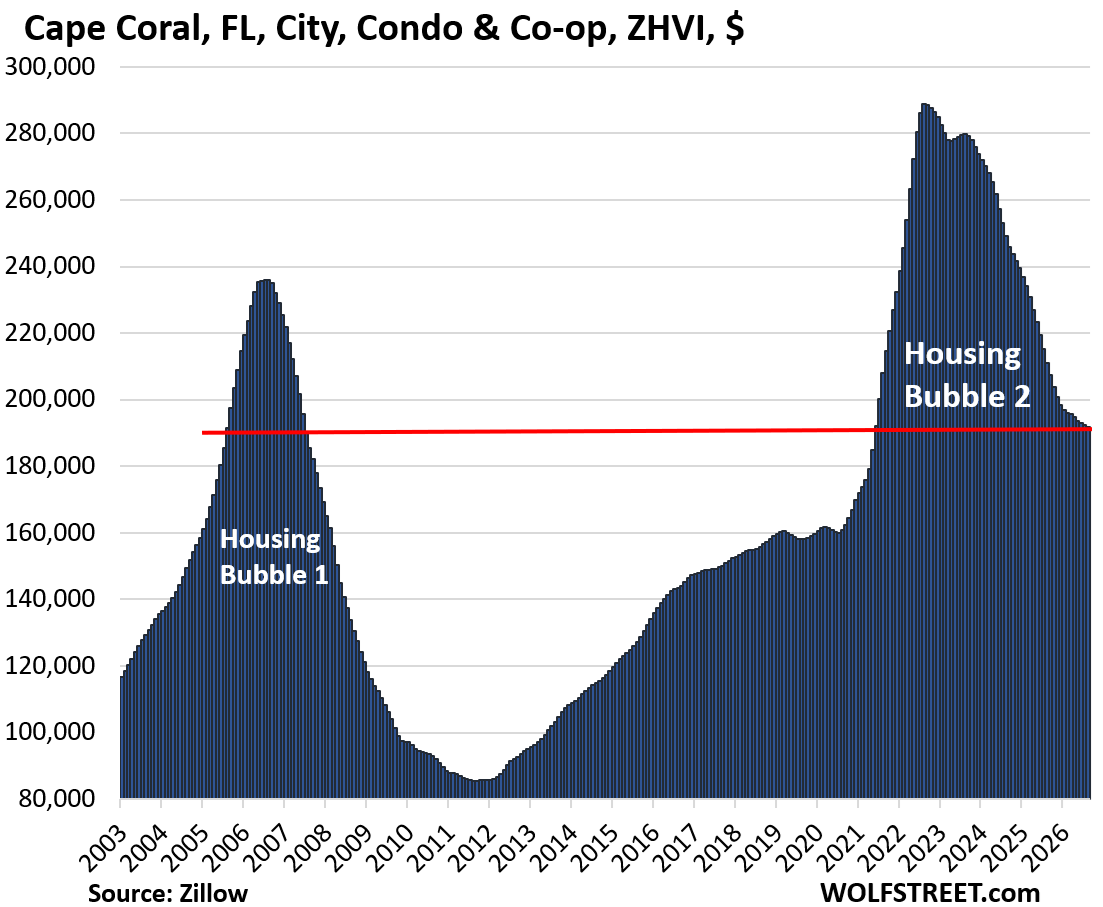
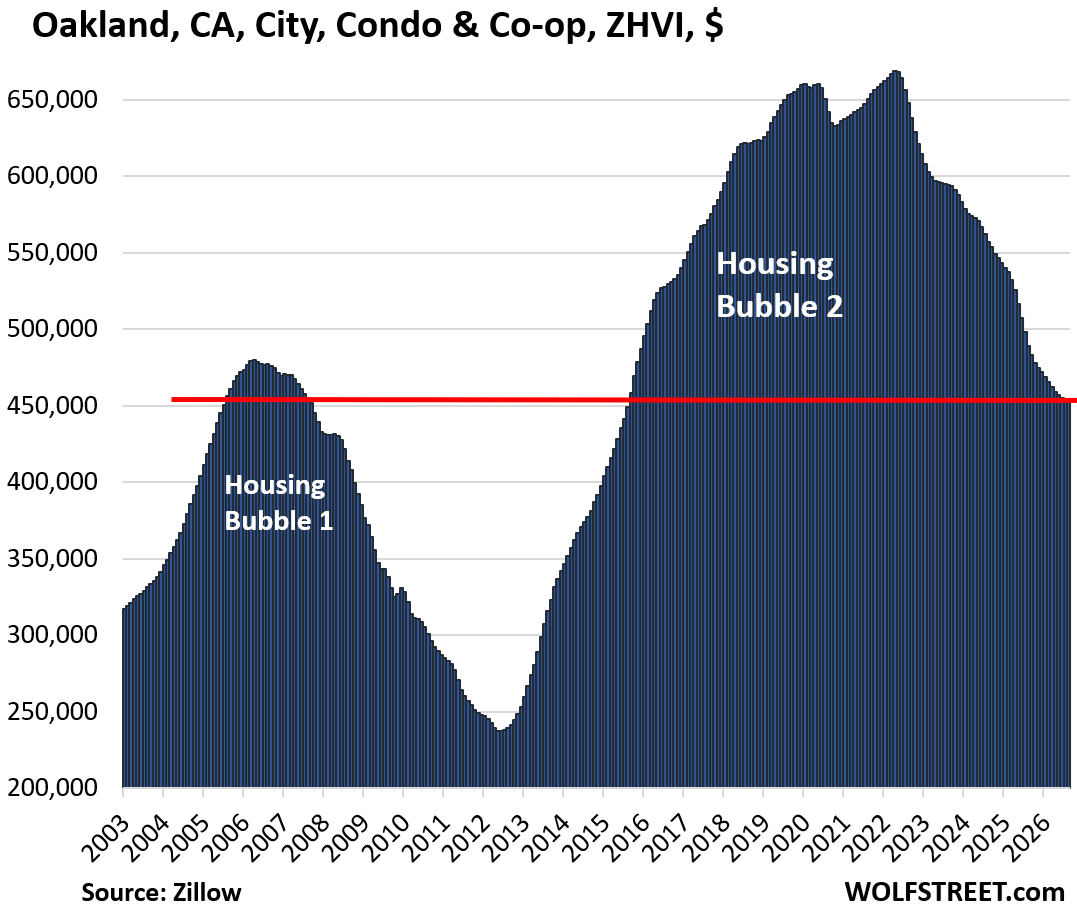
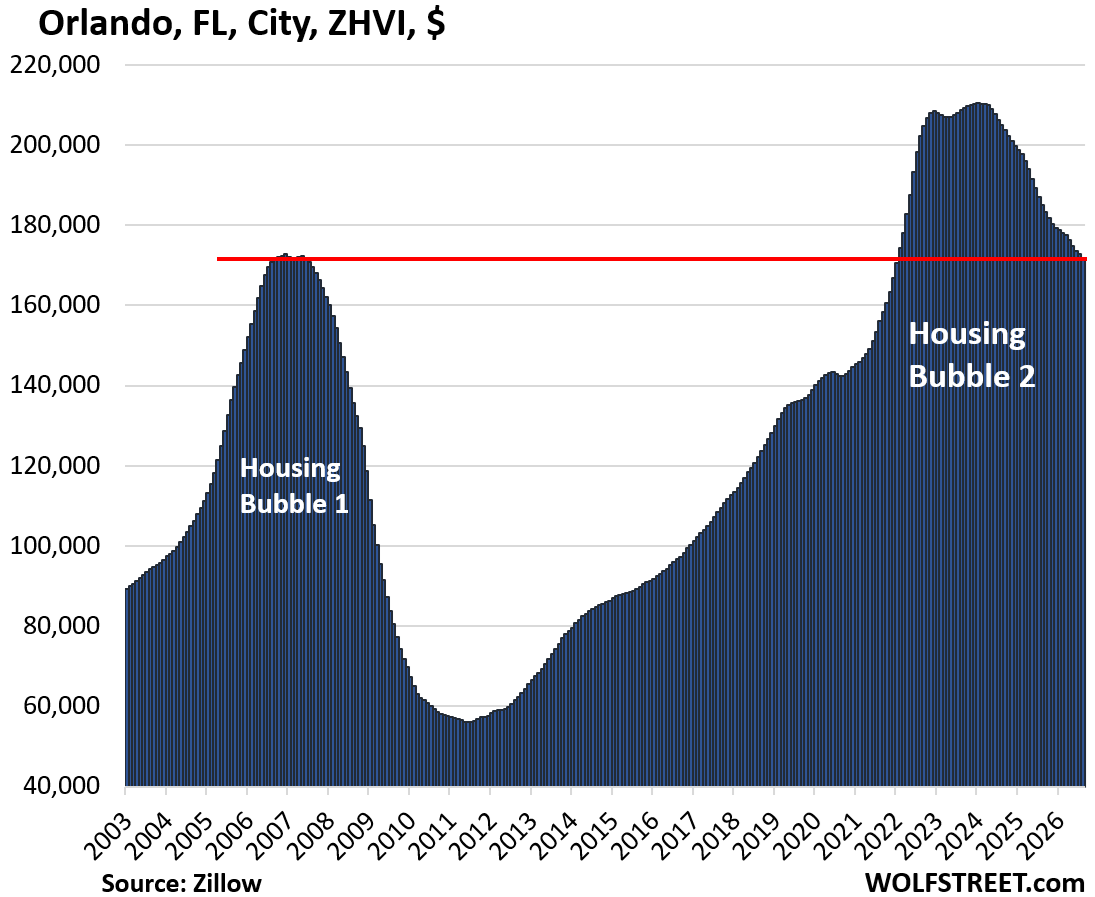
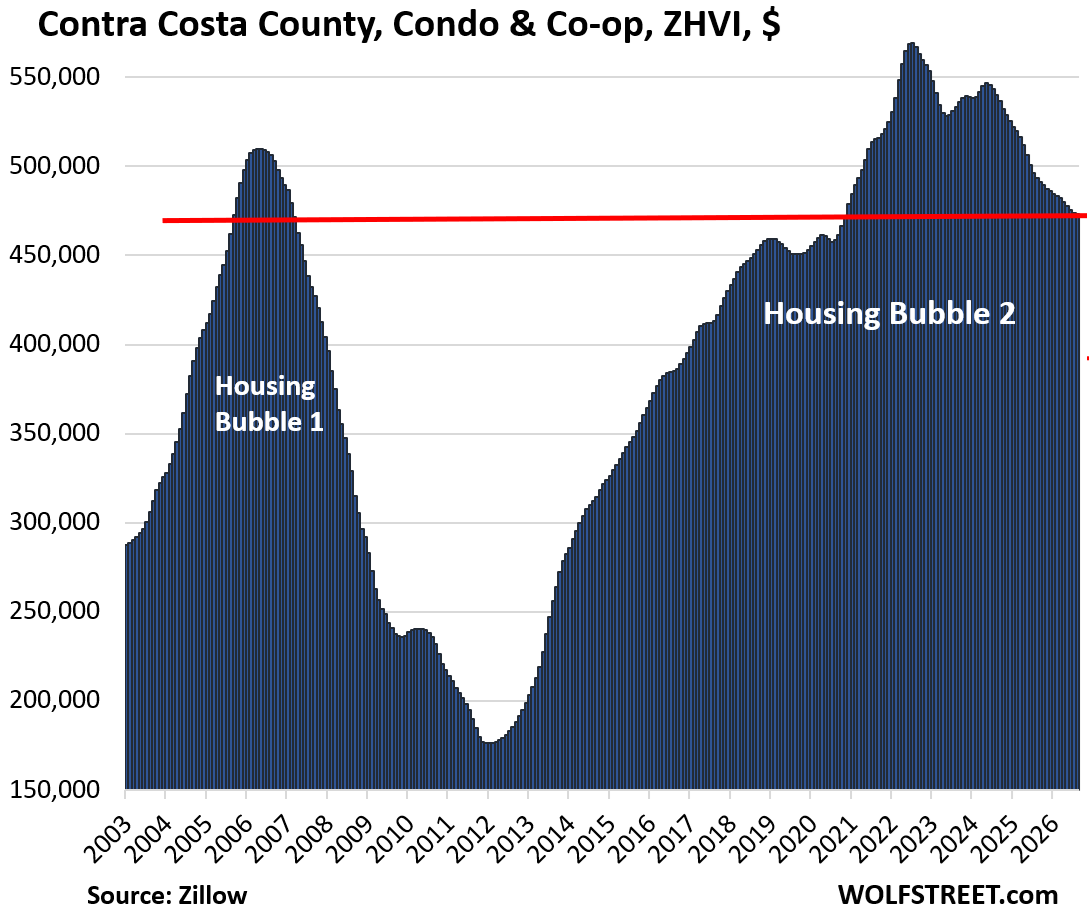
Below 2006 levels: In 6 of these 34 markets, condo prices have plunged below their highs during Housing Bubble 1 in 2006. Prices in those markets are now back where they’d been 20 years ago.
- Cape Coral, FL;
- Oakland, CA;
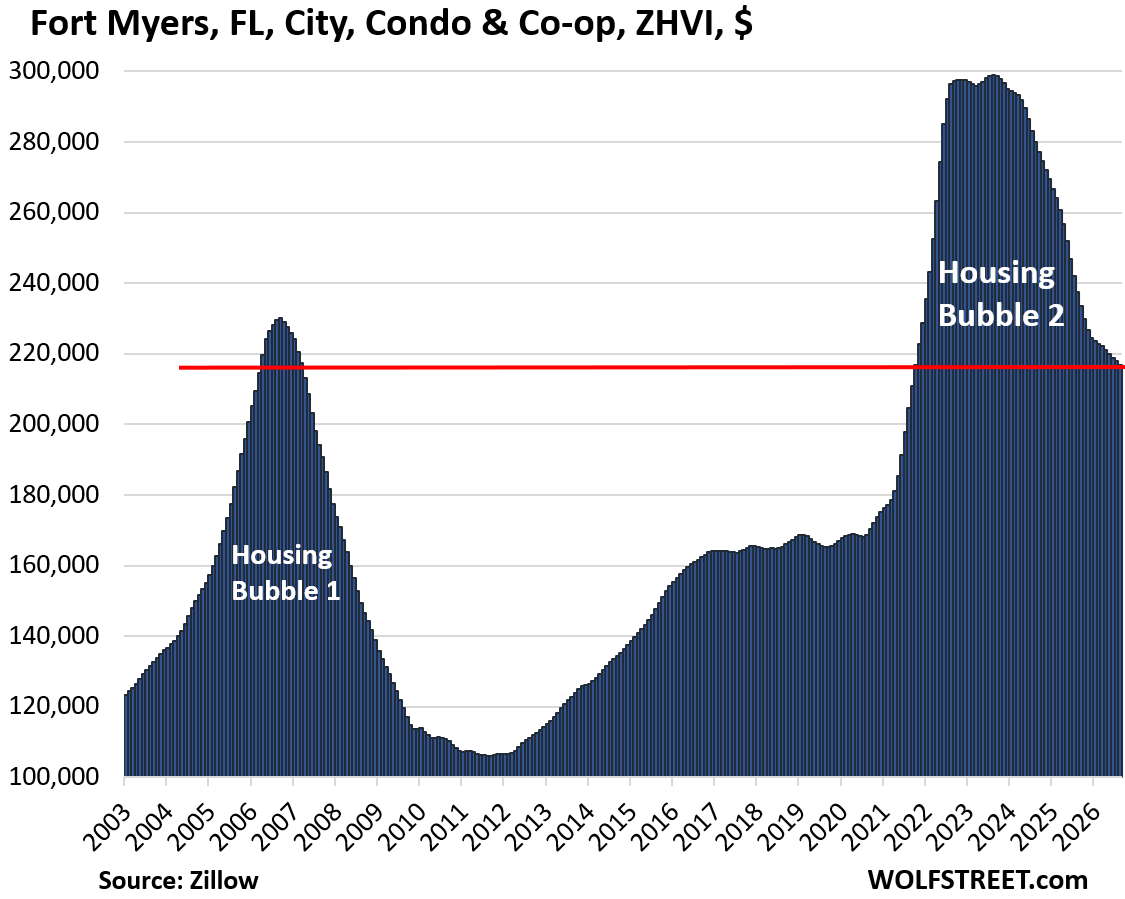
- Fort Myers, FL;
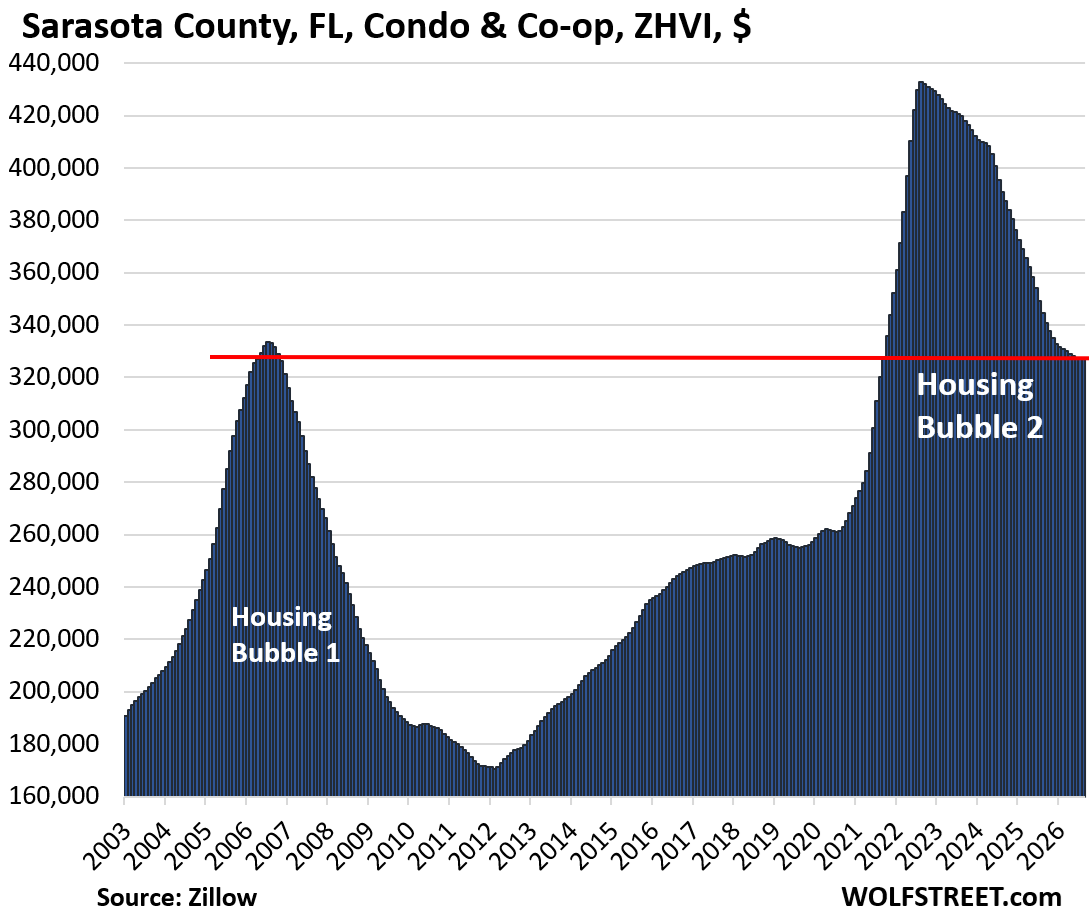
- Sarasota County, FL;
- Orlando, FL;
- Contra Costa County (San Francisco Bay Area), CA.
Most of the markets here are “cities.” But several are counties whose numerous cities – though often household names – are too small to be included individually. The list includes one metropolitan statistical area for the same reasons. New York County is also included, which is Manhattan where condos are a huge part of the market.
In some densely populated big cities, condos and co-ops make up a big part or the majority of home sales. In most other markets, condos are a relatively small portion of home sales.
These 34 condo markets are depicted in 34 charts below.
| Condo Market | Since peak | Year of peak | |
| 1 | Cape Coral, FL | -34% | 2022 |
| 2 | Oakland, CA | -32% | 2022 |
| 3 | St. Petersburg, FL | -30% | 2022 |
| 4 | Austin, TX | -28% | 2022 |
| 5 | Fort Myers, FL | -27% | 2023 |
| 6 | Sarasota County, FL | -24% | 2022 |
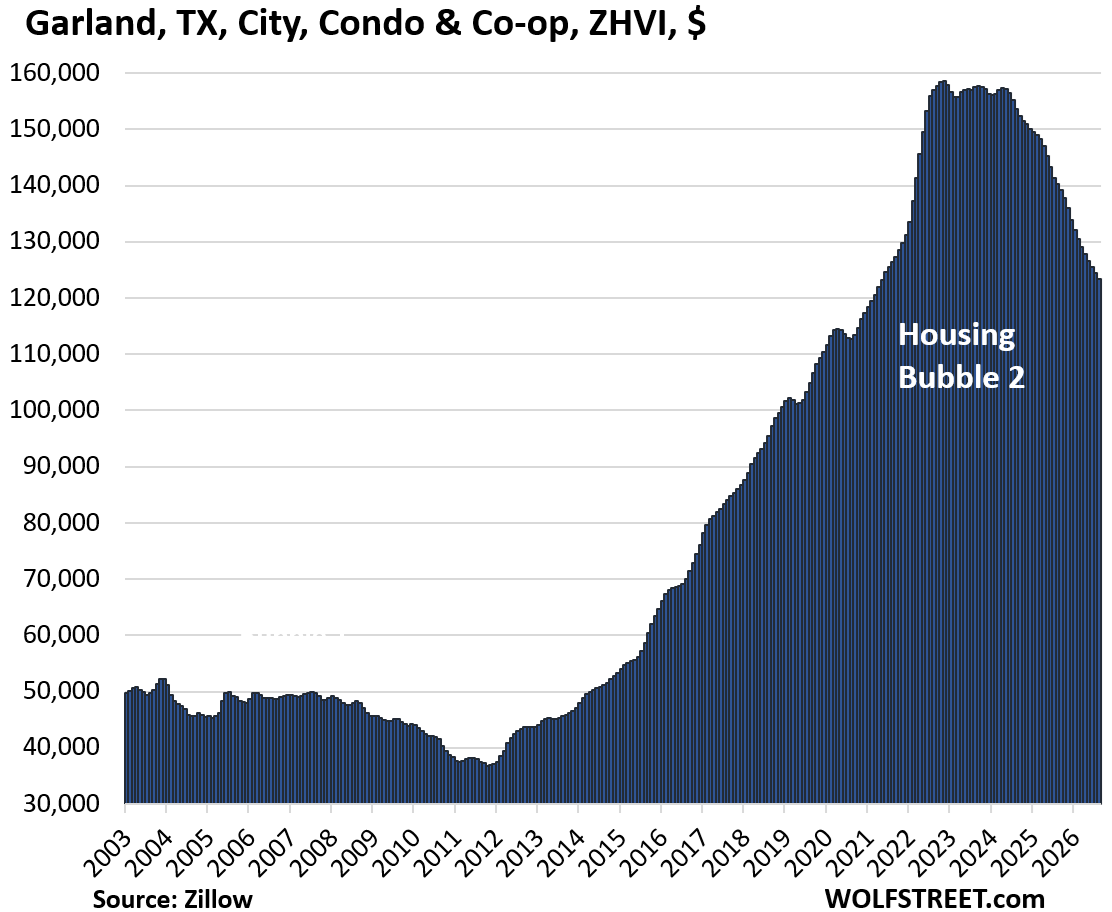
| 7 | Garland, TX | -22% | 2022 |
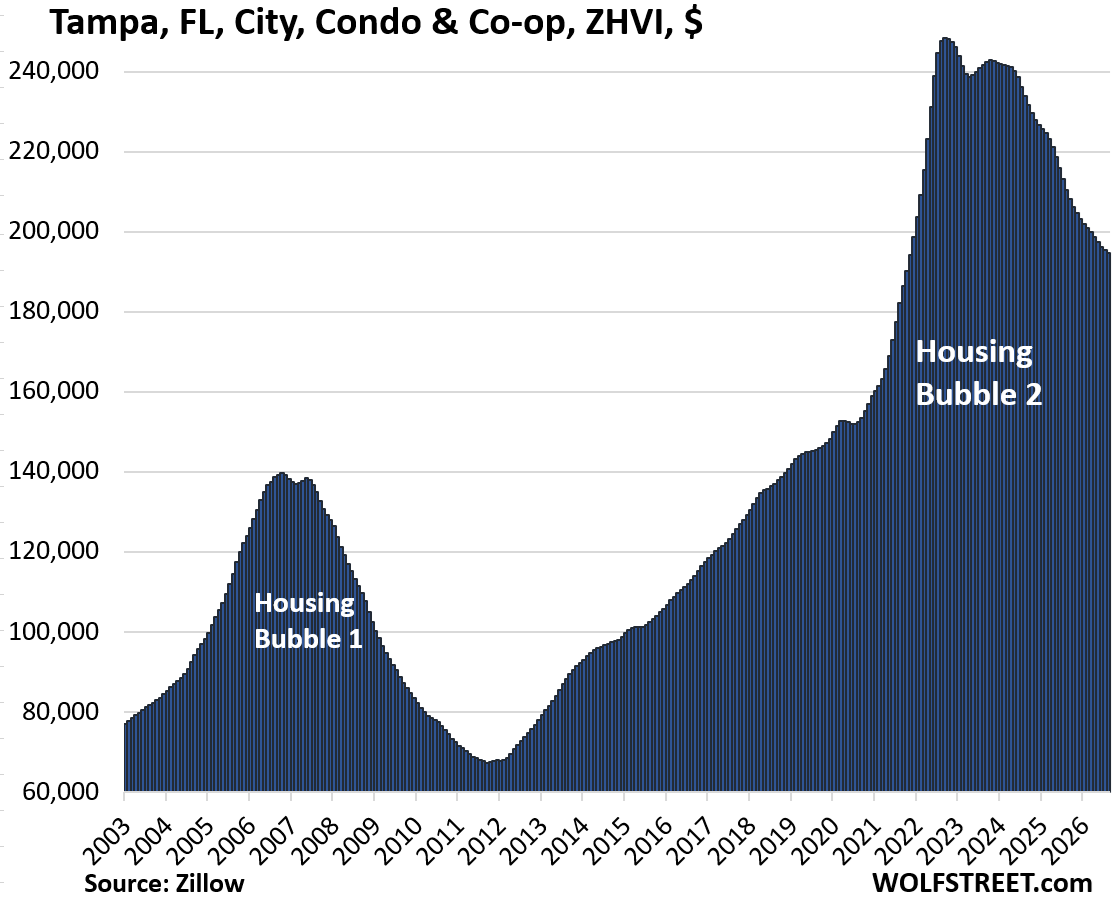
| 8 | Tampa, FL | -22% | 2022 |
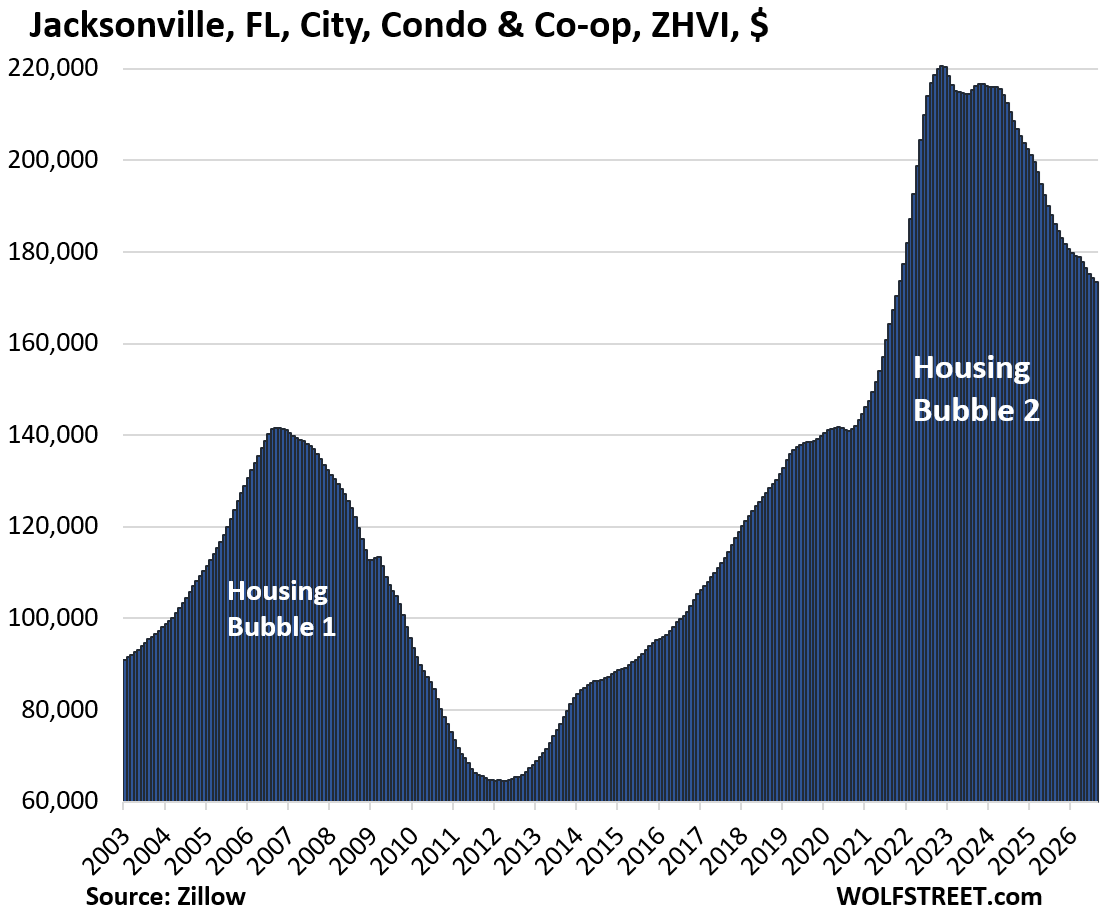
| 9 | Jacksonville, FL | -21% | 2022 |
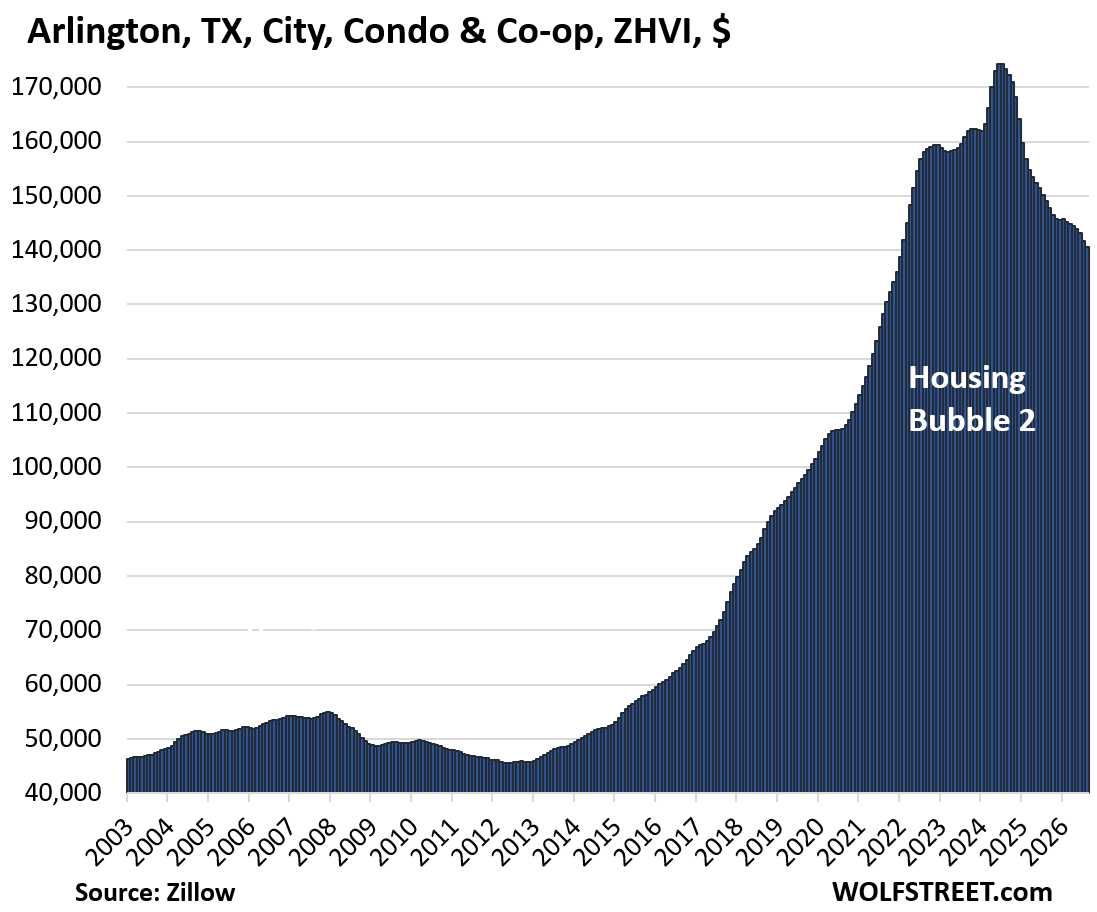
| 10 | Arlington, TX | -19% | 2024 |
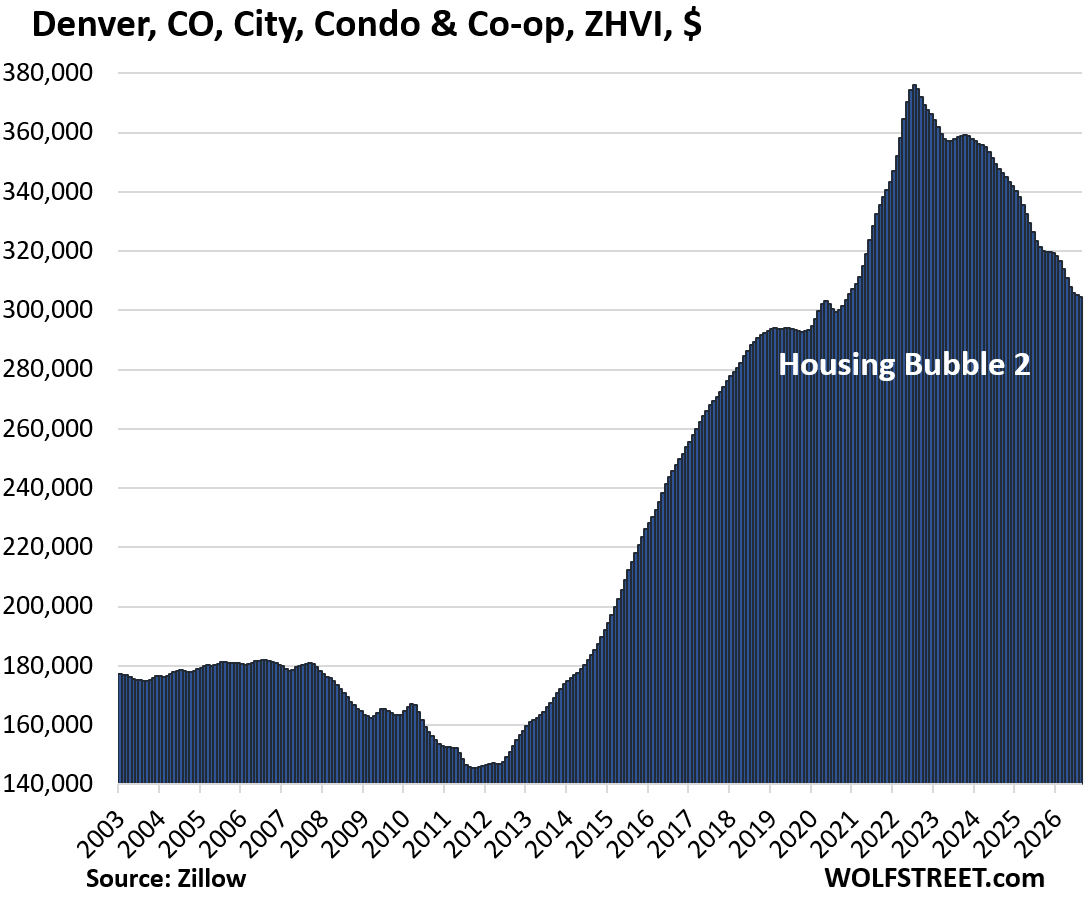
| 11 | Denver, CO | -19% | 2022 |
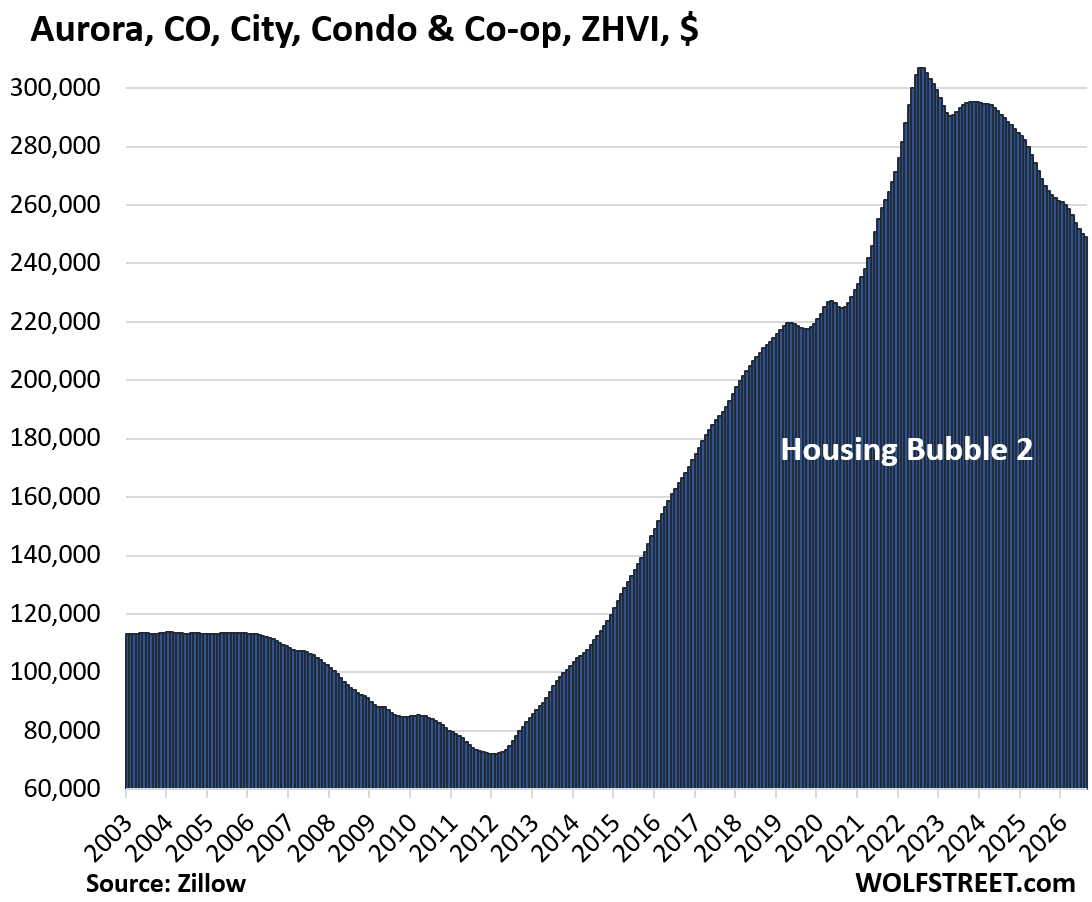
| 12 | Aurora, CO | -19% | 2022 |
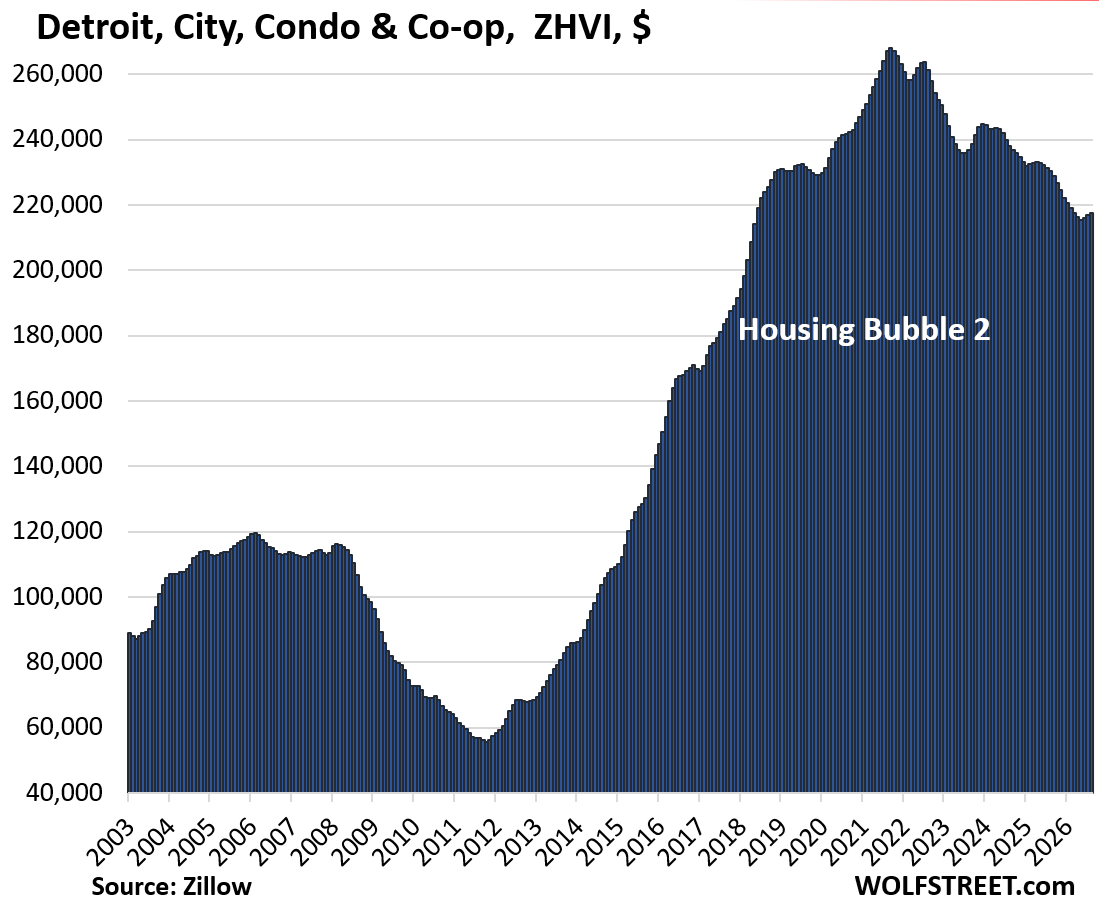
| 13 | Detroit, MI | -19% | 2021 |
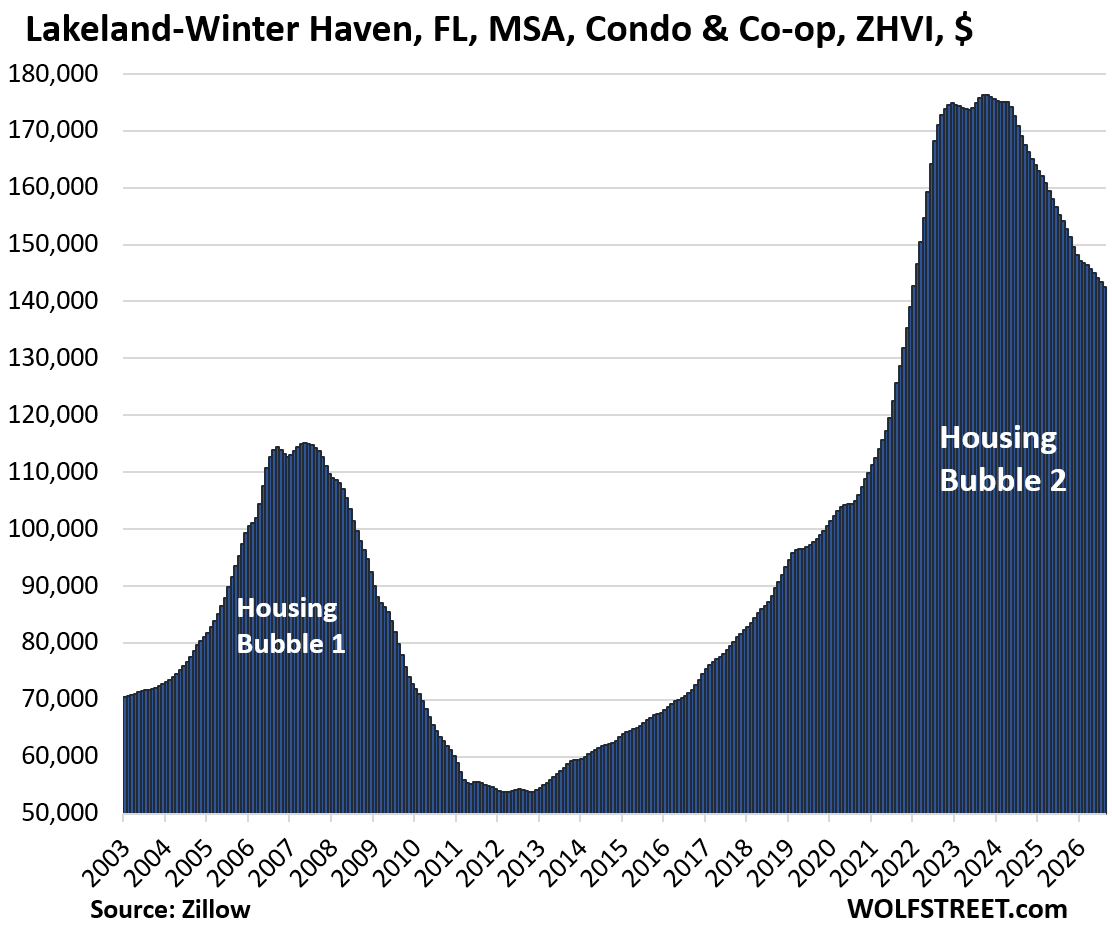
| 14 | Lakeland-Winter Haven, metro, FL | -19% | 2023 |
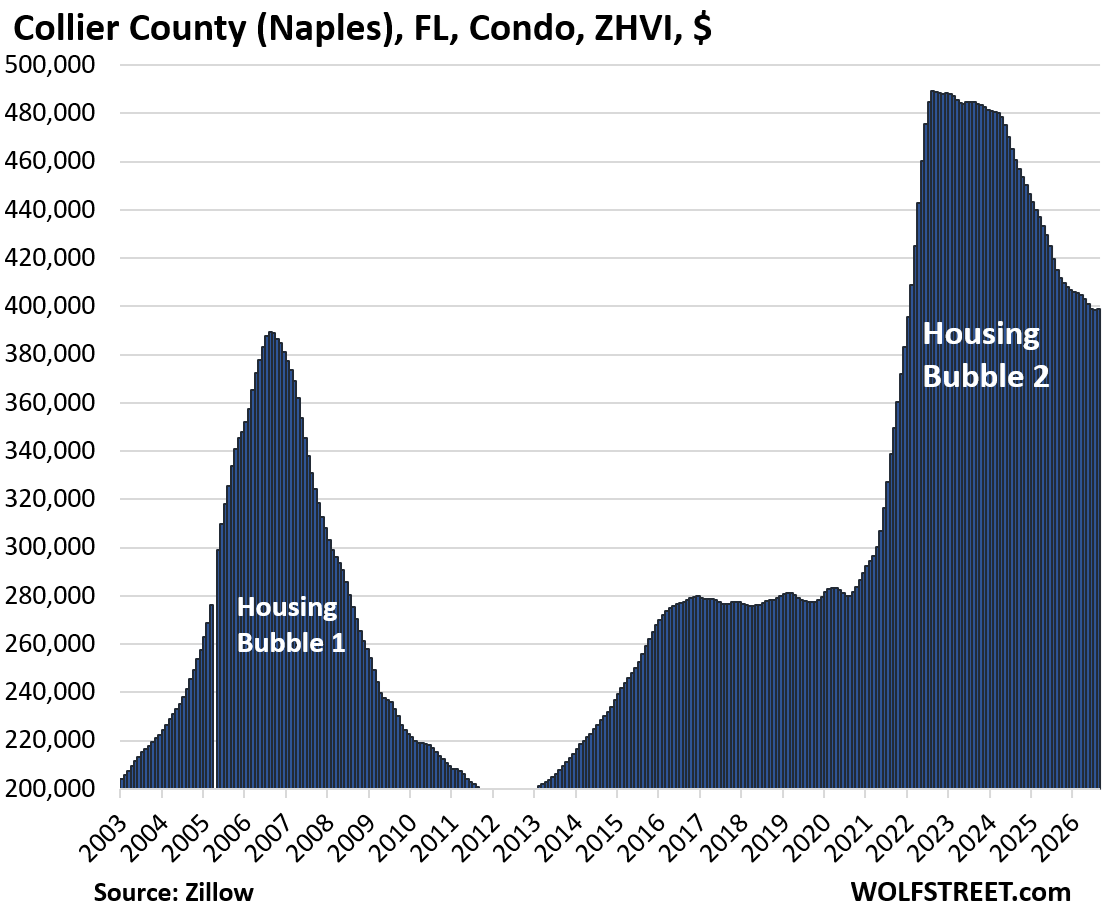
| 15 | Collier County (Naples), FL | -18% | 2022 |
| 16 | Orlando, FL | -18% | 2024 |
| 17 | Seattle, WA | -18% | 2022 |
| 18 | Hayward, CA | -17% | 2022 |
| 19 | Raleigh, NC | -17% | 2022 |
| 20 | Plano, TX | -17% | 2022 |
| 21 | Manhattan, NY (New York County) | -17% | 2022 |
| 22 | Contra Costa County, CA | -17% | 2022 |
| 23 | Port Saint Lucie, FL | -17% | 2024 |
| 24 | Mesa, AZ | -17% | 2022 |
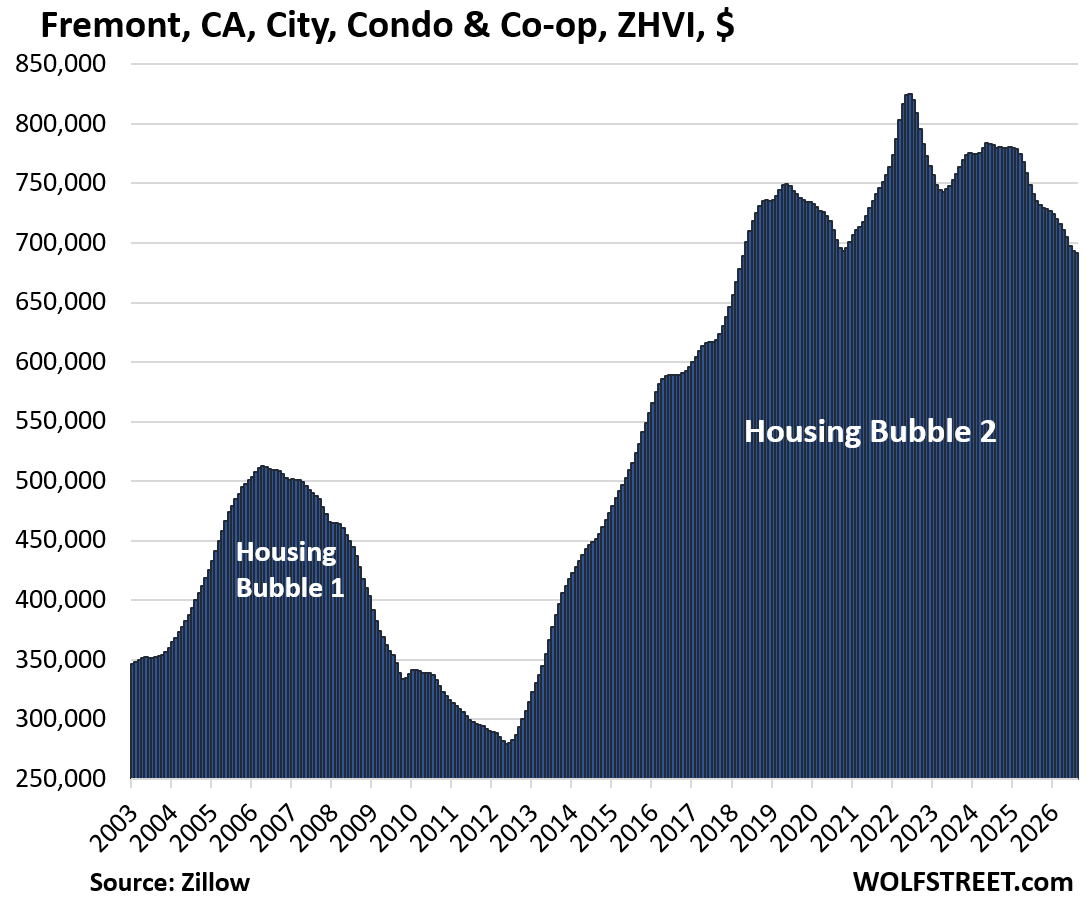
| 25 | Fremont, CA | -16% | 2022 |
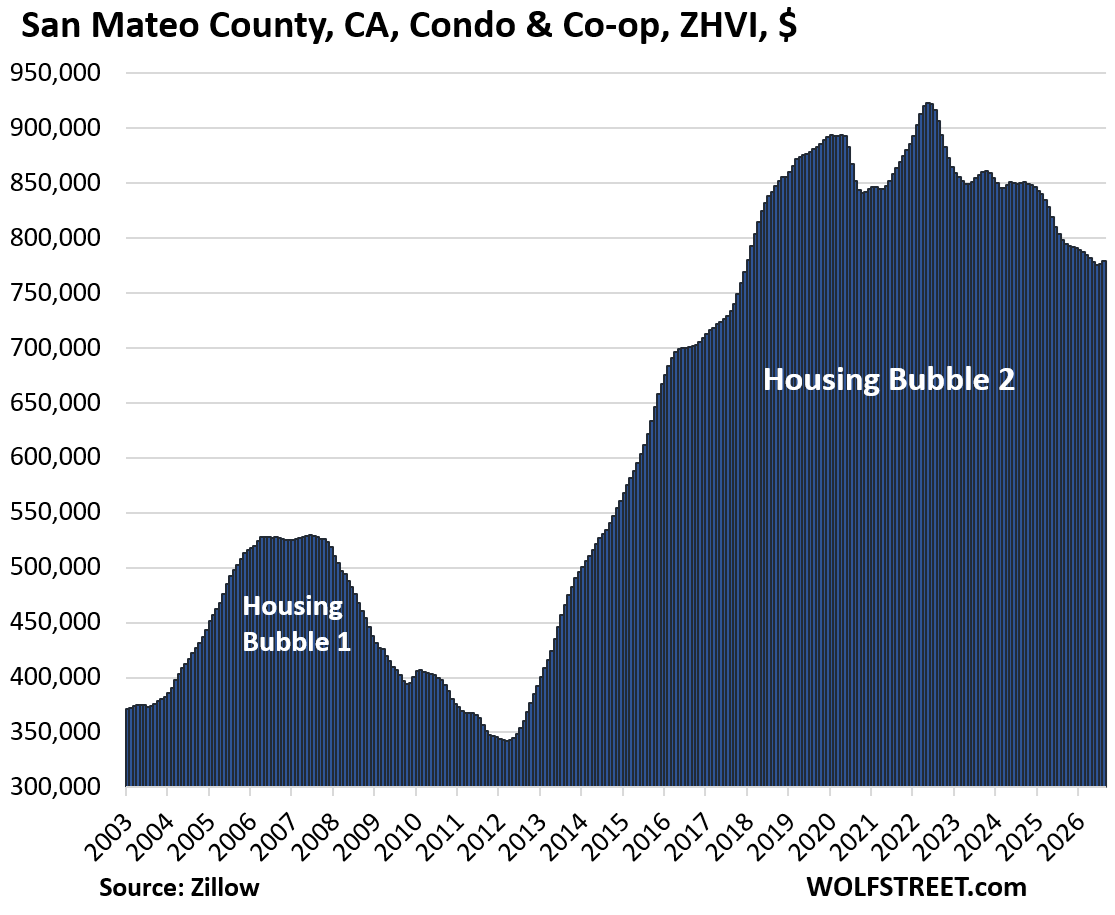
| 26 | San Mateo County (northern Silicon Valley), CA | -16% | 2022 |
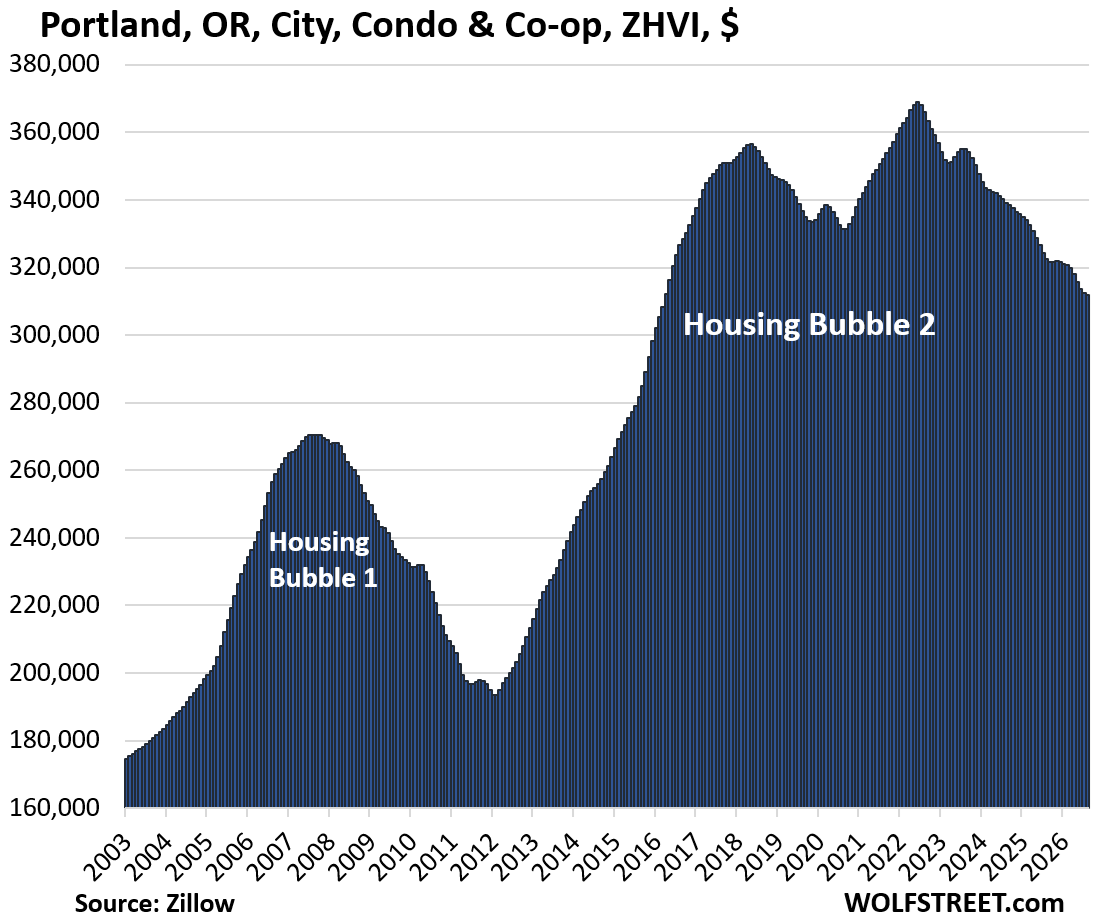
| 27 | Portland, OR | -16% | 2022 |
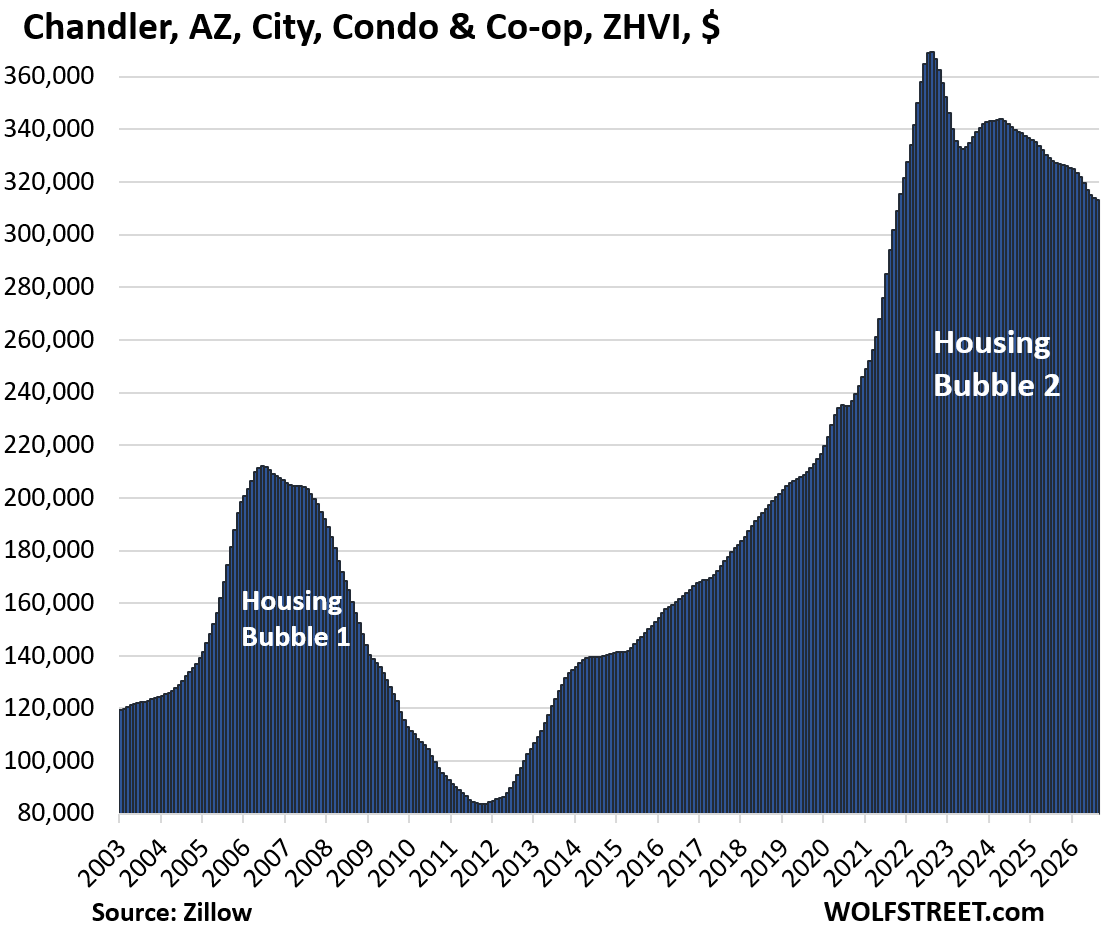
| 28 | Chandler, AZ | -15% | 2022 |
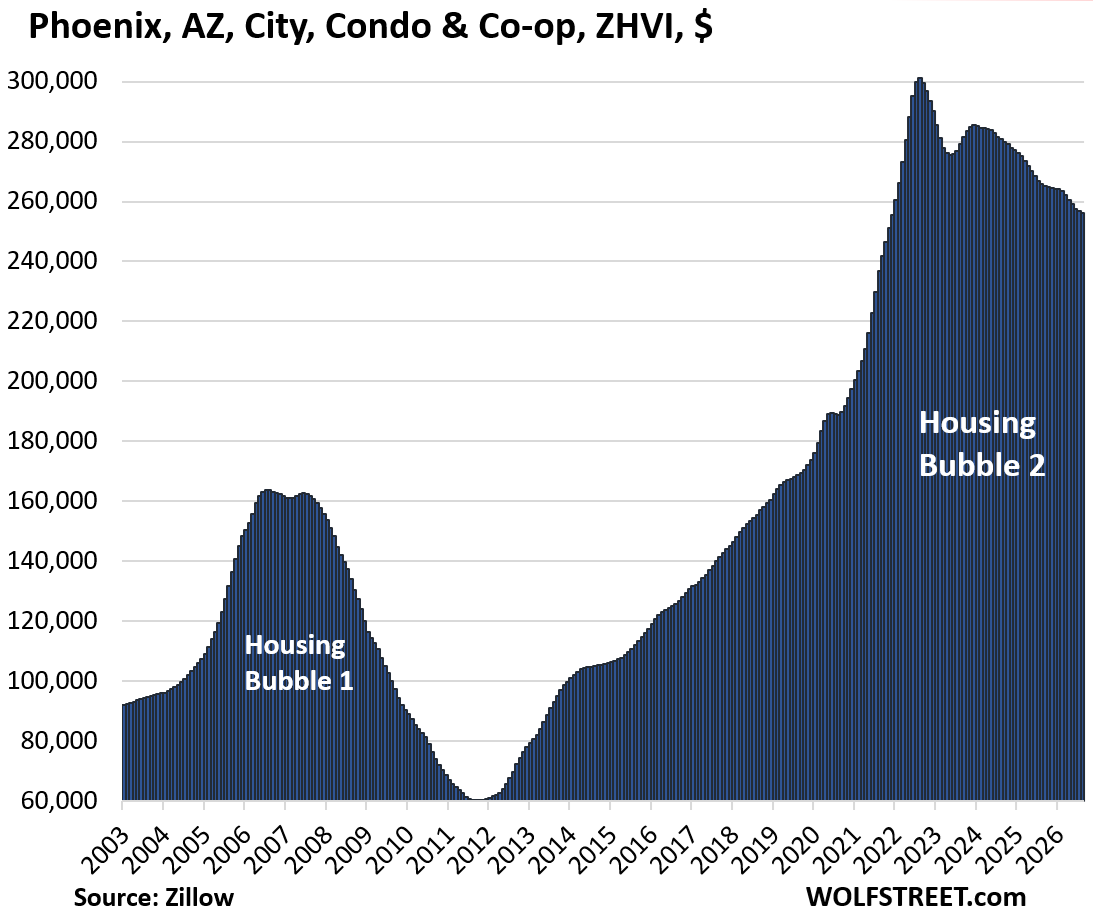
| 29 | Phoenix, AZ | -15% | 2022 |
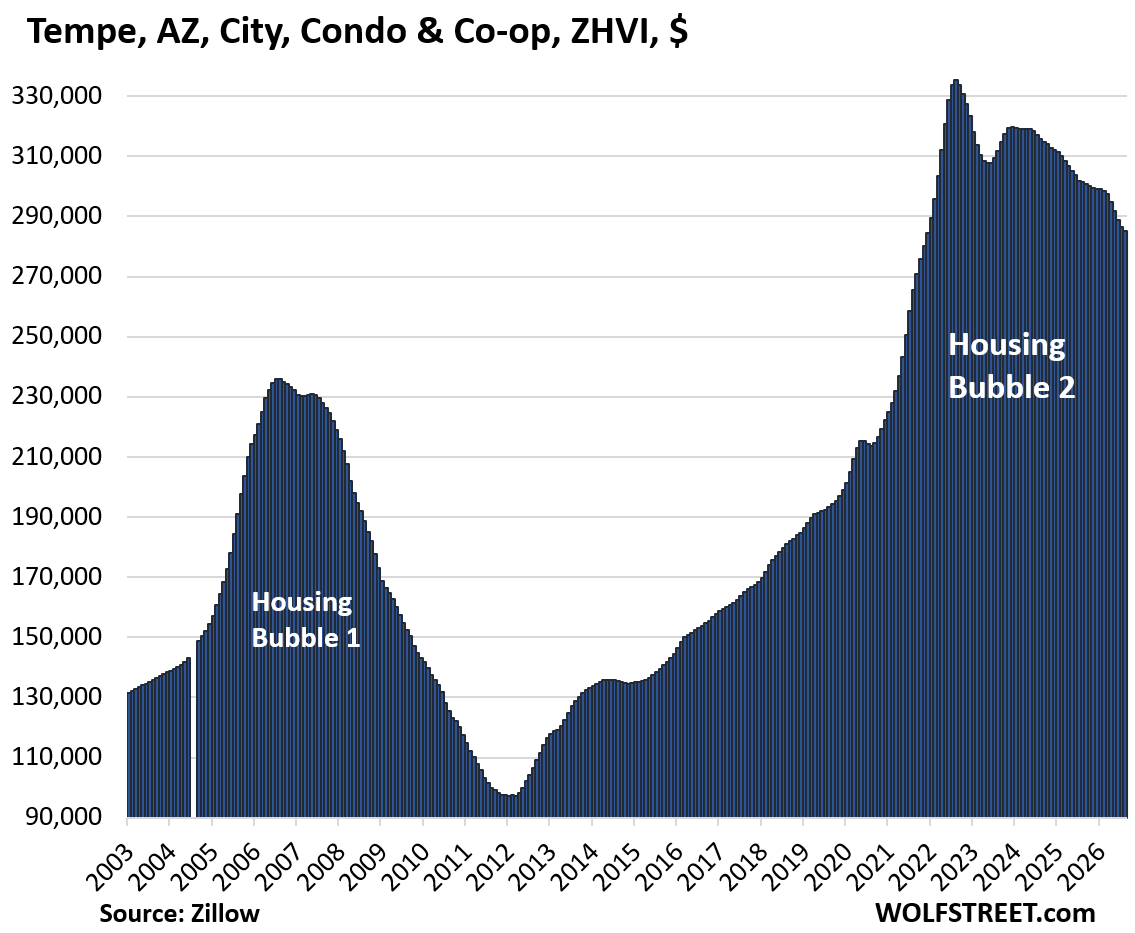
| 30 | Tempe, AZ | -15% | 2022 |
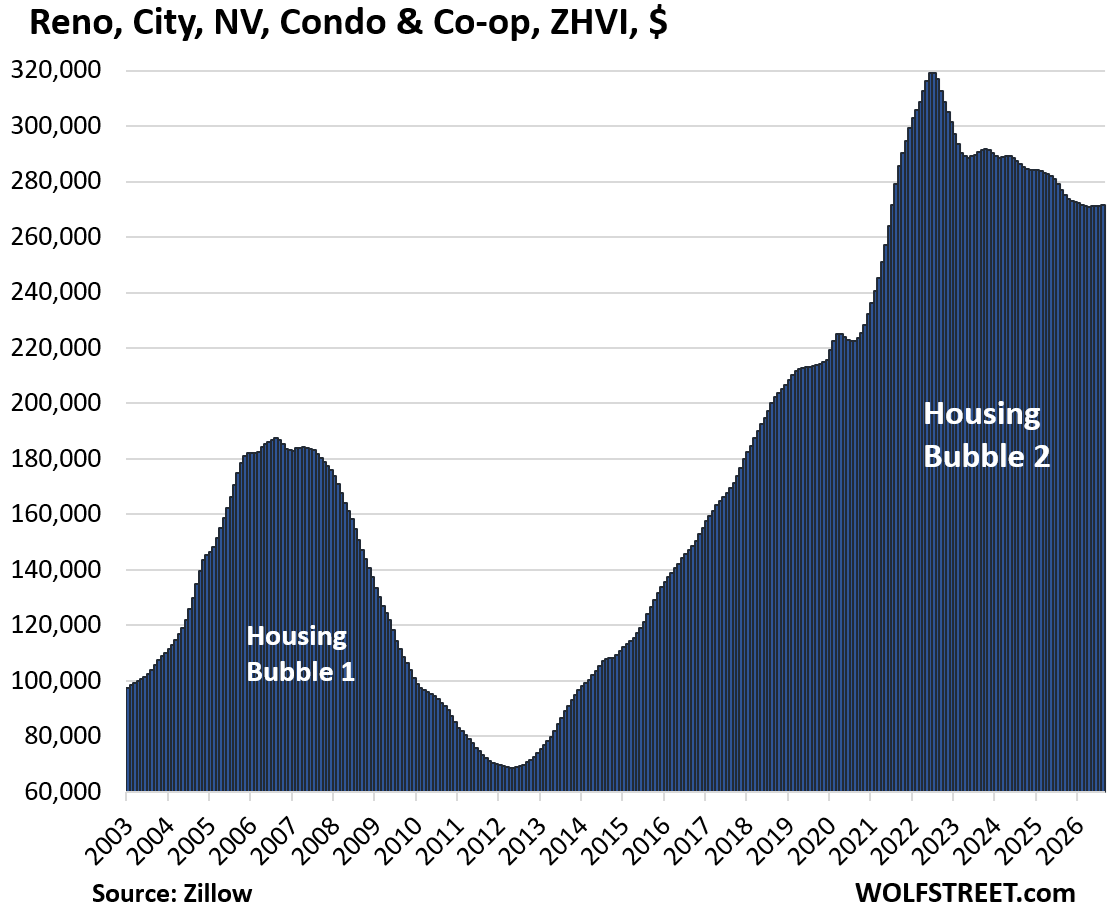
| 31 | Reno, NV | -15% | 2022 |
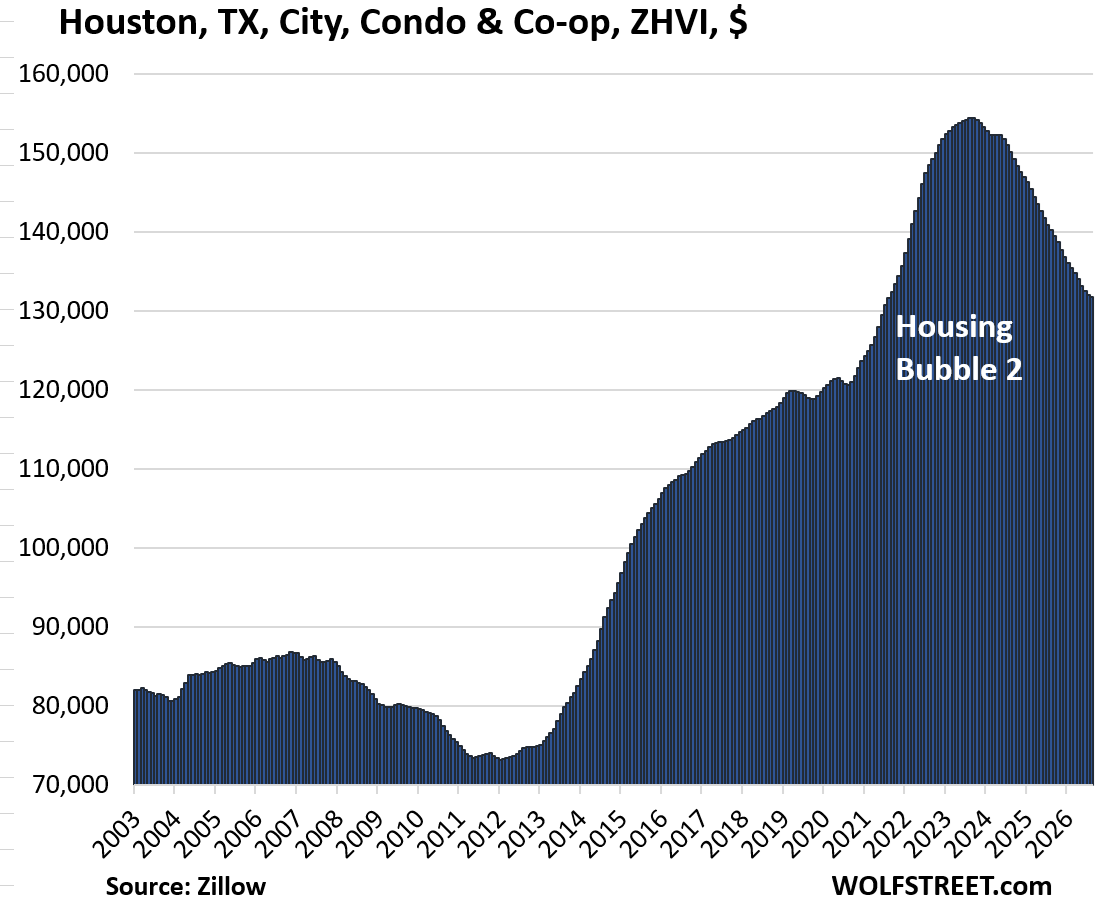
| 32 | Houston, TX | -15% | 2024 |
| 33 | Boise, ID | -15% | 2022 |
| 34 | Glendale, AZ | -15% | 2022 |
Cities that didn’t make the 15% cutoff.
The cities of Dallas, TX, Irving, TX, Sacramento, CA, Huntsville, AL, and San Antonio, TX, are only a few bad months away from getting on the list.
They are part of the 35 bigger cities where condo prices have dropped by 8% to 14%. These 35 cities don’t have their own charts here – just the list below.
San Francisco, the epicenter of the AI investment boom, where home prices are now re-exploding, came off this list in August, but condo prices were still down by 7% from their peak in 2022.
In many smaller markets, condo prices have dropped as much or more, but they are not included here because the markets are too small.
| Condo Market | Since peak | Year of peak | |
| 1 | Dallas, TX | -14% | 2023 |
| 2 | Irving, TX | -14% | 2023 |
| 3 | San Antonio, TX | -14% | 2024 |
| 4 | Huntsville, AL | -14% | 2022 |
| 5 | Sacramento, CA | -14% | 2022 |
| 6 | Queens, NY | -14% | 2022 |
| 7 | Colorado Springs, CO | -14% | 2022 |
| 8 | Scottsdale, AZ | -13% | 2022 |
| 9 | Stockton, CA | -13% | 2022 |
| 10 | Modesto, CA | -13% | 2022 |
| 11 | Las Vegas, NV | -13% | 2022 |
| 12 | Corpus Christi, TX | -13% | 2023 |
| 13 | Henderson, NV | -12% | 2022 |
| 14 | Fort Lauderdale, FL | -12% | 2022 |
| 15 | Spokane, WA | -11% | 2022 |
| 16 | Elk Grove, CA | -11% | 2022 |
| 17 | Atlanta, GA | -11% | 2023 |
| 18 | Nashville, TN | -10% | 2022 |
| 19 | Washington, DC | -10% | 2022 |
| 20 | Minneapolis, MN | -9% | 2021 |
| 21 | Salt Lake City, UT | -9% | 2022 |
| 22 | Los Angeles, CA | -9% | 2022 |
| 23 | Memphis, TN | -9% | 2024 |
| 24 | San Diego, CA | -9% | 2023 |
| 25 | Tucson, AZ | -9% | 2023 |
| 26 | New Orleans | -9% | 2022 |
| 27 | Fort Worth, TX | -9% | 2024 |
| 28 | Wilmington, NC | -9% | 2022 |
| 29 | Marietta GA | -9% | 2024 |
| 30 | Long Beach, CA | -8% | 2023 |
| 31 | San Jose, CA | -8% | 2022 |
| 32 | St. Louis, MO | -8% | 2023 |
| 33 | Lubbock, TX | -8% | 2022 |
| 34 | Oklahoma City, OK | -8% | 2023 |
| 35 | Miami, FL | -8% | 2023 |
Methodology and data: These prices here are seasonally adjusted three-month averages of “mid-tier” condos and co-ops from the Zillow Home Value Index (ZHVI), which is backward-looking index, based on millions of data points in Zillow’s “Database of All Homes,” including from public records (tax data), MLS, brokerages, local Realtor Associations, real-estate agents, and households across the US. It includes pricing data for off-market deals and for-sale-by-owner deals.
Mind-blowing Condo Bubbles deflate in 34 charts.
The tables for each market below show from left to right: price decline from the peak, change from prior month (MoM), change year-over-year (YoY), and remaining increase since January 2000.
| Cape Coral, City, FL, Condo Prices | |||
| From July 2022 peak | MoM | YoY | Since 2000 |
| -34% | -0.3% | -9.2% | 127% |
| Oakland, CA, City, Condo Home Prices | |||
| From May 2022 peak | MoM | YoY | Since 2000 |
| -32% | 0.0% | -7.2% | 138% |
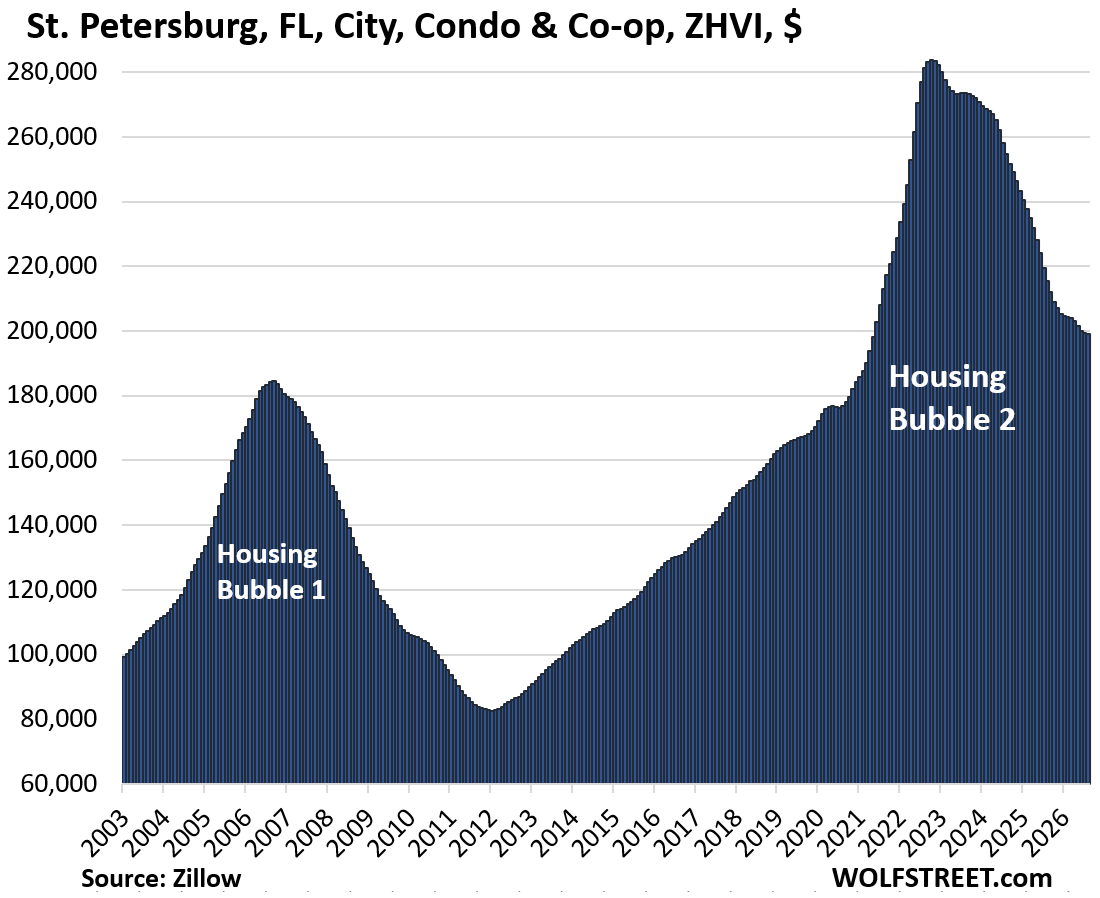
| St. Petersburg, Fl, City, Condo Prices | |||
| From Oct 2022 peak | MoM | YoY | Since 2000 |
| -30% | -0.1% | -7.6% | 176% |
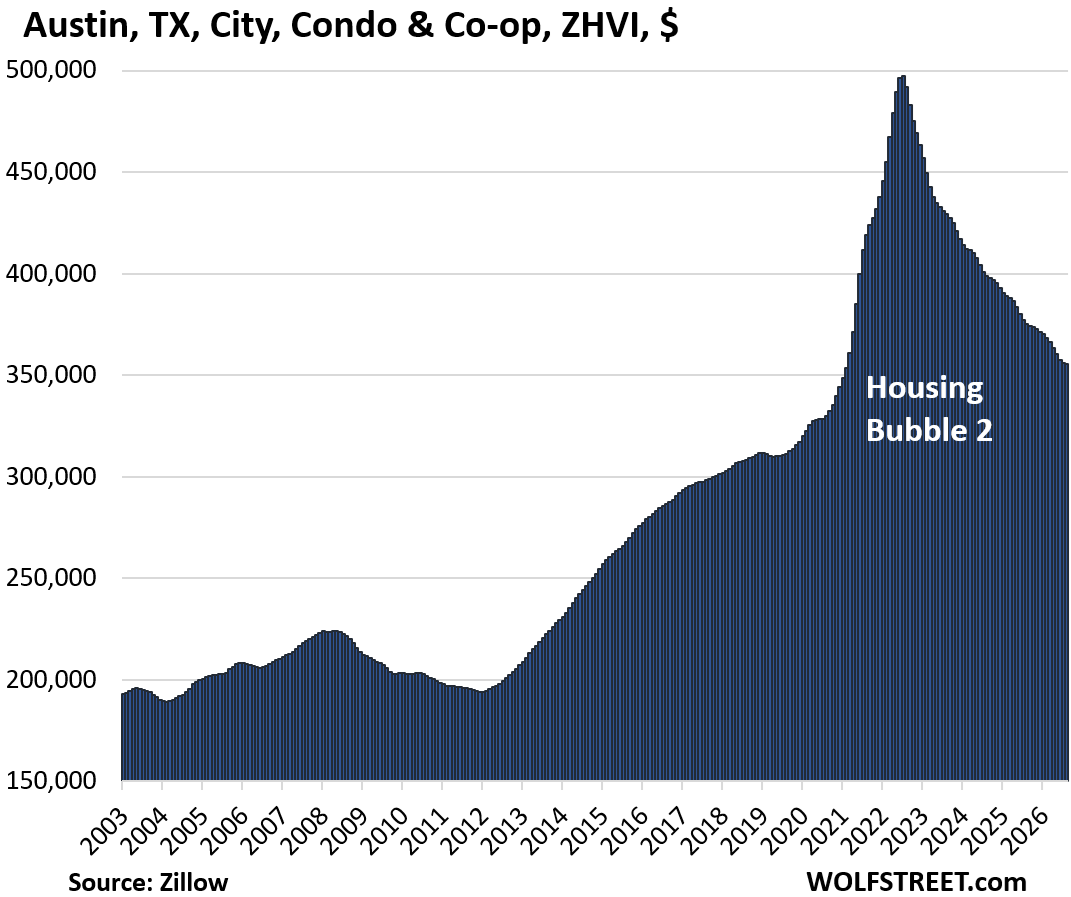
| Austin, TX, City, Condo Prices | |||
| From Jul 2022 peak | MoM | YoY | Since 2000 |
| -28% | -0.1% | -5.3% | 102% |

| Fort Myers, FL, City, Condo Prices | |||
| From July 2022 peak | MoM | YoY | Since 2000 |
| -27% | -0.4% | -9% | 117% |
| Sarasota County, FL, Condo & Co-ops Prices | |||
| From Jun 2022 peak | MoM | YoY | Since 2000 |
| -24% | 0.1% | -5.0% | 129% |
| Garland, TX, City, Condo Prices | |||
| From July 2022 peak | MoM | YoY | Since 2000 |
| -22% | -0.8% | -12.0% | 198% |
| Tampa, FL, City, Condo Prices | |||
| From Sep 2022 peak | MoM | YoY | Since 2000 |
| -22% | -0.3% | -7.5% | 243% |
| Jacksonville, FL, City, Condo Prices | |||
| From Nov 2022 peak | MoM | YoY | Since 2000 |
| -21% | -0.4% | -6.8% | 138% |
| Arlington, TX, City, Condo Prices | |||
| From Jun 2024 peak | MoM | YoY | Since 2000 |
| -19% | -0.8% | -5.7% | 219% |
| Denver, CO, City, Condo Prices | |||
| From Jul 2022 peak | MoM | YoY | Since 2000 |
| -19% | -0.2% | -5.2% | 126% |
| Aurora, CO, City, Condo Prices | |||
| From Jul 2022 peak | MoM | YoY | Since 2000 |
| -19% | -0.5% | -6.6% | 187% |
| Detroit, MI, City, Condo Prices | |||
| From Sep 2021 peak | MoM | YoY | Since 2000 |
| -19% | 0.3% | -5.6% | 247% |
| Lakeland-Winter Haven, FL, MSA, Condo Prices | |||
| From July 2022 peak | MoM | YoY | Since 2000 |
| -19% | -0.6% | -7.4% | 120% |
| Collier County (Naples), FL, Condo & Co-ops Prices | |||
| From Jun 2022 peak | MoM | YoY | Since 2000 |
| -18% | 0.1% | -3.9% | 152% |
| Orlando, FL, City, Condo Prices | |||
| From Jan 2024 peak | MoM | YoY | Since 2000 |
| -18% | -0.5% | -7.1% | 144.2% |
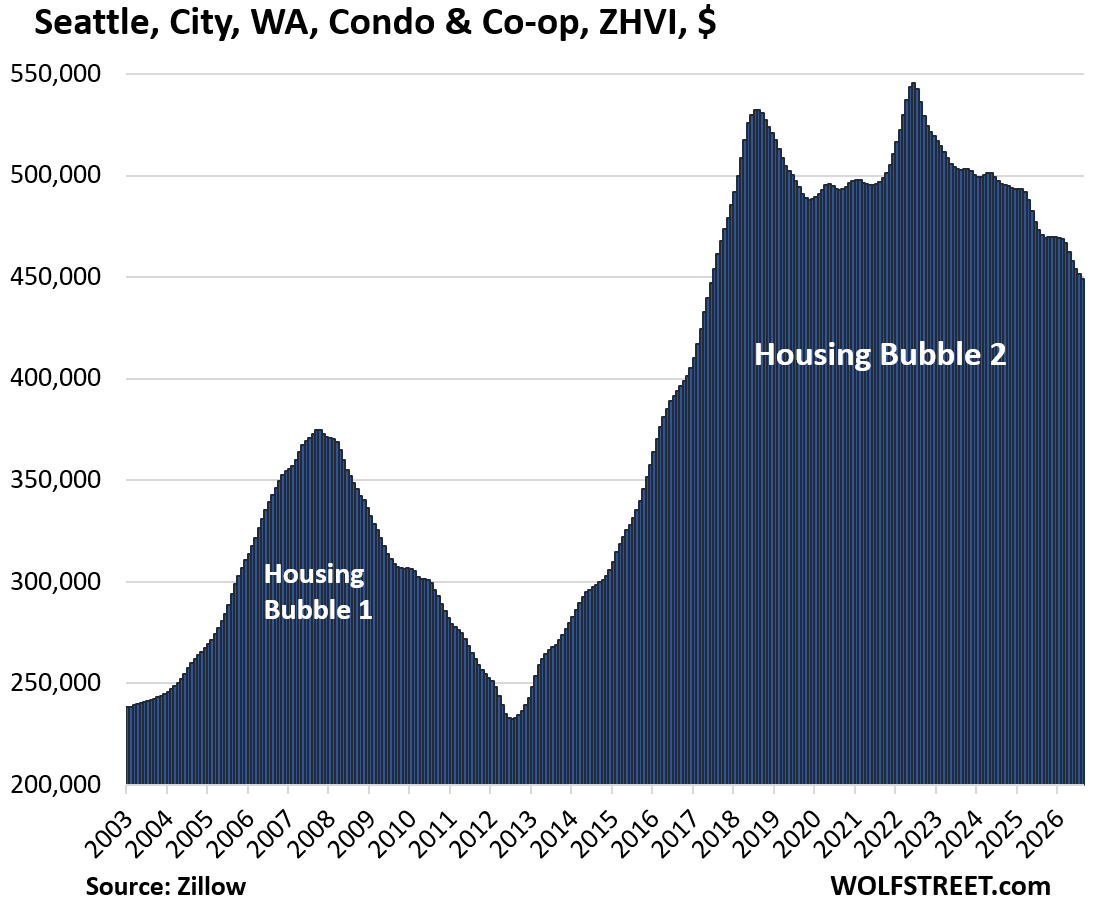
| Seattle, WA, City, Condo Prices | |||
| From Jun 2022 peak | MoM | YoY | Since 2000 |
| -18% | -0.5% | -4.5% | 126% |
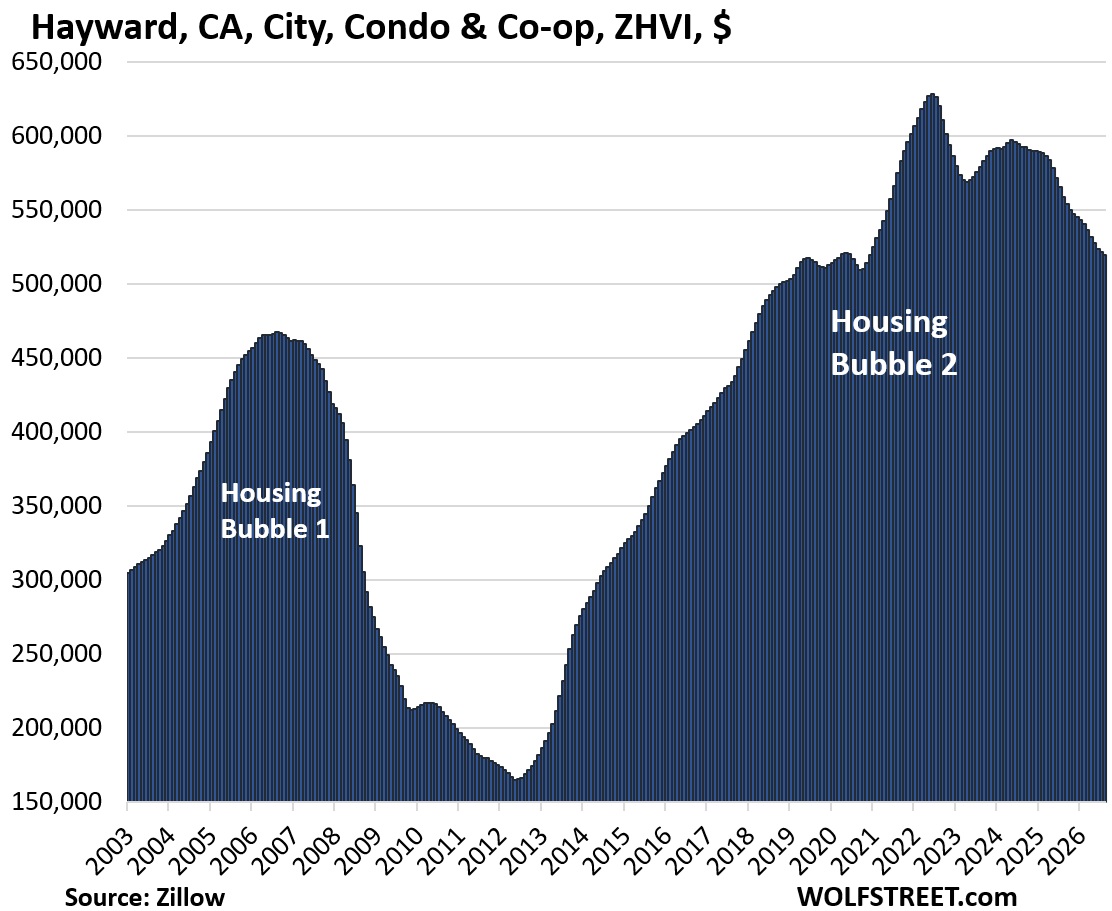
| Hayward, CA, City, Condo Prices | |||
| From July 2022 peak | MoM | YoY | Since 2000 |
| -17% | -0.3% | -7.0% | 171% |
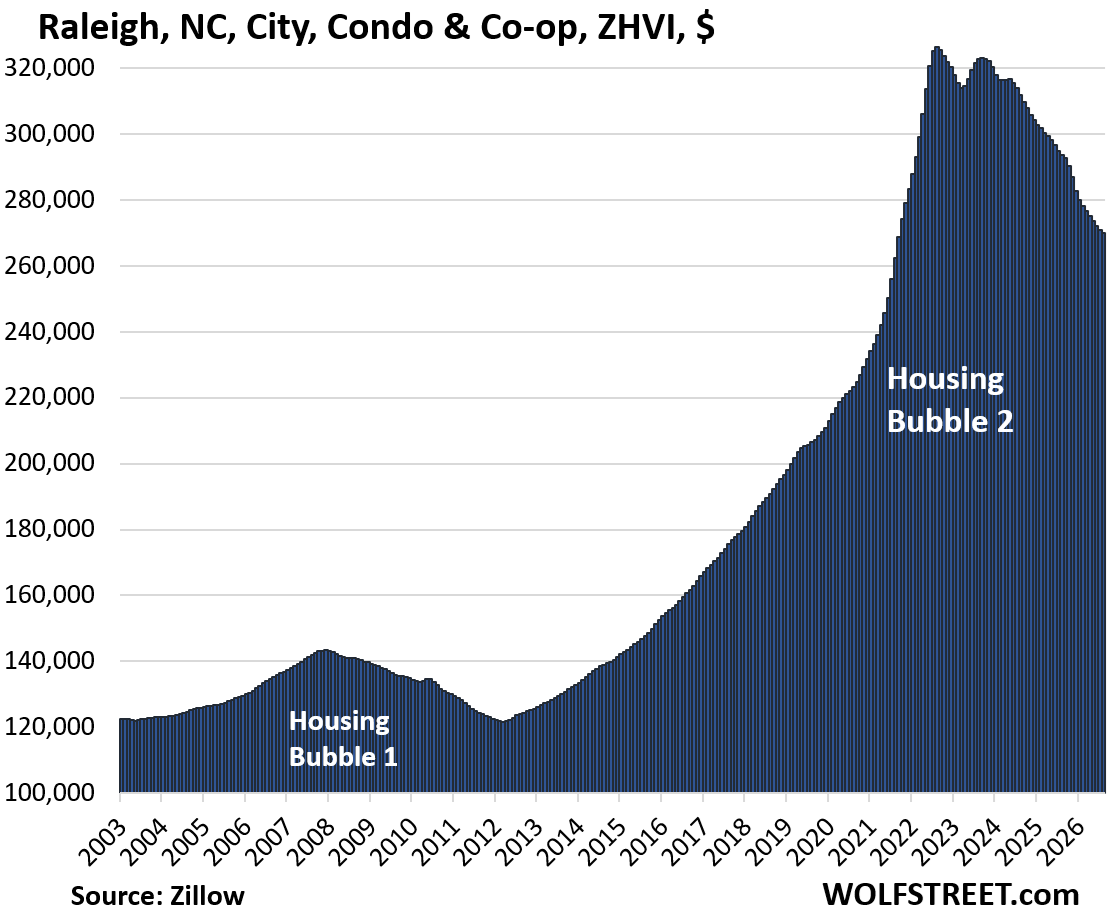
| Raleigh, NC, City, Condo Prices | |||
| From July 2022 peak | MoM | YoY | Since 2000 |
| -17% | -0.3% | -8.0% | 129.7% |
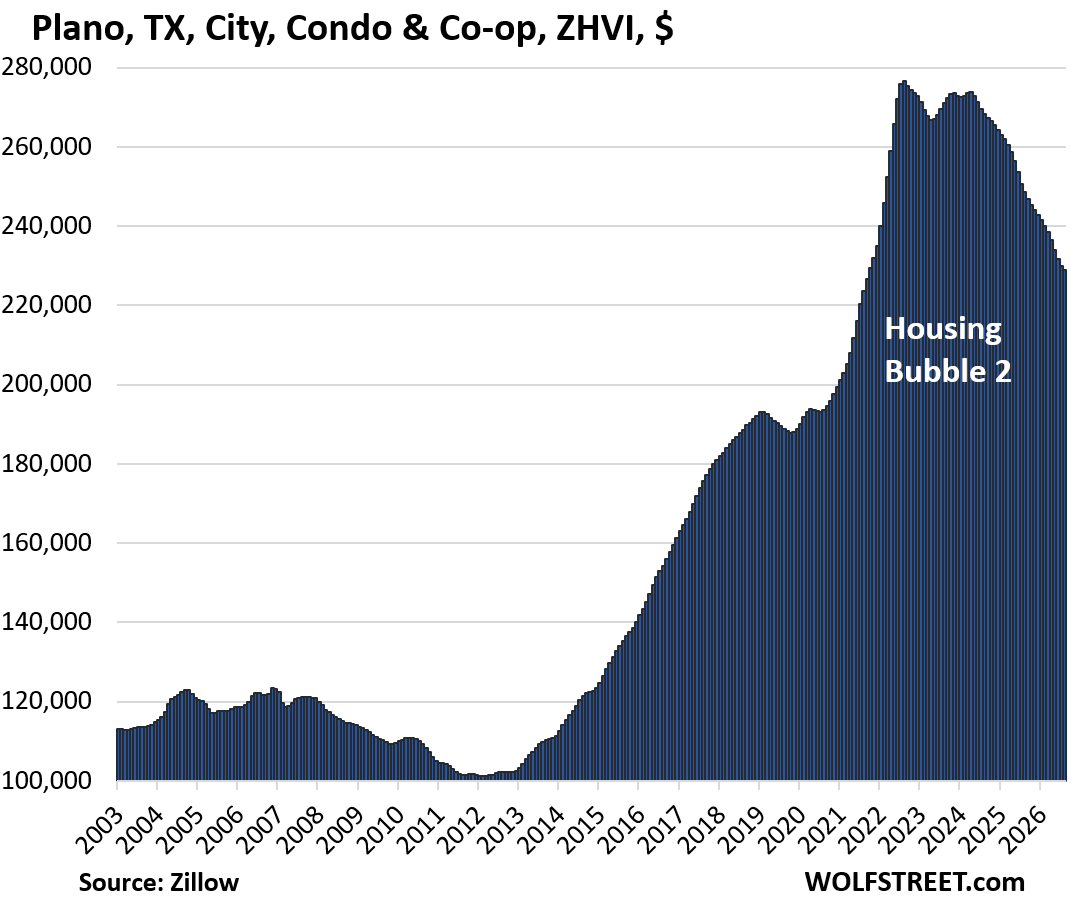
| Plano, TX, City, Condo Prices | |||
| From Aug 2023 peak | MoM | YoY | Since 2000 |
| -17% | -0.5% | -7.9% | 119% |
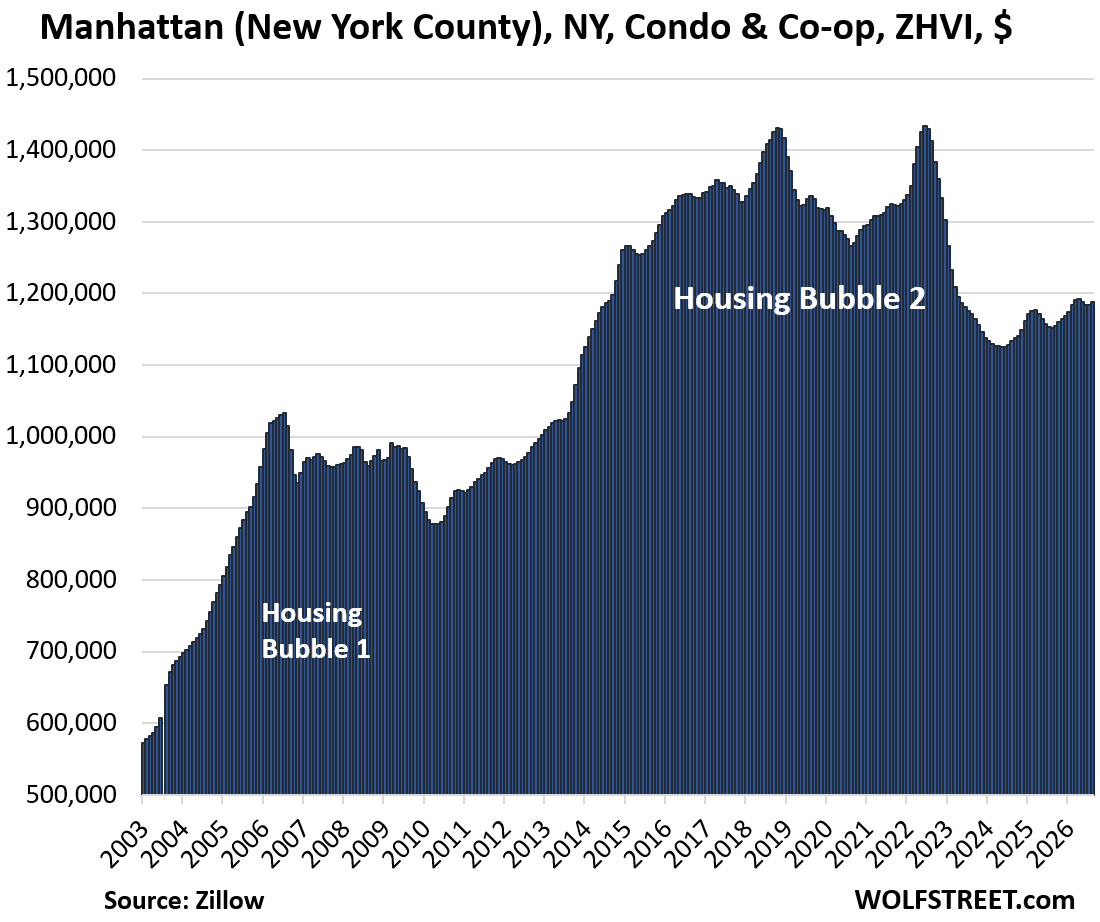
| Manhattan (New York County), NY, Condo & Co-Op Prices | |||
| From Jun 2022 peak | MoM | YoY | Since 2000 |
| -17% | 0.3% | 3.1% | 218% |
| Contra Costa County (East Bay), CA, Condo & Co-Op Prices | |||
| From Jun 2022 peak | MoM | YoY | Since 2000 |
| -17% | -0.2% | -4.1% | 130% |
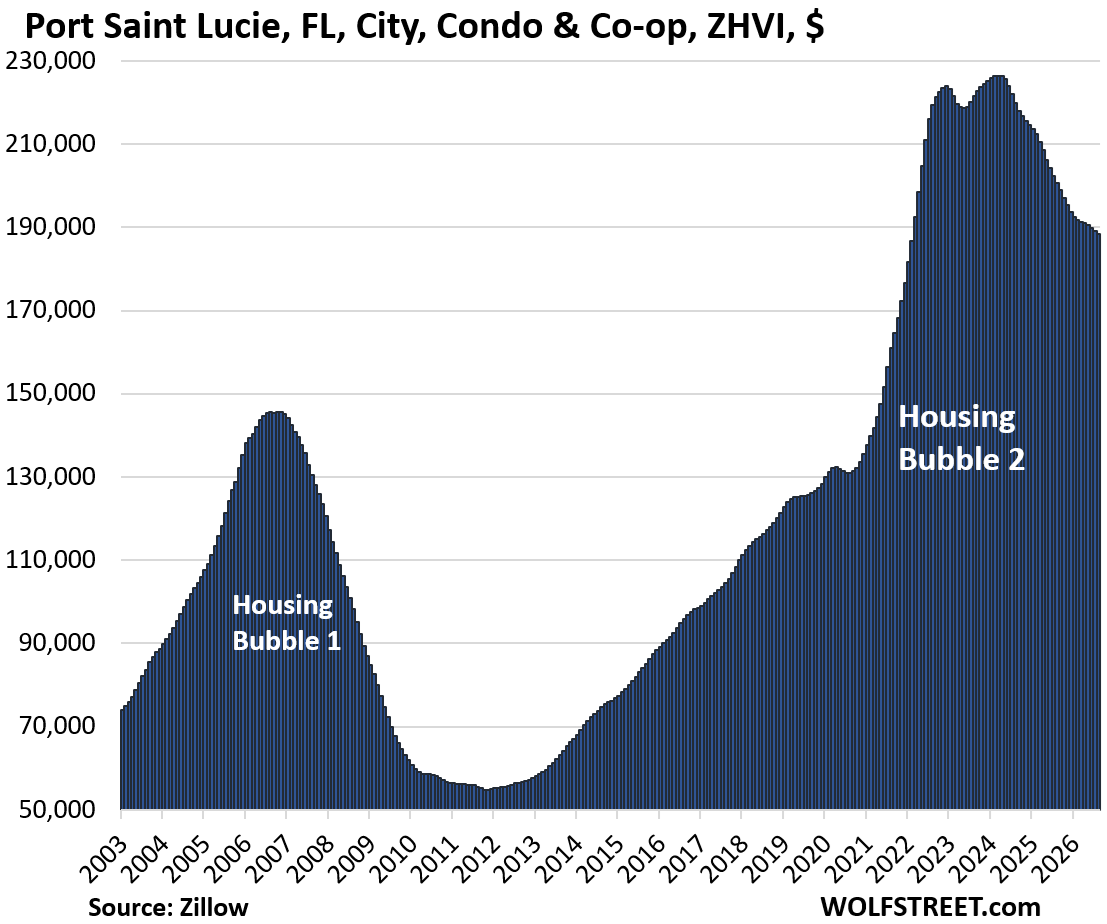
| Port Saint Lucie, FL, City, Condo Prices | |||
| From July 2022 peak | MoM | YoY | Since 2000 |
| -17% | -0.4% | -6.2% | 224.2% |
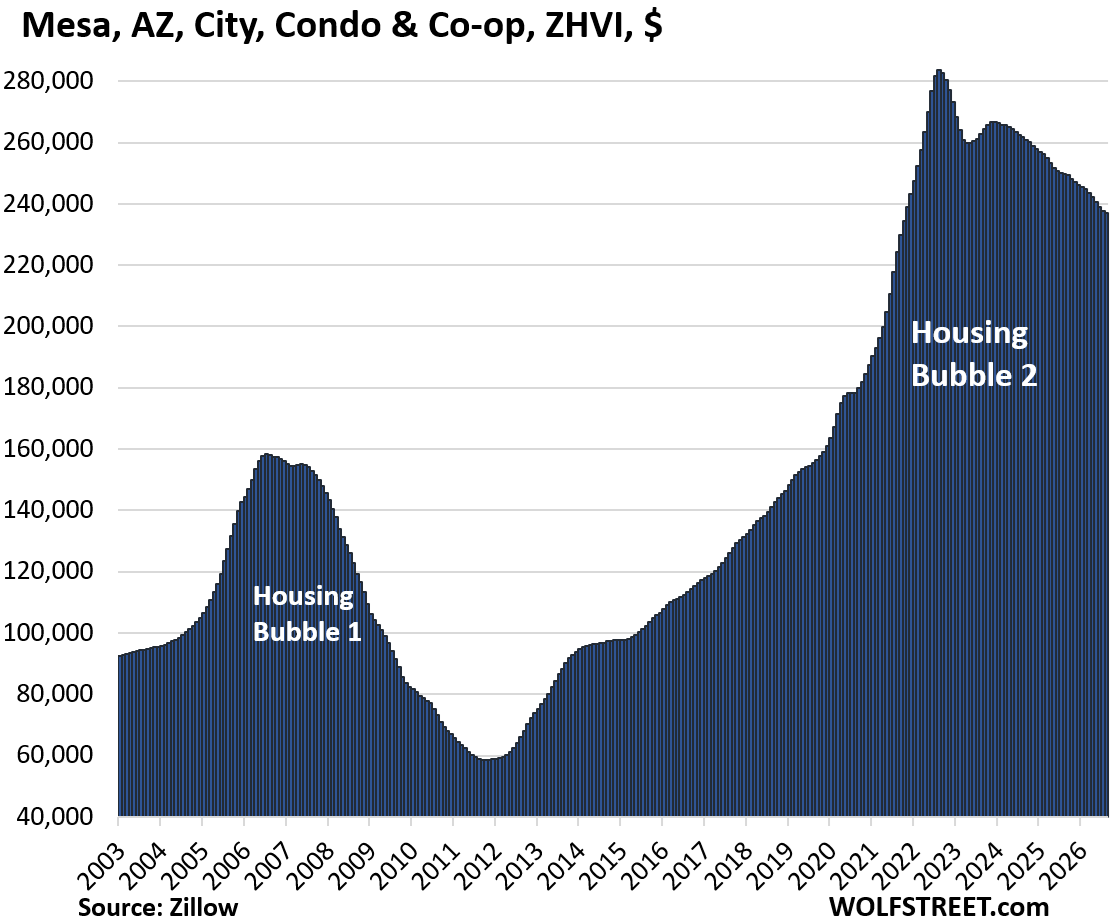
| Mesa, AZ, City, Condo Prices | |||
| From Aug 2022 peak | MoM | YoY | Since 2000 |
| -17% | -0.3% | -5.2% | 193% |
| Fremont, CA, City, Condo Prices | |||
| From May 2022 peak | MoM | YoY | Since 2000 |
| -16% | -0.3% | -6.0% | 192.3% |
| San Mateo County, CA, Condo & Co-op Prices | |||
| From Jun 2022 peak | MoM | YoY | Since 2000 |
| -16% | 0.3% | -2.4% | 193% |
| Portland, OR, City, Condo Prices | |||
| From Jun 2022 peak | MoM | YoY | Since 2000 |
| -16% | -0.2% | -3.3% | 103% |
| Chandler, AZ, City, Condo Prices | |||
| From Aug 2022 peak | MoM | YoY | Since 2000 |
| -15% | -0.2% | -4.3% | 201.4% |
| Phoenix, AZ, City, Condo Prices | |||
| From Aug 2022 peak | MoM | YoY | Since 2000 |
| -15% | -0.2% | -3.6% | 226% |
| Tempe, AZ, City, Condo Prices | |||
| From Jul 2022 peak | MoM | YoY | Since 2000 |
| -15% | -0.4% | -5.3% | 154.7% |
| Reno, NV, City, Condo Prices | |||
| From Jun 2022 peak | MoM | YoY | Since 2000 |
| -15% | 0.1% | -1.9% | 242% |
| Houston, TX, City, Condo Prices | |||
| From Aug 2023 peak | MoM | YoY | Since 2000 |
| -15% | -0.2% | -6.0% | 64% |
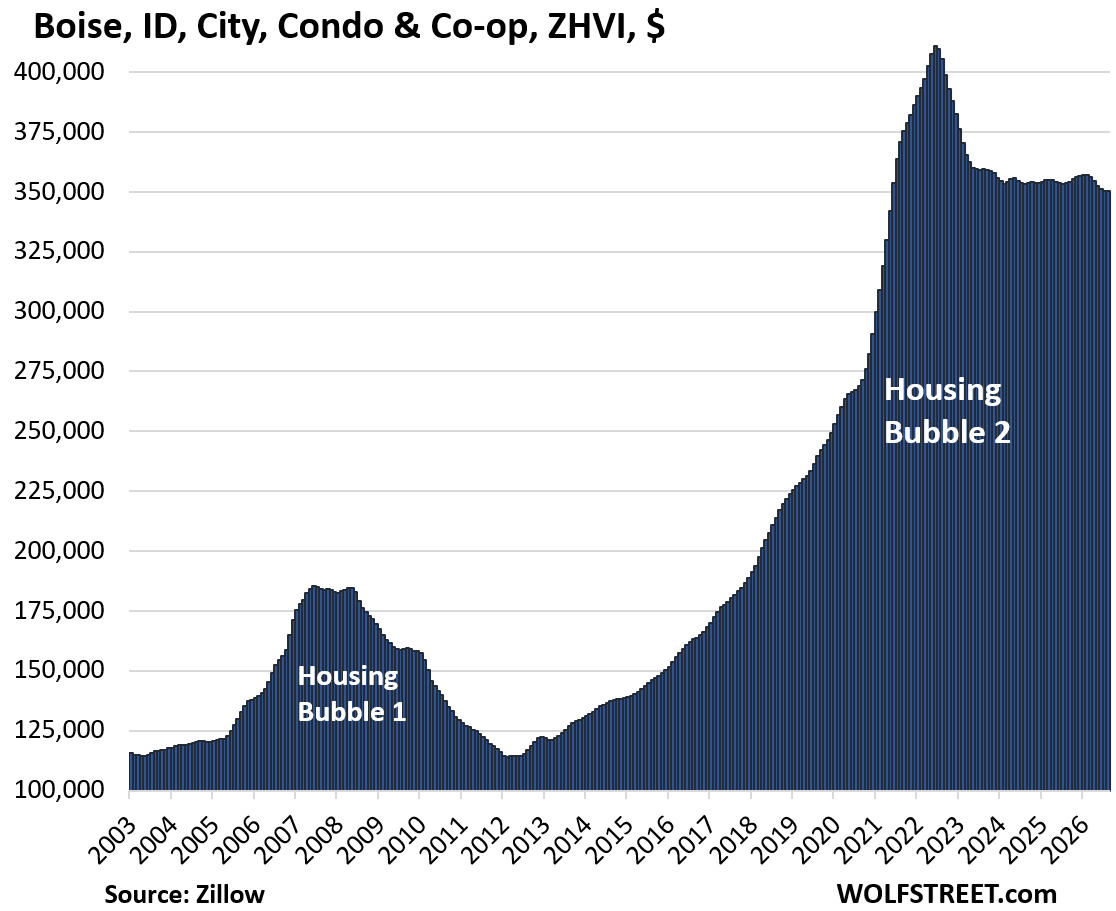
| Boise, ID, City, Condo Prices | |||
| From Jun 2022 peak | MoM | YoY | Since 2001 |
| -15% | 0.1% | -1% | 221% |
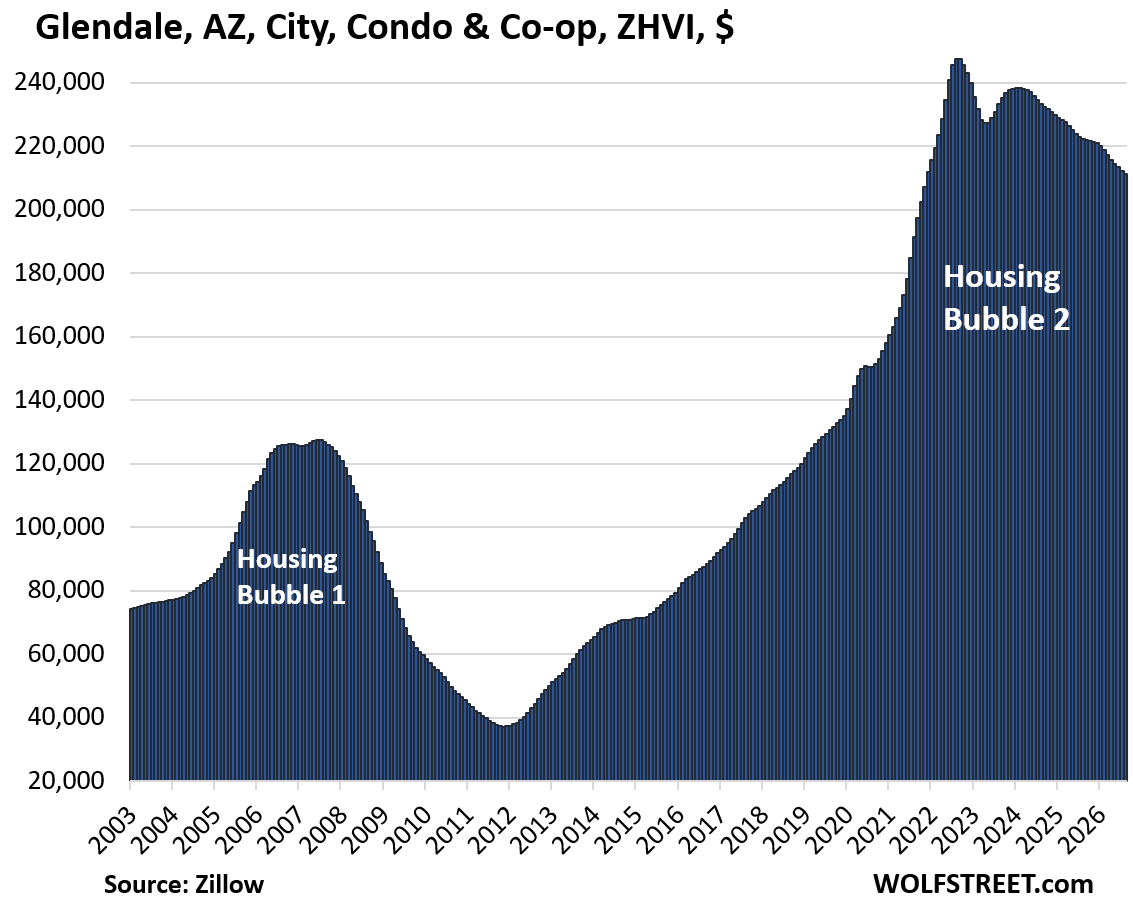
| Glendale, AZ, City, Condo Prices | |||
| From July 2022 peak | MoM | YoY | Since 2000 |
| -15% | 0% | -5% | 234% |
A reminder of the special issues condos face.
Some people buy condos as a home because they want to live in an urban center or along the shore, or enjoy the big views, nice amenities, and worry-free living where staff takes care of the building maintenance, repairs, and yardwork; or because they like having staff by the front door, or don’t want to climb stairs; or because of a combination of these.
Others buy condos as rental properties or as short-term vacation rentals. Or they buy them as vacation homes. Especially nonresident foreign investors buy condos to park some cash in the US. It’s these investors that make condos particularly speculative.
Some of the special issues:
- Over the long term, land appreciates, but most buildings depreciate and are eventually torn down. The land that big condo buildings sit on can be very valuable, but each condo owner only owns a tiny slice of it. The rest of their investment is in the building. A single-family house may sit on less valuable land, but the homeowner owns all of it.
- Prices that exploded over the past few years ended up being way too high, once the mania settled down.
- Hefty special assessments, or the fear of them, for long-neglected major repairs dog some older condo buildings. This is a particular issue in Florida, but elsewhere too.
- Big increases in HOA fees at many properties, partly driven by spiking insurance costs in natural disaster zones, add substantially to the monthly costs of condos.
- If a condo building is on Fannie Mae’s Blacklist, financing a unit in that building can be difficult, and sales may be limited to cash buyers who know that and exact their pound of flesh.
- The Free Money has ended, and mortgage rates are roughly back to a normal range. Buyers of single-family homes face the same issue.
- Foreign-based owners who’ve become frustrated with the US and became sellers add supply, while demand from foreign buyers has waned.
- Investors in condos as rental properties are facing stiff competition from a wave of newly completed higher-end apartment buildings that developers are trying to find tenants for.
And in case you missed it: Pending Home Sales Stuck Deep in Mud, Edge up from Down-Revised 2nd Lowest on Record, Supply Hits 10-Year+ High
Enjoy reading WOLF STREET and want to support it? You can donate. I appreciate it immensely. Click on the mug to find out how:


Wonder if we will ever see the other side of that second mountain?
Only if we defeat Sauron.
It will happen,the Ents have joined us!
Never, ever by a property with an HOA.
Why?
actually for us boomers, we hate maintenance and pay for nice accomodations
yes I hate HOA – never on rental/investment
now FLORIDA has problem with that big assessment thing going on
many retiree losing entire investment and walking away to another state
Florida is no longer viable low cost retiree place(just to visit)
Why?
Fly, meet spider.
Basically, HOA fees are going to go on forever, inflating along the way – the only question is how abusive the relationship may become (how much value is really conveyed for endlessly escalating monthly costs?).
If you buy a non-HOA house, you don’t have this likely abusive relationship (except with your local property tax gathering Lordship. But condo owners essentially get doubly tax farmed…).
If you rent and you get aggressively squeezed by your landlord, you move. No “property owner” will ever have the flexibility/liquidity of a renter.
And condo owner “representation” on HOA boards?
Go watch Seinfeld re-runs. Boob-ery, crony-ism, and outright graft are not uncommon.
It is like voluntarily taking on another level of government, with even fewer effective rights.
Okay…maybe the same level of effective rights…
As I am getting older, I prefer to live in a good Condo complex than in a SFR.
At some point in time, the convenience of no chores outside outweighs the money you spend on hoa.
100% agree
It’s not the fees that are the problem, it’s the association.
“At some point in time, the convenience of no chores outside outweighs the money you spend on hoa.”
Maybe if you were paying the 14 yr old who mowed your old lawn, 5 grand a year.
I’m kidding…but not by much.
Most condos just aint fancy/kept up enough to justify the nosebleed aggregate fee revenue demanded.
200 units at 5k per year…(best Dr. Evil voice…)…1 million dollars, per year.
For that, I want professional grade porno topiary, valet parking by ex-Congressmen, and talking dolphins in the pool.
It depends on how much a person likes looking at parked boats and old campers with flat tires, wood piles with blue tarps, unmowed lawns, old rusty cars and dead 1980 washing machines.
The people that complain the loudest never read the bylaws before moving into an hoa thus the rules don’t apply to them. My hoa does a fairly good job of dealing with trash collectors.
That’s interesting- I lived in places without HOAs and yet I never saw any of that.
Sure, but there are 10X the examples going the other way.
Yeah…
I have lived in many places minus HOA…
And people were clean, kept up their properties…
And were neighborly and civilized.
HOA is not a necessity for clean and civilized.
Bobber makes a great point, I don’t have an HOA where I live but for SFH neighborhoods they are nice to force people into keeping the front yard looking nice (most areas without an HOA have no way for you to stop the guy next to you from ripping out every plant and filling the front yard with old cars and boats parked on the dirt covered with blue tarps from Walmart.
Yes, the HOA acts as insurance to protect your home value. You may have a nice house, but if your neighbor has a backyard kennel with 5 barking dogs, your house is worth 20% less. A Green Bay Packers flag out front might cost you another 10%.
You just described a hood down the street from me.
Moonlake in Hudson, Florida, home of the great unwashed.
🙄 Didn’t know my neighbor read wolf street. Those are vintage cars btw!
single family houses have local and county taxes which are effectively HOA by another name.
All houses in the US are subject to property taxes and they are nothing like having a HOA at all.
HOA membership doesn’t get you a local property tax exemption.
You are just getting doubly hosed.
My neighborhood has an HOA. We pretty much acknowledge that its just there to keep the riff-raff out.
I would say over-paying by three to four times (median price growth post 2000) just as effectively keeps the opportunity-cost-aware “riff-raff” out.
Enjoy the hothouse, ant-farm of the self-regarding thereby created.
My sentiments as well. Both houses I bought, I stipulated to the realtor, “don’t even show me a house that has an HOA.” I’ve been more than satisfied with that choice.
It seems like all new subdivisions have them. I wonder, if there is a demand for no-HOA homes, why more are not being built. The excuse I hear, is that a mandatory association is needed to manage drainage, retention ponds, and whatever else is required by modern zoning codes. And also to manage whatever common areas are there.
This sounds to me like BS, if used to justify HOAs as most of us understand them. What does managing drainage or common areas have to do with the color of my house, what vehicles I park there, or what I plant in my yard? The solution is to have a mandatory association that is strictly limited in its powers to deal with those issues, instead of a crew of local oppressors.
Some cities are like HOAs including exclusive Rolling Hills on the lovely Palos Verdes Peninsula here in Southern California and has been since its founding in 1957 and where all houses must be single story, painted white, and blend in properly with the community. Any one who wants to purchase a house there is clearly informed of that and if they don’t like being part of this 700 home community then they are welcome to purchase a residence elsewhere.
Depends on what you’re looking for. If you want your property and your neighbors property to be heavily regulated and enforced with fines, HOAs can be great.
If you want the property to be one where you as free to do what you want, subject to local laws (that may also vary on regulations and enforcement), then HOAs are fascist / communist (pick your poison).
Just pick your poison. Although understand that left unmonitored people tend to turn the commons into a dumping ground.
HOA is still not as bad as marrying a Karen. Both can take your house of course.
Outrage Ensues as HOA SEIZES Ailing Arizona Man’s 450K House Over $977 Debt – And Then Sells It at a Shockingly Low Price
Why didn’t he make arrangements to get the $977 bill due to the HOA paid as he was required to do?
1. “And Then Sells It at a Shockingly Low Price”
It’s not a “shockingly low price” for people who have read the housing articles here.
2. That’s what you get for not paying what you owe.
So history did repeat itself…. Who could have possibly imagined something so predictable would happen again?
Howdy Folks. Golly, The Lone Wolf RE charts should be mandatory information for anyone purchasing a property. Along with making them watch a few episodes of Fear Thy Neighbor too.
Guess the Fed’s cheap money is not so cheap after all.
Nope, it just buys us all a bunch of problems that was none of our doing.
This is just the prelude, for all you latecomers. The main concert is going to bring the condo – I mean house, down.
I can hardly wait for wildfire season hen all those idiots bought homes in a fire zone and their $$$ goes up in smoke. Will be hilarious!
Natural disasters can happen anywhere, and certain areas are at higher risk of certain types. Do you laugh at people who get wiped out by tornados, hurricanes. And floods too? Or do you just find the thought of homes burning up uniquely hilarious?
+1
There is nothing funny at all about any natural disaster including wild fires which occur all around the country every year.
Wildfire season has been here for months, and so far it is much less active than previous years.
And for the people who hate on hate on hurricane zone dwellers… the last year was hurricane free, and so far this year has been too.
No serious earthquakes in recent years on the west coast either.
we can only hope house prices follow. last time we crashed, the cap rates in phoenix became so juicy i could not stop myself from not riding the ride up. thank heavens i sold out in 2022. sometimes it’s best to be scared when folks are so greedy. perhaps i’ll buy back those old single and 2 family craftsmen bungalows i used to own.
I bought a house in Fort Worth area in late 2023, that is up in price by about 1%.
Doesn’t matter that the reports say houses in FT Worth are down 9%.
You don’t know what your house is worth until you sell it and the deal closes. Then you know. And your house doesn’t enter into the figures I use until it sells and the deal closes. Data I use are based on transactions.
The HOA fee is the same as a mortgage payment with one exception, it always will increase over the next 30 years.
Best build a small place in the back yard and have a younger relative career for it in your old age.
wrong. the HOA fee is more like your local r/e tax. pays for maintanence of roads and services like fire and police. your note and mortgage is just borrowing costs.
HOA fees cover many expenses including maintenance, insurance, and property maintenance while a mortgage payment covers none of that.
Let me know when we get back to 2012 prices!
Life moves on, and if you don’t pay attention, you miss it 🤣
Right ??
Try to enjoy what you can, when you can.
My grandparents purchased their house on an acre in 1963 on the California Central Coast for $5,000.
Forget 2012…How about 1963 prices ??
Haha… times do change for sures.
It is also pretty relative depending. For instance they said that to do it was a huge financial stretch for them. They said that financially it did not work out on paper.. but they did what they had to do to make it happen.
Work hard, play hard, enjoy…. You only got one shot at it.
Condos are the canary. The housing market is the coal mine. And the canary is dead!
Are townhouses considered condos or sfh?
If there is more than one of them and it has a shared wall and HOA the “townhouse” is a “condo”…
gracias. a euphemism then
ApartmentInvestor,
That’s wrong. You have apparently never owned a condo.
A townhouse is a building type.
“Condo” is a multifamily ownership/legal structure, not a building type. The full name is “condominium,” it’s Latin and means “joint dominion” (“co-ownership”). There is no such thing as a single-family condominum. Owners of a unit in a condominium own the inside walls of their unit, plus a slice of the entire property. They owe property taxes to the city based on their percentage of the commons they own.
Condominium properties are governed by an elected board. The weight of each owner’s vote is determined by the percentage of the commons they own. For example, my condo of 1,800 square feet was 1% of the commons. I owned the inside walls of my unit, plus 1% of a city block, 1% of a tower with parking garage and pool.
And I paid 1% of the total HOA which covered all operating expenses, including homeowners’ insurance for the property, the staff working at the building (the person at the front desk, the maintenance guy, and the cleaning woman), repairs and maintenances. The HOA also covered payments into a sinking fund (out of which the big lumpsum costs were paid, such as for replacing the common water heater, which cost a bundle. Thanks to a large sinking fund, all major repairs were covered while I was there, and no assessments were issued.
“Co-Op,” another type of multifamily ownership/legal structure, is a shareholder corporation, and each owner owns shares of the corporation. Co-op boards can be very restrictive, and if they don’t like the buyer of your shares, they can block the sale of those shares, and you cannot sell to these people.
TIC (Tenancy in Common) is another multifamily ownership/legal structure under which the entire building (all units in it) shares the property title and the mortgage. Everyone is responsible for everything. They’re pretty common with strip shopping centers, but in San Francisco, they’re also common with multifamily buildings. A unit in a TIC building is difficult to sell and sells at a discount to similar condos due to the issues that come with it.
Rentals are an ownership structure, for multifamily or single-family properties, where one entity owns the entire property and charges tenants “rent” for each unit. The rent should generally cover all expenses, including homeowner’s insurance, property taxes, repairs, etc. Recently, many landlords have defaulted on their mortgages because rents did not cover all expenses, and lenders have seized their buildings, and we’ve discusses some of them here.
we preferred the coop structure in nyc for the obnoxious reason of keeping the rif raff out of the buildings. my parents coop only permitted folks with peerages and over 75. no rock stars or starlets or young guns. it’s all so ridiculous. the coop i purchased in 1988 was effectively worthless five years later, as banks would not underwrite any new buyers. sold it in 2001 for less than i paid eleven long years later after renting it for a loss for 7 years. a lesson i never forgot investing in r/e quite successfully since the 1990s in a few sunbelt cities and bay area. trading is much easier career.
You missed one. A PUD where a home may not share walls or structure with othrts but the land is owned in a manner common to a Condo, shared by all.
Do you believe price corrections in the condo market are largely driven by surging HOA dues, which increase the total cost of ownership and compel buyers to adjust their valuation of these properties?
No, because HOA costs didn’t plunge in 2020-2022 when condo prices exploded. the problem today is that condo prices exploded and are now too high. that’s the problem. That problem is in process of fixing itself through lower prices.
Wolf – might look into Debt Service Coverage Ratio loans. Just read about a multimillion-dollar fraud scheme in Baltimore were investors used these loans to purchase at above market prices (their cohert being the owner) then walked away from the properties claiming they were unprofitable (many were never rented out). Don’t know if this is a wider/significant problem.
@Wolf the question was:
“Are townhouses considered condos or sfh”
I don’t think anyone would call a townhome in a complex with shared walls and a HOA a “single family home” and most people would call it a “condo” (like people in SF that own TICs that still hope to convert to them to “official” condos if they bring back the SF condo conversion lottery).
These people who call a townhouse a “condo” are ignorant about real estate.
The question with a townhouse is: when is it considered “single-family” and when is it considered “multifamily.”
Here is the definition from the Census Bureau (you could have just googled that). You will find that your example, when the exterior walls are touching, and below conditions are met, it’s “single-family.”
https://www.census.gov/construction/soc/definitions.html
Attached and Detached Single-Family Housing Units – Single-family structures include fully detached, semi-detached (semi-attached, side-by-side), row houses, duplexes, quadruplexes, and townhouses. In order for attached units to be classified as single-family structures, each unit must:
1. Be separated by a ground-to roof wall,
2. Have a separate heating system,
3. Have individual meters for public utilities, and
4. Have no units located above or below.
If each unit within the building does not meet the conditions above, the building is considered multifamily.
MW: It’s almost impossible to sell a condo unit these days: ‘I feel trapped’
That’s nonsense. They should just quit moaning and cut the price. everything will sell if the price is right. But they don’t want to do that.
I fully agree. So if the premise of the MW article is correct, why aren’t prices of condos dropping sharply to reflect that now?
correct. if a piece of r/e whether raw land or some fancy condo in a gorgeous neighborhood does not have a ratified contract within 30 days it’s priced incorrectly. it’s always about price. no matter the asset. including rare art and antiques.
Keep lowering the price until the phone starts ringing.
That’s how everything else is sold, why not your condo?
Oh, you say your neighbor sold much higher in 2022?
That ship has sailed, my friend.
One difference is who owns the land under the building. I worked for an engineering firm back in the day and we platted out several developments where one owned the land under their unit and to the center of the shared wall. Yes there was a hoa that takes care of the exterior maintenance, parking areas and such. You could do what you wanted with your back patio assuming its fenced.
All developments here even single family require a detention pond so you need a hoa for that. It’s just that once you have a hoa anyway all the other stuff tends to get added on.
I’m not sure I understand this, but it seems like you are saying that the condo owners have seen the equity of their investment drop while their expenses like HOA fees are increasing.
Do you foresee that causing a reduction in daily spending, such as retail and dining out? Your past articles have commented that people are still spending like drunken sailors.
Lower home prices have three aspects in terms of consumer spending: one positive, one neutral, and one negative:
1. buyers have lower costs, including interest, insurance, and property taxes, and so they can spend more on other stuff.
2. current owners who don’t want to sell are not financially impacted by lower prices except that they may get lower property taxes if they appeal. Insurance might also come down or at least not go up further. So that may be a slight positive.
3. Sellers won’t be getting their dream amount, but less than that. Most of those who bought in the years before 2018 or 2019 will still make money, pay off their remaining mortgage, and walk away with spending cash. But some sellers who bought around the peak will lose some money, and they’re maybe upside down in their mortgages, and so they’re not happy, and some of those condos might end up in foreclosure. It’s uncertain whether that will cause those people to spend less.
And employment crisis DOES cause people to spend less though. But we haven’t seen that yet.
Come and invest in Maine.
Life is great … except January and February, I know.
And we are very climate-change resilient.
Love the positive spin on frostbite.
Where I live, it’s nice and toasty. Like 100F in September toasty.
I was in Maine last week, and thought the roads were laid out like a pile of spaghetti.
Not the best state for economic development.
Imagine the biggest redwood tree that you can –
like one as large as those you can drive a car through. Now imagine a wood crew cutting the redwood with a chain saw – it’s still standing, but there is only small portion of wood holding it up still – any more action with the chain saw and ‘BOOM’’ – that massive redwood tree comes crashing down to earth. Such is the current housing market – holding on by a thread /splinter. I’m calling ‘TIMBER!’.
Yep, we saw your comment the first time.
Maybe in 10 years when the boomers are dying out. But in the next years, it will just be a slow bleed (not timberrrr !) and when the USD is massively devalued in 2030 – 2034 renter will be bag holders.
PS… the home they purchased was brand new construction.
If condos are the canary in the coal mine, and we are looking at the deflation of housing bubble #2, I wonder when we’ll start seeing the impact on banks and shadow banks?
Or has the government effectively nationalized the problem, and stuffed all the MBS into Fannie / Freddy?
This time tax payers are on the hook if there is a widescale foreclosures.
There won’t be any impact on banks/shadow banks as most housing mortgages are sold to Gov.
The price of condos are attractive and would like one., as a spare but the HOA fee are a deal killer some of the markets i look at were 450-500 Per Month! Don’t believe the BS and fear they sell about bad neighbors. Bad neighbors live in bad neighborhoods. An audit would have to be performed on the HOA before moving forward.