
Sales were bad in all regions. But mortgage rates in August were still quite a bit lower than now.
By Wolf Richter for WOLF STREET.
Pending sales of existing homes for July were revised down today to the second-lowest in the data going back to 2010, just a hair above the all-time low set in January. And August sales edged up from this downwardly revised July to the level of the originally reported July – that’s how deep in the mud sales have been stuck.
Compared to the already stuck-in-the-mud levels in August last year, sales dropped by 4.7%, seasonally adjusted, and by 4.9% not seasonally adjusted, according to data from the National Association of Realtors today.
Compared to August 2021, pending sales have collapsed by 39%, compared to 2020 by 45%, and compared to the Augusts in 2019 and 2018 by 33% and 32% respectively. Compared to August 2010, during the Housing Bust, and the first August in the data, sales were down by 13%.
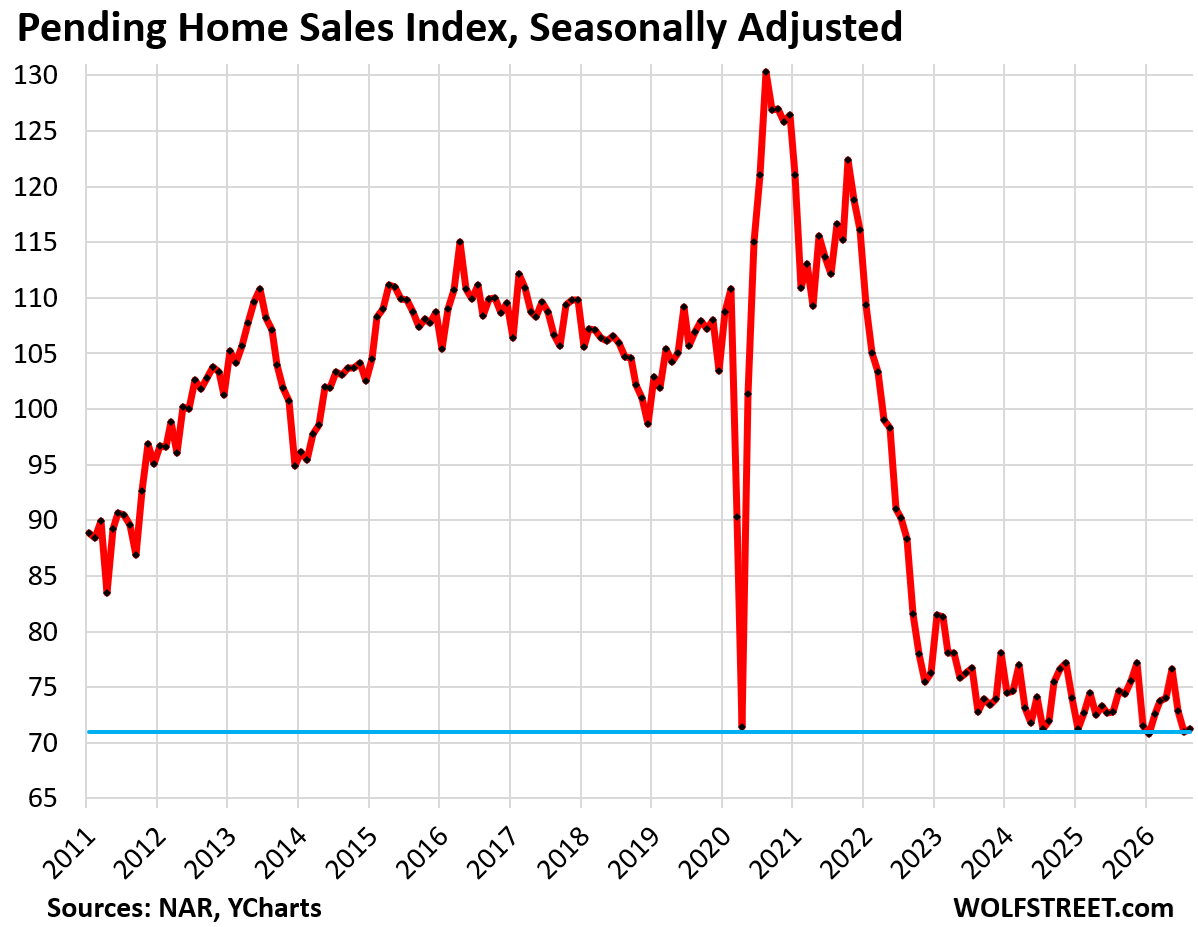
The NAR’s metric of pending home sales tracks contracts that were signed in August but that haven’t closed yet and could still get canceled. The rate of cancellations has been running high. Pending home sales are a preview of what is coming in terms of closed home sales.
Sales volume has remained mostly below the lows of the Housing Bust for nearly four years – September will complete of the fourth year – after the home-price explosion from mid-2020 through mid-2022 created what is now called an “affordability crisis” amid home prices in many markets that no longer make economic sense.
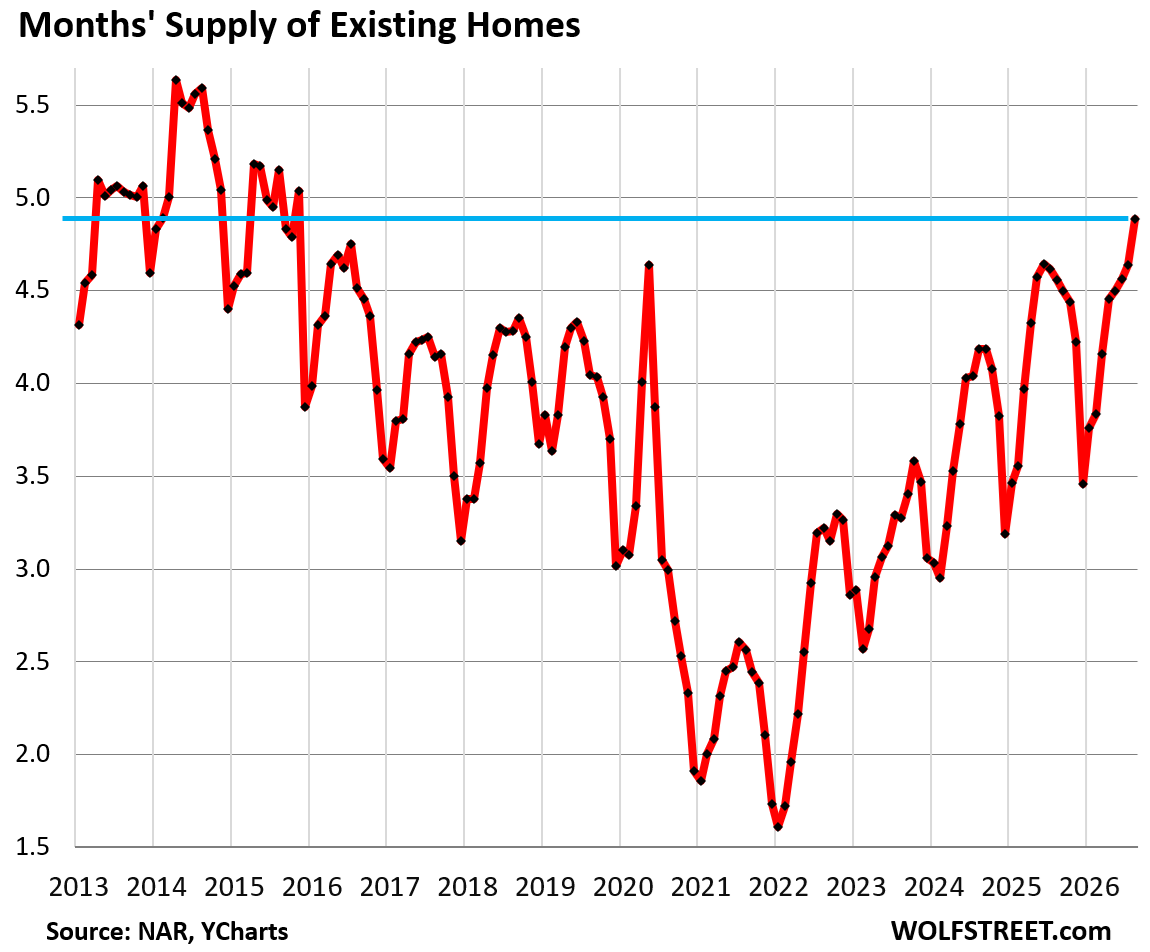
Amid soaring supply.
The collapse in sales has triggered the highest supply of existing homes in over 10 years, according to separate data from the National Association of Realtors:
Pending home sales by region.
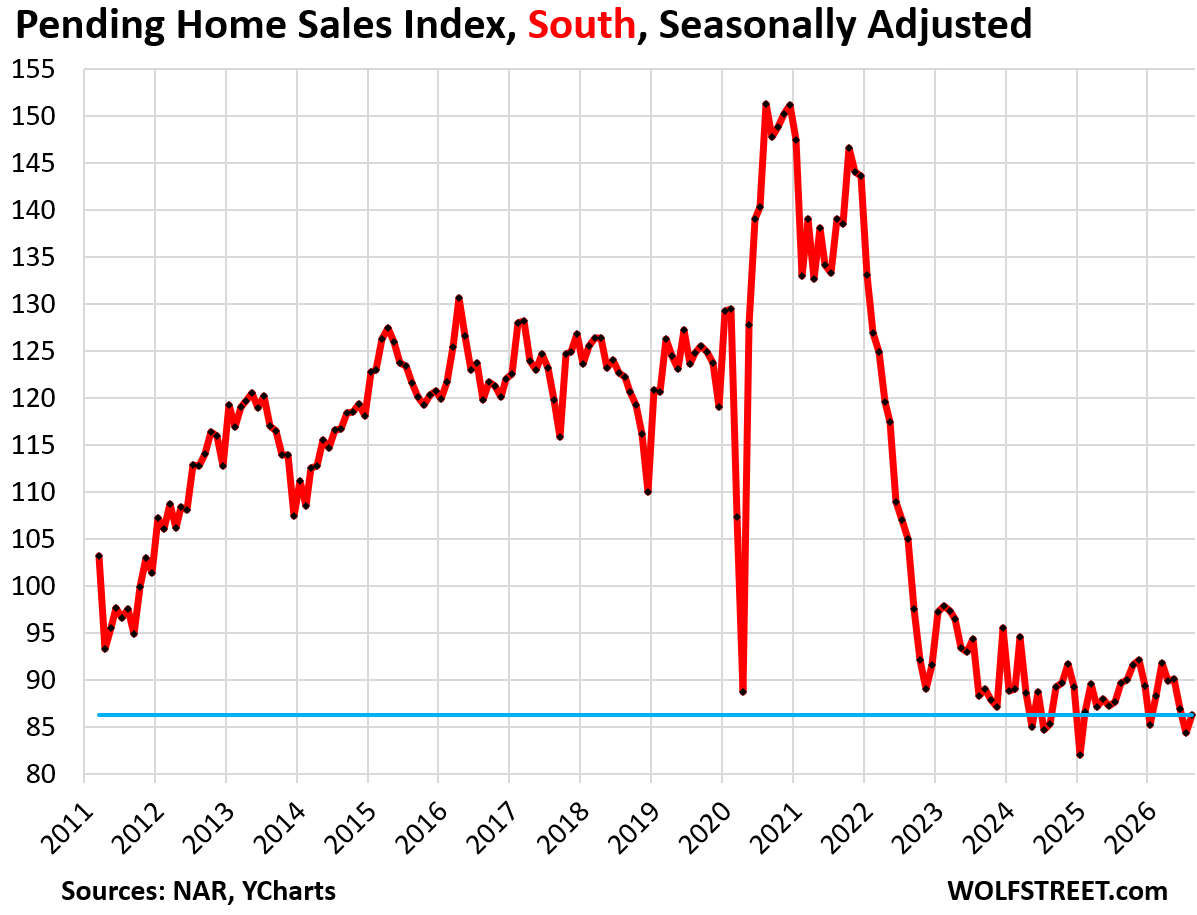
In the South, pending sales rose by 2.3% in August from July, the second-lowest on record, seasonally adjusted.
Compared to August in prior years:
- 2025: -3.8% (year-over-year)
- 2024: +1.1%.
- 2023: -2.4%
- 2022: -17.9%
- 2021: -38.0%
- 2019: -20.9%.
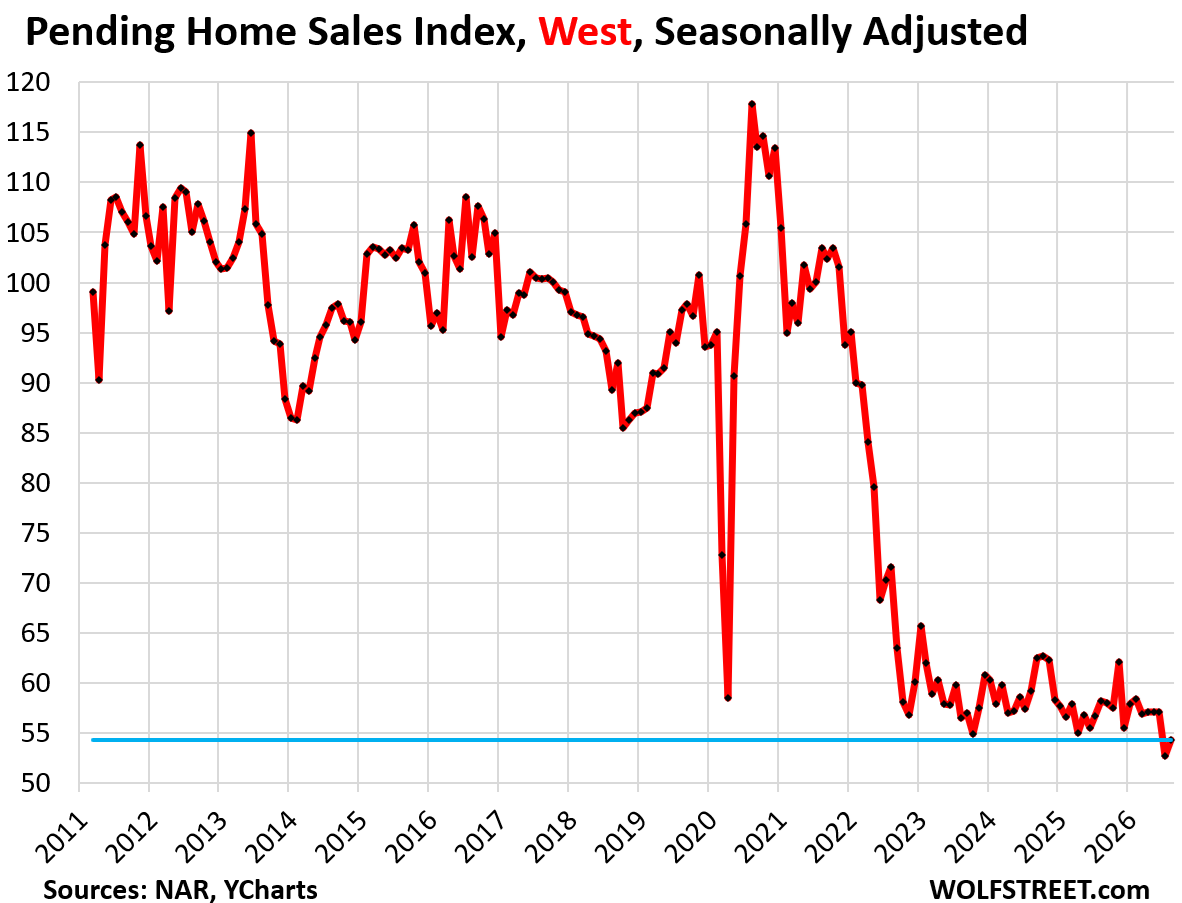
In the West, pending sales rose by 3.3% in August, to the second-lowest volume in the data, after plunging in July to a record low, seasonally adjusted.
Compared to August in prior years:
- 2025: -6.7% (year-over-year)
- 2024: -8.3%
- 2023: -3.9%
- 2022: -24.2%
- 2021: -47.5%
- 2019: -44.2%.

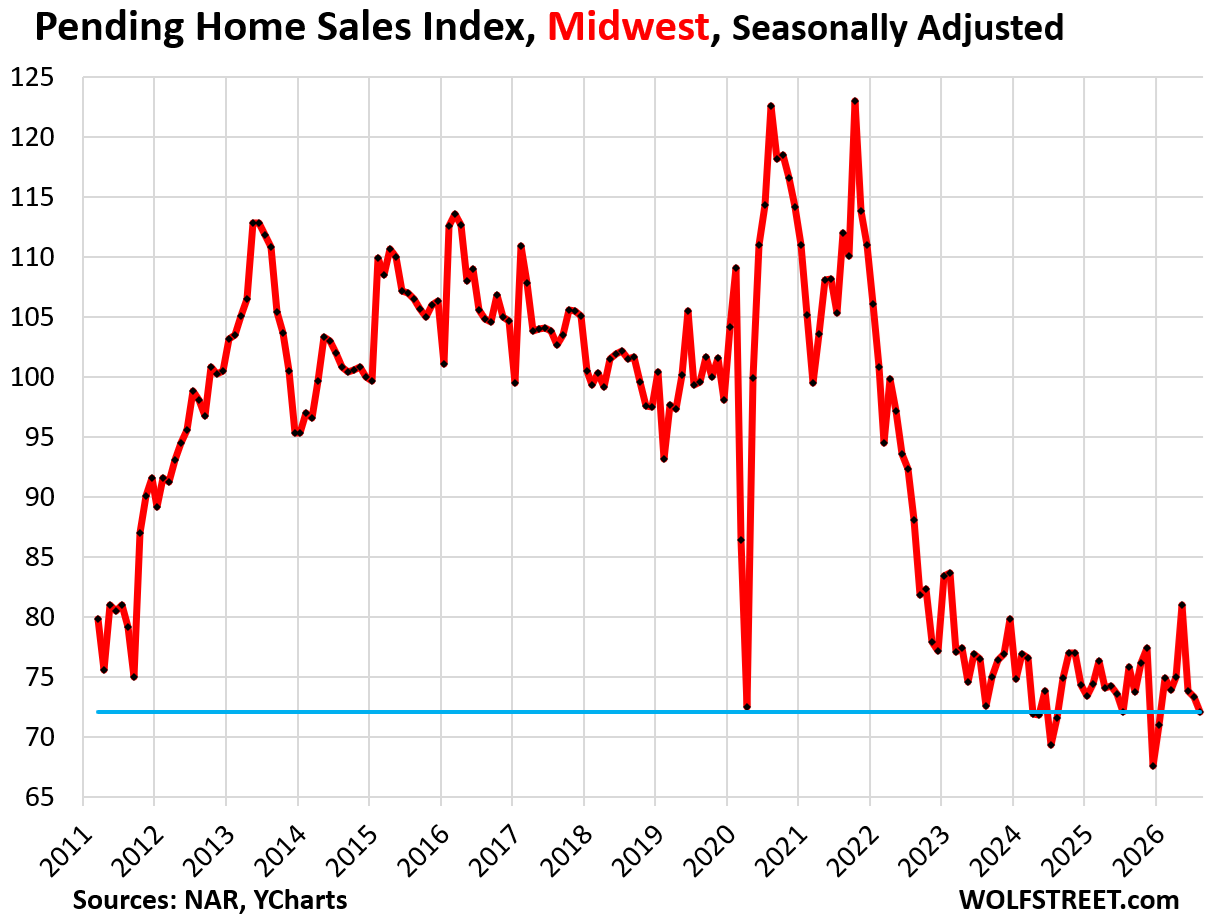
In the Midwest, pending sales fell by 1.6% month-to-month, seasonally adjusted.
Compared to August in prior years:
- 2025: -4.9% (year-over-year)
- 2024: +0.7%
- 2023: -0.7%
- 2022: -18.2%
- 2021: -35.6%
- 2019: -27.6%.
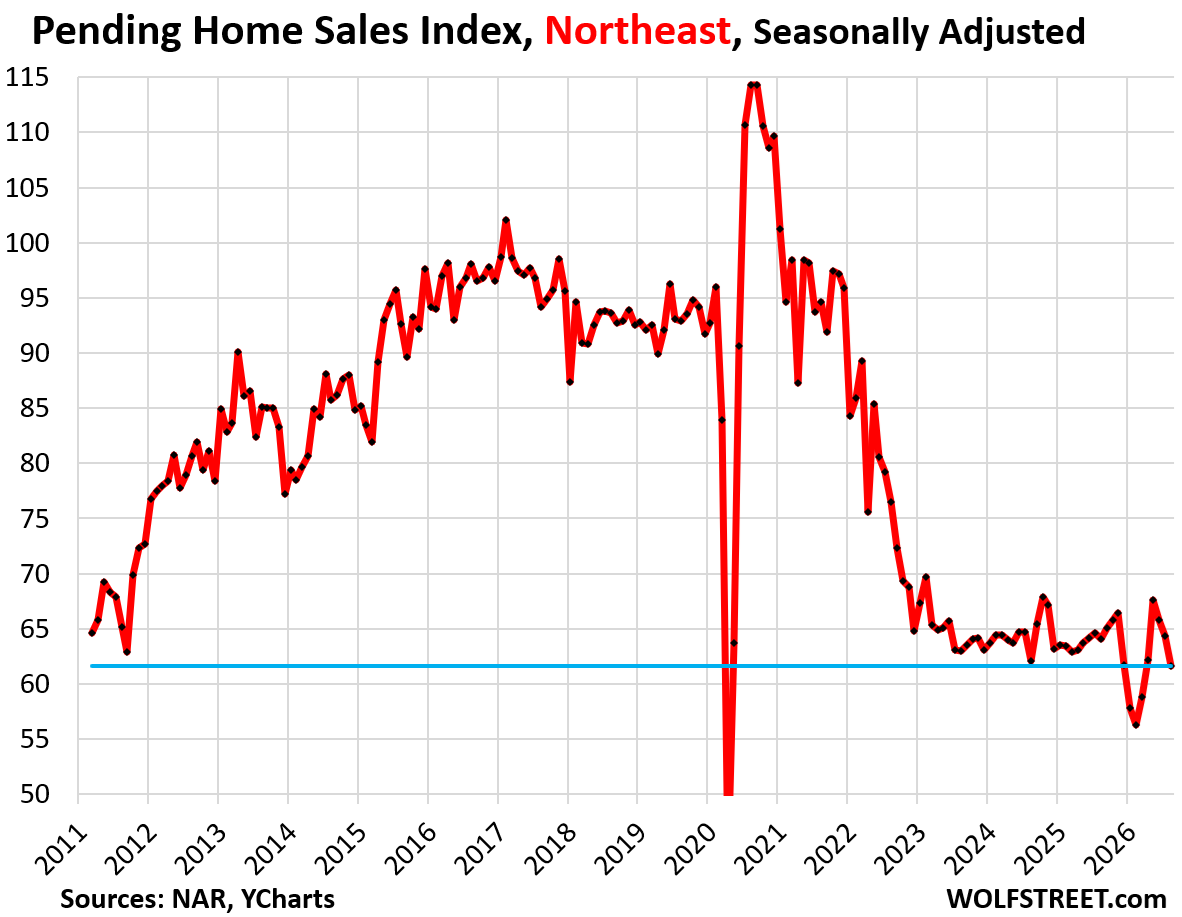
In the Northeast, pending sales fell by 4.2% month-to-month, seasonally adjusted.
Compared to August in prior years:
- 2025: -3.9% (year-over-year)
- 2024: -0.8%
- 2023: -2.2%
- 2022: -19.5%
- 2021: -34.9%
- 2019: -33.7%.
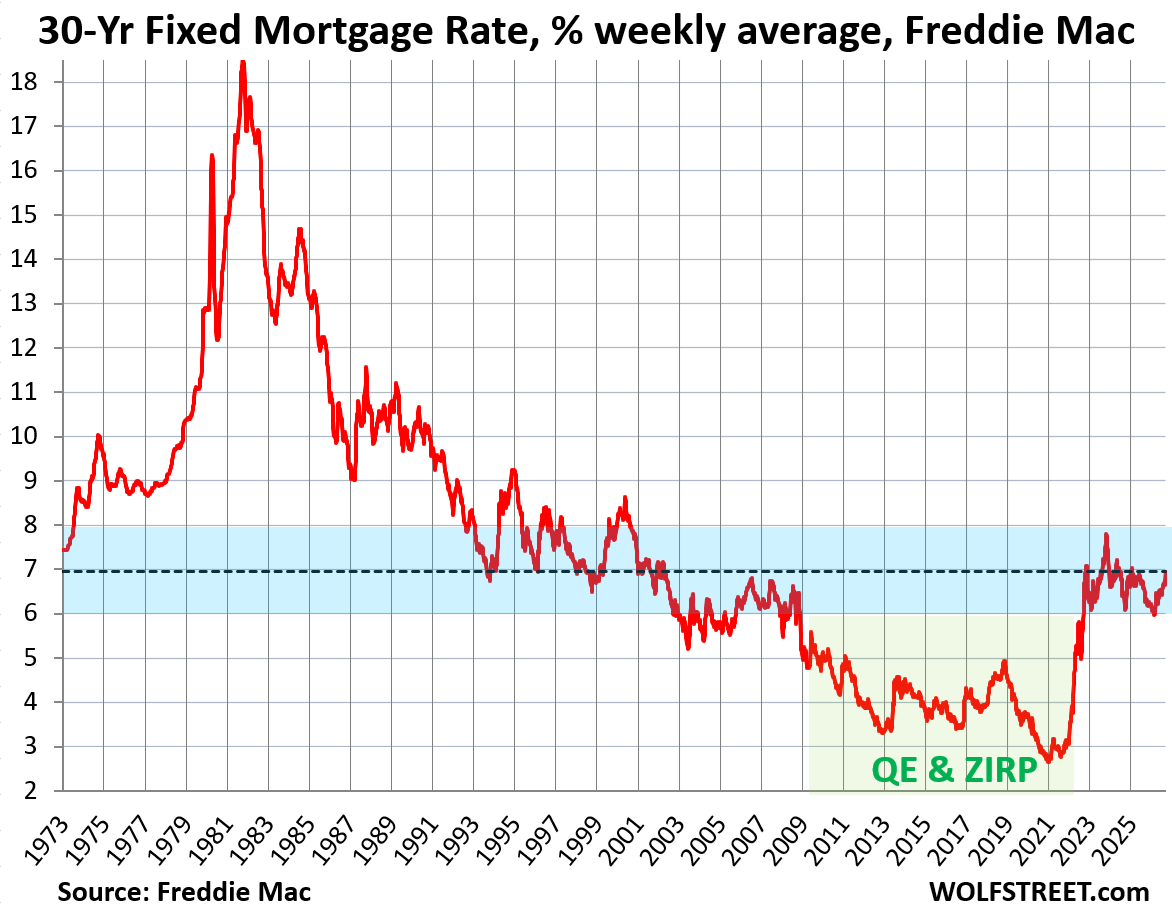
30-year fixed mortgage rates rose to a weekly average of 6.95% in the latest reporting week, according to Freddie Mac today.
The daily measure by Mortgage News Daily has been above 7% for several days and today is at 7.19%.
In August, when the contracts for these pending sales were signed, mortgage rates were still in the 6.5% to 6.7% range, per Freddie Mac data, and in the 6.7% to 6.8% range per Mortgage News Daily data.
Mortgage rates have been in the 6% to 8% range since September 2022.
These mortgage rates are in the lower portion of the range that prevailed in the decades before 2009, before the Fed’s QE and zero-interest-rate policy began to distort the markets.
So today’s mortgage rates are not too high. What’s too high is inflation and home prices after the home-price explosion from mid-2020 to mid-2022. These high home prices have inflated homeowners’ insurance premiums property taxes, and other carrying costs that drain consumer spending elsewhere, and have become a liability for the housing market and for the economy.
In case you missed it: Inventory of New Single-Family Homes Jumps, Prices Drop to Lowest since 2021, Sales Sag
Enjoy reading WOLF STREET and want to support it? You can donate. I appreciate it immensely. Click on the mug to find out how:


If I listen to any RE shills and their date the rate, marry the house BS, 3+ yrs later, this whole dating is turning into some serious abusive relationship…meanwhile the RE agent long made off with the commission at the top…
Oh I LOVE what you said out loud!!!
I hear you but sellers have been in the driver’s seat for years. The $500k married couple cap gains exemption turned primary homes into rigged slot machines. Yet I never hear sellers complaining for some reason….just blaming agents. For marginally savvy “investors” there are more tax avoidance rules baked into real estate tax law that any single person could ever understand. Ironically, I never hear much complaining about those schemes either.
“The rabbit done died” on “date the rate,” leading to a shotgun marriage to “Hell House.”
The question that needs to be answered is how can the asking prices continue to increase while the sales decrease. I think the Fed’s bloomers were exposed when Warsh pledged adherence to the concept of ” abundant reserves” in which the taxpayer pays the banks to hold an excess of reserves.
Well I think today’s market action make me think that the so called free market is a fraud
“So today’s mortgage rates are something close to a normal range or even low in a historical context. They’re not too high. What’s too high is inflation and home prices after the home price explosion from mid-2020 to mid-2022. These high home prices have inflated homeowners’ insurance premiums property taxes, and other carrying costs that drain consumer spending elsewhere, and have become a liability for the housing market and for the economy.”
Pretty much say’s it all…
All this is true, however, I have been a red seal carpenter for 45 years and know the cost of materials and labour. Until such time the cost to build new drops, it will remain the foundation for elevated home prices. When builders run out of tricks to keep them affordable, they will simply quit building them.
An option for new builds are factory produced prefabs and mobiles. They are built to code, 2X6 walls, well insulated, 200A service…. pre-wired, already plumbed, and pretty much okay. Owners can select or upgrade basic furnishings. The cost savings by building off site on a factory floor must be at least 50%. Think of trusses, which almost every builder uses these days for roof framing. Trucked to site and set up in just a couple of hours. It takes a several long days to cut and build a rafter roof system in place. Pre-fab housing can be set up ready to move in (always a few things to complete or change) in less than a week. 2 days to a week. I believe this option will gradually replace SFH inventory. Over time.
And no, I don’t live in one, but if I have to move to town when I age out of our lifestyle I would not hesitate. Right now it is a great option for first time buyers.
If factory prefab houses were really 50% cost savings, then the major builders would have been running those factories for years now.
Roof trusses have been made in factories for decades. Manufactured homes (even for cookie-cutter development plans) have been niche for decades.
Obviously there’s a reason factory houses haven’t caught on in a big way, and it sure ain’t be cause Lennar & DR Horton are allergic to cutting costs…
All this can be traced back to Bernanke’s Fed and his ZIRP and QE. It set the stage with negative real interest borrowing rates.
You will reap what the Fed sows, always.
Bernanke was following the Japanese route. After the bursting of the Japanese property bubble the authorities instigated QE and ZIRP. It acts as smoothing filter. Instead having a correction in a short of period of time the correction is extended over a longer period. In the case of Japan it has been 30+ years. Bernanke applied the same after the fraudulent mortgage bubble burst. Besides extend and pretend, these manoeuvres seem to have displaced the bubble into other areas , for instance: the yen carry trade; debasement of currency.
You have to take advantage when it’s offered. Like a lot of other homeowners, I refinanced at the rock bottom rate and then sat on the price pop. Did I need to refinance? No, but I did take another five years out of the bank’s amortization and never looked back.
The problem with interest rates is that our young people will adopt the athos of a poster in which two vultures apparently are tired of waiting for the meal too die.
in which one vulture says to the other. Fuck it I’m going too “”””””” something
See you guys in a next decade or so. I hardly doubt any (shopping craziness like covid era) changes in RE anytime soon.
Look the 30 year mortgage rate is finally back to it’s 50 YEAR AVERAGE.
Suck it up buttercups, rates can still go higher. The good news is that in a truly functioning market home prices will drop.
Few people realize this
You get a gold star!
The market has been so distorted since 0% interest rates (so much for the free markets….LOL) that and Trump’s executive order to discourage corporate investors from buying up large blocks of real estate (the free markets dont work so well when so much $$$ is in the hands of a few….)
However these interest rate hikes have to do the trick, can’t go from 3% loans to 7 (maybe even 8%) without something falling apart.
Despite what people say about how great the economy is (even with 25% of the population “functionally unemployed”) the math for the housing market makes no sense, most people do not make that much money (median income is in the $40k range LOL)
“(median income is in the $40k range LOL)”
Median “household income” in the US = $81,600 and this includes widows and widowers living by themselves on Social Security, young singles just starting out on their own, new immigrants, etc.
For married couples — these are prime home buyers — the median household income = $120,200.
All data from the just now updated Census Bureau US income and poverty data.
““(median income is in the $40k range LOL)”
A truly, “was it over when the Germans bombed Pearl Harbor?” moment. Let him go, Wolf, he’s rolling.
The problems happened when rates went from 7% down to 3%!
Pulling a decade or more of historical price gains in real estate into three years (2020-2023) is the real issue.
Reversion to the mean will take 3-6 more years.
Just have the FED pay off all existing outstanding mortgages…Viola, you get all the votes…they could do this but the inbreds rather have hyperinflation and leave the lower classes to go get slaughtered in their engineered wars…for profit….Greenspan…burn all the inventory was his solution…america can’t go broke it has a printing press… Buffet…low vibration institutional dogma…
“Just have the FED pay off all existing outstanding mortgages…Viola, you get all the votes…they could do this but the inbreds rather have hyperinflation and leave the lower classes to go get slaughtered in their engineered wars…for profit…”
WTF? You can’t be serious. Why should speculators and asset holders get financially rewarded with free assets? What about renters? You are screwing “the lower classes.” F**k your idea.
It really is a battle of wills of who will break first between buyers and sellers.
With growing inventories and high interest rates as headwinds for the sellers.
Plus holdings costs. The alligator will eat sellers alive when they absolutely have to sell (job transfer, divorce, death, downsizing, etc.)
As a Millennial I see two ways to look at this:
Glass half empty: “I’ll never be able to afford a house.”
Glass half full: “I’m doing my part!”
Your red-lined charts above show that pending home sales are at depression levels. With home
prices in the stratosphere, something is not right!
A serious recession is now the only cure for this chronic inflation, plus the repeal of all of this administration lame policies on trade, etc.
Only the wealthy are buying, which skews the median higher since they only shop the tony zip codes.
So are we finally going to see some declines in home prices? I know after 4-5 years from the peak some places are down 10% ish but really 1-2% down a year doesn’t help anyone.
Don’t forget that inflation has been running at least 3-3.5% a year for the past five years. That’s an effective -20% over that time period, although that still only gets prices back on line with their too-fast growth from before prices went haywire.
Nothing in housing moves very quickly, it took five years after the last housing crash for it all to bottom out. Let’s hope this crunch keeps going another two or three years.
Also anecdotally I’ve noticed a trend of childless millennials selling their houses and moving back into apartments or sf rentals saying that home ownership was “too expensive” and “too much work”. These were all professional high income individuals who were just over it.
Thing is high home values just mean higher property taxes and higher home owners insurance. Inflation just makes everything more expensive to fix. Meanwhile rents in Denver which are still very expensive, are still significantly less expensive than a mortgage. I’ve heard a similar thing about CA my sister and her husband rent a place for $5500/month that a mortgage with property taxes and home ownership would be about double.
“I’ve heard a similar thing about CA my sister and her husband rent a place for $5500/month that a mortgage with property taxes and home ownership would be about double.”
I am in Southern CA and buying homes at these levels is insanity. You can spend half the money to rent a similar place.
“I am in Southern CA and buying homes at these levels is insanity. You can spend half the money to rent a similar place.”
Indeed. Same as just before the last bust prior to the GFC. At some point the economy will run out of funny money and we’ll see the housing market tank nationwide. Las Vegas dropped over 70% during the GFC, if memory serves.
That’ll be a fun one to watch, as I’m sure many Angelinos bought infestment properties in LV just like last time, and eventually that crash will bleed into the general economy and we’ll see fire sales everywhere, including the LA basin where I moved to a couple years ago. Thankfully I rent and live close to home.
Keeping powder dry to eventually buy somewhere outside Clownifornia.
“I am in Southern CA and buying homes at these levels is insanity. You can spend half the money to rent a similar place.”
And when the HVAC unit goes t!ts up, you call the landlord and tell them to get it fixed PRONTO, on THEIR dime. $15k later and you are sleeping like a baby while they watch a year’s worth of profits evaporate, while their equity does the same as house prices skid….
Living out in flyover, it is fascinating to read the comments from the coastal dwellers. 5500/month is cheaper than home ownership.
Were do the peasants live? It must be multi generational all under one roof?
Coastal CA is becoming a true dystopia over time. Lot of rich people with money and peasants in low paying service jobs crammed up in small homes to serve rich people.
Vail, Co.
Tahoe.
“5500/month is cheaper than home ownership.
Were do the peasants live? ”
$5.5k? Those ARE the peasants.
So I a post of a real estate investor I also read basically implying rate hikes were good for the real estate market long term. He didn’t outright say recession but the impression I got from the post was it’s now accepted that we need the recession we adamantly avoided in 2022. A recession will create forced selling and price normalization.
The reason I found it interesting was this a 180 on his stance from about a year ago.
I think it’s now accepted we need to raise rates until we hit a mild recession.
Of course will we get mild recession? Or something worse with the stock market and margin at all times highs? TBD. Depends how many interconnected dominos there are.
Central Banks have prohibited normal business cycle which includes recession.
Wolf,
Who really cares about sales, unless you’re a realtor or mortgage broker?
Prices are what’s on everyone’s mind.
The sales data illustrates how frozen the housing market is due to those high prices.
Sellers care about sales. Without sales, not sellers. How are you going to sell your house?
Families that need to be mobile care about sales. Want to take a new job in a different city to advance your career? Try to sell your house. People care about sales.
There are always buyers if the price is right except most sellers are holding onto 2022 prices even if they bought before the bubble. These sellers may want to move, but if they drop their prices, but other sellers don’t, they have less buying power. Those that really need to sell such as estates, divorces and relocations set realistic price expectations.
Off-topic but I’m wondering how the “national debt service as a percentage of government revenue” graph looks for various other countries? (Japan, Germany, France, Italy…)
Basically trying to answer the question – If rates increase globally, which nations will feel the most (or first) fiscal pain?
I know it won’t be Iceland.
“Collapse in sales”. Previously immigrants would move in… mostly at the bottom. Those at the bottom would move up one rung. Those on the second rung would move up to the next higher 3d rung. With less push from the bottom few can move up.
Solution? Deport those who murder, …DUI. Drunk n Disorderly. Do not deport those who work hard, take care of family, sit beside us in church.
Sellers in desirable areas near Portland have been cutting prices for months. However, this is generally happening with homes priced around $900,000 or more, which seems to be the market’s current breaking point.
I know@Wolf has shared this chart in the past, but I find it fascinating to look at real interest rates over the last decade when we are having the conversation about pending home sales.
What that charts shows is why home prices exploded from mid-2020 to mid-2022, because real mortgage rates turned steeply negative up to -4% at the worst month, which was better than free money, and when money is free, prices don’t matter. This was a very sordid portion, perhaps the most sordid portion, of the history of the Fed’s monetary policies. Powell presided over it and was the architect of it.
Some other food for thought. We’re seeing housing price declines at full employment, with a stock market at all times highs.
What happens if the stock market drops? Or if unemployment goes up to 5%?
In the words of Mark Twain, history doesn’t repeat itself, but it does often rhyme.
Everyone I meet who graduated 2012 or later is pretty optimistic and says stuff like housing only goes up/it’s gonna double in 5 years, the stock market is going to return 20% annualized forever, if something happens the govt will step in. Most people who graduated before 2012 seem to be more cautious, always have an emergency fund and tend to avoid living at the very edge of their means. I think part of the excess is we have a generation that hasn’t really struggled/is too young to remember.