
Not even sky-high gasoline prices could dent their spending on bars & restaurants, ecommerce, cannabis stores, etc.
By Wolf Richter for WOLF STREET.
Gasoline prices soared in August, and consumers continued to buy gasoline, but paid much higher prices, and so sales at gas stations in dollars (not gallons) also soared and pushed up overall retail sales, which spiked by 1.2% in August from July, to $773 billion, seasonally adjusted, and were up by 6.0% year-over-year, according to data from the Census Bureau today.
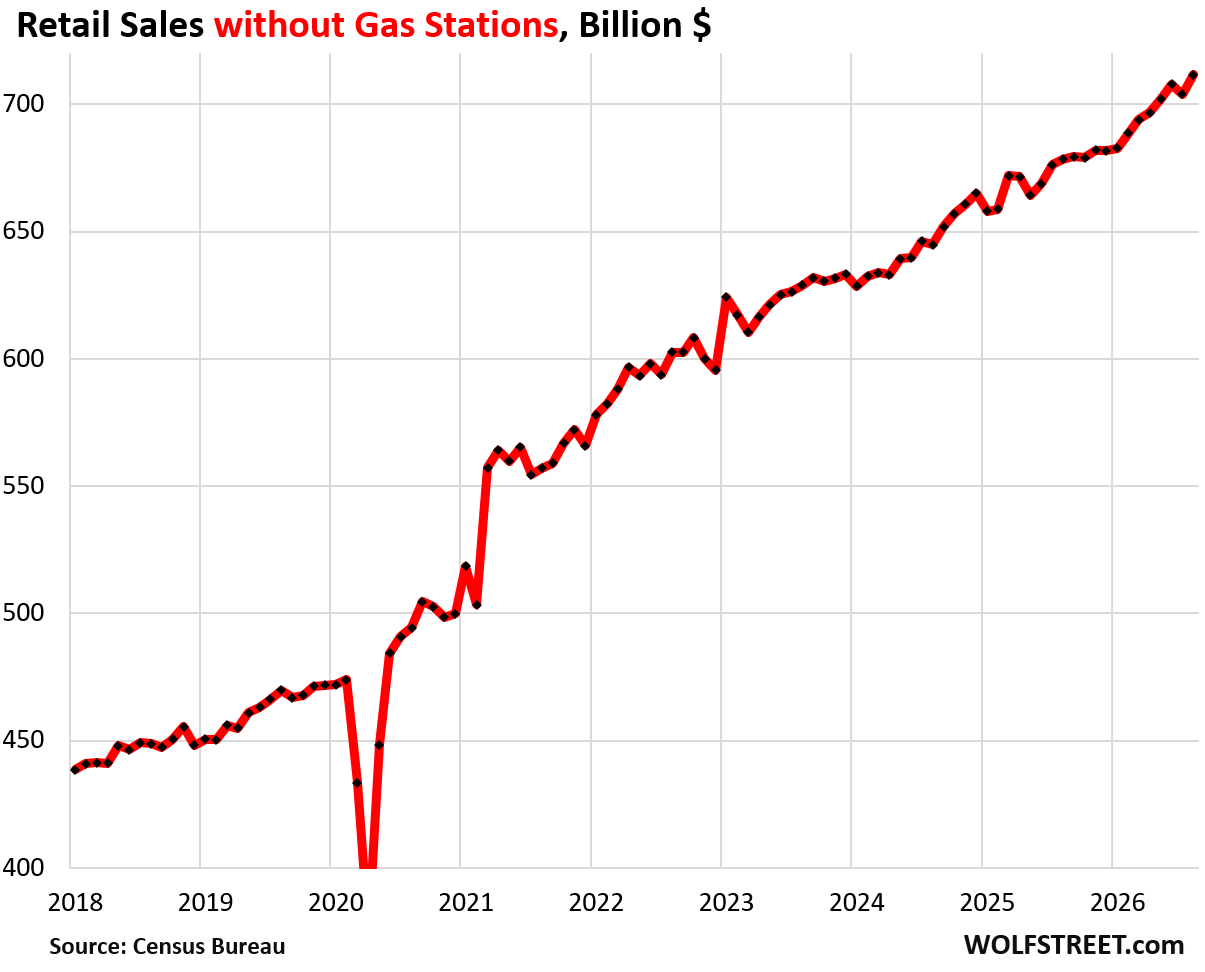
But even without gas station sales, retail sales spiked by 1.1% seasonally adjusted in August from July, and rose by 4.9% year-over-year.
It’s not all based on Americans suddenly throwing their entire inheritance at retailers. Part of the month-to-month increase in August was due to the effect of recapturing the drop in July that in turn was due to Amazon Prime Day having shifted into June this year, from July last year, made worse by quirky seasonal adjustments, which we discussed at the time, and today’s jump wasn’t a surprise here. But it shows that spending at retailers continues growing at a solid rate, even without gasoline sales, and despite the gasoline price spike.
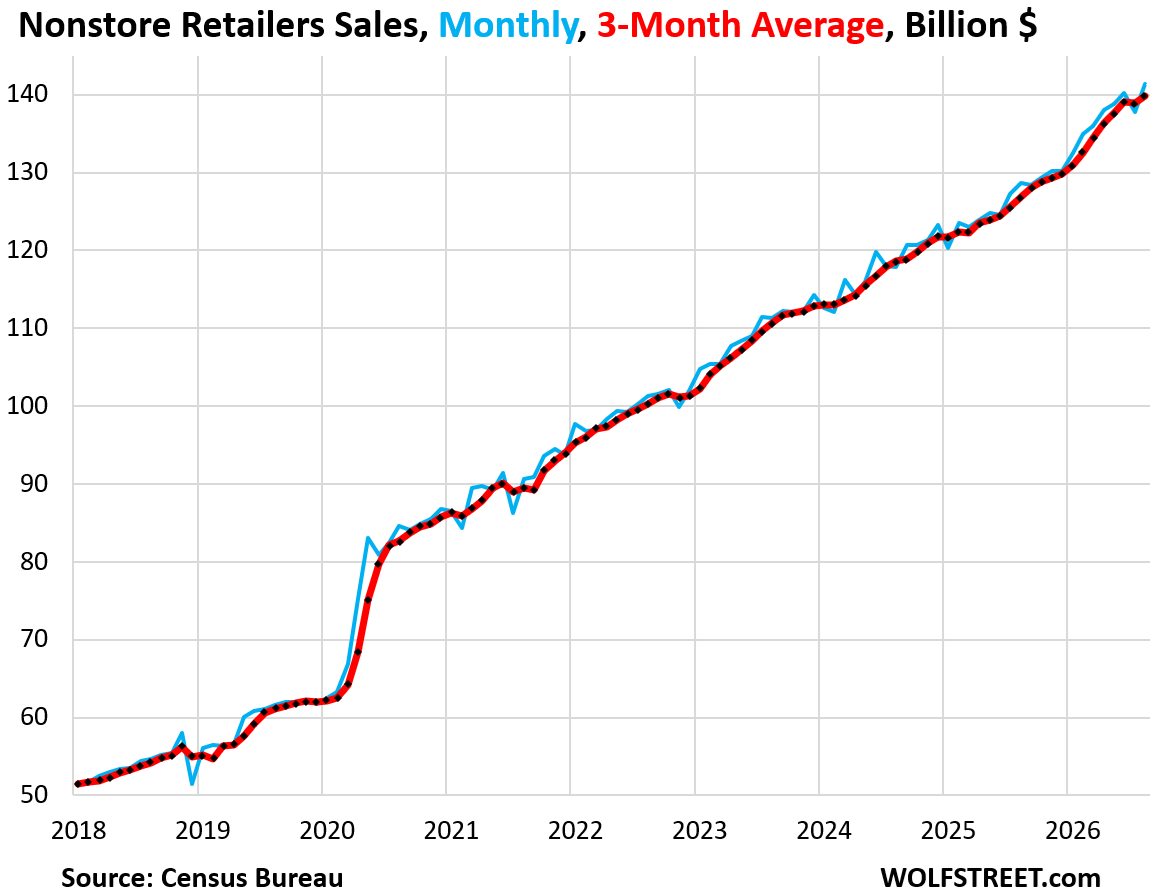
Ecommerce sales spiked by 2.6% in August from the misbegotten July, and by 10% year-over-year (blue line in the chart below).
July was misbegotten because Amazon Prime Day had shifted into June, from July last year, shifting the spike in sales to June, and then July sales declined from the spike in June, made worse by seasonal adjustments. August sales were back on the normal blistering growth path.
The three-month average irons out those squiggles. It rose by 0.6% in August from July, and by 10% year-over-year.
Ecommerce continues to hit it out of the ballpark, taking share away from brick-and-mortar stores. It has become the #1 category of retailers on a 12-month basis, with a share of 18% of total retail sales, ahead of motor vehicle dealers.
Ecommerce sales include sales by the ecommerce operations of brick-and-mortar retailers, such as Walmart, one of the largest ecommerce operations in the US, Macy’s, Costco, Target, and all the others. Even grocery sales are migrating in more consequential numbers to ecommerce, including to larger regional online-only grocers.
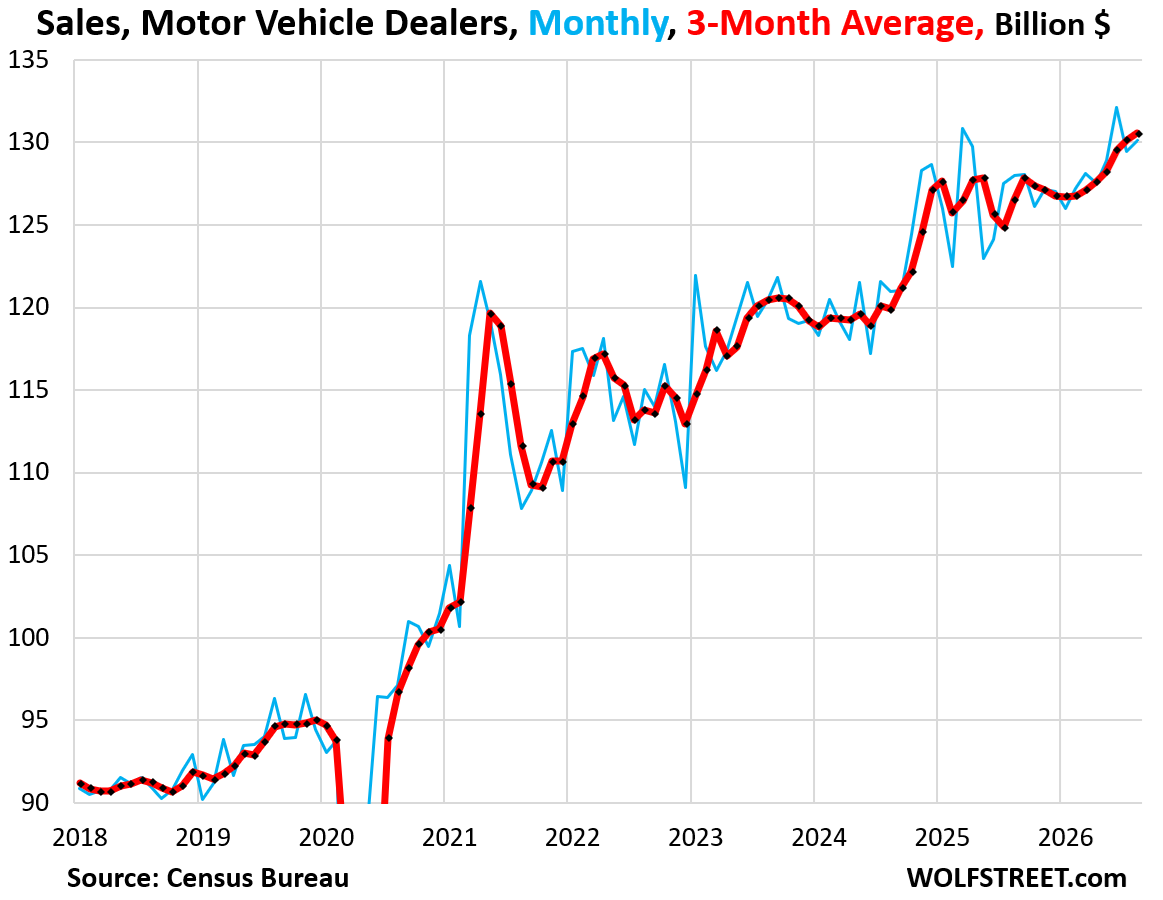
Sales at motor vehicle dealers rose by 0.5% in August from July, and by 1.7% year-over-year, to $130 billion, seasonally adjusted (blue in the chart below).
The three-month average rose by 0.3% month-to-month and by 3.2% year-over-year (red).
Motor vehicle dealers include auto dealers plus dealers of motor cycles, RVs, ATVs, snowmobiles, etc.
They had been the #1 category of retailers for a very long time, but like other retailers, have lost ground to ecommerce and were surpassed by ecommerce during the current 12-month period, and their share dipped to 17% of total retail sales on a 12-month basis.
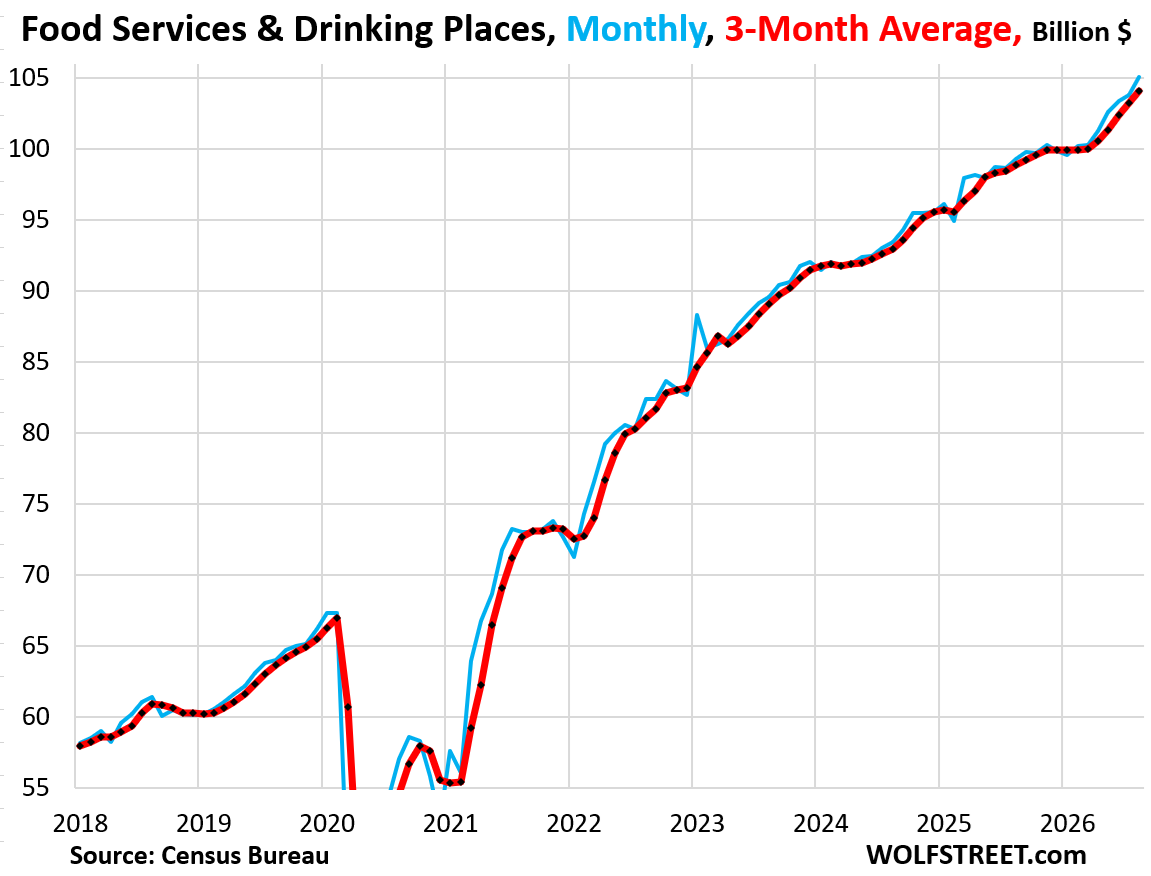
Sales at restaurants and bars spiked by 1.2% in August from July, to $105 billion, seasonally adjusted, and were up by 5.8% year-over-year (blue).
The three-month average jumped by 0.8% month to month and was up by 5.3% year-over-year (red).
Consumers are splurging on experiences. Sales at these “food services and drinking places” are a barometer of consumer discretionary spending, of doing stuff because they want to, not because they have to, and it has become the #3 largest retailer category with a share of 12% of total retail sales.

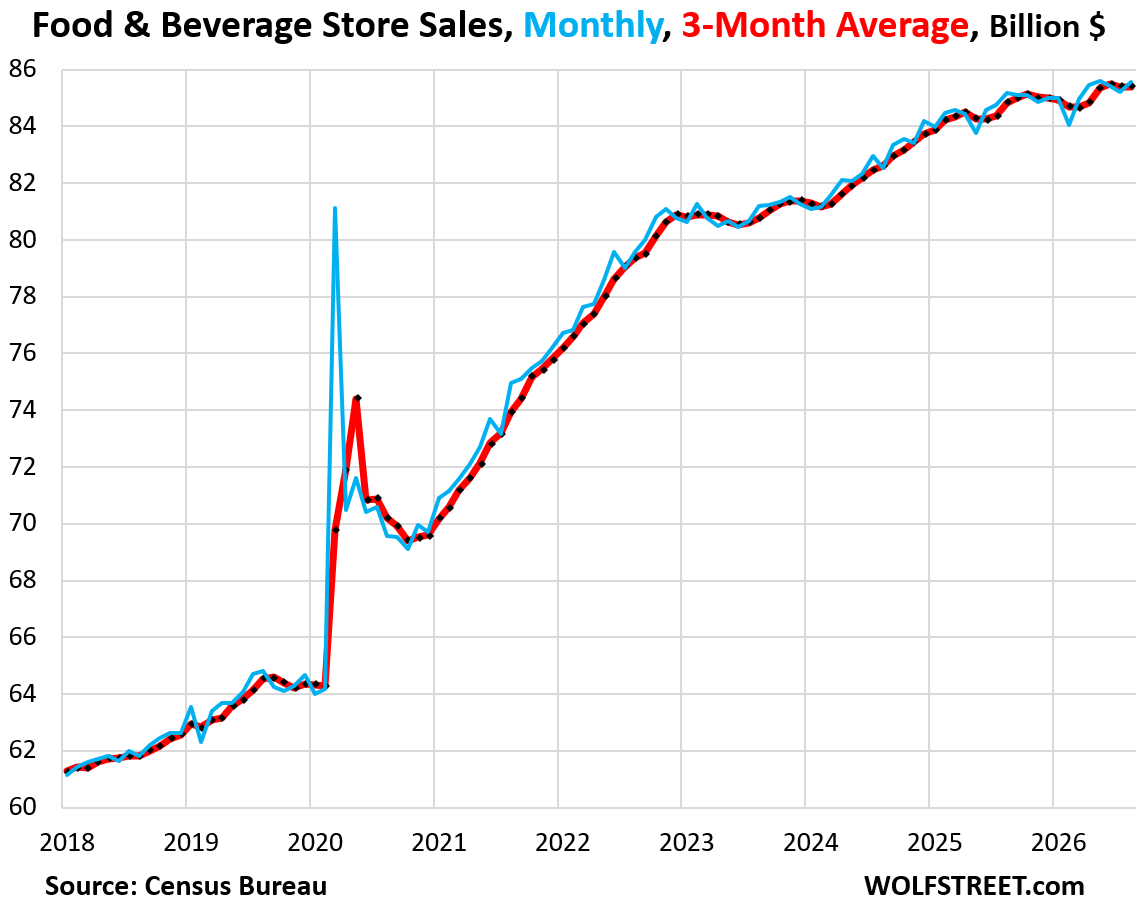
Sales at food and beverage stores rose by 0.4% month-to-month and edged up by 0.5% year-over-year, to $86 billion, seasonally adjusted.
The three-month average was flat month-to-month and up by 0.7% year-over-year.
Grocery stores have been getting hit for years from all sides: Sales have migrated to “general merchandise stores,” such as Walmart, now the largest grocery seller in the US, and Costco, which are in the “general merchandise stores” category below. More recently, sales have migrated from brick-and-mortar grocery stores to ecommerce (see above).
Food purchases have also wandered off to restaurants (see above). Spending in restaurants began to exceed spending at food and beverage stores in 2019, and the gap has dramatically widened since then.
And their share has declined to 11.3% of total retail sales. These stores are still the #4 largest category, but are losing ground rapidly to general merchandise retailers and will likely be surpassed by them in a couple of years.
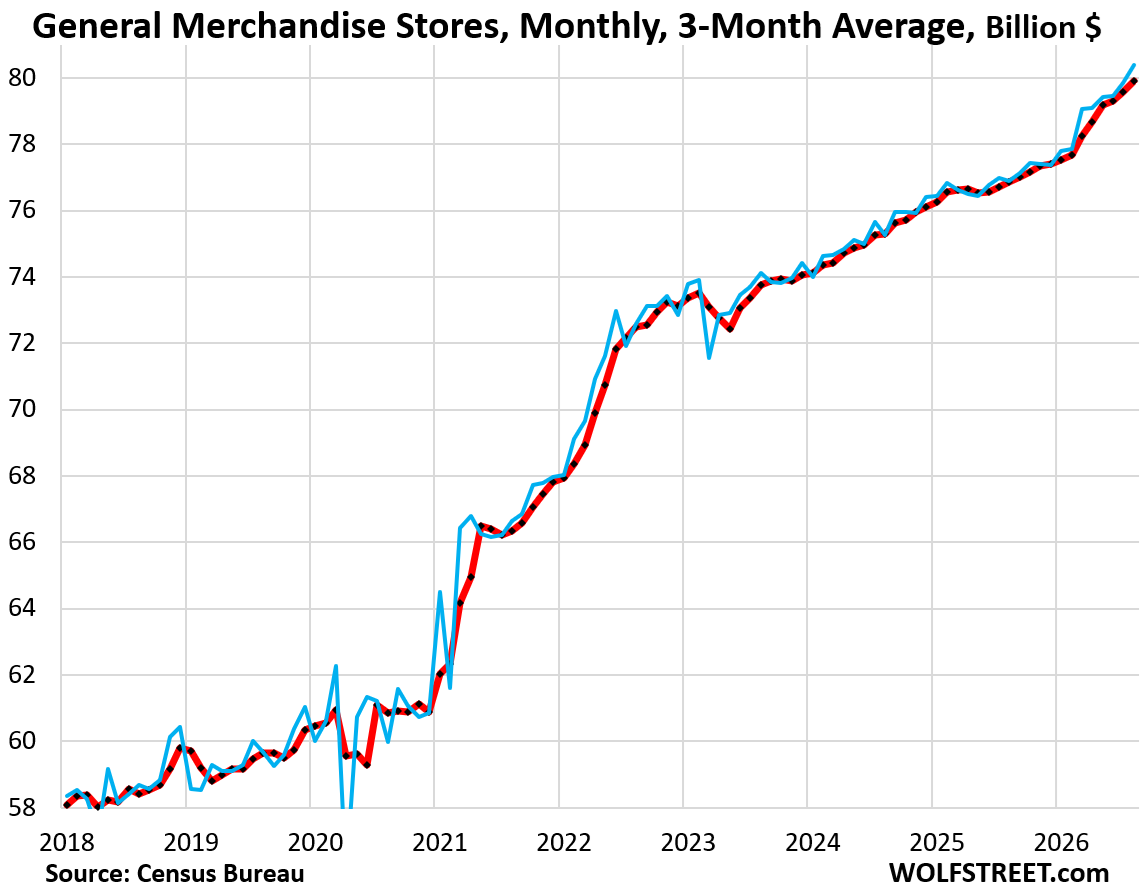
Sales at general merchandise stores rose by 0.7% month-to-month and by 4.5% year-over-year, to $80 billion, seasonally adjusted (blue).
The three-month average rose by 0.4% month-to-month and by 3.9% year-over-year (red).
This #5 category of retailers, with a share of 10.6% of total retail sales, includes the brick-and-mortar operations of Walmart, the largest grocer in the US, and its food sales are included here, and not in sales at “food and beverage stores.”
But it excludes the huge ecommerce operations of general merchandise retailers; they’re included in ecommerce.
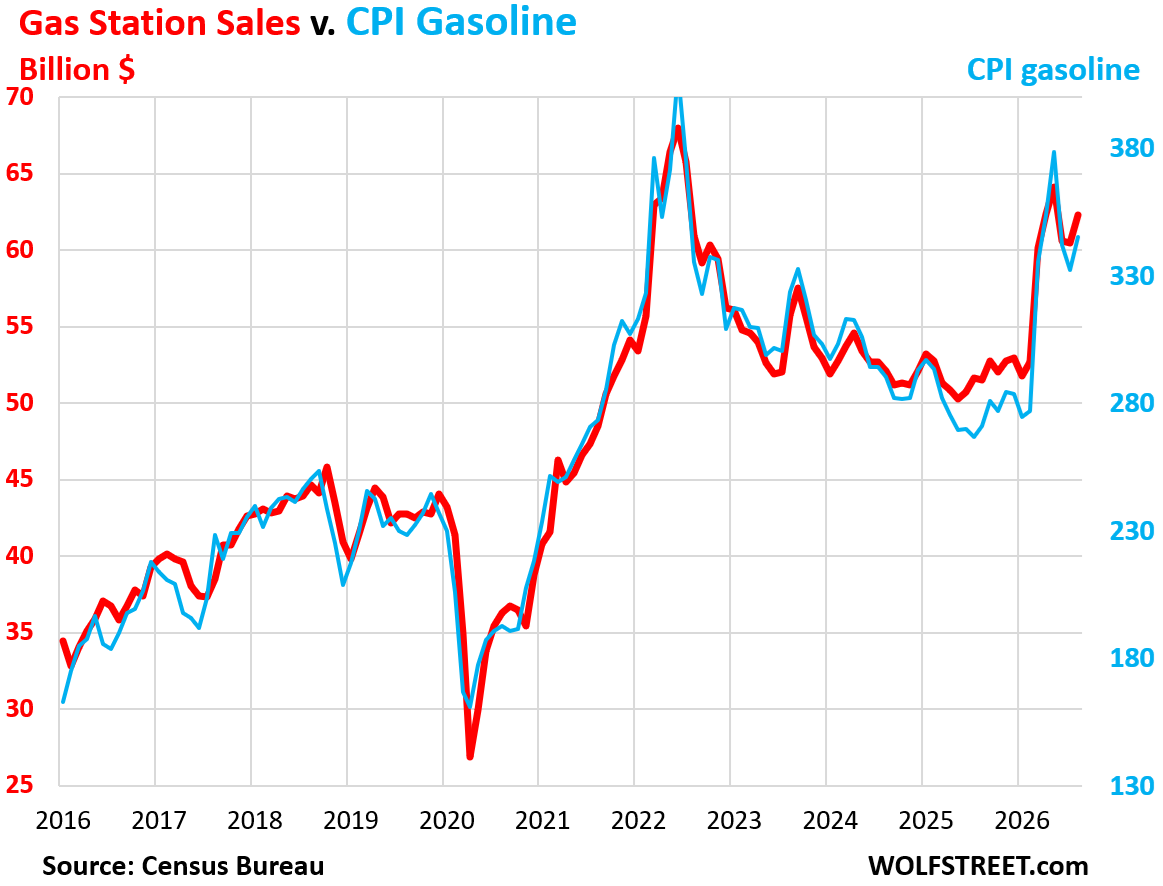
Sales at gas stations move in near-lockstep with the price of gasoline. The price of gasoline spiked in August, and so sales at gas stations, measured in dollars not gallons, spiked by 3.1% in August from July, and by 21% year-over-year, to $62 billion, seasonally adjusted.
The chart shows sales at gas stations, seasonally adjusted, in red (left scale), and the CPI for gasoline in blue (right scale).
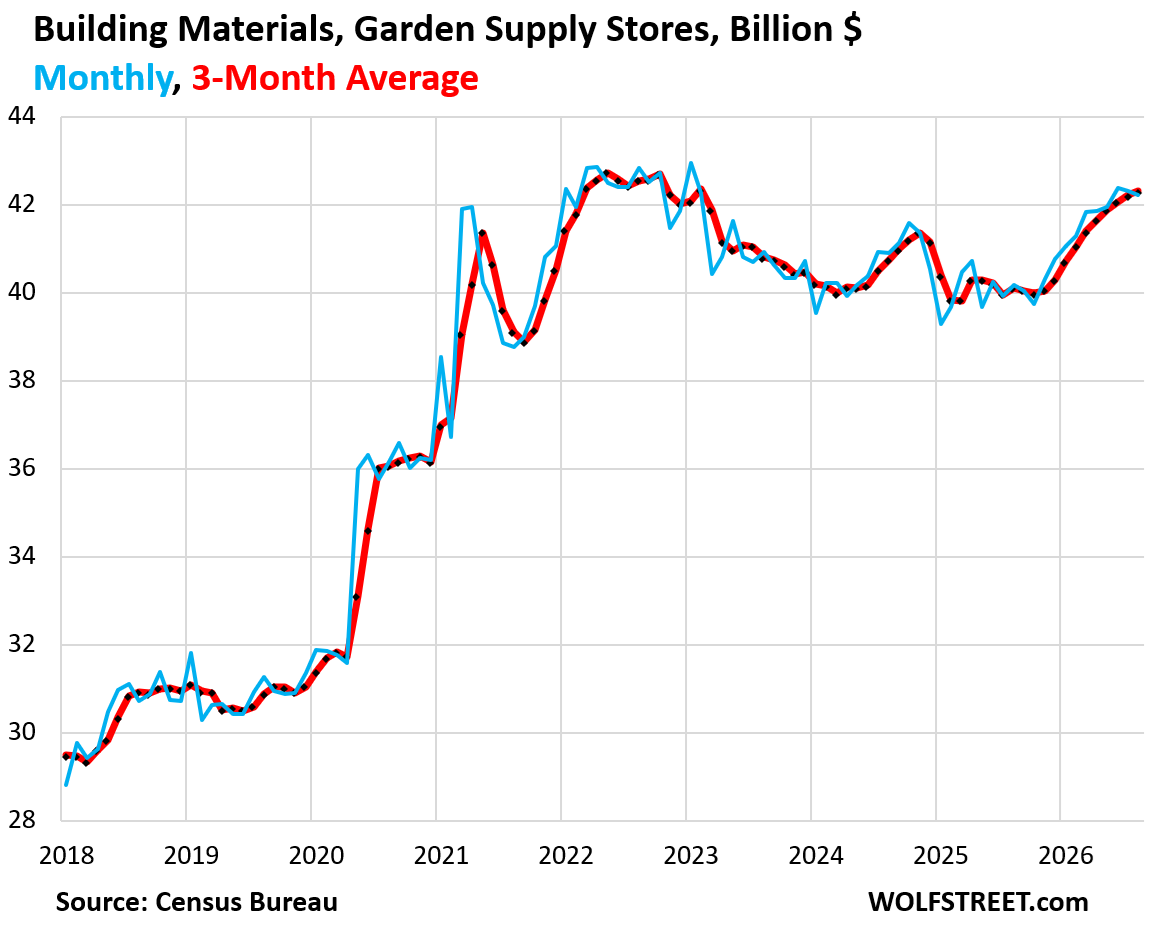
Sales at building materials, garden supply and equipment stores fell by 0.2% month-to-month to $42 billion, but were up by 5.1% year-over-year (blue).
The three-month average rose by 0.2% month-to-month and by 5.6% year-over-year.
The pandemic boom and then the decline back to long-term trend, and the increase this year is illustrative of the effects of the stimulus payments and lockdowns, combined with soaring prices, when spending on home improvements exploded, followed by a years-long trend back to normal.
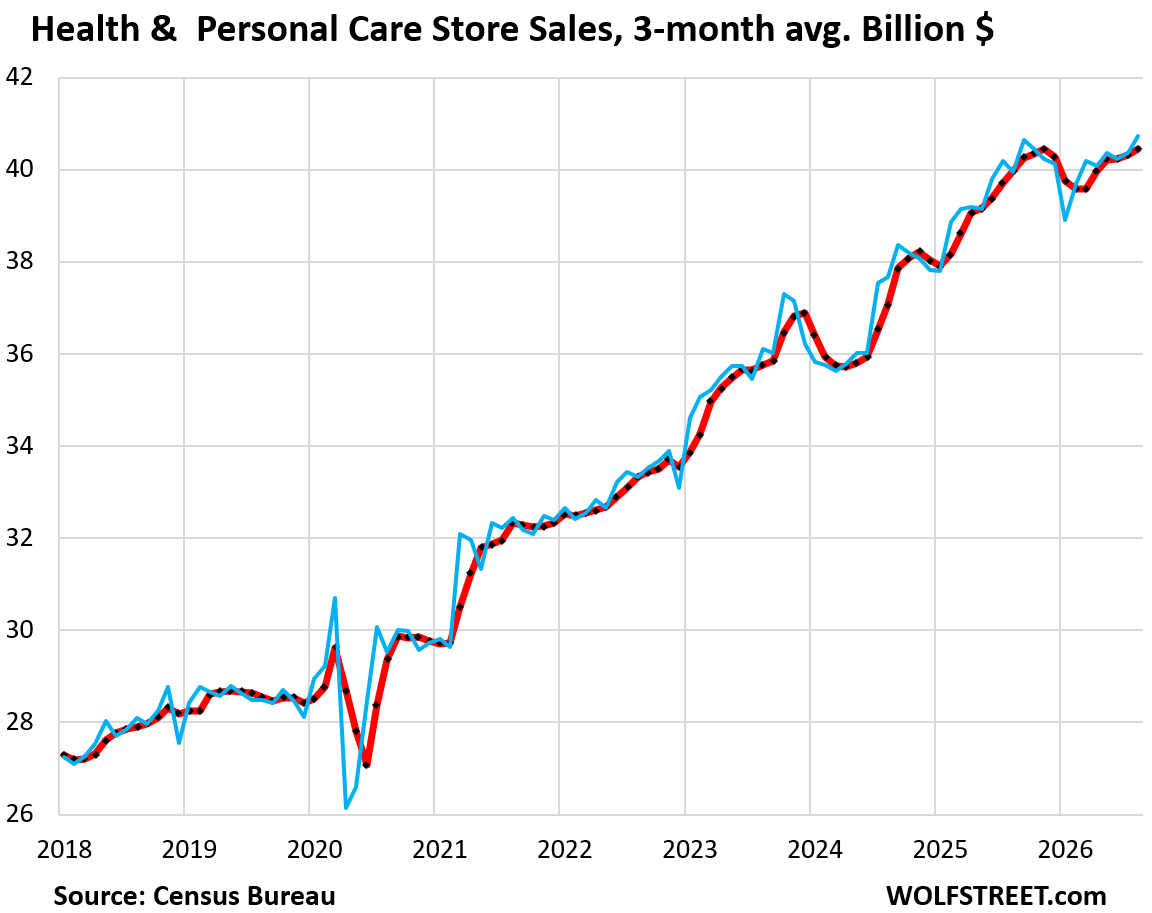
Sales at health and personal care stores jumped by 0.9% month-to-month, to $41 billion seasonally adjusted, and were up by 1.9% year-over-year.
The three-month average rose by 0.3% month-to-month, and by 1.1% year-over-year.
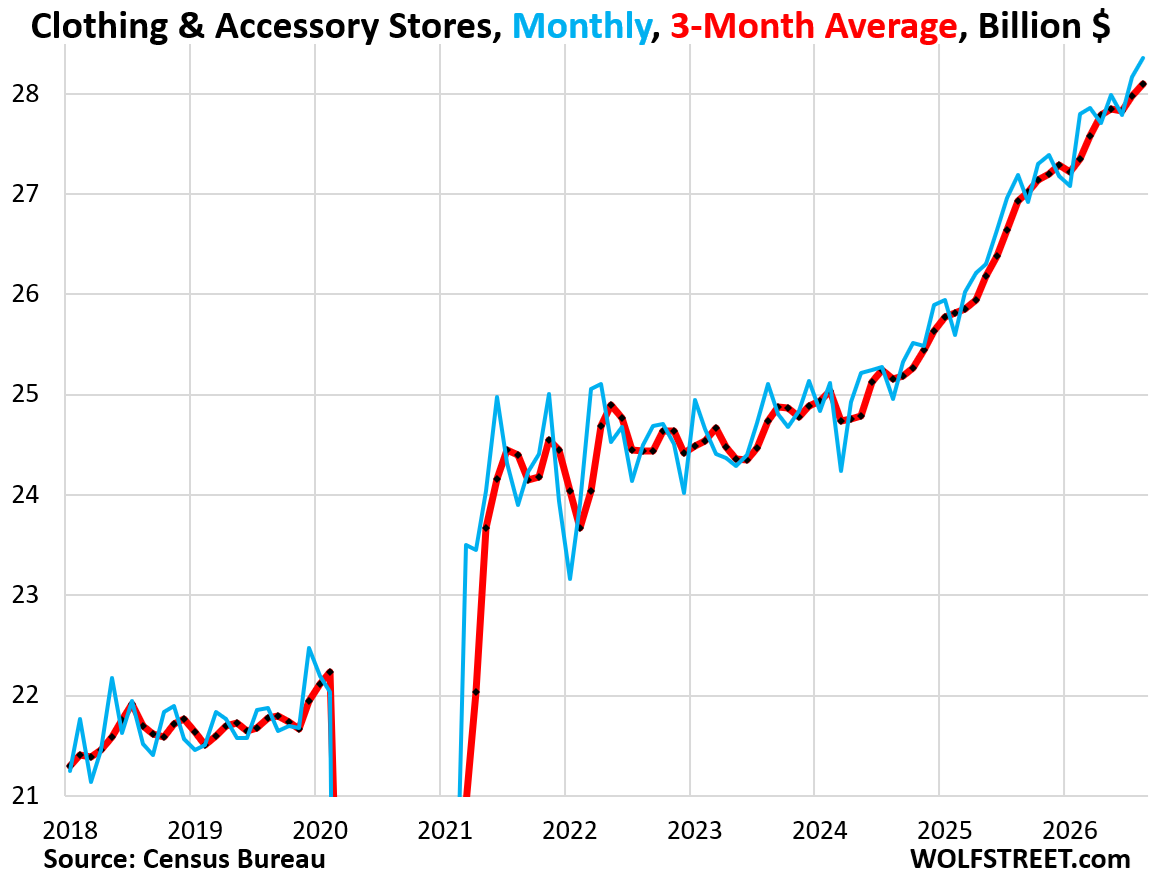
Sales at clothing and accessory stores rose by 0.7% month-to-month and by 4.3% year-over-year, to $28 billion.
The three-month average rose by 0.4% month-to-month, and by 4.3% year-over-year.
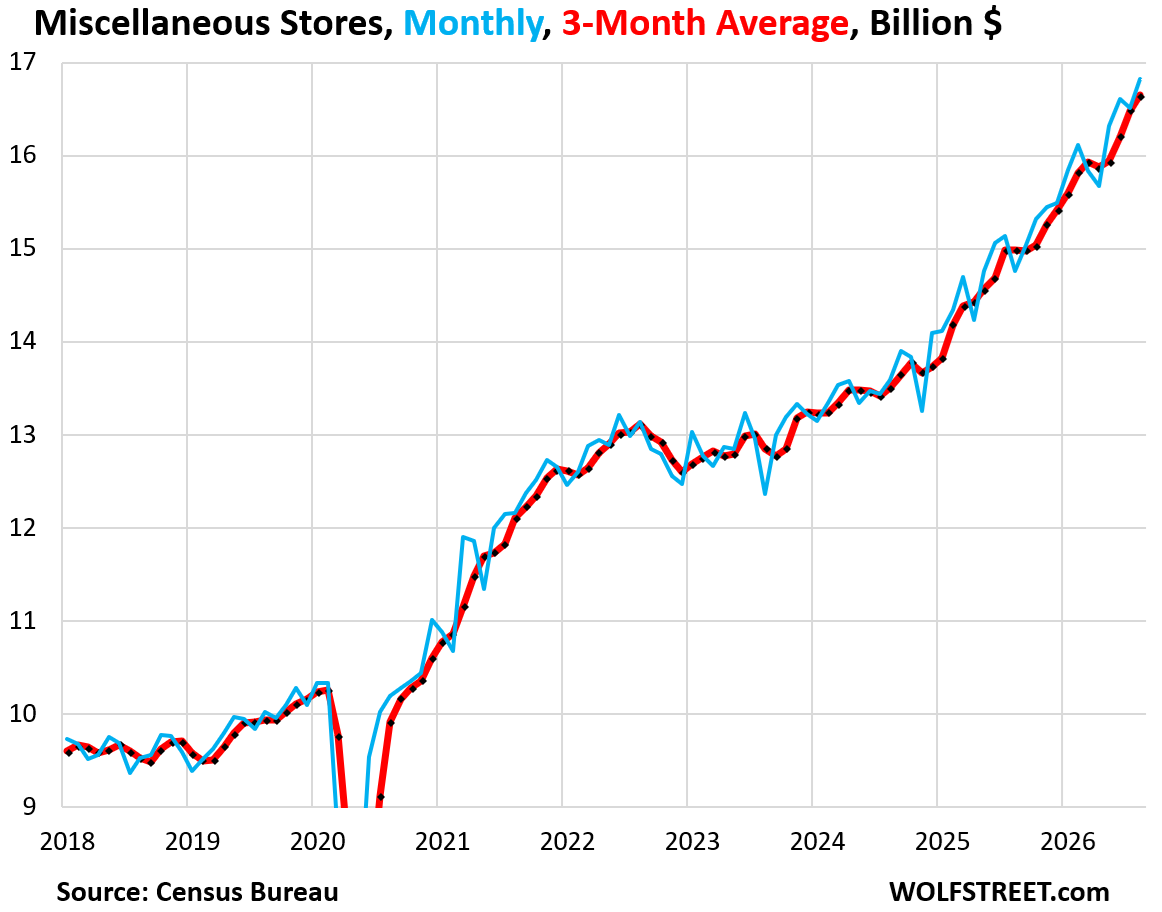
Sales at miscellaneous store retailers spiked by 1.8% month-to-month and by 14.0% year-over-year, to $17 billion, seasonally adjusted.
The three-month average spiked by 1.1% month-to-month, and by 11.1% year-over-year.
This category includes cannabis stores, which explains the multi-year massive surge in sales.
In case you missed it: Money-Market Funds & CDs: Americans Pile on Low-Risk Investments despite so-so Yields & Higher Inflation
Enjoy reading WOLF STREET and want to support it? You can donate. I appreciate it immensely. Click on the mug to find out how:


So much for the “Americans are broke” shibboleth.
As for the impact of gasoline prices on retail sales, not only is Amazon, etc. reducing miles driven to shop, Amazon’s delivery fleet is all electric (though I’m unsure of what energy sources they use to recharge) so largely immune to oil shocks.
Just a thought…
Amazon has many EV delivery vans, but that’s still a minority of its delivery fleet.
More importantly: Amazon depends on long-haul transport as much as any other logistics company (semi-trucks, containerships, airplanes), all of which consume petroleum.
So Amazon is not comparatively disadvantaged by fuel costs… but it’s also not immune.
Yep,even in challenging times folks want to enjoy life,I am also guilty of this.
I went to not one or two but three concerts all in a week,was reliving me youth to a degree and just trying to keep a smile wiped on me face.
i am frugal but not cheap,and certainly not cheap when it comes to having some fun in life as me phrase has always been “Live for today/Prepare for tomorrow”.
I have certainly done my part. As we throttle our business down to a
very limited contractor list, we have spent like drunken sailors.
Work on the shop, and my run around retirement vehicle being the
big purchases.
Our sales volume is down quite a bit. But the vehicles we are selling are the expensive ones, so profits are up. The people who have money are still buying the high end of the product line.
“Our sales volume is down quite a bit. But the vehicles we are selling are the expensive ones, so profits are up. ”
Hmm.
Your profit *margins* are up.
But if the sales volume decrease has fallen enough, and the per vehicle profit is insufficient, then the *total amount* of your *total* profits are down.
I’m sure that you are completely aware of this.
It is just hard to tell the reality from how your post was worded.
And it is mainly significant in the much larger, macro scheme of things.
Many/most/nearly all auto makers seem to have been getting more and more comfortable, selling fewer and fewer units, for higher and higher amounts.
Which is fine, except that it runs contrary to the mass production orientation that resulted in American macro success from the Model T on.
And gives the vast majority of people/buyers less and less reason to view manufacturers as allies – as most buyers don’t share in the productive progress of the manufacturers. Buyers are just a group to whom the screws are being applied.
Which is fine, it is a free market.
But, like everything, it has consequences.
US automakers have done this for decades. Sales volume for them is way down from the year 2000, but they have gone upscale, selling expensive vehicles with huge profit margins, such as $100,000 pickups. It’s a Wall Street inspired strategy that has opened the market to Hyundai-Kia that has been cleaning their clocks, growing from record volume to record volume.
When spring 2026 arrived, I put in just over $4,000 for my 2013 hybrid Lexus RX450h; with new Michelin tires, Enkei 19″ rims and KYB struts & dampers. Service for installing and alignment was part of the cost.
Money well spent. The SUV, with just under 80k miles, drives, tracks and handles very well. Four grand ain’t much in the big scheme of things I figure when deciding to keep my vehicle (which holds a bicycle perfectly with the back seat down) versus buying new/used to upgrade.
Wolf, reading the above comment made me look at Hyundai’s website. Checking out their top-of-the-line hybrid SUV, a 2027 AWD Palisade hybrid, what they call, Calligraphy Black Ink” runs $61,330 MSRP with the $1,650 freight included.
Granted, it’s only a 2.5L turbo-4, plus the electric motor. It weighs 5,000 lbs and has 329 hp and 339 ft/lb torque.
Still, it is well built. It is safe to drive. And it is unbeatable in price-to-utility I’d wager.
“Hyundai-Kia that has been cleaning their clocks, growing from record volume to record volume.”
This economy has a Tony Montana feel.
And he was a psychopath… oh yeah now that you mention it. 💡
Yep.
PEs of 35+ for companies that have already penetrated every mkt on Earth (twice over) (or indices filled with negative PE companies) definitely has a “head buried in a mountain of cocaine” feel to it.
And pusher politicians will always be around to say “What could possibly be the problem?”.
But those same politicians evaporate like farts in the wind when the chainsaw scene inevitably rolls around.
Are there any stats going back as many years as possible for annual passenger (not commercial) vehicle miles driven in the U.S.?
I have not seen any.
Yes, consumershield has a trend of it. It should pop up if you search. Not 100% sure on accuracy but seems to match other various sources. The data only goes to 2024 though.
It’s very had or impossible to distinguish between light commercial and consumer miles, when you count vehicles. Think of a construction guy driving his crew cab pickup loaded with workers and tools to a construction site, and over the weekend taking his truck to go fishing. When you count vehicles with vehicle counters, it’s the same vehicle.
But you can send the guy and 1,000 Americans a survey and asked them how much they drive their vehicle for personal miles only — whatever answers that will produce — and then multiply it out for all Americans.
Insurance companies have good data about their own clients, but business and personal miles are also intermingled. I don’t know if anyone consolidates this data.
Yolo! I was looking at FRED personal savings. NOT savings rate. Look at the stimulus shoot it up, then spend down, then shoot up, then spend down again. It was like 6T gave and spent in no time! I can only imagine that is still make its way around…hope we get 5000 checks soon! LOL. Like taking a beer bong then yelling fill it up again!
“Savings” in this context means “income that is not spent in the current period” but doesn’t included 401k contributions, etc.
Saved 33 cents a gallon today by going to Costco over a Kroger subsidiary.
Thanks Costco for my $3.33 cents
That’s just about what a $100 earns annually in a money market fund, except I get to put it into savings right away and it’s not taxed. Woo
Good job! Inflation has to be fought at every twist and turn by everyone.
“Inflation has to be fought at every twist and turn by everyone.”
If only somebody had said that to our Betters running the machine that went ZIRP for 20 years.
Instead they gave us little self-serving lecture-ettes about “new technology called a printing press” and the wonders of throwing money out of helicopters.
Today?
Zimbabwe Ben has spent the last 15 years on frigging country club golf courses.
I feel that the ease of online shopping and the constant bombardment of deals makes it difficult for consumers to resist making purchases even if they can’t afford it. Amazon perfected the ease of checkout and free shipping if you spend more. As for travel and dining out, social media makes keeping up with the joneses the norm because how dare friends live better lives.
MW: The Federal Reserve hikes rates by quarter-point, sees only one more move higher through 2027
Stocks SURGE higher after Fed raises interest rates for the first time in three years
The Federal Reserve has raised interest rates for the first time in nearly three years as it intensifies its battle against stubbornly high inflation.
They tanked after Warsh started talking.
The Fed is serious about talking inflation. They just raised interest rates by a quarter of a percent. They mean business and are determined to do what is necessary. I will be investing my $5,000 in bonds. This is a big deal.
Dear Prudence, Won’t you come out to play?
Prudence will show up for the party :)
Look around, round, round. Look around, round round.
Look at all these drunken sailors.
You keep all your money in a big brown bag inside a zoo, what a thing to do.
So much for the “there’s no demand inflation” argument
I think it’s also end times partying and boomers spending down their wealth. Why would anyone save if they believe humanity is near extinction? Why would you pay off any debt? If this is you last month/year/decade, why not pay high gas and food prices for one last adventure?
Plenty of young people are alleviating that anxiety with retail therapy. Rate hikes don’t mean anything to them. AI and nukes won’t be sparing the rich.
It behooves politicians to encourage this because fatalistic partying is still growth.
Seems like a stretch to think any meaningful spending is due to fear of human extinction in the near term.
Inflation begets inflation which is why if too high it can get out of control. Same with deflation. Neither at the extreme is good for the psychological factors that play into our system.
Was this written in 1880s or 1900s or 1920s or 1940s or 1960s or 1980s or 2000s or 2020s I can never tell from these chicken litttles
Ant-
“….and clutching a barbell he looked at the sky, saying, ‘ The sun’s not yellow, it’s chicken’….”
Many knew in the 60’s this train WOULD wreck if important steps were not taken THEN.
Hey Wolf, will you post that chart that shows all these lines on the same scale at some point? It really opened my eyes to see restaurant spending finally cross over grocery store spending.
I do that once a year. Here is the last one:
https://wolfstreet.com/2026/03/06/where-americans-spend-their-trillions-on-goods-and-how-that-changed-since-2015/
Any idea how these lines would compare to a line for “Investments” or “Intentional Investments” e.g. someone outside of their salary putting $250/month into a Roth IRA or something like that? I’m so curious how much Americans intentionally put into investment versus spending on bars and restaurants.
Well I can say in SoCal it is lots of movement but no results worse year in 20 years this year and next year looking bleaker it use to be the place you went to make it … not anymore and now looks like Paramount is leaving … you have to work really really hard to screw up a state over years to take it from those heights 300 billionaires 500 companies in the Russell … not anymore they are headed for the door.
I think it’s pretty simple, as long as the stock market keeps going up the spending keeps going up. Soon as the housing/stock market cracks, bye bye.
There are a lot of us boomers out there, we have lots of savings, and we are going to spend it all!
For a long time I have been wondering when the recession will arrive. But now I wonder how high do interest rates ultimately have to go to cool an economy that keeps refusing to cool?
Wolf – why don’t ‘they’ just offer free stuff for everybody? You know -‘free sheet’. The Treasury can just print, print, print and send everyone as much as they need. We could all be millionaires! That way, the GDP would go off the charts! Quite the novel idea…..