
Lots of new supply: Treasury debt of notes and bonds outstanding ballooned by $70 billion this week.
By Wolf Richter for WOLF STREET.
The US government sold $743 billion of Treasury securities during the week, in 10 auctions. Of them, $612 billion were Treasury bills, spread over seven massive auctions, with maturities from 4 weeks to 52 weeks, most of them to replace maturing T-bills. And $131 billion were 3-year and 10-year Treasury notes and 30-year Treasury bonds, which replaced $61 billion of maturing securities, causing the total amount of notes and bonds outstanding to balloon by $70 billion this week.
There was strong demand at the auctions, but at higher yields. T-bill yields have begun to factor in rate hikes. The 6-month T-bills sold at an investment rate of 3.96%. The 1-year T-bills sold at an investment rate of 4.03%, for the first time over 4% since the auction on July 8, 2025, and that was three rate-cuts ago. The 10-year Treasury notes at a yield of 4.58%, highest auction yield since February 2025. The 30-year Treasury bond sold at a yield of 5.058%, the highest auction yield since 2007.
Inflation has been running at a rate of over 4%, so all those T-bill yields, though they have risen in recent months, are below the rate of inflation, and “real” (after inflation) returns are negative. But Treasury yields of 1 year and shorter are not impacted by inflation, but by the Fed’s policy rates and by market expectations of those policy rates within the remaining maturity window of those yields. And the Treasury market is now solidly in the camp of rate hikes, starting with at least one this year. If Fed Chair Warsh wants to talk the Treasury market down from those rate-hike expectations, he needs to start scrambling pronto:
| Treasury bill auctions this week: | ||||
| Type | Auction date | Billion $ | High Rate | Investment Rate |
| Bills 4-week | Jul-09 | 106 | 3.630% | 3.691% |
| Bills 6-week | Jul-07 | 95 | 3.635% | 3.701% |
| Bills 8-week | Jul-09 | 101 | 3.635% | 3.706% |
| Bills 13-week | Jul-06 | 97 | 3.735% | 3.823% |
| Bills 17-week | Jul-08 | 76 | 3.790% | 3.891% |
| Bills 26-week | Jul-06 | 83 | 3.830% | 3.960% |
| Bills 52-week | Jul-07 | 53 | 3.860% | 4.032% |
| Total T-bills | 612 | |||
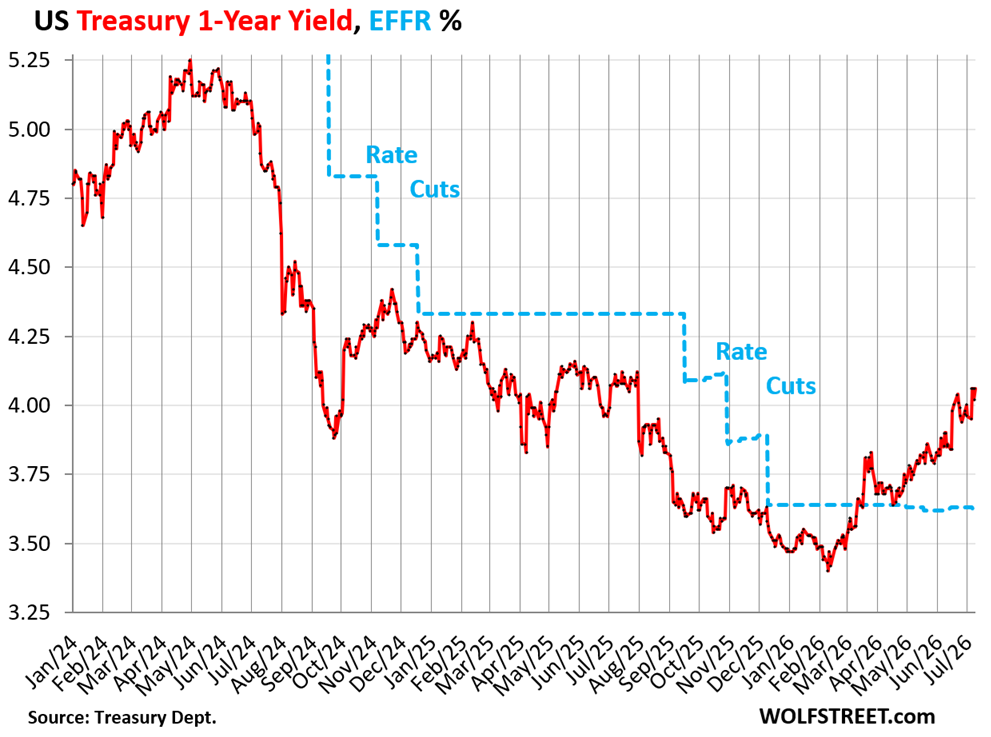
The 1-year T-bill sold at an investment rate of 4.032% at the auction on Tuesday. In the secondary market, the 1-year yield then edged up to 4.06% and closed on Friday at 4.06%, the highest since July 30, 2025, three rate cuts ago.
The 1-year yield in the secondary market is now 44 basis points above the Effective Federal Funds Rate (EFFR, blue), which the Fed targets with its policy rates, indicating that the Treasury market is solidly in the camp of a coming rate-hike cycle, given the inflation data this year.
Even banks are pricing rate hikes into their CD offerings. They have been raising the interest rates they offer on “brokered CDs” they sell via stock brokers to retail investors. At my broker, even the yields offered on 1-month CDs are now over 4%, while 1-year CDs are offered at 4.15%, 2-year CDs at 4.25%, and 5-year CDs at 4.40%.
These are the highest brokered CD yields I’ve observed in a while; they confirm that banks expect rate hikes, and they want to lock in deposits at these rates before rates rise even further.
Long-term yields pushed up by fears of new supply & inflation.
The Treasury Department sold $131 billion of notes and bonds at three auctions this week.
| Treasury note and bond auctions this week: | |||
| Notes & Bonds | Auction date | Billion $ | Auction yield |
| Notes 3-year | Jul-07 | 64 | 4.179% |
| Notes 10-year | Jul-08 | 43 | 4.580% |
| Bonds 30-year | Jul-09 | 24 | 5.058% |
| Notes & bonds | 131 | ||
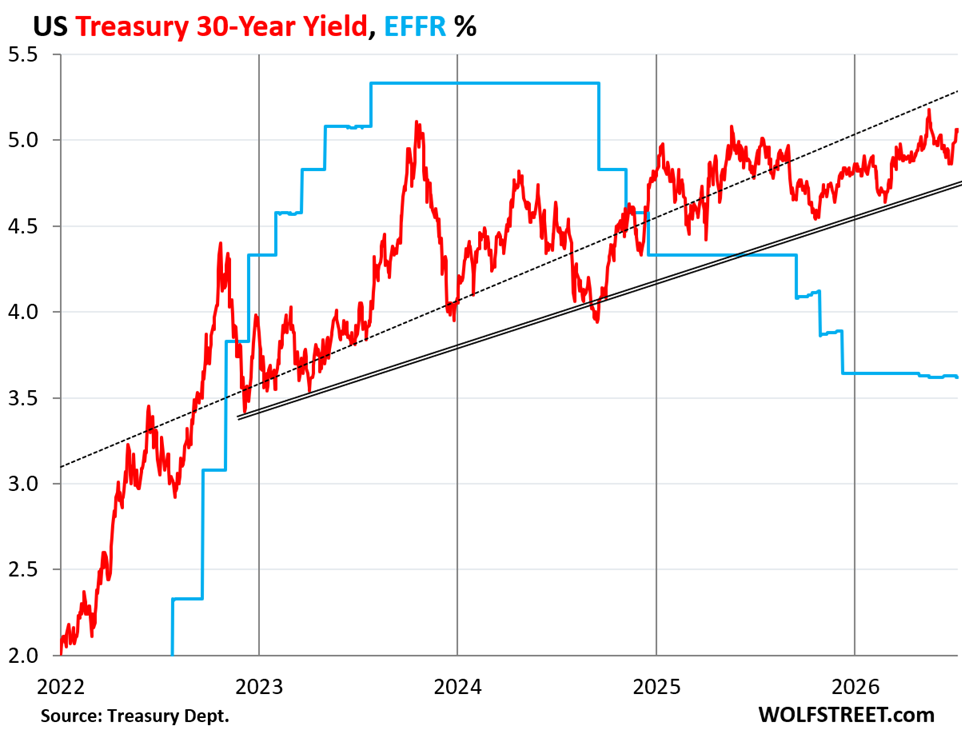
The 30-year Treasury bonds sold at auction on Thursday with a yield of 5.058%, the highest auction yield since the 30-year auction in August 2007 (5.059%). There was lots of demand at this auction, but at that higher yield.
In the secondary market, the 30-year yield traded as high as 5.09% on Thursday in the hours before the auction, then settled down and closed on Friday at 5.06%.
It had traded higher than that three times in the last three years, including as high as 5.18% on May 19 this year. But the wild yield yo-yo in 2023 and 2024, with big spikes and plunges, has settled down, and instead, the yield has been leisurely ratcheting higher since last fall.
The two trend lines in the chart are for fun only: The dotted line depicts the calculated linear trend for the data in the chart. The double line is my imaginary trend line of higher lows since late 2023.
The long-term bond market completely blew off the Fed’s rate cuts.
The long-term bond market reacts to fears about inflation, about a lax Fed when inflation does take off, and about new supply that the market has to absorb, likely at a higher yield to create enough demand.
But by cutting rates even as inflation remained high in 2024, and by cutting rates again in late 2025 even as inflation had already begun to accelerate again, the Fed signaled to the bond market that it would it would be a lax Fed and give this inflation some room to run, that it would “look through” this inflation for a while, before trying to step in.

And now it’s July, all-items year-over-year CPI inflation is back over 4%, and the six-month core CPI – which, by excluding energy, shows the recent trend beyond the energy price spike – is also over 4%, and the Fed still hasn’t stepped in. That’s the definition of a lax Fed. And the bond market is starting to figure it out. And so the 30-year yield has ratcheted higher in part because of those rate cuts.
Higher yields of long-term debt mean lower bond prices for holders of existing securities. When yields rise a lot, it’s a bloodbath in bond land, and there was a lot of that in 2021-2023 as yields surged from near-0% to 5%. The massive losses on long-term bonds were one of the trigger points for the collapse of Silicon Valley Bank, which had held a lot of long-term securities it had bought with very low yields in 2020. But new buyers like the higher yields obviously.
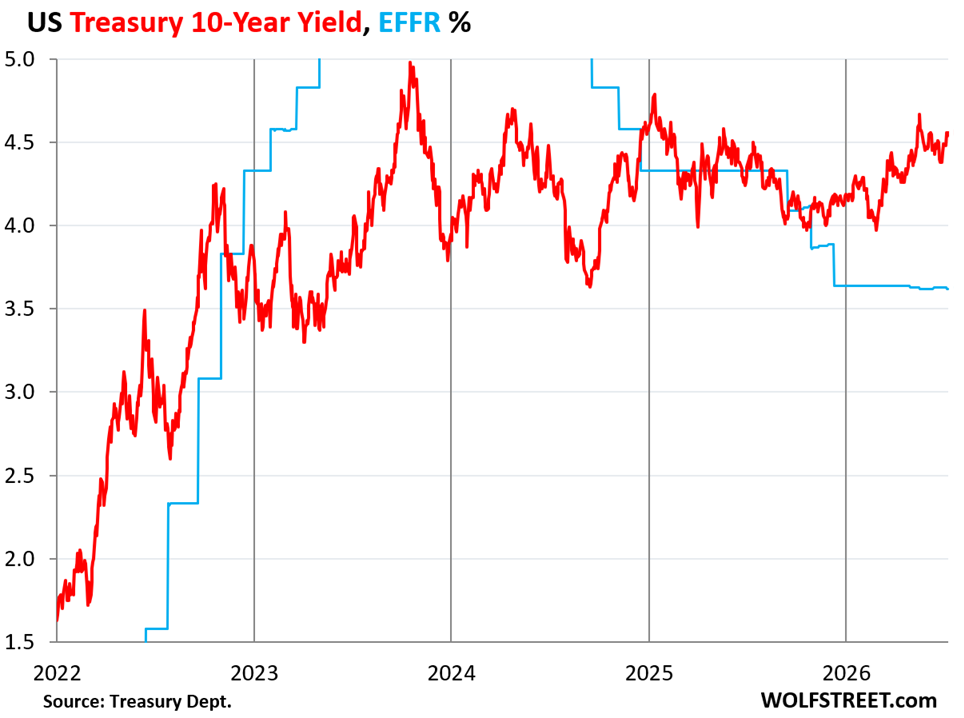
The 10-year Treasury notes sold at auction on Wednesday at a yield of 4.58%, the highest auction yield since the auction in February 2025.
In the secondary market, the yield remained in that range and closed on Friday at 4.56%.
It’s higher yields that allow the bond market to live with higher inflation. But CPI inflation at 4.25% in May has closed in on the 10-year Treasury yield, and so the “real” 10-year Treasury yield (yield minus CPI) is just 31 basis points and can turn negative easily if inflation rises a little.
It’s this inflation combined with the lax Fed that still hasn’t stepped in though core inflation measures have been accelerating further away from its 2% target for an entire year, that render the 10-year notes at this yield very unattractive to this observer. But not to others, and there was lots of demand at the auction, and this difference in opinion is what makes a market:
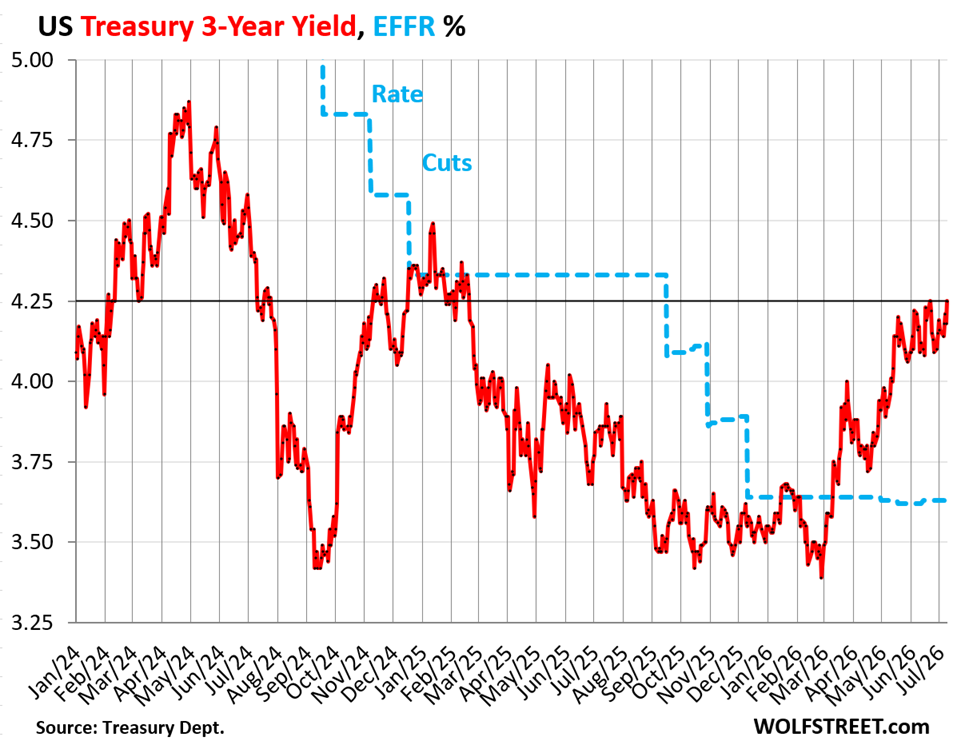
The 3-year Treasury notes sold at auction at a yield of 4.179%. In the secondary market, the 3-year yield rose for the rest of the week and on Friday closed at 4.25%.
Since late February, the 3-year yield has surged by 86 basis points, and is now 63 basis points above the EFFR, signaling that the bond market has flipped solidly from a rate-cut scenario to a new rate-hike cycle.
In terms of the auction yield of 4.179%, it was below CPI inflation of 4.25%, and so these 3-year notes were sold at a negative “real” yield, signaling that the bond market thinks inflation will calm back down some over the next three years but not go back into its 2% bottle.
Treasury debt ballooned by $70 billion this week.
Of the $131 billion in Treasury notes and bonds sold this week, only $61 billion replaced maturing notes, and the remainder added $70 billion to the outstanding debt of notes and bonds (notes have terms of 2 to 10 years, bonds have terms of 20 and 30 years).
The $64 billion of 3-year notes that sold at the auction on Tuesday at 4.179% replaced $40 billion in 3-year notes that were sold at auction in July 2023 at 4.534%, and that mature next Wednesday (July 15). So with this week’s auction, the total amount of 3-year notes outstanding rose by $24 billion ($64 billion new notes replacing $40 billion of maturing notes).
The $43 billion of 10-year notes that sold at the auction on Wednesday at 4.58% replaced $21 billion in 10-year notes that were sold at auction in July 2016 at 1.516%, and that mature next Wednesday. So with this week’s auction, the total amount of 10-year notes outstanding rose by $22 billion.
The $24 billion of 30-year bonds that sold at the auction on Thursday at 5.058% replaced no maturing 30-year bonds because in 1996, 30-year bonds were issued only twice a year, in February and August. Now they’re issued every month. And the entire $24 billion sold this week added to the outstanding balance of 30-year bonds.
All combined, the three note and bond auctions this week added $70 billion in new debt.
New issues of notes and bonds being so much larger than the maturing issues they replace, and new issues not replacing any maturing issues at all, cause the pile of Treasury notes and bonds to increase constantly, even as the Treasury Department said soothingly that it would not further increase the auction sizes for notes and bonds this quarter.
This onslaught of new supply needs to find new demand – and that demand will materialize, but possibly only at higher yields — and lower prices for existing bondholders — and that’s one of the big fears that is pushing up long-term yields.
Enjoy reading WOLF STREET and want to support it? You can donate. I appreciate it immensely. Click on the mug to find out how:


With interest on US Treasuries already costing the US Treasury more than $24 billion each week, who in America wouldn’t want this vast increase in US government spending and borrowing which will soon be the biggest industry in all of the USA!
Interest payments do not occur in a vacuum. They occur in the world of tax receipts that are available to pay for them:
https://wolfstreet.com/2026/06/30/inflation-nominal-economic-growth-to-the-rescue-the-us-governments-ugly-fiscal-mess/
Is that supposed to make us feel better?
Your feelings are your own business.
There was strong demand at the auctions, but at higher yields.
The market will enforce value, eventually. As famously captured by Keynes’s lament following his infamous short of the German mark which eventially collapsed but not until after Keynes was forced into bankruptcy by the margin calls. Ergo, the market can remain irrational longer than you can remain solvent.
Since you touched on it with those remarks, can you do a future letter about what’s going to happen when there are not enough tax receipts to pay the interest?
It could be a very short letter!
Thanks
That’s not going to happen, so I don’t need to dive into hypotheticals. But what may happen, and what happened before, is that interest eats up 50% of tax receipts. That crisis shook Congress and the White House out of its denial and they finally got together and resolved the issue for a while, as you can see in the chart.
Didion spoke about how the elite do not care about the reality of the citizens they govern. Instead, they are obsessed with the “process”—polling data, tactical maneuvers, optics, and the “narrative.” They treat governance like a private game whose rules only they understand.
I agree
Absolutely. That’s why a poll came out with 95% of Americans saying that the U.S. is facing an affordability crisis, while the elite tell everyone how great things are. There’s a disconnect somewhere, and it’s not merely Democrat versus Republican.
Except it is a Republican versus Democrat issue. The Gini coefficient dropped at least a little during each of the last two Democrat administrations. While rising during every Republican administration for the past 50+ years.
One of the biggest causes of bankruptcy in the U.S. is health issues. Only in the U.S. can person be forced to declare bankruptcy because of the randomness of cancer of other medical issues. One party has tried to increase the number of people with health insurance and one party has consistently decreased the number of people with health insurance.
There is a reason one party appreciates the poorly educated…… they can count on their vote all while taking advantage of them.
JimL most people in this country eat horrible food, exercise little, and don’t sleep well. Most of their health problems are on them. That isn’t a political issue. But if you want to make it one, let me remind you that the Affordable care act actually made insurance more unaffordable. My premium went from $50, to $500 in less than a year, and then my insurer left the market. Just another example of how government intervention hardly solves problems.
Calling onself insured with expensive premiums and a high deductible is akin to banning Aunt Jemima but not the synthetic food ingredients in it.
Of course the solution is obvious but ephemeral.
How to motivate the young people to actually vote for the stuff they claim they need
dang,
There is a very accurate political and economic theory which predicted what would happen. I would suggest, however, that the system created the elites who care about protecting their own interests and of course either being in or controlling the political class. What the non elite do not recognize and have been essentially been programmed not to, is that they have immense power and should the gain class consciousness they could bring about change. That change of course is messy but also really impossible given that most people are doing okay and those at the bottom literally have zero power and agency.
No doubt ! Nine dollars from every ten created by QE went to Silicon Valley creating an American aristocracy, the antithesis of what America was founded on.
The Continental Army of the US was a rag tag bunch of characters that established this profoundly different idea about a political structure. A structure codified by firstly the Declaration of Independence followed by the constitution of the United States of America.
A document whose flaw is the traitorous Supreme Court who have taken it upon themselves to codify injustice.
Thanks, Wolf. In contrast to everything else I read in the financial press, your analysis is unbiased and crystal clear.
In this article you say, “Inflation has been running at a rate of over 4%, so all those T-bill yields, though they have risen in recent months, are below the rate of inflation, and “real” (after inflation) returns are negative.” That’s 100% accurate. I would add that when I think about inflation, I compare my *after tax* return to the rate of inflation. To illustrate, let’s say a person’s highest marginal federal income tax rate is 24%. Then a 52-week T-bill at an investment rate of 4.032% gives an *after tax* return of 4.032% x (1 – 0.24) = 3.28%, which is well below the inflation rate. There are seven different marginal federal income tax rates. Your highest rate depends on your taxable income. So, it’s impossible to give one number that says how badly we all fare when we take both inflation and taxes into account. But each of us should be thinking about this in *after tax* terms. How are you doing after inflation *and* taxes? Note: If you are talking about rates offered by banks, you also have to take your state income taxes into account. Ugh.
Good questions. But if you lose 50% in the stock market, you’re worse off than making 4% on T-bills and paying federal (no state) taxes on the 4%.
During the Dotcom Bust, the Nasdaq plunged 78%. Many people who went through this and got wiped out if they were leveraged, couldn’t even harvest the tax benefits of those kinds of losses. Those people would have loved to sell, with hindsight, all their stocks in late 1999 and very early 2000, and buy T-bills and pay federal taxes on the 5%.
Why do you think investors buy T-bills? Do you think investors buy T-bills if they’re convinced stocks will go up at least 20% and likely 50% or maybe 300% over the next year? Nope. Investors load up on T-bills because they think stocks have a good chance of dropping 50%. Tax considerations don’t even enter into this equation. The equation is about risk.
But are investors the people buying T-Bills now, or are they being bought by moot fundz and banks and insurance cos who need guaranteed income? These numbers of sales are so big, my puny brain can’t perceive enough “investors” exist to buy these, every month!
Buffett = investor = holder of $324 billion in T-bills. And he is not the exception. Banks primarily hold longer-term Treasury securities, not T-bills, which is why the three regional banks collapsed in 2023. In total, banks hold only $2.0 trillion in total Treasury securities, of $39 trillion Treasuries outstanding. Only a small-ish portion of the $2.0 trillion is T-bills. If banks want to hold liquid and most secure assets that pay 3.65% interest currently, they put their cash on deposit at the Fed as “reserve balances.”
What!
I’ve been buying treasuries for decades, and NOT because I think the stocks in my portfolio are going to retrench 50%.
It’s not necessarily about risk, as you suggest, but simply the idea of owning a stable vehicle that contributes an acceptable income stream. If you invest in treasuries you’re not going to hit a home run, but that’s not the goal.
Trading treasuries is another subject entirely.
Mike H
I said “T-bills” not “Treasuries.” T-bills are essentially cash. Once you get into Treasury notes and bonds, you’re making bets on interest rates or seek long-term hold-to-maturity investments. I do NOT treat T-bills the same as TIPS or 10-year notes. they’re fundamentally different.
but sure, you can hold your investments in T-bills forever and roll them over forever, no problem. It’s worry-free, convenient, and liquid. But T-bills have a long history of yielding less than inflation, or about the rate of inflation, for long periods, so they’re not a great long-term buy-and-forget investment; they’re essentially risk-free interest-earning cash. Obviously, there are periods when it’s great to hold this type of cash, and now may be one of those periods, but we don’t know until afterwards. It’s just really important to understand the difference.
Mike H, if you were THAT sure that your stocks wouldn’t drop, and would increase more than 5%, you wouldn’t buy any T-bills.
Clearly, even if in the back of your mind, you know a retrenchment is possible.
> that render the 10-year notes at this yield very unattractive to this observer.
Mr. Wolf, given that equities seem prepared to crash, what would you rather invest in?
Seems to me that there is a lot of demand for a hedge to balance portfolios?
Good question. I don’t have good answers but I think about it a lot.
If you just want to put your cash somewhere for a while to get it out of harm’s way, why not risk-free 4% or near-4% T-bills? If rates rise, you won’t face big problems there because their price changes only little, and they mature soon, so you can just wait till they mature, and you get paid face value.
10-year Treasuries are either 1. a bet on the direction of interest rates (down), or 2. a 10-year investment you hold to maturity. Neither one is attractive to me. But buyers obviously found them attractive because they see the future differently than I do.
If you want 10-year paper in this environment, you can check out 10-year TIPS. They pay a coupon interest rate (2.17% for the TIPS sold at the auction in May) plus inflation protection added to the principal at the rate of CPI. That last batch that was sold is currently earning 6.5%. As CPI changes, so does the return. But beware of the nasty tax consequences.
I went through this same confusion in 2007. Fortunately I chose to take the T-Bill. I didn’t make a killing then, but I survived to try again another day. I’m doing the same now. I’m not smart enough to play the big plays.
You are certainly not alone. I was even considering a financial advisor but my spouse graciously talked me off that cliff. Some stocks but mostly t-bills will do for now. Dry powder.
Be flexible and keep your treasury investment duration short.
The age of monetarism is coming to a close. The most overvalued instrument, IMO, is the long term Federal bond,
anything that isn’t tech stocks/etf
mlpi, xlei, schd, fndx, utf
another pessimist,
I took a lot of my money off equities on my IRA accounts hoping for a dip as I am not really that far from retirement. I sold off a little in my brokerage account but the capital gains on a few of my ETFs would be brutal, both in increasing tax bracket and also being in California.
Nobody really knows if or when the bubble of equities will pop but I’m not ready for a massive tax bill and I am pretty diversified already. The only additional consideration is what to do with my employer 401K. I think those that have them often forget about passive streams feeding the equities market but I haven’t moved that to safety yet but harder and harder to ignore not doing something there.
“I sold off a little in my brokerage account but the capital gains on a few of my ETFs would be brutal, both in increasing tax bracket and also being in California.”
Maybe wait until you retire and your income drops. Then sell your ETFs.
Roll your 401K into your IRA. While your tax bracket is low, move some of your IRA into a Roth.
Harvey MM – I’m always opposed to paying tax now (Roth). I’m holding out as long as possible. You are assuming the tax rate is going to be higher in the future when you are making a lower income? Future value of money also needs to be considered (inflation). Why take a hit now when it could be the wrong decision?
Wolf. Who determines the makeup of t-bills, notes and bonds that are sold at auction? Why issue 24 billion in new 30 year bonds at 5% vs short term debt at a lower rate?
The Treasury Dept makes those decisions. The Treasury is advised by the TBAC (Treasury Borrowing Advisory Committee), a federal advisory committee, government by federal law, that is composed of financial industry executives.
This page contains the links to the quarterly estimates of what will be sold at auction, and in the left sidebar (on a laptop screen), there are a lot of useful links, including about TBAC, about the processes, the Quarterly Refunding estimates, etc.
https://home.treasury.gov/policy-issues/financing-the-government/quarterly-refunding/quarterly-refunding-archives/quarterly-refunding-financing-estimates-by-calendar-year
Just want to commend all your effort and call attention to the fact you are a de facto economics professor for myself and likely many others here. I always learn something with every article and subsequent comments. I’ll be finding my way to that donate button now. Cheers
totally, for sure.
\
Although we should be cognicent that Wolf rarely renders an opinion because his narrative is likely too be controvercial
5% for thirty years might be considered low cost for the Treasury at some point soon. The pensions and insurance companies buying the stuff are doing Uncle Sam a favor. When they are at 6% then maybe US will sell more Bills at 4.5%.
Of course a stock market crash usually causes rates to collapse as people try to preserve cash, and the Fed will likely follow those market rates down a lot faster than they follow them up.
On a completely unrelated note (?) SpaceX stock is heading back to the IPO price of $135 for those who missed out helping create the world’s first paper trillionaire. When do all the employees get to dump their shares and become millionaires? A couple more weeks?
This fed is lax, but was reckless. I’m not convinced they aren’t still a bit reckless.
They are definitely reckless, and not a little bit. They have cut to the point that rates are below inflation, even in the face of a clear inflationary trend. Powell was Wall Street’s rent boy and an all-around embarrassment. The other members of the FOMC aren’t any better. We’ll see what Warsh can do with this lot of clowns but I don’t have high hopes.
Don’t worry, after 2 months on the job, Warsh has already signaled he’s clueless. So to help him understand what’s going on he has set up and staffed 5 task forces. Communications, Balance sheet and policy, Data, Productivity and jobs, Inflation framework.
So at least he’s serious about figuring out what the F is going on and helping out his fellow Fed Governors and hundreds of employees.
(Sarcasm alert)
He didn’t set up the taskforces to “understand what was going on.” he knows what is going on, which is why he set up the taskforces, to provide outside ammo to persuade the other voting FOMC members to support the changes he wants to make — including the move to a smaller balance sheet. There is a lot of resistance at the Fed to a smaller balance sheet. He is the least clueless Fed chair we’ve had in decades. You and I make not agree with all of his goals, but calling him clueless is silly.
Warsh is absolutely not clueless
He is smart and is a billionaire
I am sure he’d take decisions to help his rich friends
1. Warsh’s personal wealth is between $135 million and $226 million, so far from a billionaire.
2. His wife is the billionaire.
3. He likely had to sign an iron-clad prenup before marrying her which keeps her wealth away from him.
The problem is that they all start from the assumption that rates should be as low as possible. I don’t agree with that. Even if inflation is under control, I think there should be a real cost of capital in order to prevent malinvestment.
In other words, rates shouldn’t be low unless they need to be. They take the opposite position, that rates shouldn’t be high unless they need to be.
Higher rates favor wall st and banksters. Higher rates are detrimental to the poor.
Wall st. loves a stock market reset as it cleanses house on the IRS’s and the uneducated. For every seller there is a buyer. That’s why volume is so high at the nadir of the bottom. Wall st. reloading.
Ditto for real estate, etc.
George Bailey (It’s a Wonderful Life) worked just fine. We had high real rates of interest and low rates of inflation.
The US Golden Age in Capitalism was where small savings were pooled, expeditiously activated, and put back to work. I.e., the intermediaries, the nonbanks, grew much faster than the banks (making the banks jealous, driving up Reg. Q ceilings).
Velocity financed 2/3 of the economy whereas today, money finances nearly all of the economy
Waiono-
I don’t know about your “high rates hurt the poor”
During the era of ultra low rates, the wealth gap has exploded. Low rates have seemed to have disproportionately favored asset holders.
Sure if you are poor it is nice to borrow cheap money but you are more than likely overpaying for an asset anyway. And the wealthy can and do borrow more money at cheaper rates than you.
For keeping prices in check, higher rates help. All of those private equity business models blow up/don’t work when interest rates aren’t super low. Don’t want Wall Street buying homes? Stop loaning them money at 0%.
“Powell was Wall Street’s rent boy…”
Is there any other type…?
I have joined the club that Wolf himself recommended to give Warsh a mulligan in not employing the standard tools to fight inflation as defined by the stanford guy formerly with the federal reserve who developed an algorithm that predicted the interest rate required t extinguish ibflation
“The double line is my imaginary trend line of higher lows since late 2023.”
Silly question – way don’t you use a moving average to describe the imaginary tend?
The dotted line is a moving average, controlled by a calculation. The double line is controlled by the top honcho of the Wolf Street Media Mogul Empire himself from his top-floor corner office, one of the few things he still actually controls, and he’s gonna cling to it.
If I was a finance/business teacher, this article would be a handout in class come Monday.
Hey Grandpa, there are no more handouts in classrooms anymore, it’s all digital downloads
“Cool. Now get off my lawn.”
Not true. My grandkids, who go to very good private schools, pull papers out of their backpacks all the time.
So go pound…chalk…erasers.
Hey youngster ..focus on the issue, not the soundbite.
My current banks are only offering short term rates around 3%. What gives?? I was hoping for at least 4. I found a traditional bank offering 4.16 on a 12 month but the hassle of moving the money…erghh. I need yields! Only stock investments we hold are tied to Roth 401k Roth IRA and a mixed 401k which we can’t touch without penalties! – which I think is total BS by the way and they only offer certain mixed investment options – which I also think is BS. If I can’t get a company match without gambling at least let me do the gambling! Bunch of rigged BS! I’m a bit worked up about this obviously. Might as well buy lottery tickets and pray.
Get brokered CDs via a brokerage company. Lots more choice. Banks give their customers worse deals than non customers get via brokers. Better yet buy Tbilisi yourself via brokers. It’s easy. You can even autu roll them if you wish
Tbilisi for T-bills. That’s one of the funnier autocomplete fails I’ve seen recently.
You need to open up a brokerage account. then you can buy T-bills and other Treasuries at auction and in the secondary market, and you can buy “brokered CDs” from any bank, they’re competing at your broker for your cash, and so the highest-yielding CDs are listed at the top, and you can buy whatever else you like as well, money market funds, other bonds, even stocks.
If you live in a state with a high state income tax, such as CA, Treasuries offer a big advantage over CDs since states don’t tax interest income from Treasuries.
DON’T BE A SLAVE OF YOUR BANK!!!!
Something I recently learned when it comes to T-Bills vs CDs:
– In taxable accounts: T‑Bills often win because of state tax exemption.
– In IRAs: No tax advantage exists, so choose whichever has the higher yield and better liquidity for your needs.
Crystal,
You can set up a Treasury direct account or go with a less traditional bank account. I current get 4% on a saving account that requires only $250 a month in deposits of any kind. It’s FDIC ensured and has everything the big banks have but actually pays something. I use Treasury direct and this account in combination and so with little effort can pivot easily. Treasury directs only pain point is really getting it setup as a trust account in my experience but other than a dated UI it is easy.
I buy T-Bills with Treasury Direct and with Fidelity. I have to say, I like buying the T-Bills better using Fidelity than Treasury Direct. Treasury Direct is good but if you screw up entering your password a couple of times you may get locked out of your account until you can get a hold of a person on the phone at Treasury Direct. It took me about 1.5 hours until I could speak to somebody when it happened to me.
My problem has been in getting non state tax items to be taxed correctly although maybe that was just for funds that do all treasuries versus buying treasuries directly.
Yes, customer service is terrible! Took many months to fix a problem converting into a trust.
Harvey Mushman,
That is the general plan although the math doesn’t work for Roth conversions given I have other income from inherited IRAs, a small pension and other sources. There is so pretty decent low cost, no cost retirement software now which runs all the variations.
Wolf, your articles have become required reading for me. Thanks for the excellent work. I have noticed that the linear fits to the yield curves could be improved with curvilinear fits: y = ax**2 + bx + c. As you surely know, you get one more parameter to curve the fit to adjust for the speed of the variable. Thanks again.
What is the impact on the US economy of the interest payments made on the outstanding US debt that are paid to US stakeholders. I believe the payments made outside the US economy would be restrictive to our economy.
Funny thing how people think that the market anticipates coming Fed rate increases. How about looking at this way, the market prices the bonds based upon the market’s assessment of risk and the Fed follows the market.
1. Warsh has exhorted the market to look at the data and not at the Fed so that the Fed can look at the market as data input that’s not polluted by a feedback loop.
2. The short-term market (1 year or less) doesn’t really care about the risks and inflation. It does care about the Fed’s current and near-future policy rates because they impact the repo market via the SRF and ONRRPs, and IORB which affects bank lending to the repo market, and all of that affects the short-term Treasury market.
3. The longer-term market cares very much about inflation and supply as I pointed out in the title and multiple times in the article.
Wolf: Could you provide a “primer” to us uninformed people of what happens to a dollar “borrowed” by the US government……that is never paid back. Simply recycled each time it comes to maturity. Seems like I remember reading one of your articles….where it takes an amount larger than the original dollar to refinance. Is this because of the interest paid to finance the dollar…..or does the original dollar “lose” value…..or what? TIA!
No, it does not take more dollars to refinance (roll over) a maturing bond issue. But the deficit over the years has piled on new debt, and so now when they issue $43 billion in 10-year notes, $21 billion is used to pay off the maturing 10-year notes and $22 billion finances the NEW deficits.
Which is what I described in the article with this paragraph:
“The $43 billion of 10-year notes that sold at the auction on Wednesday at 4.58% replaced $21 billion in 10-year notes that were sold at auction in July 2016 at 1.516%, and that mature next Wednesday. So with this week’s auction, the total amount of 10-year notes outstanding rose by $22 billion.”
A question about reducing the Fed’s balance sheet. Reducing the balance sheet means reducing the Fed’s holdings of Treasury securities. This reduction must be matched by a reduction of the Fed’s liabilities. This means a reduction of reserve balances. Reserve balances are assets of commercial banks. Their liabilities must also be reduced. That is, bank deposits must decline. Bank deposits can decline for two reasons – because the banks reduce lending or because the public holds Treasuries rather than bank deposits. Is this analysis correct?
“a reduction of reserve balances. Reserve balances are assets of commercial banks. Their liabilities must also be reduced.”
Those two – banks’ reserve balances at the Fed and banks’ liabilities — are not directly connected dollar for dollar. Reserves are cash that banks put on deposit at the Fed. Banks can instead put that cash into Treasury securities, repos, loans, etc., without impact on their liabilities (deposits).
But there is another thing that happens when the Fed reduces its holdings of Treasuries and MBS: it drains cash from the market that ends up with those securities, so cash (liquidity) gets drained out of the market, which means that the market has less cash on deposit at the banks, and banks’ deposits go down because of that IF the balance sheet reduction is fast enough to overpower the natural growth of deposits as the economy grows.
But they’re not going to do a rapid drawdown of the balance sheet. It will be very slow, if it happens at all, and if it’s slow, you won’t see the actual impact on deposits because they will outgrow that reduction just via economic growth. But you will see reserves go down.
In addition: the Treasury Dept has been talking about putting some of the cash that is now in its checking account at the NY Fed (TGA) into the repo market, which would reduce the TGA balance. That’s the third-biggest liability on the Fed’s balance sheet. If $200 billion of that TGA balance is moved to the repo market, for example, the Fed will reduce its assets by $200 billion.
Wolf, any educated guess at how long it will be before the US will sells $1T of treasuries in one week?
Good question. Still aways to go unless something special happens, such as a long debt-ceiling fight getting resolved, which would jack up issuance.
If we see the major shift to T-bills that they have been talking about for months but that we haven’t seen yet, it could come faster since T-bills need to get rolled over all the time.
Great, but no one asked who is buying.
Lots of people on this commenting board are buying or rolling over their T-bills automatically. There was lots of demand, including from foreign investors, at these auctions.
Wonderful how the Fed’s balance sheet has increased about $200B from the lowest point in this cycle.
What happens to real estate if long term rates go to
5.5%,6.0% , 6.5% or 7% .
Current situation (low / medium interest rates)
– Enough supply from newbuilds, still selling due to builders lowering margins through incentives while managing to stay afloat (quite well at that).
– Enough supply from existing homes, not selling due to unwillingness to lower price to match market
– Low demand from buyers at these prices. There is plenty of folks who would like to move but are unwilling or unable to pay the current prices. Due to the extended high prices, you see folks switching or sticking to rentals to wait for the prices to adjust back down.
Future situation (medium / high interest rates)
– Enough supply from newbuilds still selling now that industry is adjusted to accept lower margins.
– In addition to high prices, demand now being pressured by difficulties to finance higher rate mortgages.
Conclusion: prices for existing homes need to move further (and already are moving, see other articles). Until that happens, we will continue to see 1) More people renting, 2) More vacant buildings, 3) More accidental land lords as Wolf calls them, and I suppose 4) Continued pressure on margins for builders to maintain volume, or a decrease in newbuilds.
At the moment we are on a nice and gentle slope down after a hard climb up. The slope might continue for a couple of years, or there might be a steep cliff somewhere up ahead (private property in the US that is). There’s a whole other shitshow in Commercial Real Estate, see Wolves other articles :)
Good question!
IMVHO, the higher the better for RE , and old folx, and thrifty folx.
RE prices will certainly go DOWN due to higher rates of interest, just as they have previously in the modern and majorly manipulated RE market, and had done previously when we actually had free markets in RE.
Old folx who have fixed incomes will do better due to being able to get decent, as in more than the rate of inflation, returns on savings in CDs and Treasuries.
Similar with thrifty folx who save first, or at least second, and spend on ”wants” third after ”needs” and savings…
Not going to get into any ”class” distinctions, except for the now very clear to any rational observer result of the FRB being a total tool of the rich and richer to keep their wealth at the expense of the working classes…
NOT really anything new, as the royalty and others claiming divine providence, etc., have been doing it for a long long long time.
bought my first house 11% mortgages
it can happen
and numbers are worse now, national debt then was around $2 Trillion
Consider the giant national debt and add in the list of record sized IPOs on the docket.
If I’m understanding things right, if the market yield of the 1 month bills gets above 3.75% before the next FOMC in 2 weeks, then Warsh will say “Yes Sir, Mr Market, Sir. I’ll raise the rate like you suggest. Sir!”
He definitely wants to change the direction of the flow of actionable info. Under Powell and prior Feds, starting with Bernanke, the Fed gave “forward guidance” and the market took it seriously and priced it in (with catastrophic results for banks leading to the collapse of three regional banks in 2023). Warsh wants to reverse the info flow, let the vast bond market decide what inflation, supply, labor market, etc., are up to, and price that in, and the Fed will use that as part of its input signals.