A highly unusual labor market for the US, marked by a shrinking supply of labor.
By Wolf Richter for WOLF STREET.
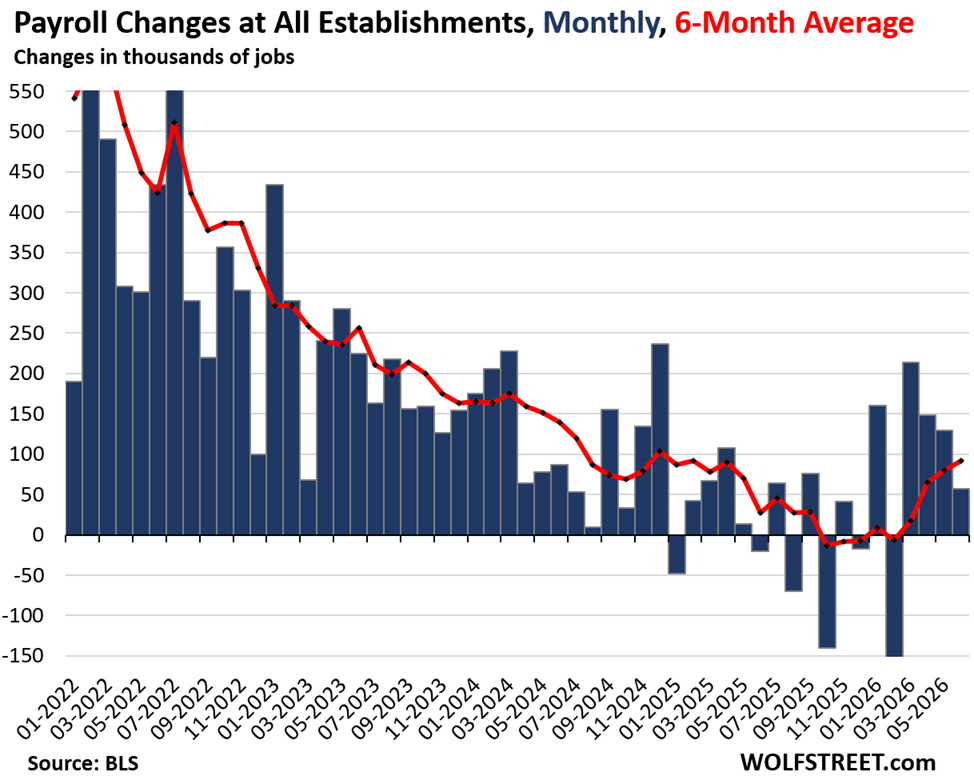
Total payrolls at nonfarm employers rose by 57,000 jobs in June from May, while May and April job gains were revised lower by a combined 74,000 jobs, undoing part of the upward revisions of 93,000 jobs reported a month ago for April and March, according to the data yoyo by the Bureau of Labor Statistics today (blue columns in the chart).
The six-month average job gain, which irons out the revisions and month-to-month squiggles, ticked up to 88,000 in June, the highest in two years (red line).
This trend line pins the low point of job growth – lob losses – in the second half of 2025 and early 2026, amid extremely volatile data. Job growth has since then turned positive again.
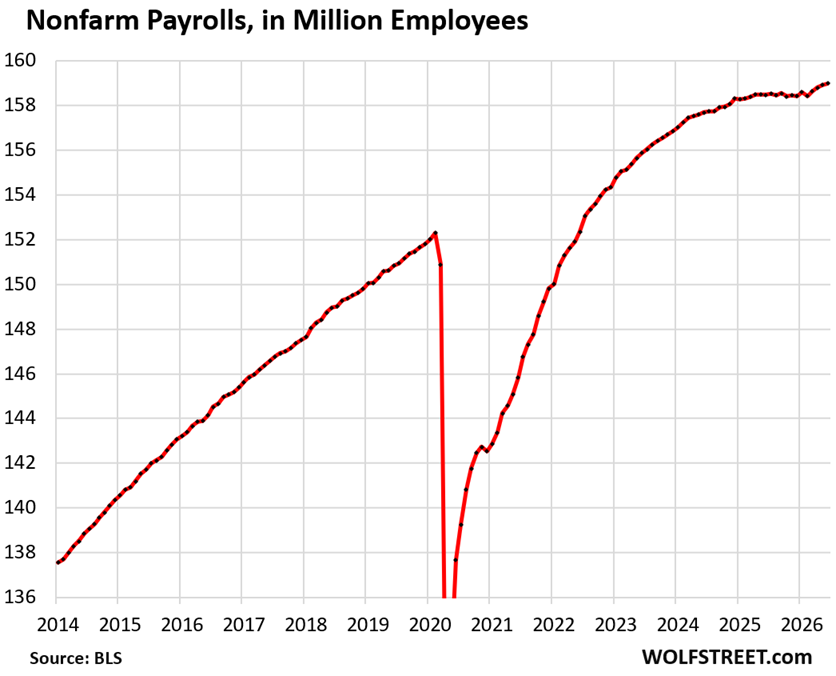
The level of nonfarm employment in June reached a record 158.98 million. The chart of the level of nonfarm employment shows the dynamics: very little or no growth in the second half of 2025 and early in 2026, and then the acceleration of growth over the past four months:
Labor force declines amid crackdown on illegal immigration.
The crackdown on illegal immigration has changed the labor market by curtailing the supply of labor, especially of cheap labor. And the tightening up of legal immigration, such as the H-1B visa program, may have further curtailed the supply of labor.
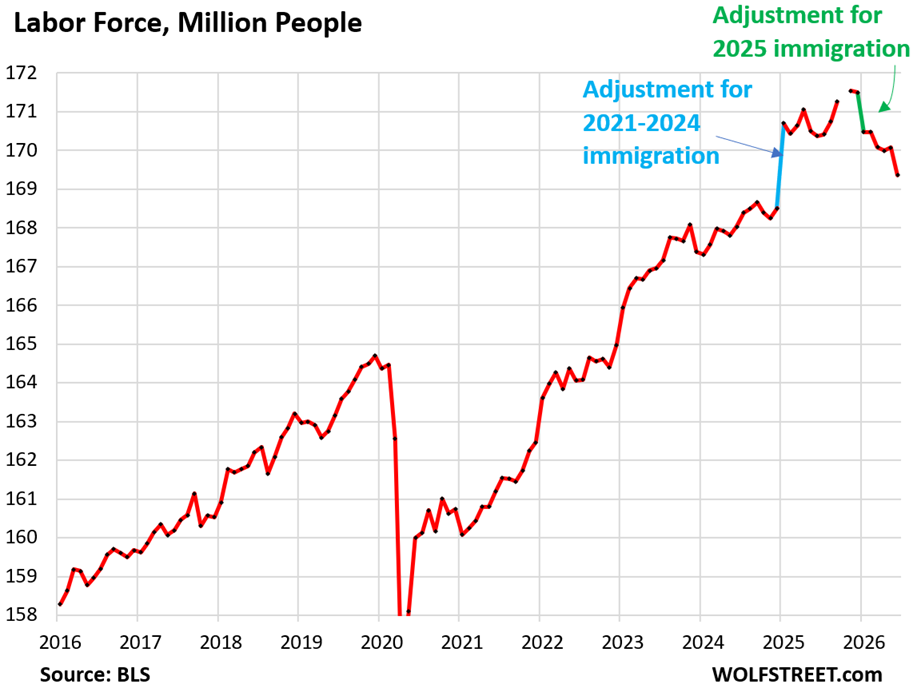
The labor force is composed of people who are working and of people who are not working but are actively looking for work. It represents the supply of labor.
The labor force data from the BLS’s survey of households is frustratingly messy and subject to huge annual revisions when it is adjusted to the latest population data from the Census Bureau. These revisions are not carried back, but show up in one month every year, causing the labor force data to spike (Jan 2025, blue in the chart below) or to plunge (Jan 2026 green in the chart below) by millions of people in just one month.
But over the longer term, and beyond the squiggles and revisions, we can see the trend: the labor force, after surging in the years through 2024, has been declining since then.
This declining supply of labor is highly unusual for the US and has changed the labor market.
Even as demand for labor has shown only weak growth, or no growth at all for a period through early this year, the supply of labor has declined. So with demand for labor fairly weak, and supply of labor even weaker, the number of unemployed people declined, and the unemployment rate declined and is historically very low.
The labor force in June dropped to 169.36 million, the lowest since the massive up-revision in January 2025 (blue). The labor force in June was still higher than at the end of 2024, but not by much.
The number of unemployed people dropped to 7.09 million in June, the lowest since January 2025.
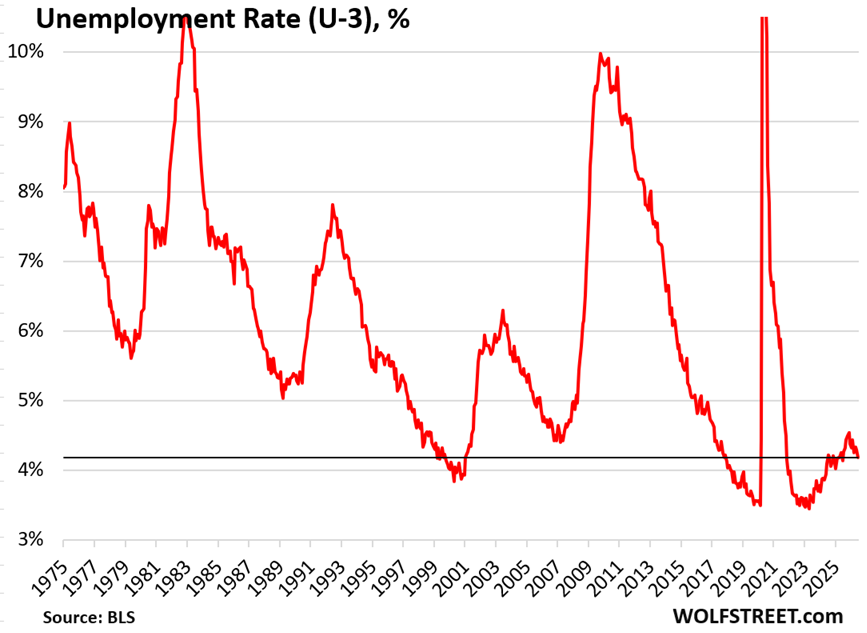
The unemployment rate inched down to 4.19%, the lowest since June 2025 (4.14%). The unemployment rate reflects the number of unemployed people who are actively looking for a job (7.09 million) divided by the labor force (169.36 million) – and both, the number of unemployed and the labor force declined.
Within a 50-year timeframe, the current unemployment rate is low, largely because of the tight supply of labor (declining labor force).
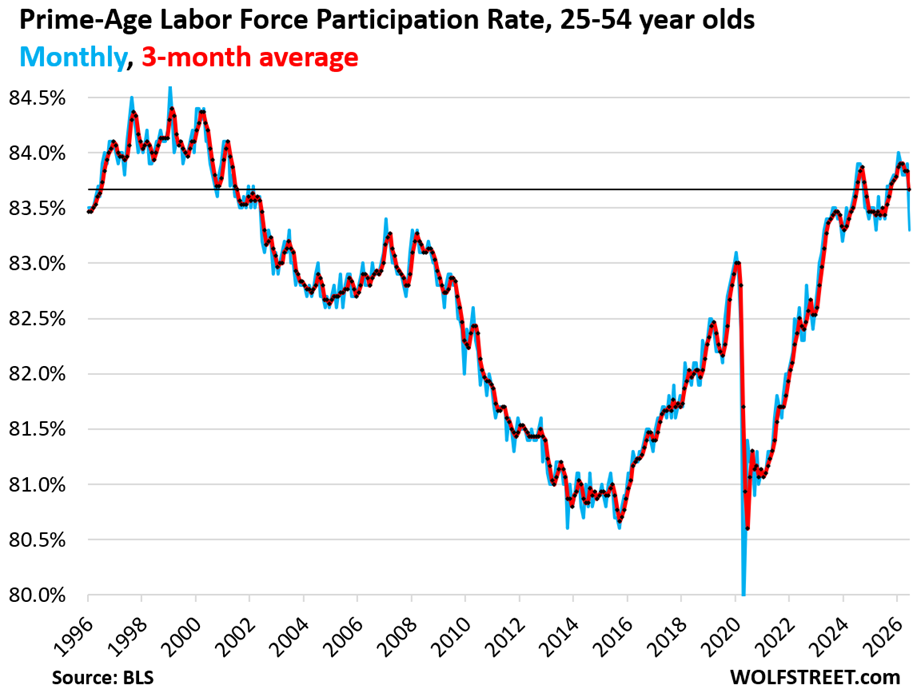
The prime-age labor force participation rate dropped to 83.3% in June from 83.9% in May. This is very messy data as well with big month-to-month squiggles, up and down (blue in the chart below).
The three-month average, which irons some of this stuff out, declined to 83.7%. This range has been the highest since the Dotcom Bubble in the 1990s.
The prime-age labor force consists of people between 25 and 54 years old. It eliminates the issue of the retiring boomers. When people retire and stop looking for a job, they’re no longer “participating” in the labor force but remain in the population until they die. It’s the surge of boomer retirements over the past 15 years that has pushed down the overall labor force participation rate (not show here).
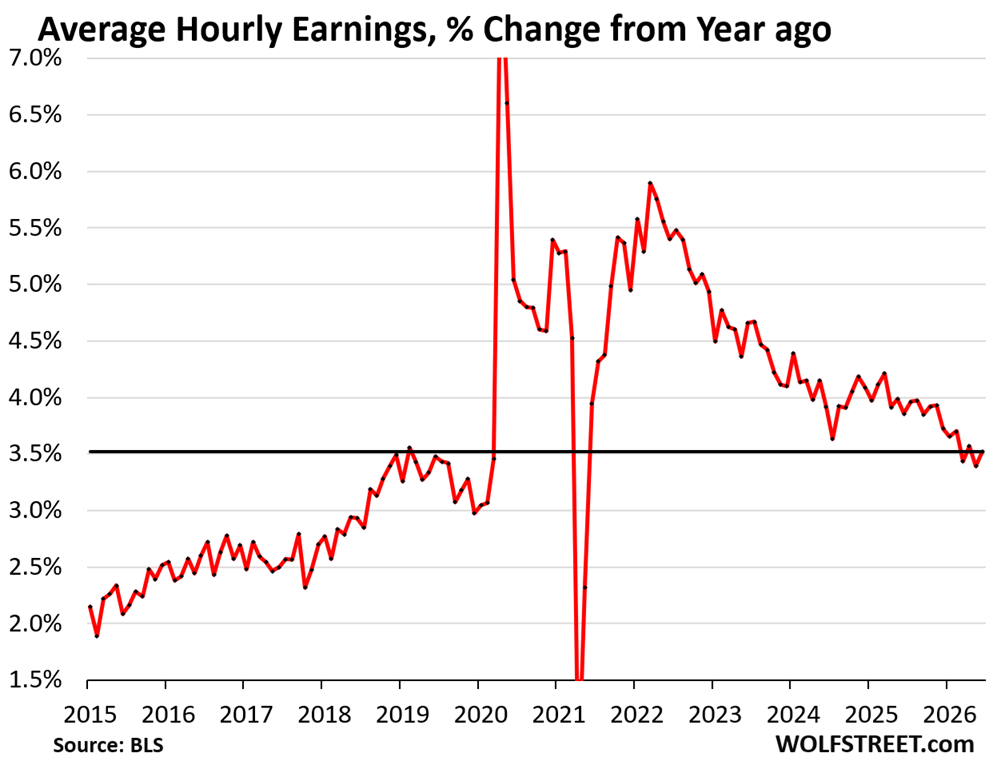
Average hourly earnings rose by 0.35% in June from May (+4.2% annualized), and by 3.52% year-over-year.
Inflation has been accelerating for months and in May reached 4.2%, exceeding wage growth.
Employment by major industry.
The charts below of employment by industry take the decade-long view beyond the month-to-month squiggles.
The jobs in each industry are defined by work location. The surveys are sent to employer facilities. The primary activity at that facility determines the industry category (by NAICS code). For example, a worker at an Amazon fulfillment center would be under “transportation and warehousing,” not “retail.”
Some industry categories are very broad, and therefore have a very large number of employees, such as “Professional and business services,” which is where many tech and AI offices are categorized, but also includes architects, lawyers, accountants, etc. Others are narrower and therefore have far fewer employees, such as “Manufacturing,” which includes only employees at manufacturing plants, but not employees at other offices, design centers, or service centers of manufacturing companies.
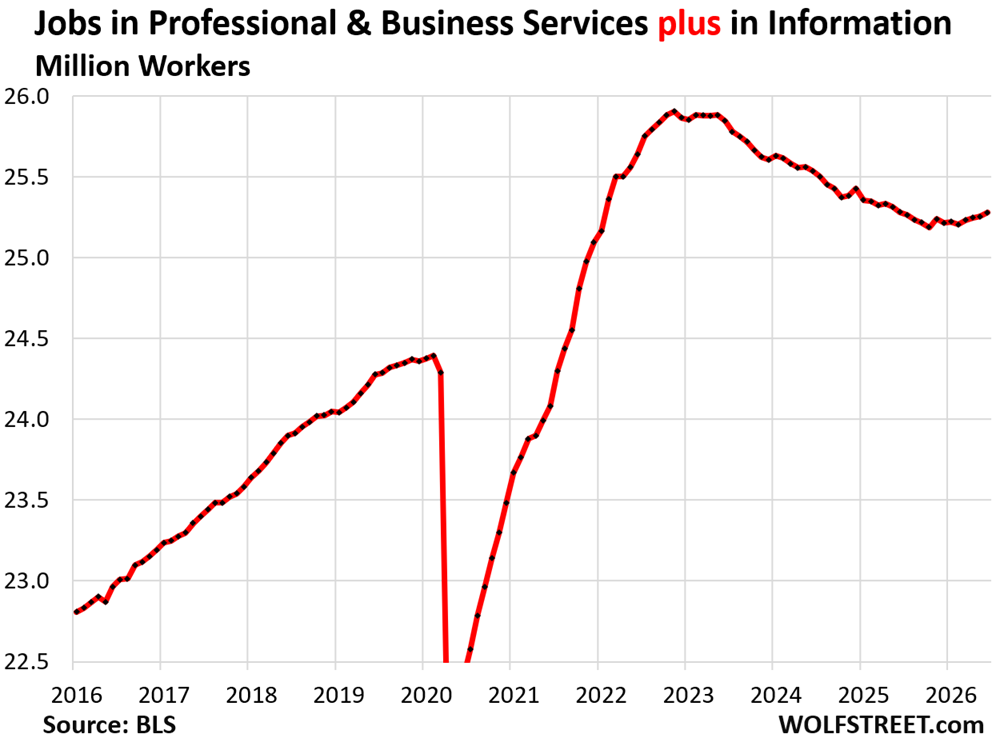
Jobs in Professional and business services plus Information: Workers with tech skills can easily shift from locations with NAICS codes for the small “Information” category to locations with NAICS codes for the vast Professional and business services category. So I combined those two categories into one.
- Total employment: 25.28 million
- 3-month average growth: +16,000
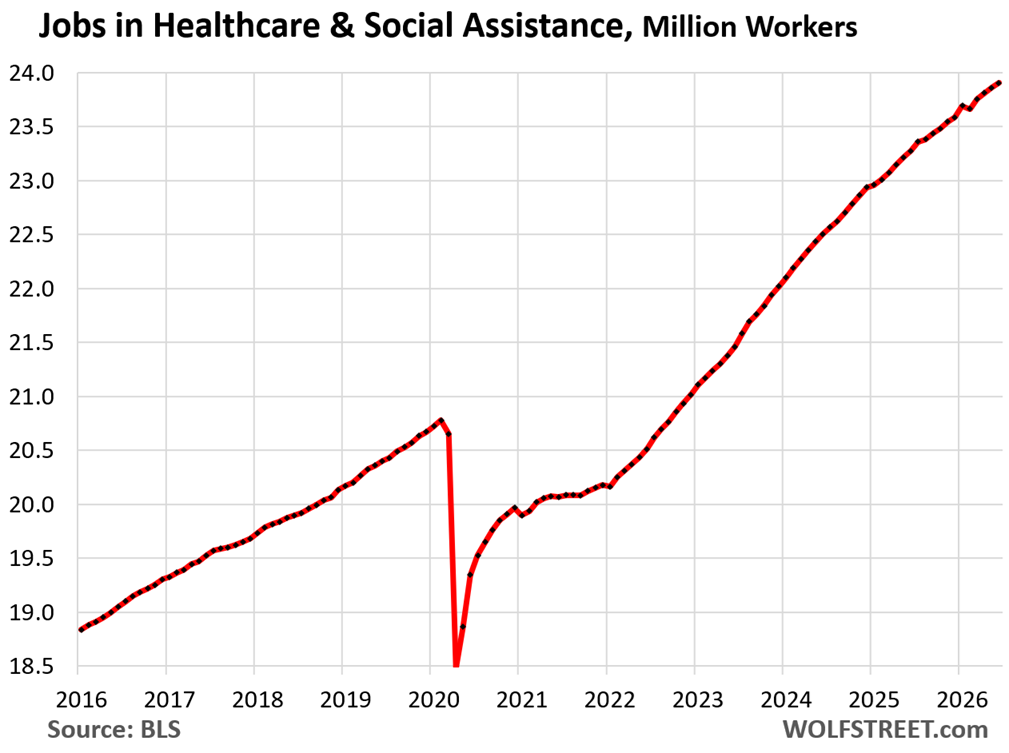
Jobs in Healthcare and social assistance:
- Total employment: 23.91 million
- 3-month average growth: +50,000
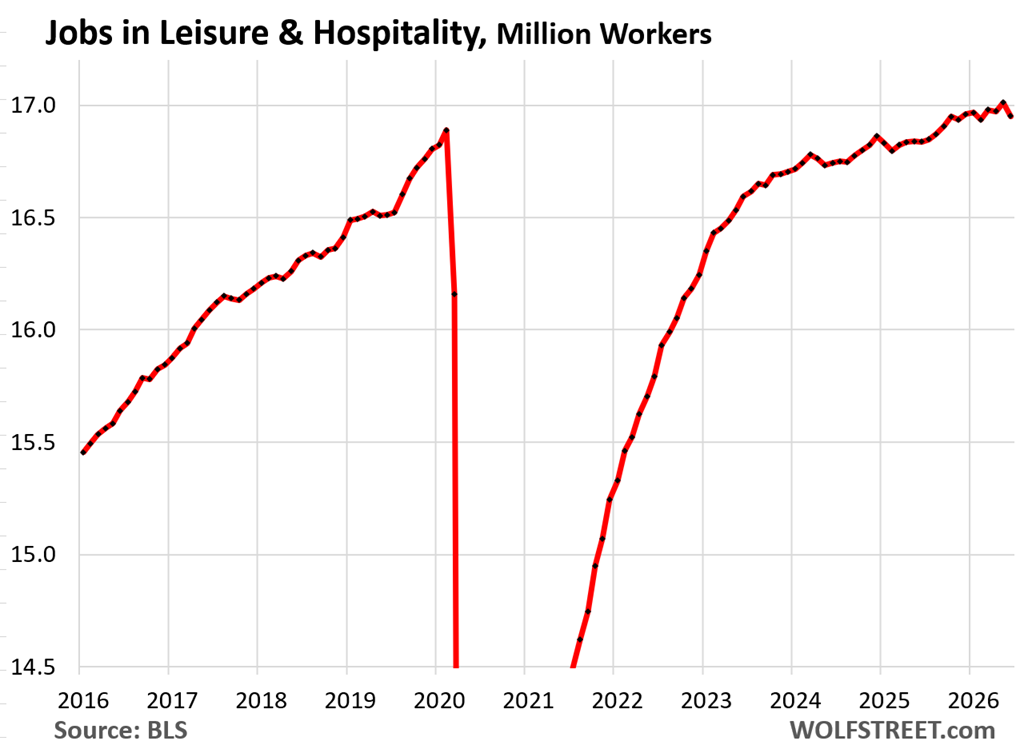
Jobs in Leisure and hospitality – restaurants, hotels, resorts, casinos, arts, entertainment, etc.:
- Total employment: 16.95 million.
- 3-month average growth: -9,000
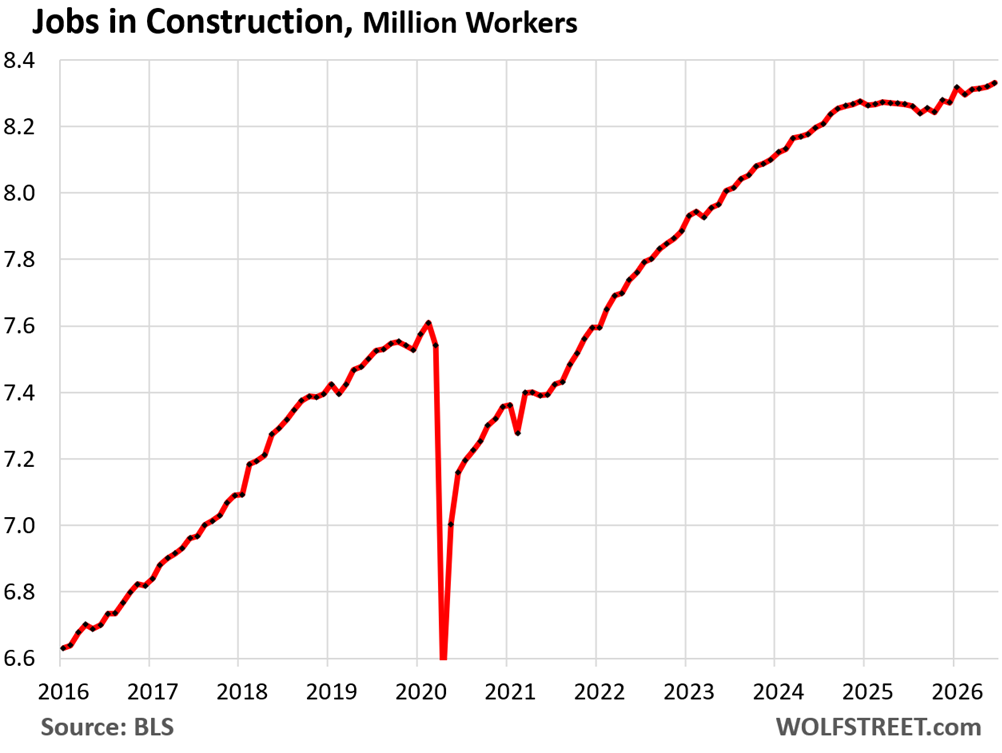
Jobs in Construction (all types, from single-family housing to highways):
- Total employment: 8.33 million
- 3-month average growth: +7,000
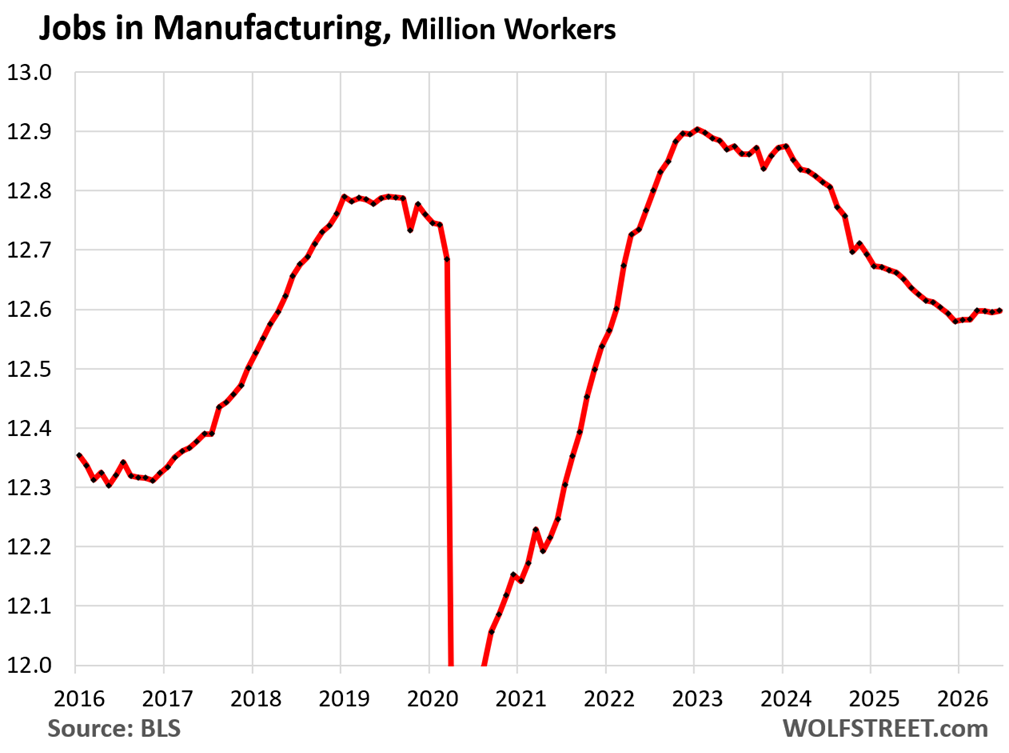
Jobs in Manufacturing: Automation powers manufacturing in the US. All new plants in the US are heavily automated, and automation at old plants is constantly improved, to reduce to costs of manual labor. Jobs at manufacturing plants today require a high skill level and include tech jobs.
- Total employment: 12.60 million
- 3-month average growth: 0
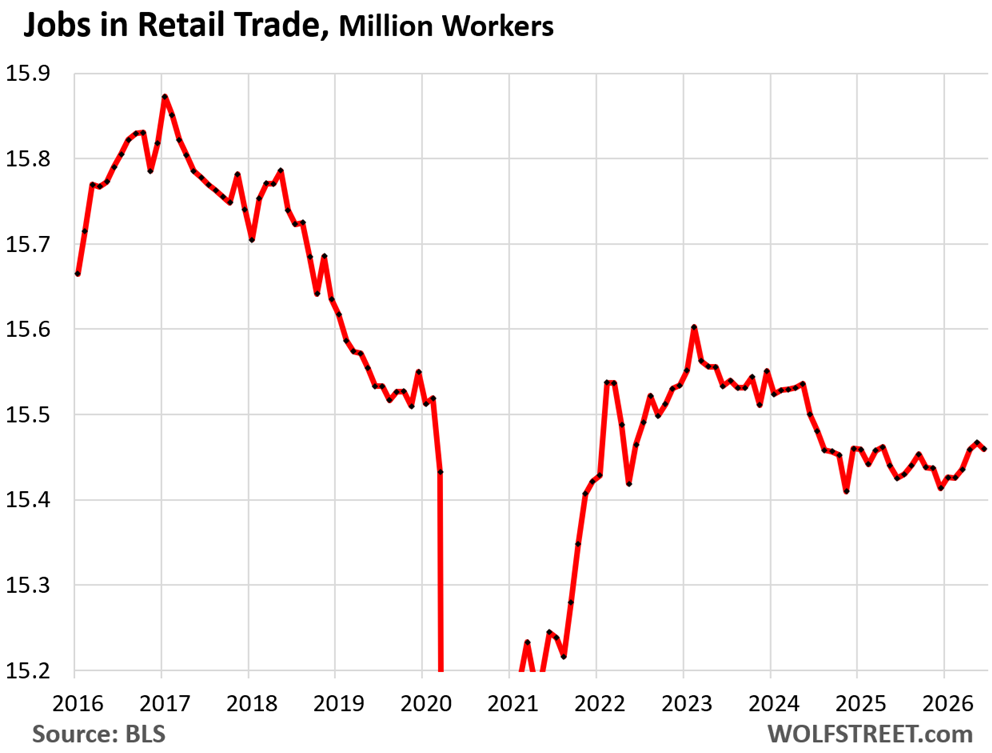
Jobs in Retail trade are at brick-and-mortar retail stores, such as malls, auto dealers, grocery stores, gas stations, etc., and other retail locations such as markets.
It does not include the tech-related jobs of ecommerce operations, drivers, and warehouse employees.
A big portion of this sector has been under pressure from ecommerce, and dozens of major retailers have been liquidated in bankruptcy court, some of which we have documented since 2016 in our Brick-and-Mortar Meltdown series.
The brick-and-mortar retailers that are doing well are those that are selling groceries, motor vehicles, gasoline, and others that are not under pressure from ecommerce.
- Total employment: 15.46 million
- 3-month average growth: +8,000.
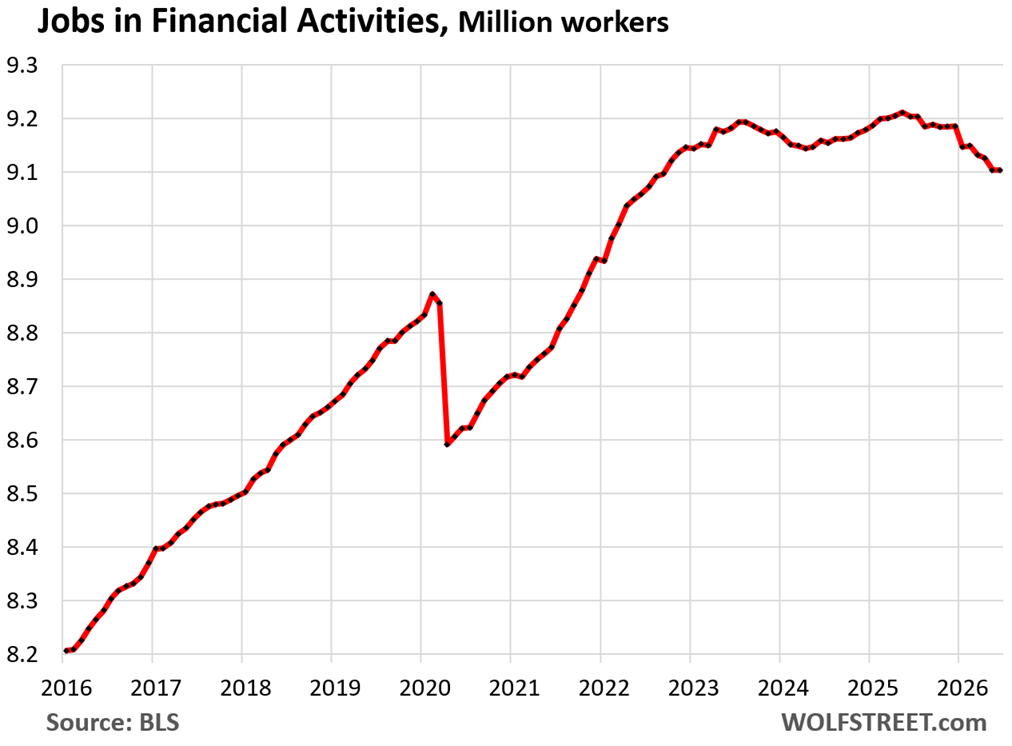
Jobs in Financial activities (finance and insurance plus real estate renting, leasing, buying, selling, and management). The decline is driven by the real estate turn-down, which has led to massive job destruction among mortgage lenders and mortgage brokers.
- Total employment: 9.10 million
- 3-month average growth: -9,000
Jobs in Transportation and Warehousing:
- Total employment: 6.05 million
- 3-month average growth: +22,000
![]()
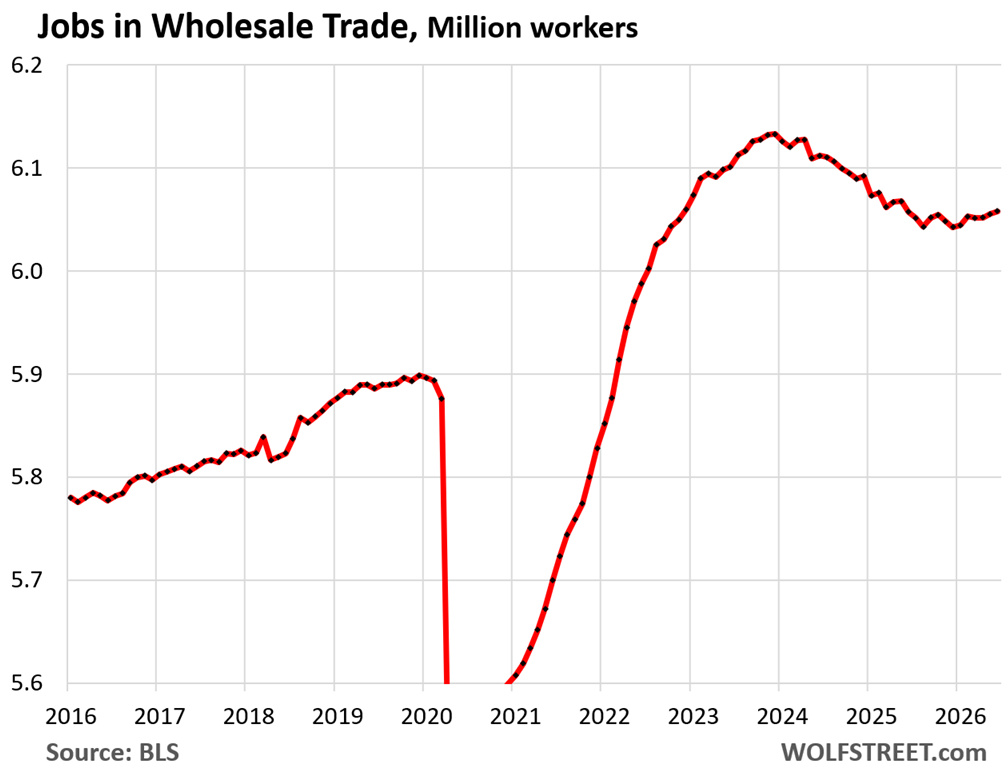
Jobs in Wholesale Trade:
- Total employment: 6.58 million.
- 3-month average growth: +2,000
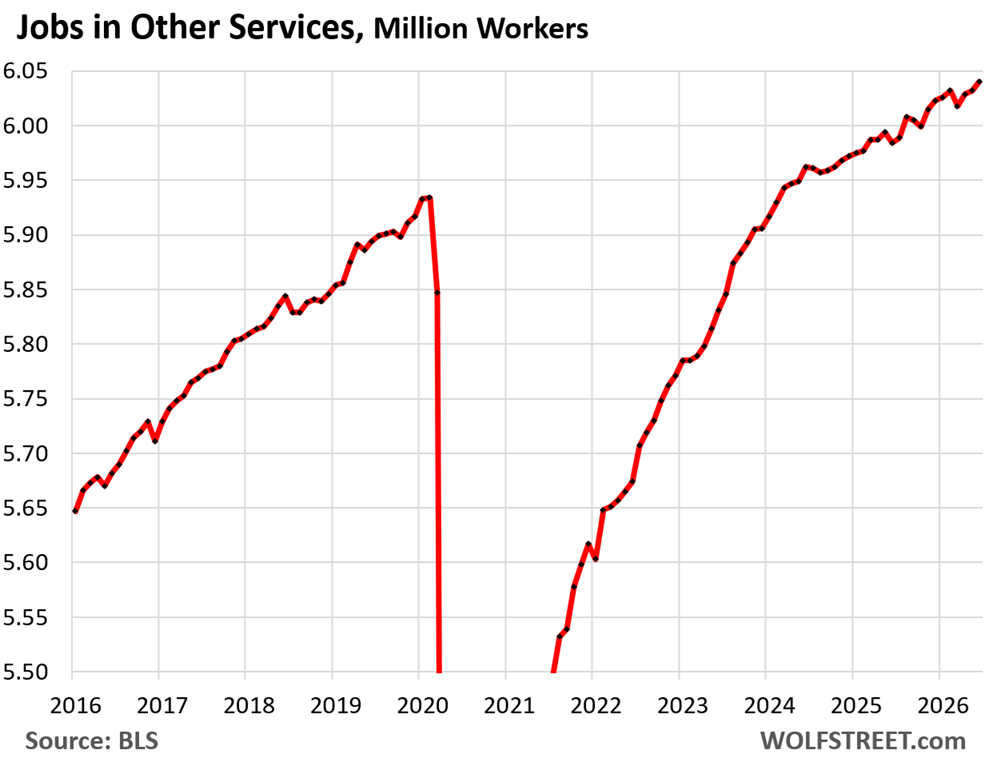
Jobs in “Other services”: includes repairing equipment and machinery; promoting or administering religious activities; grantmaking; advocacy; dry-cleaning & laundry services; personal care services; death care services; pet care services; photofinishing services; parking services; and dating services.
- Total employment: 6.04 million
- 3-month average growth: +7,000
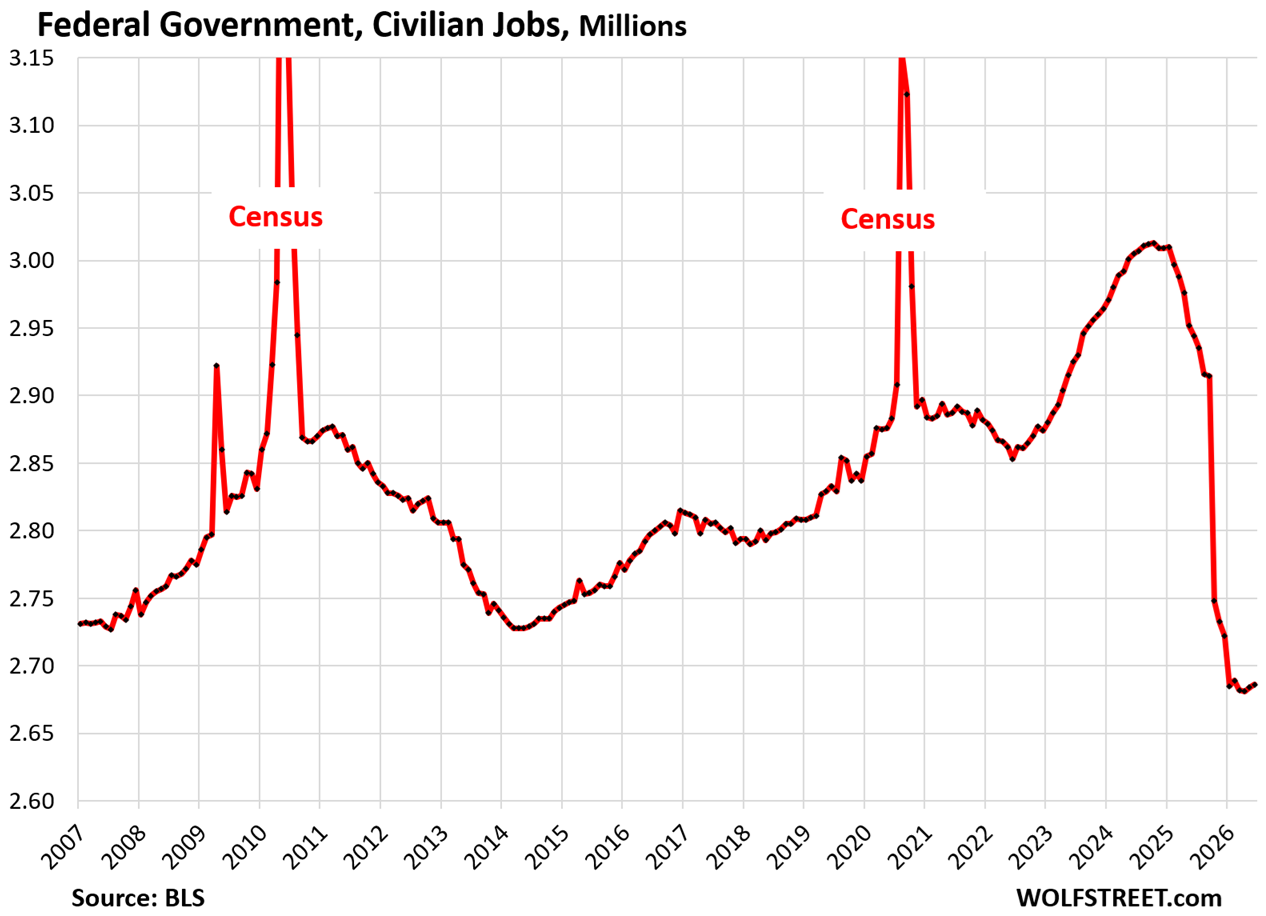
Federal government: Since January 2025, civilian employment shrank by 324,000 workers.
- Total employment: 2.69 million
- 3-month average growth: +1,000
Government payrolls don’t include workers on the payroll of government contractors; they’re in private-sector categories, such as in “Professional and business services,” and government cutbacks on contractors triggered some layoffs on those non-government categories also.
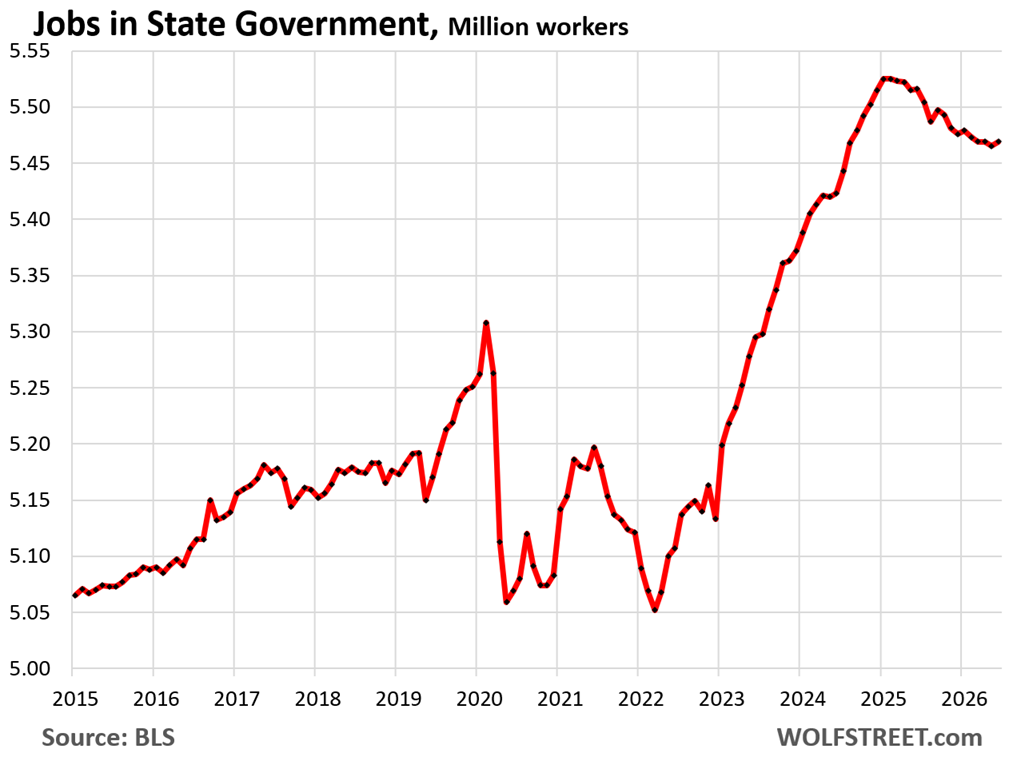
Jobs at State governments, a large portion of which are jobs a state universities and colleges, which are huge employers, but enrollment has been declining, especially enrollment of foreign students, where state universities get a big chunk of their tuition and fee income.
Since January 2025, state governments have shed 56,000 jobs.
- Total employment: 5.47 million
- 3-month average growth: 0
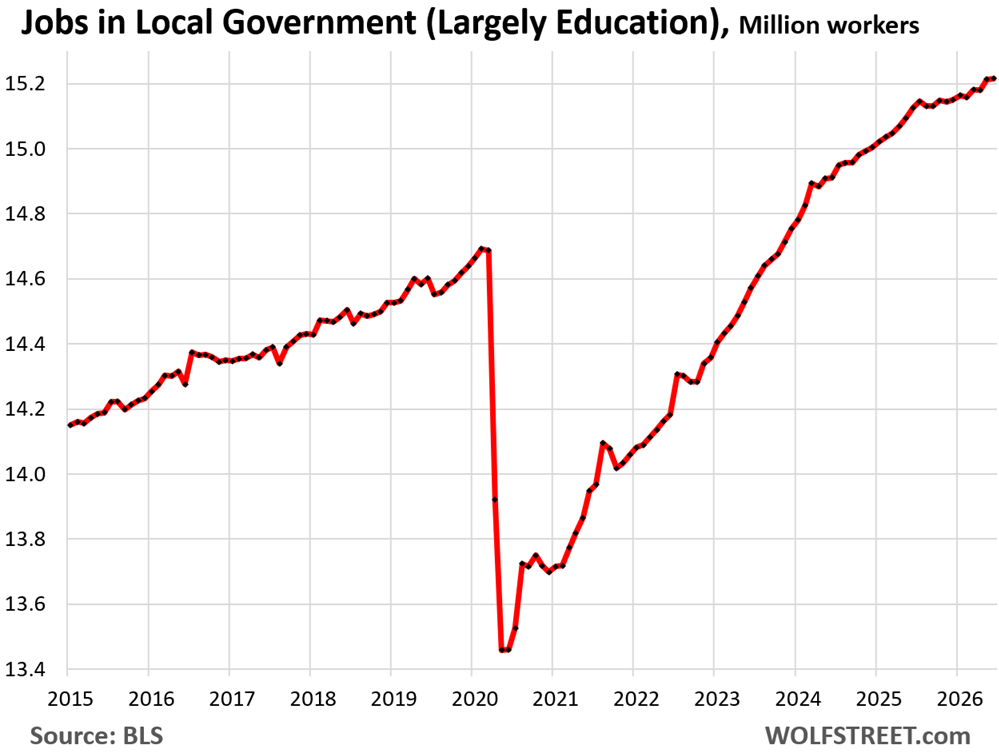
Jobs at Local governments, mostly educators, first responders, and healthcare workers.
- Total employment: 15.22 million
- 3-month average growth: +11,000
Enjoy reading WOLF STREET and want to support it? You can donate. I appreciate it immensely. Click on the mug to find out how:

![]()
“When people retire and stop looking for a job, they’re no longer “participating” in the labor force but remain in the population until they die.”
That made my day…thanks Wolf
Right! He drops these bombs regularly, if you’re looking.
It’s funny how the markets, like salivating dogs, instinctively rush towards rate cuts as soon as they see a “low” headline jobs number. (ZQZ26, the federal funds future for Dec 2026, went up by 0.055%, a large move on a single report from 5 months out.) Markets are not necessarily smart or predictive, but they certainly generate volatility to profit off of.
Powell already said the consensus on the committee (and I doubt the Warsh-led FOMC is much different) is the unemployment rate matters more than the headline gain/loss number, which has been distorted by very low immigration. The unemployment rate edged down to 4.2%.
I support rate cuts because I am large mortgage debtor, and I want the Fed to inflate-away my debt.
That only works if you get corresponding increases in income.
So far it has been working, but with wage growth at 4.2% and CPI at 4.2% we may have crossed over to negative real wage growth.
Maybe the demographic graying and immigration discouragement will put more negotiating power in the hands of workers – if they can manage to use it.
That headline from Wolf is music to my ears.
I’ll wait for the revisions
“Within a 50-year timeframe, the current unemployment rate is low..”
But in 1987 I highly doubt there were millions of gig jobs which in 2026 count as a non small number of very educated people’s careers, who are often working multiple of them.
In 1977 those same “in theory” people bought a home with land and had 30 year stable firms. They didn’t have innovation, nor a personal one man trillionaire.
This all shows the nation state can do what it wishes, including destroying the peoples quality of life which is what the USA has done over the last 10-20 years to its people and is accelerating by many measures.
Good lordy
1. “But in 1987 I highly doubt there were millions of gig jobs….”
The ratio of gig workers to total employment has dropped to a historic low.
2. “…who are often working multiple of them.”
A tech worker with a rental property that he manages is a “multiple jobholder.” An architect how owns a small apartment building is a “multiple jobholder.” There are many multiple job holders on this board. Mom-and-pop landlords (owning 1-9 rentals) own about 11 million single-family rentals. And millions of these mom-and-pop landlords have day jobs, and they’re multiple job holders. There are many other situations like this. An engineer who works on the side as a consultant is a multiple jobholder. And why shouldn’t they? Working at home gives people all kinds of freedoms. What is this BS that you should only work the minimum possible????
That said… The data for multiple jobholders only goes back to 1994, so I cannot show you what the ratio of multiple jobholders to total employment was in 1970. But in the 1990s, it was a higher than now.
30-year stable firms? 400,000 people lost their jobs when the Apollo program ended between the late 1960s to the mid 1970s. My Dad almost moved to Australia trying to find a job. It didn’t feel stable at the time.
Unemployment exceeded 8% in 1975, mainly due to the oil crises. Sure, there were companies where you might have a job for 30 years, but for many people this wasn’t a period of stable employment.
Unemployment exceeded 10% in late 1981 and early 1982 during the second “dip” of the Double Dip Recession. I’d just gotten out of grad school, and it was hell… no jobs, double-digit inflation, lots of people looking for jobs. Commenter SomeGuy needs to do some time travel.
agreed.
I landed a job as a live in park ranger at Jalama for SB county in 1981. I took home just under $400 every two weeks and I was on Cloud 9. That lasted 2 years. Great while it lasted.
Totally same in Canada. Age 24, new house and mortgage, new baby in the house, piece work carpentry instead of my flying job, and I had to work away from home for 3 months at a time. Then… on the mortgage renewal date the rate went up to 18%. Managed to secure private financing at 10% as banks were only paying savers 7-8%. Lender happy, and moi happy to survive. It changes you. It makes you into a saver with preps in place and a lot of gratitude for any opportunity. Lived very tight. In hindsight it was a very positive education.
We’re entering uncharted population growth rate territory now! Well… except for Japan, South Korea, Italy, Germany, China, Spain, Portugal, Greece, Finland, Austria, Poland, Latvia, Lithuania, Estonia, Russia, Hungary, Czech Republic, Slovakia, Croatia, Romania, or Bulgaria.
Other than those, completely uncharted!
A reduction in the size of the workforce is something we should all get used to. Between declining birthrates and anti immigration sentiment, it could be the future. It may not be a bad thing in the age of AI and robotics. How many workers will be needed in ten years? I’m betting a lot fewer.
This rant is about the labor market as it pertains to clinical health care.
I’m a retired Cardiac RN. I worked in Cath Labs (stent placements) and CABG “cabbage patch” Cardiac Artery Bypass Graft surgical units for 32 years. My wife was an HR recruiter for the same large teaching medical center on the west coast, where I was also employed for 30 years.
The labor pool to draw competent clinical health care workers from CNAs up to attending physicians is shrinking and getting worse. There are constantly more open positions than there are applicants. This causes increased work load and stress levels leading to burn out and high turnover. Decent affordable housing is hard to find so people that wanted to work there couldn’t move there. This ongoing, national situation is causing many nurses and physicians to become “travelers”. They often make 20%+ more an hour than current full time employees. This drives up labor costs for hospitals and it is killing them. Many full time RNs use vacation time to go another hospital or clinic close by to work for these increased wages. So, what you have is a self reinforcing feed back loop of rising costs for hospitals trying to stay afloat. This is one reason so many rural clinics are closing down. Nursing programs are pumping them out as fast as possible and as a result, when I retired, most newbie RNs could not start an IV unsupervised.
The jobs are there. There aren’t enough people to fill them. We lost a lot of brain trust physicians and RNS that retired or quit after Obama care happened. Health care has become collecting data, entering that data into an EHR software program, documenting it, then documenting that you documented it. It is controlled by insurance conglomerates and clinical charge capture departments.
Health care is hiring and it pays, but you better have thick skin and be a glutton for punishment.
We are benefiting from US doctors arriving in BC. Plus nurses and nurse practitioners. This change is keeping our more rural clinics open.
“The numbers from B.C.’s Ministry of Health show 89 doctors, 42 nurse practitioners, 260 nurses and 23 allied health professionals from the U.S. accepted jobs in the province between March 2025 and January 2026.”
and this recent bit of news:
The community of Quesnel in northern B.C. is pulling out all the stops to attract U.S.-trained physicians and solve previously long waits for family doctors.
A health-care recruiter in the community of around 10,000 people says the city’s so-called “red carpet” approach is working — with at least four doctors committed to work there by the end of the summer.
Since your brought it up for the second time, I looked it up: The net brain-drain might go the other way:
“New research from SecondStreet.org shows that over 18,000 Canadian health care workers are licensed to work in just 14 states.” : SecondStreet.org, a Canadian healthcare publication.
Including:
IN just five of those states (CA, TX, FL, IL, MA), 7,265 Canadian trained nurses (Just nurses, not including others) were licensed to work, of which 363 were from BC.
Total healthcare workers: “Texas attracted the most Canadian health care workers (6,063) among the states examined. However, 4,468 of those licenses did not specify which Canadian province. Ontario health care workers were most likely to obtain licenses in the five U.S. states (1,905). U.S. states issued a low number of nursing licenses (304) to Quebec workers. This may be due to the province’s large private health care sector providing workers with more choice and helping to retain them in Canada. Alternatively, the language barrier may play a role.”
This might be the first time in history that we are trying to cut our way to prosperity. Could it work? Sure. I am open minded. Will it work? Unlikely. The population of the world is still growing (even if barely). I would rather have many if them under an umbrella economy built on dynamism, intellectual advancement, and growth, rather than on cutting to the bone to keep those that already made it happy.
Wrong on so many levels.
Seems like almost every developed country will see a shrinking supply of labor given demographics and so it seems low unemployment, while still generally good, seems like it can lead to false conclusions. That, coupled with lots of extra funding that occurs when people retire, makes for an interesting couple of upcoming decades.
Be interesting how to Fed responds as well, although the larger and rising issue, imo, is youth unemployment. Remains to be seen how that plays out.
Collecting data isn’t the same as outcomes for health improvement . Toward the end of my 30 yrs as an advanced degree RN I noticed this bean counter effect moving into health care. Worse now w A I , presume. I can recall my research and stat courses And ongoing analysis papers citing the simple fact that “health outcomes” are improved by quality consistent care standards including education of patients at the right opportunities to create effectiveness. As well health providers in the nursing area if invested in and allowed to practice their profession is actually a money saver. Health care is getting so expensive w middle management / ins companies and now private equity taking over. It’s not any better quality and WAY more expensive . Obama care improved access .. why do you cite Obama Care the reason the professionals left their jobs .. I don’t get that at all. We all thought that very positive . People who only show up at the last minute for health care vs come to the doctor w ins coverage regularly is an obvious ethical and practical difference.
At one place I worked I checked the same boxes on work orders (maybe 2-3/week….only because I was forced to deal with them because someone else started the job and it was still open when I had to finish it…I never started any), one box for the action, raise/lower, and one box for the object, urinal. I only worked on machines, not urinals.
Anyway it took almost 2 years for someone to notice it and send word down from somewhere for my boss to tell me, “No more raise/lower urinal!”.
Just a bottom level worker’s perspective on “middle management”, FWIW.
Oh!…occurred somewhere around ’95 as I recall, for more perspective.
Fertility rates in the US have been dropping for the last century.
It takes some real mental bargaining to come up with scenarios where real GDP can keep growing at historical rates even as population growth switches over to population shrinkage.
A smaller workforce means less production unless you are an extreme futurist imagining AI making everyone twice as productive.