Even without gas stations, retail sales jumped, powered by ecommerce, auto dealers, general merchandise stores, and other retailers.
By Wolf Richter for WOLF STREET.
Retail sales soared in March by 1.7% from February, seasonally adjusted. Compared to March last year, sales jumped by 4.5%, not seasonally adjusted.
But there was this spike in the price of gasoline, which caused sales at gas stations to spike. So the question arises: Did Americans cut spending on other stuff that they buy at retailers in order to buy gasoline? Nope, not Americans. Born to splurge.
Retail sales without gas stations jumped by 0.61% in March from February, after having already jumped by 0.67% in February, seasonally adjusted (red line in the chart). Year-over-year, retail sales without gas stations rose by 3.5% not seasonally adjusted (blue).
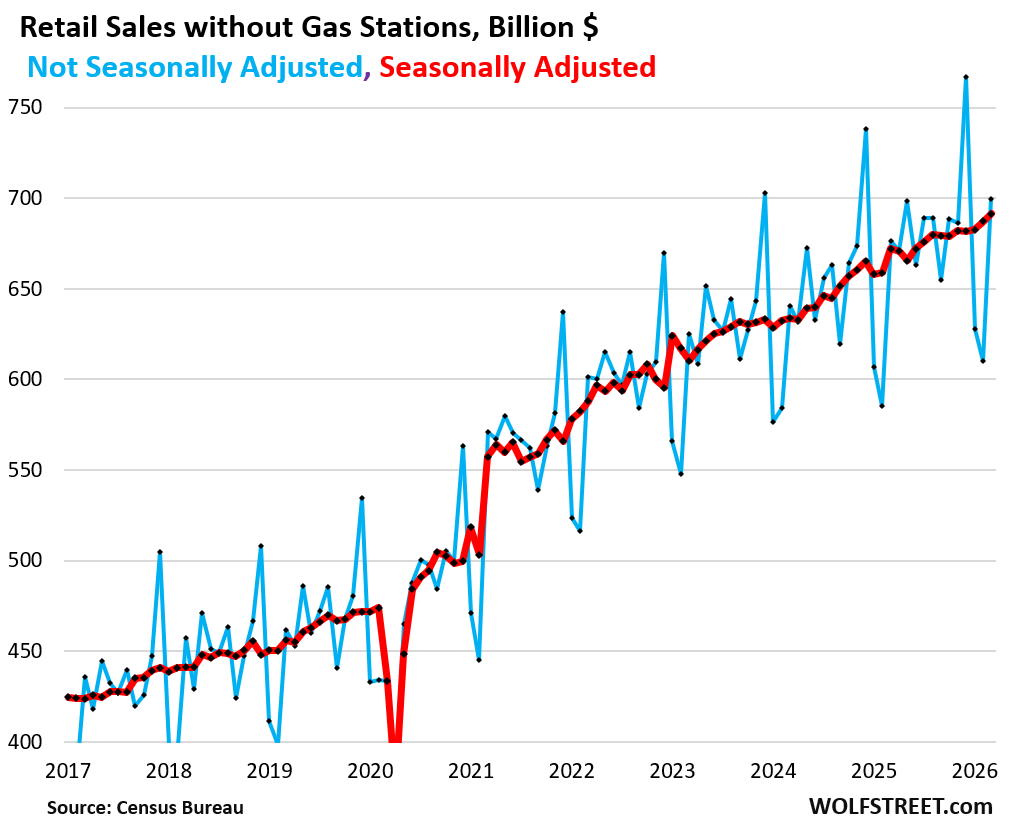
Avid inflation-adjusters, note: Most inflation is in services, and retailers don’t sell services, they sell goods. CPI inflation in durable goods was close to 0% in March both month-to-month and year-over-year. And CPI inflation in food bought at grocers was 0% in March and less than 2% year-over-year. The CPI for gasoline spiked, and that explains the spike in gasoline sales, see chart further below.
Inflation in services, which is where Americans do two-thirds of their spending, was over 3%. But you cannot adjust retail sales to inflation in services that retailers don’t sell. You have to adjust retail sales to inflation in the goods that retailers sell. And outside of gasoline, there wasn’t much.
The largest categories of retailers.
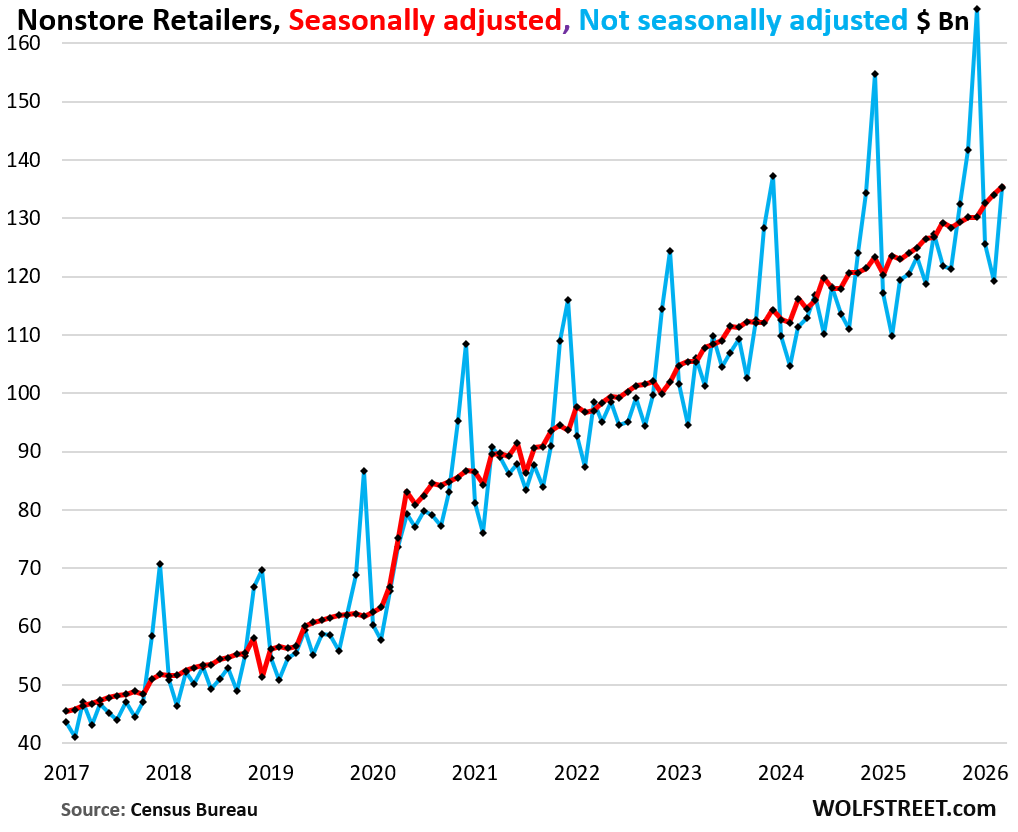
Ecommerce sales (18% of total retail sales) have been soaring relentlessly, gobbling up market share from brick-and-mortar retailers, growing year-over-year at over twice the rate of overall retail sales.
This includes ecommerce sales by retailers with brick-and-mortar stores, such as Walmart, Macy’s, Costco, etc. Their online sales count here, and their brick-and-mortar sales count in their brick-and-mortar category.
In March, sales at these nonstore retailers jumped by 1.0% from February, seasonally adjusted, to a record $135 billion, making it the #1 largest category of retailers in March.
Year-over-year, sales jumped by 13% not seasonally adjusted and by 10% seasonally adjusted.
There is no sign that consumers cut their online spending because they spent more on gasoline. These are big sales increases, even for ecommerce:
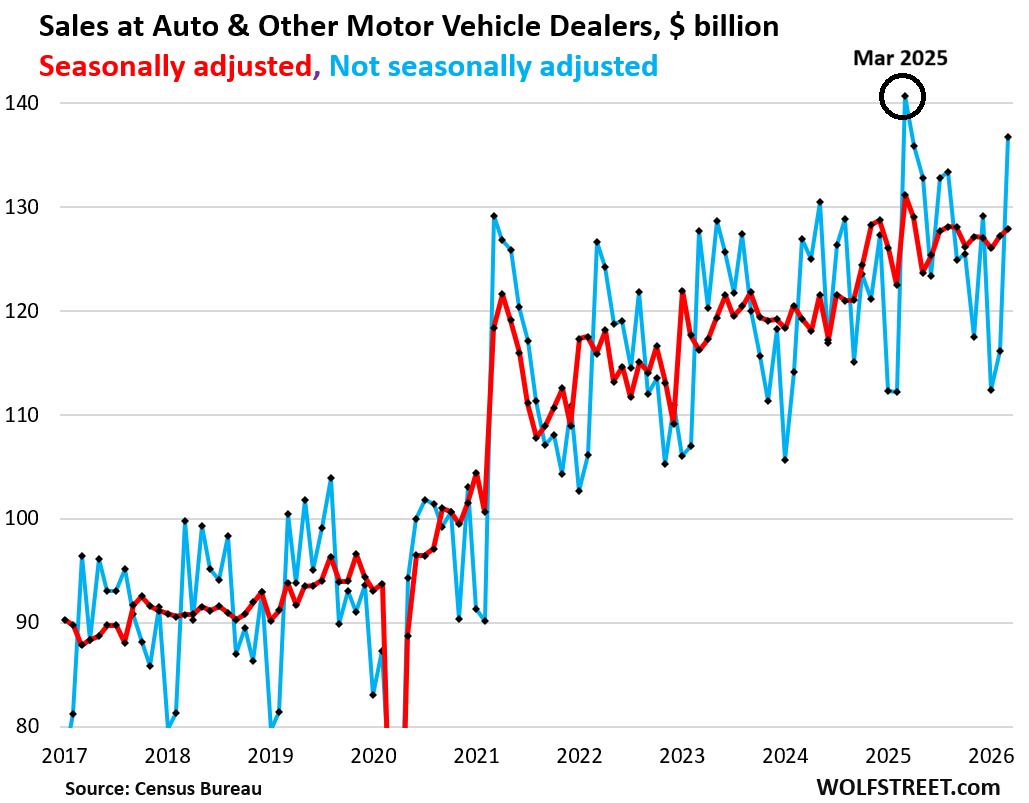
Sales at Auto & other motor vehicle dealers (17% of total retail sales) rose by 0.6% in March from February, seasonally adjusted.
Year-over-year, sales fell by 2.8% not seasonally adjusted (blue line). But that was compared to March 2025, when tariff-fearmongering clickbait in the mainstream media, financial media, and social media about exploding auto prices caused a massive wave of frontrunning and a huge spike in sales. Those prices ended up barely budging, as automakers had to eat all of the tariffs to not lose sales and market share. Beyond that front-running-distorted comparison, sales in March this year were pretty good, the second-highest ever, up by 18% month-to-month not seasonally adjusted, and by 0.6% seasonally adjusted.
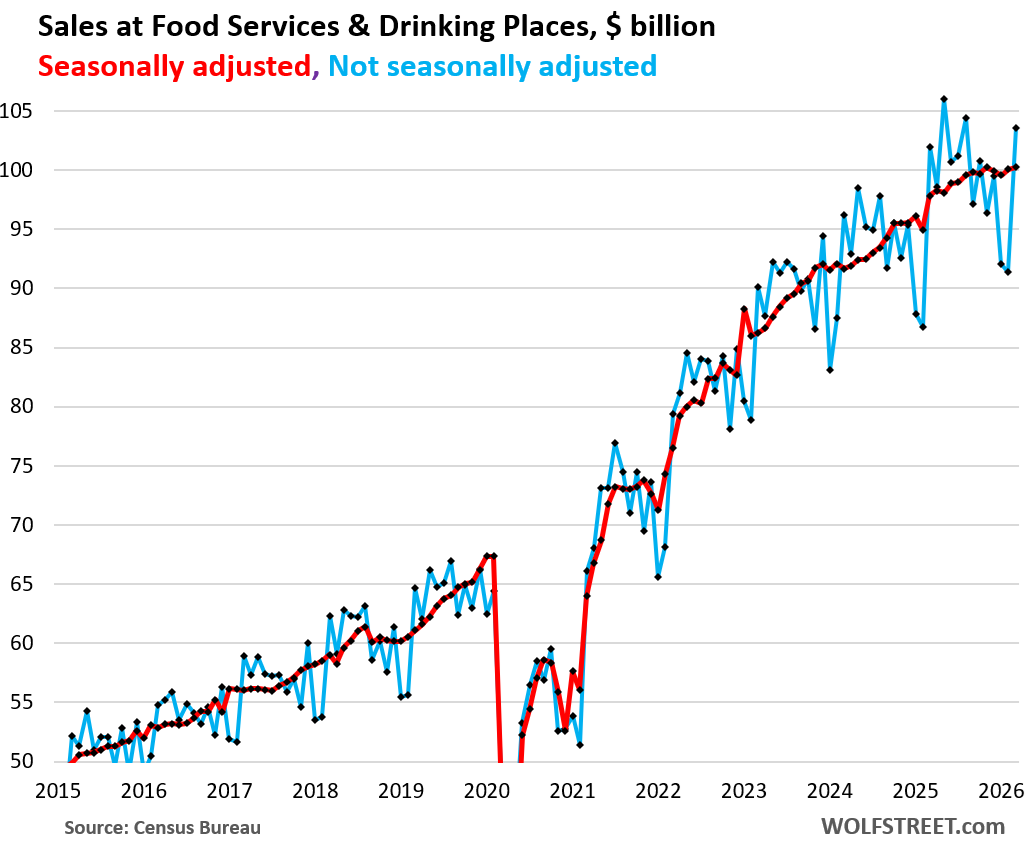
Sales at Food services & drinking places, such as restaurants and bars (12% of total retail sales), rose by 0.1% in March from February, seasonally adjusted.
Year-over-year, sales rose by 2.4% seasonally adjusted and by 1.6% not seasonally adjusted.
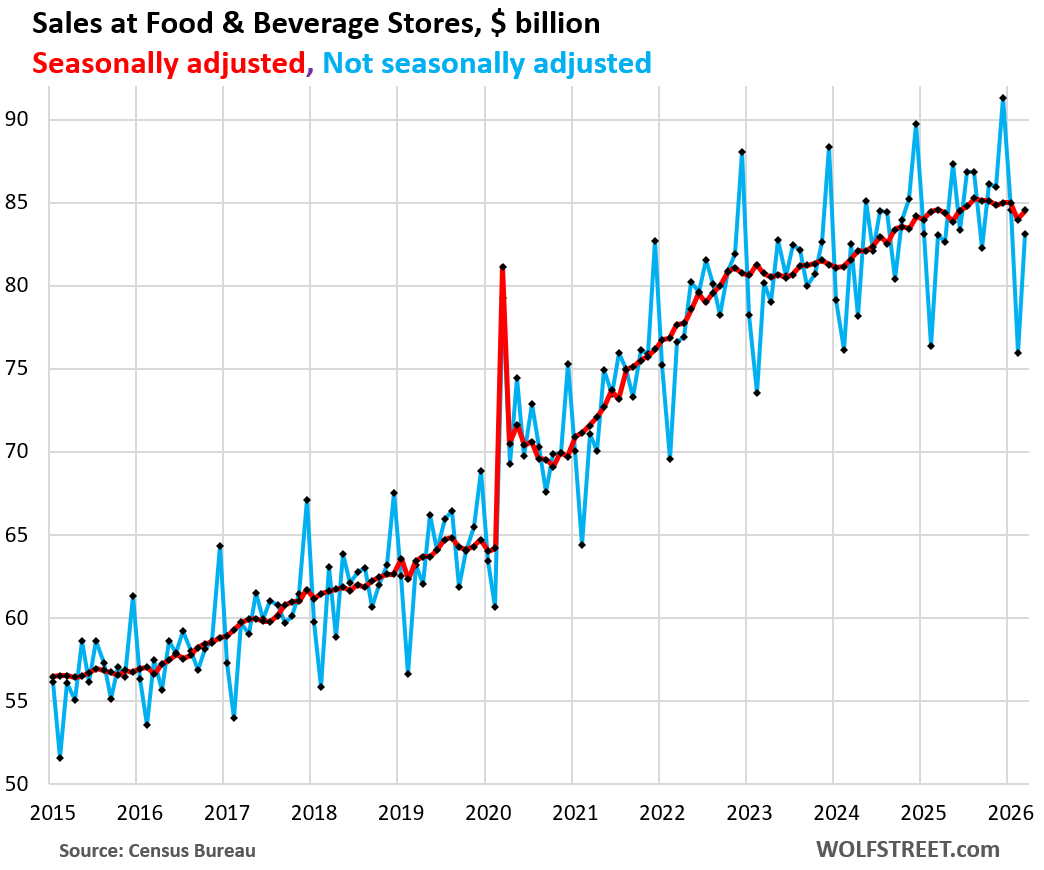
Food & Beverage stores, such as brick-and-mortar supermarkets, grocery stores, and specialized beverage stores (12% of total retail sales) have long been losing market share to online grocery retailers, including their own online operations, to “general merchandise stores,” such as Walmart and Costco that do a booming business in groceries, and to restaurants (see chart above).
So when “sales at food & beverage stores” languish, it’s not because Americans went on a diet, but because sales shifted to other types of retailers, including ecommerce, general merchandise stores, and restaurants. This has been going on for many years.
Walmart, the largest grocer in the US, has been aggressively going after the grocery business, including the ecommerce grocery business, none of which count here in this category. Amazon has been selling groceries online in various iterations. There is now a huge choice of online food retailers – both online-only retailers and the online operations of brick-and-mortar retailers. And these sales don’t count in this category of “Food & beverage stores”; the count in ecommerce, regardless of how the food got into the house, whether delivered by the company, or a carrier, or picked up by the customer.
And we can see this change show up here in the numbers.
Sales at food & beverage stores (brick-and-mortar) jumped 0.7% in March from February, but was unchanged year-over-year, at $84 billion
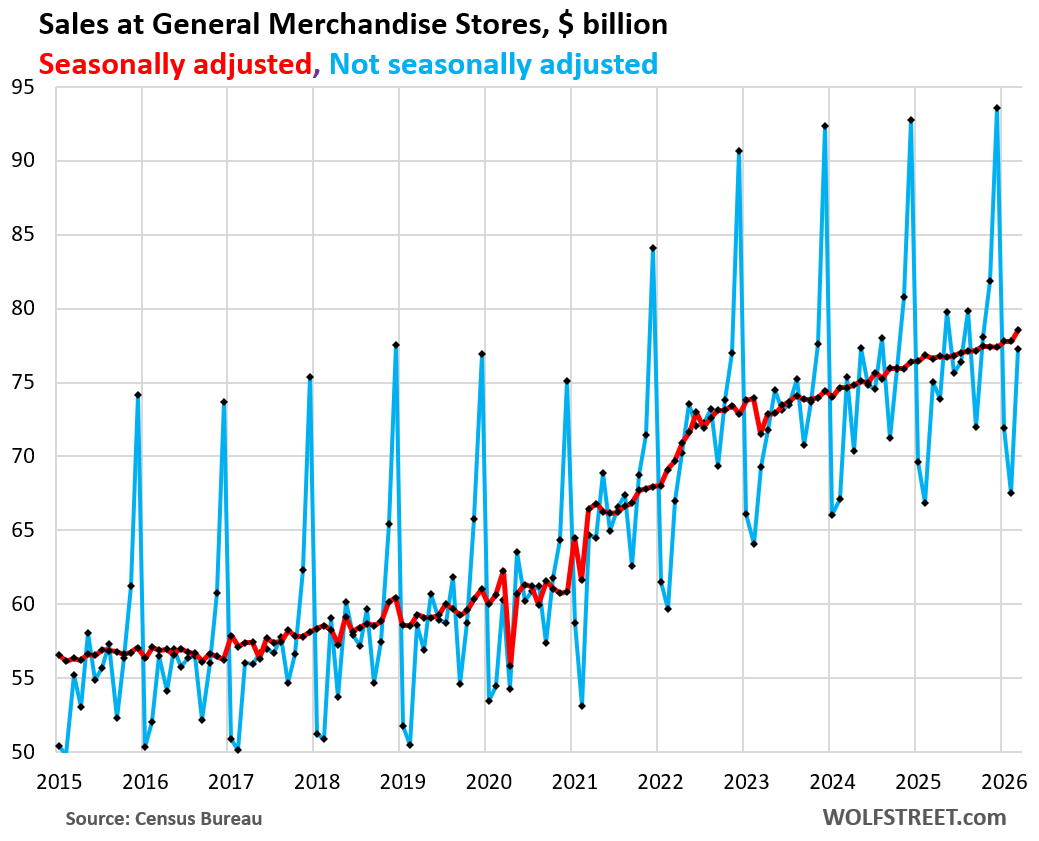
Sales at General merchandise stores (11% of total retail sales) jumped by 1.0% in March from February to $79 billion. Year-over-year, sales were up by 3.0% not seasonally adjusted and by 2.5% seasonally adjusted.
This category includes Walmart, Costco, Target, and many others. Many of them also sell groceries, with Walmart being the #1 grocer in the US, and their grocery sales are here in this category, not in the category of food & beverage stores.
But sales of their ecommerce operations are included under the ecommerce retailers above.
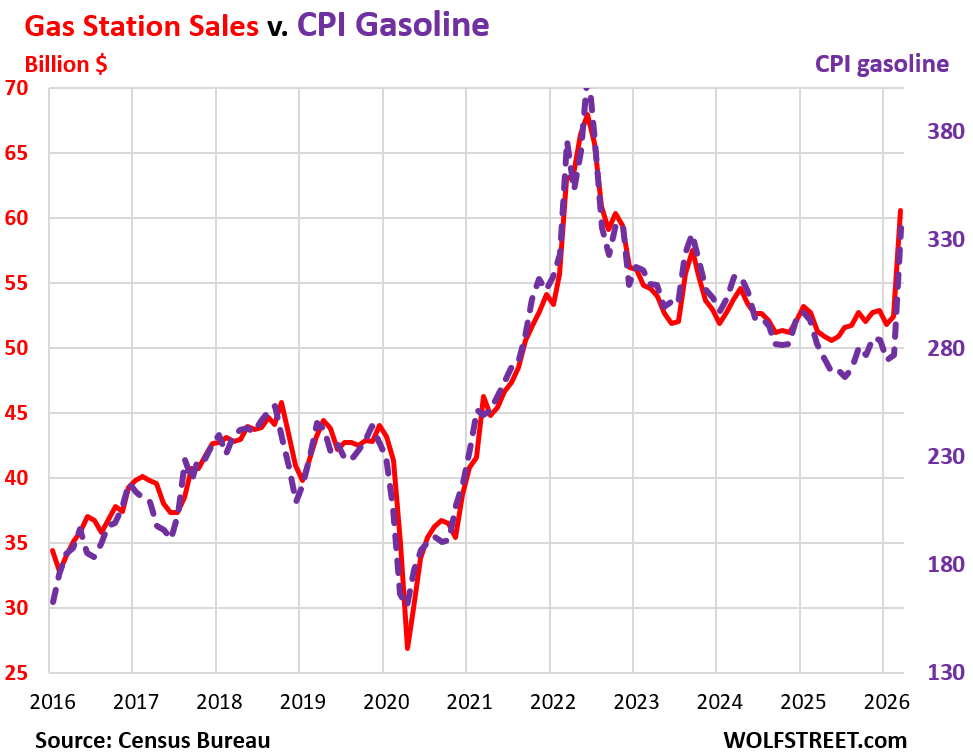
Sales at gas stations (7% of total retail sales) move in lockstep with the price of gasoline. Gasoline prices spiked in March, so sales at gas stations spiked in March.
Sales at gas stations spiked by 15.4% in March from February, and by 18% year-over-year to $61 billion (red in the chart below, left scale).
The purple dotted line (right scale) shows the CPI for gasoline, which also spiked.
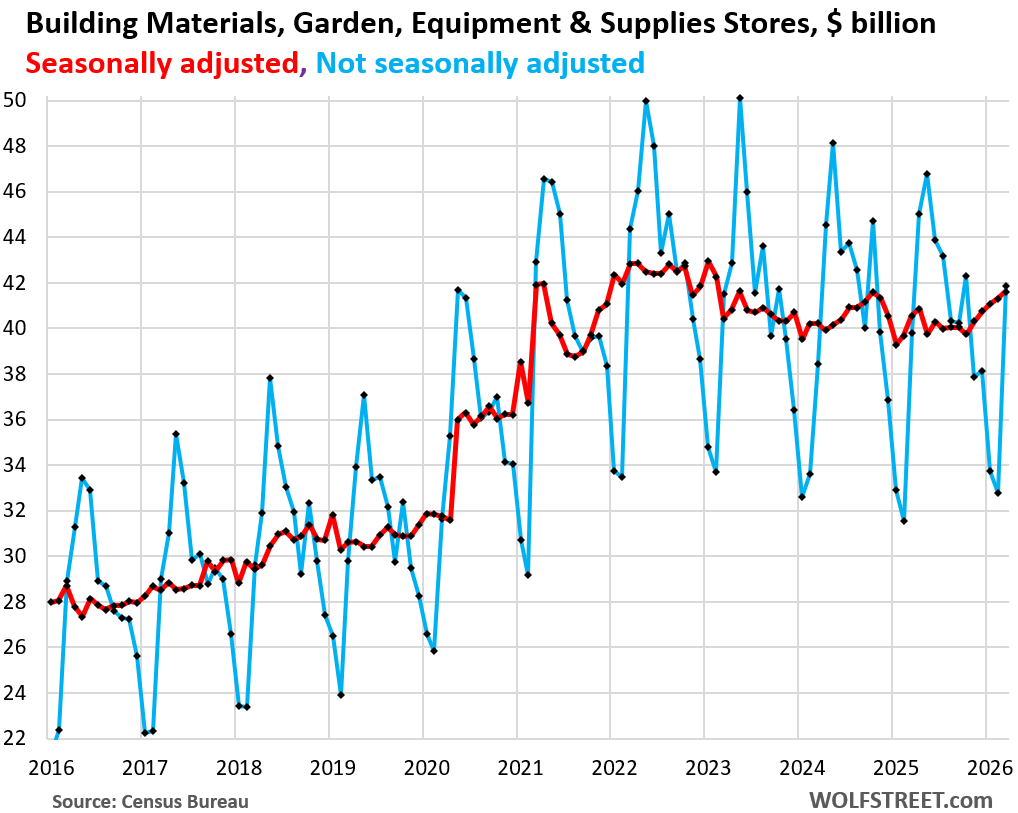
Sales at Building materials, garden supply and equipment stores (6% of total retail sales) jumped by 0.7% in March from February, seasonally adjusted, to $42 billion. Year-over-year sales were up by 2.6% seasonally adjusted and by 5.3% not seasonally adjusted.
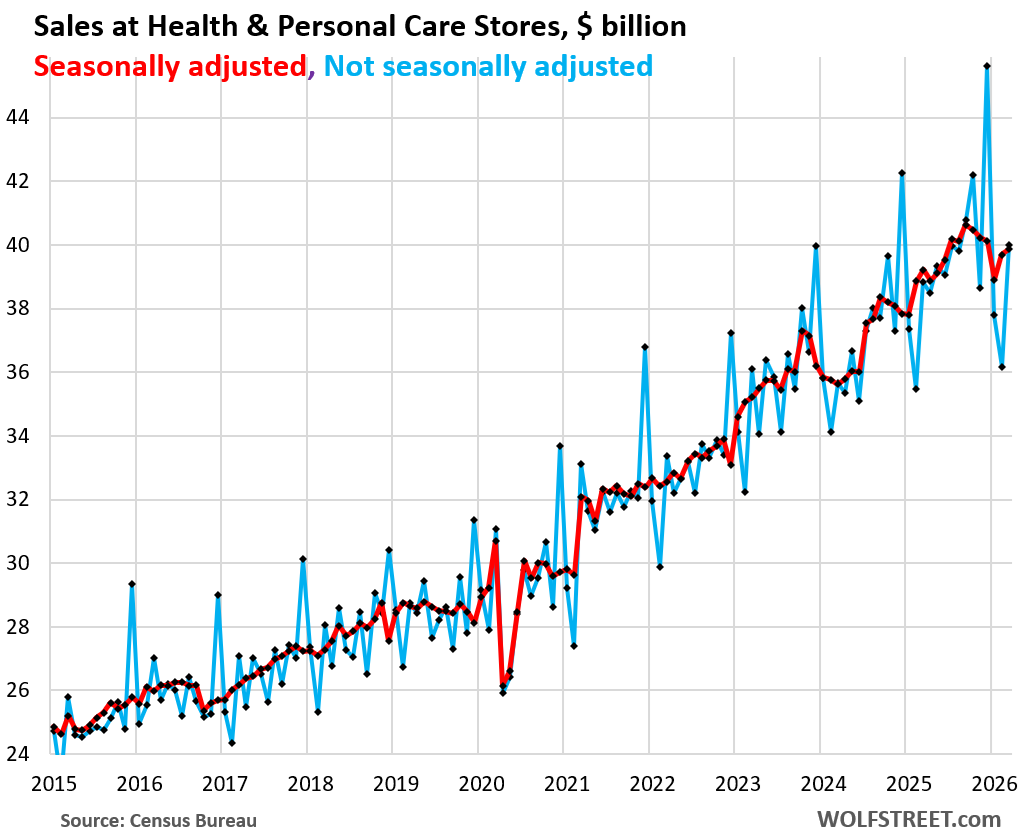
Sales at Health and personal care stores (5% of total retail sales) rose by 0.5% in March from February seasonally adjusted, to $40 billion.
Year-over-year, sales rose by 3.0% not seasonally adjusted and by 1.6% seasonally adjusted.
In case you missed it: Where Americans Spend their Trillions on Goods and How that Changed since 2015
Enjoy reading WOLF STREET and want to support it? You can donate. I appreciate it immensely. Click on the mug to find out how:

![]()
Howdy Lone Wolf. A Sober Sailor Guilty as charged. US old squirrels learned a long time ago, always save some of your $$$ and you will live your life your way. No matter what comes. Currently received my best discount ever on a new car and thought, what the hell buy it even though I could have kept my old one. Cant take it with you …..
A senior sober sailor sailing till I can t sail no more…..
What new car did you get?
Bought an a6 12 k discount. Last year love my sedan.
Congratulations! It is true that you only live once and you can’t take it with you. So YOLO and YCTIWY…….
My very frugal brother bought 2 new cars last year with great incentives.
His and her dream cars.
I don’t know what happened to him other than he is older and now likely wiser. Oh, and his kids all moved out.
It’s not the tax refunds that are doing it. Just found out the IRS is 2 months behind processing paper tax returns due to the shutdown. I will not get mine before mid June at the earliest even though they received it on March 6th. They haven’t even entered mine into their system. It was sitting for 2 months collecting dust.
You are assuming your situation applies to others. Did you know that 94% of federal tax returns are filed electronically with refunds issued quickly?
Rather than complain, why not file electronically?
Bobber,
My taxes are done on Excel speadsheets. There are only 8 numbers that change from year to year. It takes me 5 minutes to write these numbers on the 1040 and send it in. My returns always came in within 4 weeks using this methodology except for this year. The IRS staff was cut back due to DOGE and they have terrible customer service.
I hear ya SC,,, but, in fact, IRS did not take long to cash the check, handwritten, that I sent them to make up the delta between the wife’s W-2 and the final amount of tax we owed.
Why anyone would want to loan $, $$, or more to the GUV MINT when it is not necessary is beyond me???
Never did, and although I sometimes owed $$, I always had it covered in some kind of interest bearing account, and paid in full on or by 15april.
Gotta thank again the fine ”tax preparer” lady at one of the major companies in that biz who showed me how to do the required schedules and 1040 in 1984,,, really fairly simple then, and easier now IMVHO…
It would cost me thousands to file electronically
I file book every year due to llc’s
accountants want to much and I can fill in .pdf forms easy peasy
make copies and send them off
I to do everything on excel spreadsheets
I run business and don’t have time to learn/file electronically
if they don’t like it I can just not file
puter and printer work fine
and USPS needs my business
Why didn’t you file the federal tax return electronically? When you do that it gets entered and processed immediately.
Swamp Creature
That’s nonsense. The IRS is not behind, and the IRS doesn’t “enter” paper returns. They’re scanned by machines.
Through April 10:
https://www.irs.gov/newsroom/filing-season-statistics-for-week-ending-april-10-2026
Yep, the IRS is the last agency to be “behind” and they have a huge incentive to not be behind. Per your data, millions (36ish million) owe taxes after filing.
I filed(paper) early, April 10th, and sent them check(paper)
I know tax refunds are up because of the tax cuts, but looking at the decrease in number of returns received, and the increase in number of refunds, I start to wonder how the decrease in the number of auditors factored in
Sorry Wolf
I have to disagree
I talked directly to the IRS and they said they are 2 months behind on processing paper returns. That is an exact quote. They blame the government shutdown. They were very nasty on the phone and almost hung up on me twice. I was on hold for over an hour just to get a human to talk to. The data above and your Web link does not differentiate between paper and electronic returns. Last year, 2024, I sent in a paper return and had my refund by April 7th. This year I’m due a $3,000 refund and will have to wait till June 15th to get my return processed. My return is so simple you can do it on a 3 by 5 postcard.
The hour on the phone is likely more than the time it would take to efile your absurdly simple return.
This is also why I have shifted my grocery shopping to mostly “online.”
The hour (+?) it may take to get through the store os replaced with 20- ish minutes online and 5-10 minutes to pickup.
These are the forces that shape our economy.
We had our refund in about 1 week. As did most people.
Wolf.
I really want to know how much the bottom 80% are spending. Last time I looked, the top 10% account for 50% of the consumer spending. It is not at all inconsistent with the K-shaped economy to see the lowest level of consumer satisfaction with out of control spending based on market riches.
1. The “bottom 80%” spend a lot more than before. The top 20% spend a lot more than before. Both legs of the K would need to go up, with the top leg going up at a slightly steeper angle than the bottom leg. But that wouldn’t be a K and wouldn’t suit your BS narrative. The “K-shaped” is for people who get titillated by braindead clickbait.
2. What is this braindead obsession with spending by the top 20% or top 10% or whatever? Do you want them to spend LESS? What kind of virus do you have in your brain? Their spending supports the economy and jobs; do you want them to hoard all their money and NOT spend it?????
I mailed an amended return from a previous year in September. My transcript shows it was received and filed but not yet processed. Which is fine by me since I am due a refund and am earning 6% compounded daily. Overpaying my taxes (by not filing form 8995-A, which is a bear) and then filing for a cash refund 2 years later (after i figured out how to do Form 8995-A) is turning out to be a really good risk free investment…
I’m just envious of people getting returns. I often owe 5-6K each year for state and Federal. For me, the $30 HR deluxe version is worth it to easily update taxes. That includes free federal filing although I do have to pay state e-filing and worth it compared to printing and dropping in mail. I’d probably have to buy a new printer!
It’d be something to look into: BNPL and how it’s changed since first coming about. I know some of us remember layaway, but this is different. Prolonging the next downturn.
BNPL is MINUSCULE.
And it’s very short term, most plans have four fixed payments stretched over 6 weeks to pay off the entire purchase, interest-free to the consumer.
Americans clearly have a lot more money, collectively, than people realize
Howdy TSonder. I thought I was the only one that paid off credit cards every single month, saved $$$$ all the time, always lived within my means. After seeing the Lone Wolfs articles, I realized how wrong I was… There are millions and millions just like me…. Thought I was special but am not. Oh Well…..
about 1/3 of us are deadbeats – cc industry for those who pay $0.00 interest
saving getting harder as prices, taxes(property especially) and insurance all skyrocketing before we eat, pay utilities
One thing to note is that total retail sales on the first chart is the equivalent of $5000/month/household, or $2000/month/person.
Strange. Being on fixed incomes we haven’t bought anything out of our usual items necessary for maintaining our property and vehicles. No luxury items and actually cut back on vacation. Our insurance, electricity and taxes have all increased along with cost to eat out. Luckily our cars are hybrids so the gas prices don’t affect us much. We don’t do much driving anyway.
Yes, many retirees are in that situation. But not everyone is a retiree.
And speaking as a retiree, not all of us are short of money. I can’t compare to my buddy with $135 million, but if I want something I just buy it. You can’t take it with you!
I am reading more and more about Buy Now Pay Later and how many young people are using this method of payment.
I am wondering how much of these sales are deferred consumer debt?
Interesting article, thanks!
BNPL is MINUSCULE.
And it’s very short term, most plans have four fixed payments stretched over 6 weeks to pay off the entire purchase, interest-free to the consumer.
Bernie Sanders projects every day that Americans are struggling to pay for food and clothing. His famous statement that an average bank balance is $400 has been refuted by federal reserve which reports that the median balance is $8000 in the bank balance. I have been hearing this paycheck to paycheck living since 1990
If you want to make everyone poorer via policy, best to make them think they are poor first.
GOOD ONE Gaston!
Been watching development of the “Welfare State” since it started, and actually was on welfare for a while when became totally blinded temporarily back in early ’70s…
Basically a scam if long term, mostly to support the folx actually doing the ”administrative” part, i.e. those who are approved by the local politicians to have a guaranteed wage as long as they toe the party line, which is very clear they do.
Long time scam of recipients of care and taxpayers far damn shore, as most of the money goes to those in charge of the paperwork…
The population of the US is approx. 350 million. What Bernie describes is reality for 10 million americans. Doesn’t make the fed wrong.
Average balances mean little when some people have huge balances. In a room of a 99 homeless people and one person sitting on a million in cash, the average balance is $10,000.
The comment by “Ram” that you replied to said “the MEDIAN balance is $8000 in the bank balance,” not average balance. Then google the difference between median and average 🤣
Just one moron’s take: Are we actually struggling?
The media loves to act like we’re all huddled over coupon books and canning pears to survive, but I’m just not seeing it. Maybe I’m in a bubble, but nobody I know is ready to “chamber up the old Colt” over this economy.
Sure, some people have it rough—that’s always true—but a whole lot of people are doing just fine. Every time I look around, the planes are full, the stadiums are packed, and restaurants are slammed. People are shopping and vacationing everywhere.
Obviously, between the Biden-era inflation and flat wages, and then Trump tariffs, we all felt a crunch. But the real ‘crisis’ is half media rhetoric and half foolish spenders who never dropped their COVID habits. They’re burning $300 a week on ten-dollar delivery fees for a twelve-dollar burger, or grabbing a Lyft two blocks to pick up some weed. I’m sure credit card balances are up, and yeah, some people are close to tipping over—some from a run of hard luck, but plenty more from just refusing to live within their means.
There is no free lunch so the reset button is coming for some.
I just paid $104 for a tank of gas. Never paid that much before in my life. Whether my income is six figures or zero, that’s something I notice and have strong feelings about. Just because there are plenty of rich people across the world clamoring to spend their cash doesn’t mean everything is a-ok. Far from it
Kernburn
I topped off my Mitzibushi Mirage for $18.50 for 1/2 a tank.
Did you not fill your vehicle 4 years ago when prices were higher?
Gas went up about 30%.
US average price went from $3-$4/gal (rough estimates here and yeah locality matter but 30% rise was generally seen from local high or low pre war prices)
Let’s say the average person get 25mpg and drives 15k mpy.
Thats and extra $50 per month.
People hate gas price rises because they are easy to track and readily visible. But gas is still pretty cheap. You get to drive a full year for about $2-3k…everywhere you want. That is pretty good
It’s not really the media saying it though. Poll after poll (and actual election results) indicate people have been mad about the economy since Covid, even though metrics since then have nearly all been good and spending continues non-stop.
The bottom 20% is struggling mightily. Smart, cost-conscious folks in the next 20% (up to 40%) are doing ok, but the others are struggling. Really dumb spenders in the next 20% (up to 60%) are struggling. Everyone else is pretty much doing fine. But that blend has been the same for a long time. The MSM (which includes Fox but not the giant Wolf Street conglomerate) make their money by inflaming public opinion, not reassuring it with a nuanced perspective.
Stadiums I am seeing, Ball Parks actually, are not full, and at least one reason is the ridiculous prices… (On MLB.com every day.)
Used to love to go and take kids to A’s and Giants games for approx. $6 per seat,,,
Now they want $60-80 for same seat.
Seems trivially true that overall sales go up year over due to inflation even if durable goods inflation is zero. What portion of overall retail sales is non durable goods? What’s the CPI for these?
nearly 70% of the money consumers spend go to services, and it’s in services where inflation is high – that’s always the case and is the case now. Services inflation does not apply to retail sales.
In terms of nondurable goods:
Gasoline had negative inflation for three years in a row (prices dropped), which pushed down retail sales.
Food had a huge inflation spike in 2021-2022, but food inflation has leveled off at relatively low levels now, though prices remain very high. Some prices have been falling (eggs, avocadoes, olive oil, even some coffee has seen some price cuts recently after the huge spike); and other prices are still rising (such as beef).
Those two are the big nondurable goods categories. Smaller nondurable goods categories are clothing, shoes, accessories, household supplies, etc. They’re pretty small part of the consumer spending basket.
I had been planning an EV purchase for a while and finally bought in March. A month later that base model is in very short supply with smaller incentives.
I’m not saying it makes a difference, but EV sales were up in March. Certain states still have incentives.
I am also buying more groceries at a time, partly fearing very specific food item oil shocks. My chocolate consumption is down.
Wall Street on red alert as Buffett’s favorite stock market gauge hits worst reading EVER…
GOLDMAN Says Recession Risk ‘One Tweet Away’…
Wall Street is not on any kind of alert, red or otherwise. They’re in full-blown booze-a-palooza.
The “Wall Street is on red alert …” comment shows a flawed understanding on how Wall Street makes money. They make money the same way Walmart makes money: they buy wholesale and sell retail. Does Walmart care about the price of lawnmowers? No, just as long as they can buy them and sell them at a markup. Deal flow and trading volume are the key metric. As Warren Buffet has pointed out many times, the people running Wall Street firms are the salespeople.
There are two arguments that say that the Buffett Indicator and the Case Shiller PE Ratio don’t apply.
1) interest rates are historically low and 2% lower than dotcom and investors chase higher returns
2) Share buybacks have increased the earnings per share
Point one may be true, but it doesn’t mean investors aren’t chasing bad investments. Point two will change the earnings in the Case Shiller PE Ratio, but I still think this is just another rationale to pump up the market when things are overvalued. Warren Buffett is being mocked for missing out and hoarding cash which is just absurd.
Patience is a virtue when it comes to investing.
GOLDMAN is now duped, like the rest of us, into thinking “The President” = the Economy?
Probably not, but their writers know how to get clicks (or the CEO soundbytes or whatever).
The economy is ALWAYS one (Black Swan) button push away from turmoil, but as many people here note: it seems the “average American,” is well paid and has learned to live within their means.
The GFC made an imprint on current generations. Since: CC balances are down/ steady (on increasing population), savings balances are up and general household leverage seems low.
Corporates and governments? The opposite. However, free and continued “easy” money, coupled with no need for accountability enable the endless extend and pretend that we’re living.
I wouldn’t count on this lasting too much longer if gas prices stay high. I was speaking with the owner of a nail salon about a week ago and she told me her business is starting to lose customers… not lose-lose… they just aren’t coming in as often.
Amazon just delivered their latest load to our house in a Rivian EV cargo van. They have seen no change yet in cost for local delivery. I’m sure long distance transport to distribution centers still use diesel trucks.
Many people I know have an EV or hybrid now. They are using these vehicles more than their gas guzzling ICE SUVs and trucks. In my area, driving an EV charged at home is unchanged at about $1.00 per gallon equivalent(compared to an equivalent 25 mpg car. ie it costs about $1.00 in electricity to drive 25 miles in an EV). Electric rates are not as volatile as the local gas station prices but I suspect since natural gas powers our electric plants, price increases will eventually propagate to higher electric rates.
Wolf has shown EV sales grew last year to catch the tax incentives.
How many EVs are now registered compared to ICE cars?
I read that EVs made up almost 30% of new registrations in Colorado in 2025.
We were one of them with a Chevy Blazer EV.
I see almost every third car on the road is now an EV. Mostly Teslas.
These drivers are not seeing the gas pump pain yet.
EV adoption is trends are somewhat local. Given your comment I’m assuming you are in CO which is a lead adopter of EV’s.
I think CO EV sales are around 30% by recent metrics. If you are in the richer front range areas (Denver, Boulder) it probably feels higher
For the US, it’s about 6-7%. Big difference.
Anyway, the ability to keep spending is not because people have insulated themselves from gas prices
I bought a new luxury mattress from a company a bought from before in 2014. Could we have went longer, sure, but I don’t want to risk messing with quality sleep. I thought now was a good time to take advantage of fifty percent off ( they run good sales throughout the year). My head space was well they might have to raise prices, around me war inflation, and when I need to buy they won’t be on sale… total delivered came out to $2200.
I should have mentioned it’s a King size made by a company we’ve used before called Christeli.
Empire of Debt strikes back. Clearly Cheney was right “deficits don’t matter”!
Until they do…
At which point you blame the other party and at least half the people decide to believe you because they have the working memory of a goldfish.
Sounds like retail therapy. I wonder if there is a boom in storage building permits. bough a shirt retail week ago then went to a used clothes store and bought a pair on Named Brand slacks and SS Oxford together $10 cheaper than the new shirt. admittedly finding Men’s second hand clothes is a task
Autos are just wild — our household has two newish ones with total payments ~1.5% of pretax income (or sticker price of about 7% of gross). I’m amazed seemingly everyone drives a $80k Yukon (or Sierra pickup). By the same math every household in my small western town must make well into 7 figures. Maybe Americans really are that rich?
According to Wolf’s data above 217,500 paper returns that were submitted have not been processed. I’d like to know what the IRS is doing with these returns? Using them for toilet paper? The agents you get one the phone after waiting one hour don’t know. Mine is one of them. F$ck the IRS.
Good lordy, No, that’s not what the data above is saying. You’re fabricating goofball fantasies.
The data above says as of April 10:
1. the IRS received 114.33 million returns over the past two months, or about 2.6 million returns PER DAY (business day).
2. The IRS processed 113.62 million returns over the past two months, or about 2.58 million PER DAY.
3. The IRS on April 10 was “sitting on” 710,000 returns, or about a quarter of a day’s worth of incoming returns 🤣
4. The data doesn’t say anything about paper returns. But you can subtract the e-filings received (112.158 million) from the total number of returns received (114.333 million), and the difference might be paper returns received, so 2.175 million paper returns received over the past two months as of April 10.
5. But on April 10, it was “sitting on” only a few hours’ worth of flow, 710,000 total returns (it gets 2.58 million per day on average). So this is a massively fast-moving automated operation. They process 2.58 million returns A DAY!
6. The IRS doesn’t split out how many of the processed returns were e-filings and how many were paper filings. It only gives you totals. So you cannot say anything about the number of paper returns that “were submitted have not been processed.”
Maybe you made a mistake in your return. This often results in them having to do your taxes to see what is what
You didn’t answer the obvious question: absent a really, truly GROWING economy, how is this spending being funded?
Are pigs flying?
Rising incomes, of course. Wages and salaries are up 4.3% year-over-year. Is the income-side so easy to forget or ignore? So, to refresh your recollection, here’s the chart:
Consider boomers selling their homes. Aging parents passing away and the home gets sold. It doesn’t all get eaten by medicaid. Some of this gets passed down to grandchildren. The housing bubble whipped up a lot of froth in the economy.
Retail sales could be rising because people are buying more stuff or they could be rising because people are paying higher prices (or both).
Now that we can’t be sure about the accuracy of inflation numbers from the BLS and BEA, we have to look at monthly sales growth of around 0.6% suspiciously. Shall we believe the government that tariffs had no effect on prices?
On an annual compounding basis, +0.6% per month becomes 7.44% per year. That, minus the extent to which consumers are buying more or better items than they were buying last year, would be the inflation rate for goods.
I discussed this in detail in the article! So go ahead and read it (preferably before you comment).
Retail sales up. Do you have data on construction and industrial machine sales? I could not pin down a category in the article that they would fit in. I added millions and millions of dollars worth of machinery (cranes, crawlers and the like) to insurance policies in the last few months and only in the Midwest.
Not sales, but “orders.” This is part of the US-manufactured durable goods orders. Not included are imported durable goods. New data coming out tomorrow
This is from last month:
Orders excluding aircraft and defense, jumped by 1.5% in February from January and by 5.8% year-over-year to a record $278 billion, seasonally adjusted.
Month-to-month increases in orders at manufacturers of:
Thank you for the data. So the retail sales up 4.8% yr over year not seasonally adjusted and durable goods up 5.8% seasonally adjusted. If consumers are drunken sailors, what does that make the companies doing the durable goods ordering? I know they are financing these orders so they must have some serious faith in the contracts coming their way. This financing arrangement puts hard assets on the books at the bank and frees up the companies to use what’s left on the balance sheet for bonding and operational expenses. Or maybe they’re all just busy building data centers, lol.