Adding T-bills, shedding MBS, Treasury note & bond balances on ice, SRF unused.
By Wolf Richter for WOLF STREET.
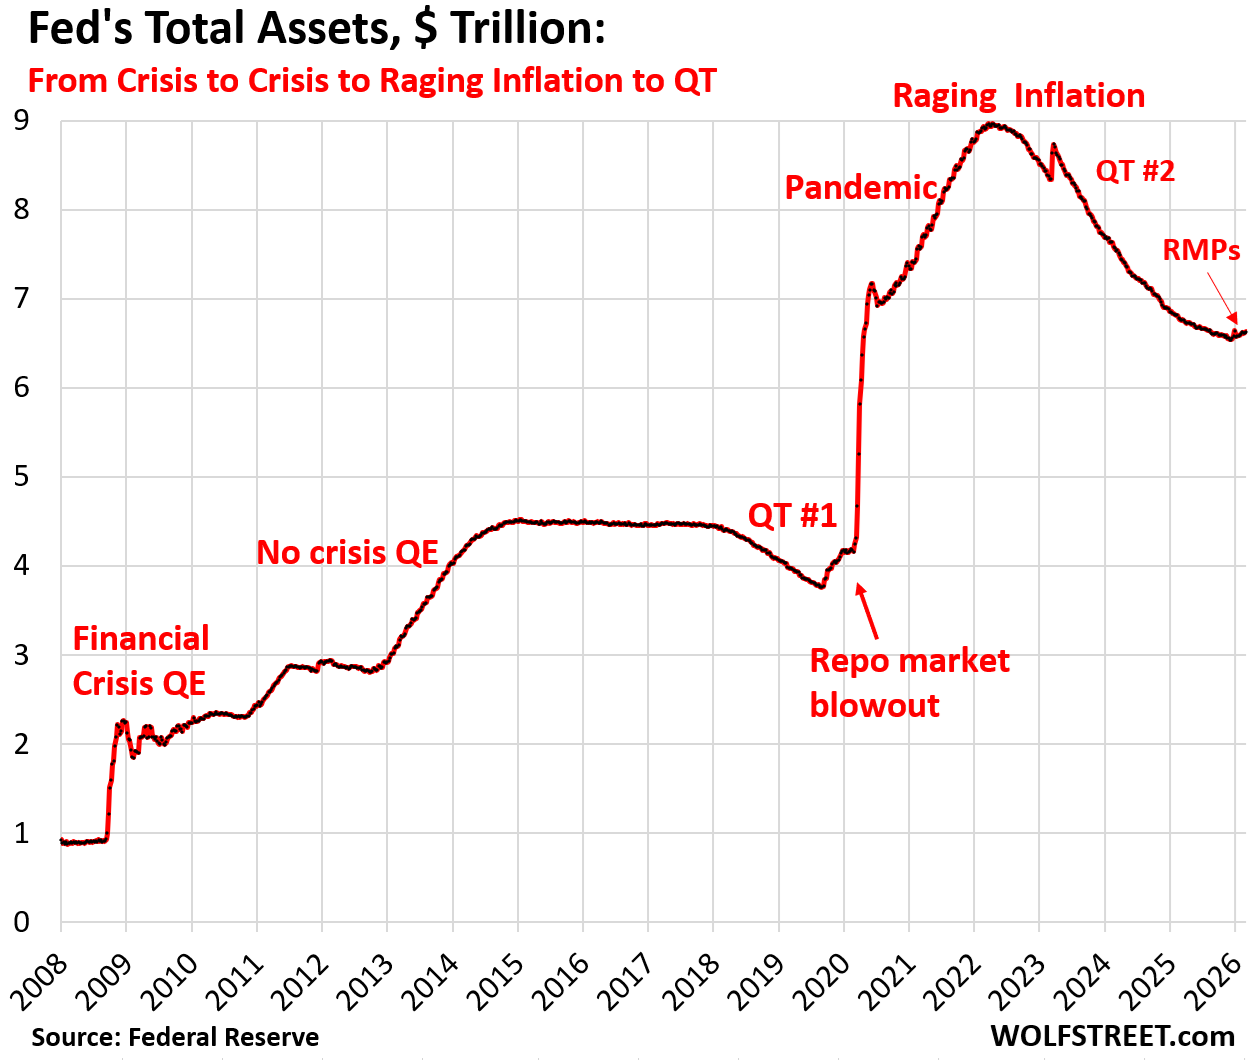
Total assets on the Fed’s weekly balance sheet, released today, rose by $23 billion in February, to $6.63 trillion. Since the beginning of the “Reserve Management Purchases” (RMPs) in early December, total assets have risen by $93 billion.
The $2.4 trillion in QT ended in November. At the December FOMC meeting, the Fed announced it would let the balance sheet grow by buying roughly $40 billion a month in T-bills until mid-April (Tax Day), after which the RMPs would be “significantly reduced.”
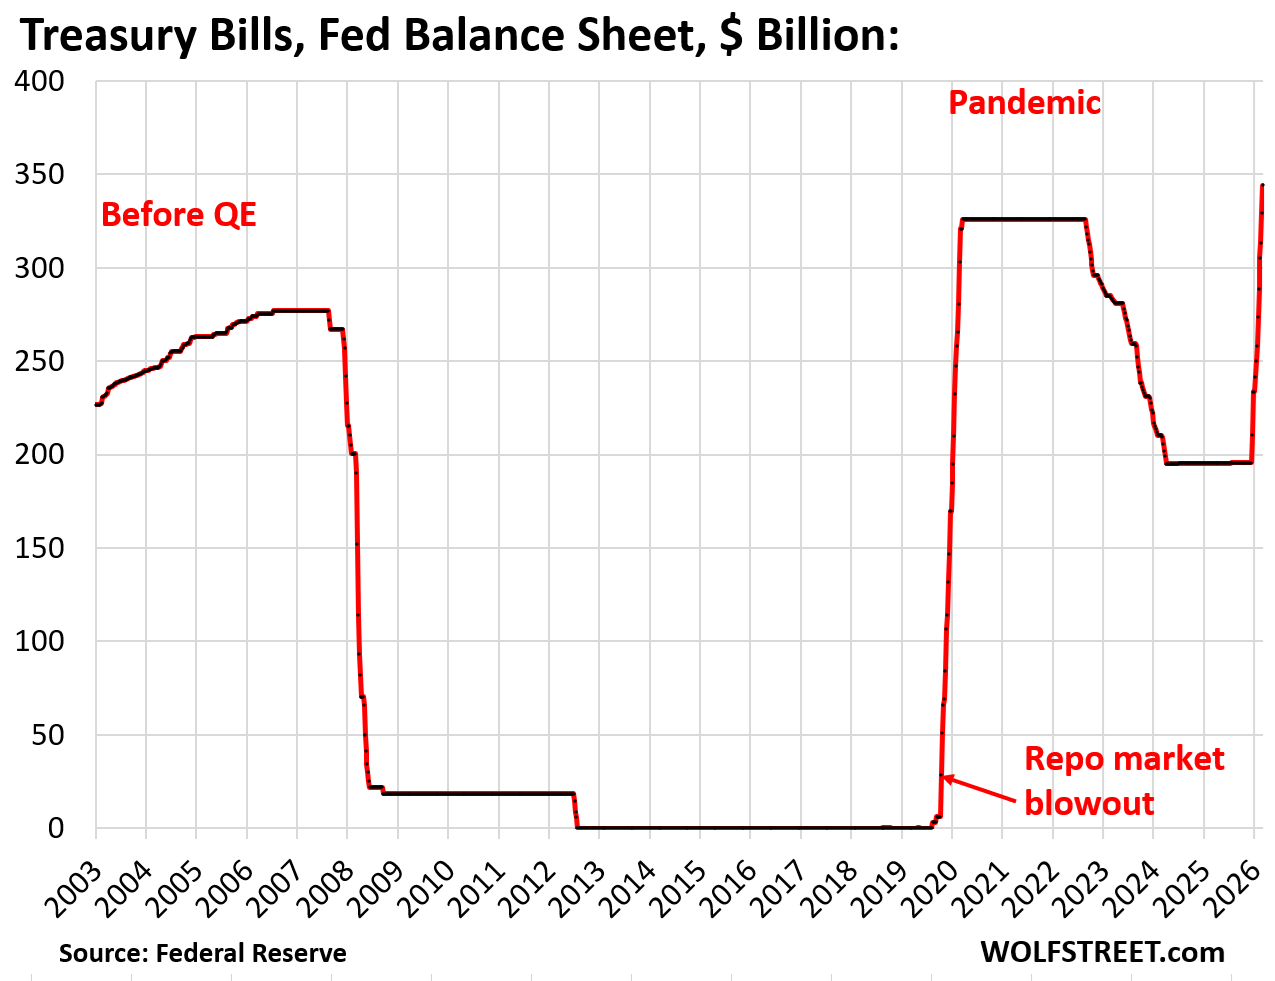
The Fed is also replacing its MBS that run off the balance sheet with T-bills (Treasury securities with terms of 1 year or less). By replacing MBS with T-bills, the Fed is replacing long-term securities with short-term securities.
Powell is the architect of the Fed’s “ample reserves” regime, where the goal is to have enough reserves (bank cash on deposit at the Fed) to prevent overnight interest rates from deviating more than just a hair from the Fed’s stated policy rates.
The newly nominated Fed chair, Kevin Warsh, has come out strongly against the Fed’s bloated balance sheet, quit the Fed’s Board of Governors over QE 2 in 2011, and has stuck to his guns through the nomination process, and has still gotten nominated. So the balance sheet’s future may look different than what Powell envisioned with his “ample reserves regime.”
Before QE, before 2008, the Fed had a “scarce reserves regime,” where banks borrowed from each other in the unsecured Federal Funds Market and from the Fed via repos, on a daily basis as needed to meet their daily liquidity requirements. By borrowing unsecured from each other, banks became a huge conduit for contagion to spread from bank to bank during the Financial Crisis. Interbank lending has by now essentially died down, except for a bizarre arbitrage trade between the Federal Home Loan Banks (FHLBs) and foreign banks.
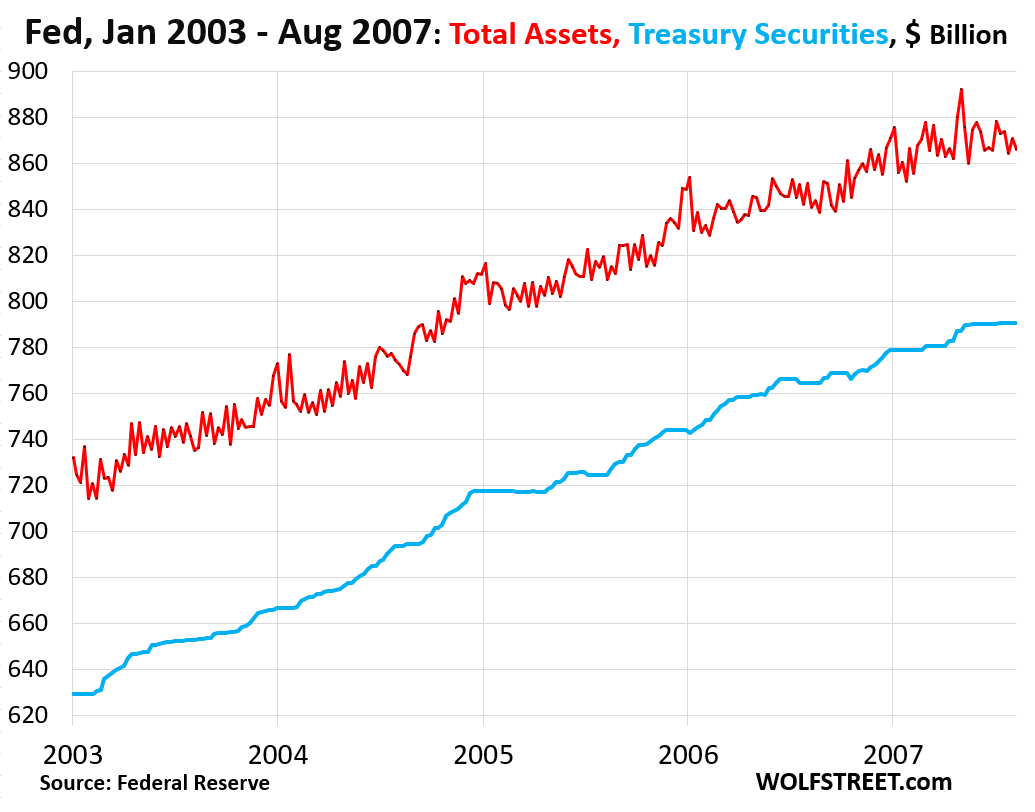
Before QE, before 2008, the Fed’s balance sheet always grew, usually more or less in parallel with the economy and inflation. Over those years from the beginning of 2003 to August 2007, the balance sheet grew by 22%:
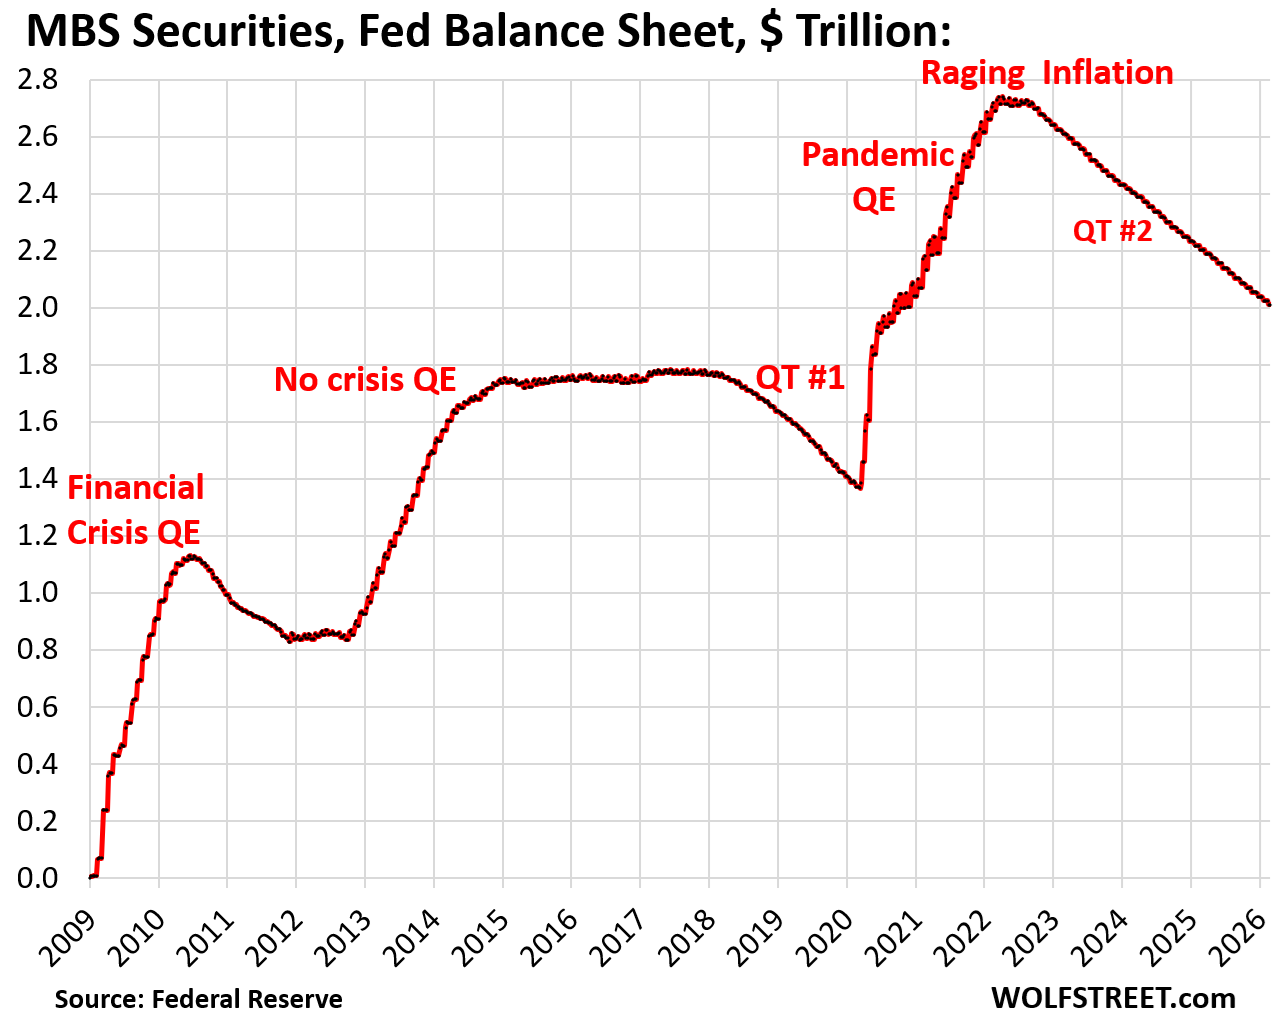
Mortgage-Backed Securities (MBS) declined by $13 billion in February, to $2.01 trillion, down by $730 billion (27%) from the peak.
MBS come off the balance sheet primarily via pass-through principal payments that MBS holders receive as mortgages are paid off and as mortgage payments are made. The Fed holds mostly MBS that are backed by mortgages that were originated during the low-interest-rate years, and those below-4% mortgages are only slowly getting paid off (the lock-in effect for homeowners).
Due to the housing market’s literally frozen status in January and February, fewer homes were sold, and fewer mortgages were paid off, and the passthrough principal payments of $13 billion were below the normal range of $15-17 billion.
The Fed holds only “agency” MBS that are guaranteed by the government (issued by Fannie Mae, Freddie Mac, Ginnie Mae), where the taxpayer would eat the losses when borrowers default on mortgages.
T-bills rose by $55 billion in February to $344 billion: $15 billion to replace MBS and $40 billion in RMPs.
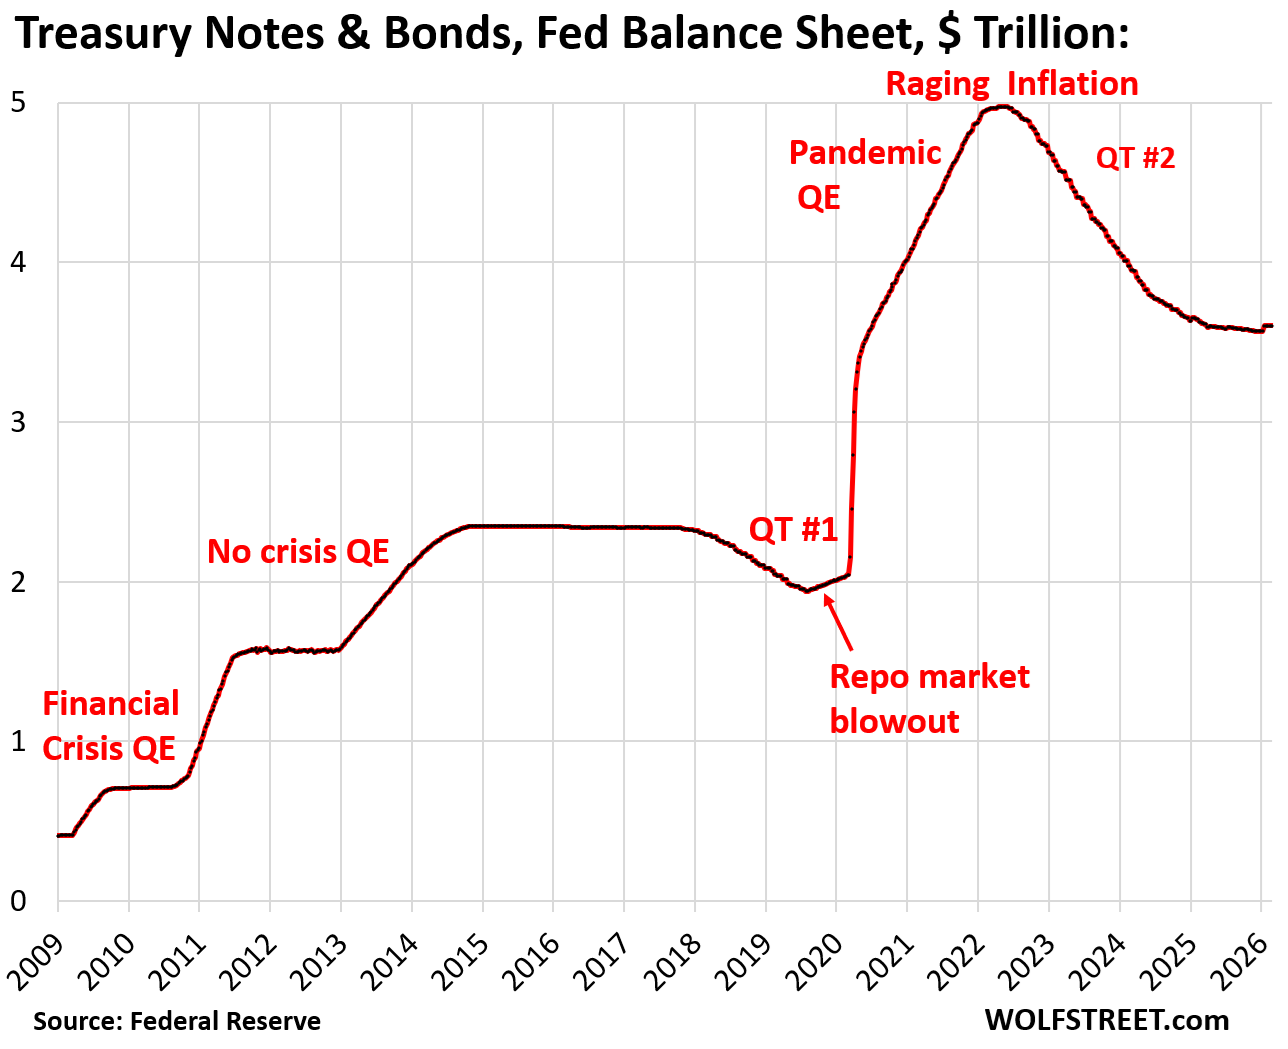
Treasury notes and bonds are essentially on ice, and there was no change in February in the balance of $3.60 trillion.
The Fed currently replaces every Treasury note (2-10 years) and every Treasury bond (20 and 30 years) that matures with securities of the same tenor, so a maturing 10-year note with a new 10-year note that the Fed buys at the Treasury auction. So the balance remains flat.
Bank liquidity facilities:
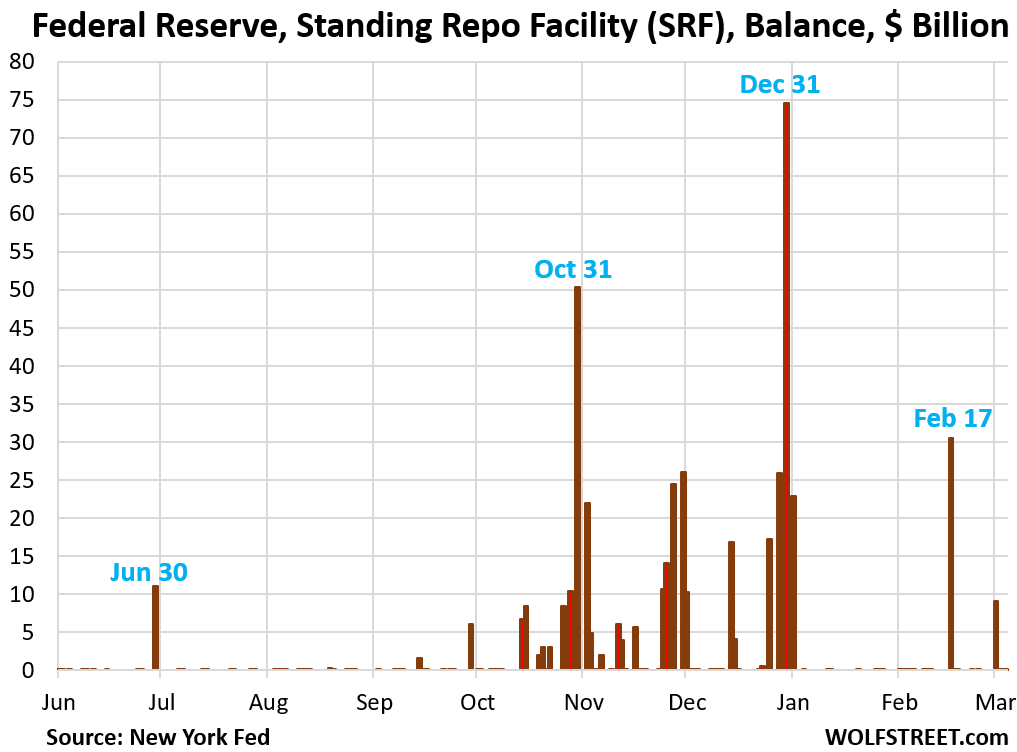
- Standing Repo Facility (SRF): $0 billion, see below.
- Central Bank Liquidity Swaps: $0 billion
- Discount Window: roughly unchanged, $4.7 billion.
The SRF: $0. Over 40 approved counterparties (big banks or broker-dealers) can borrow at the SRF with overnight repurchase agreements, where the Fed gets the collateral and the banks get the cash. The repurchase agreement unwinds the next business day, and the Fed gets its cash back, and the banks get their collateral back. Since the December FOMC meeting, the Fed has been charging banks 3.75% in interest on these repos.
At the end of October, turmoil broke out in the repo market as month-end liquidity pressures met with the government shutdown, which had caused the government’s checking account at the Fed, the TGA, to absorb $200 billion in cash that wasn’t getting disbursed, and repo market yields spiked.
Banks stepped in and borrowed at the SRF and lent to the repo market to profit from the spread. On October 31, the SRF balance hit $50 billion. Then the month-end pressures faded; the SRF had done its job.
But the Fed expressed disappointment with the banks that they’d used the SRF too little too late, which had allowed repo market rates to surge too far above the upper end of the Fed’s policy rates.
At the end of November, the month-end liquidity pressures pushed up repo rates again, but not that much, and banks used the SRF, but not that much, with the balance peaking at $26 billion on December 1.
On December 31, amid the yearend liquidity pressures, the SRF balance spiked to $75 billion, then plunged back to zero over the next two business days.
The biggest liquidity stresses would come around Tax Day when massive amounts of liquidity flow out of the financial system into the government’s checking account at the Fed (the Treasury General Account), thereby moving that liquidity from the financial system to the Fed’s balance sheet, where it vanishes.
The RMPs are designed to build up enough reserves by Tax Day to let them handle most of those liquidity flows, with the SRF making up the difference as needed.
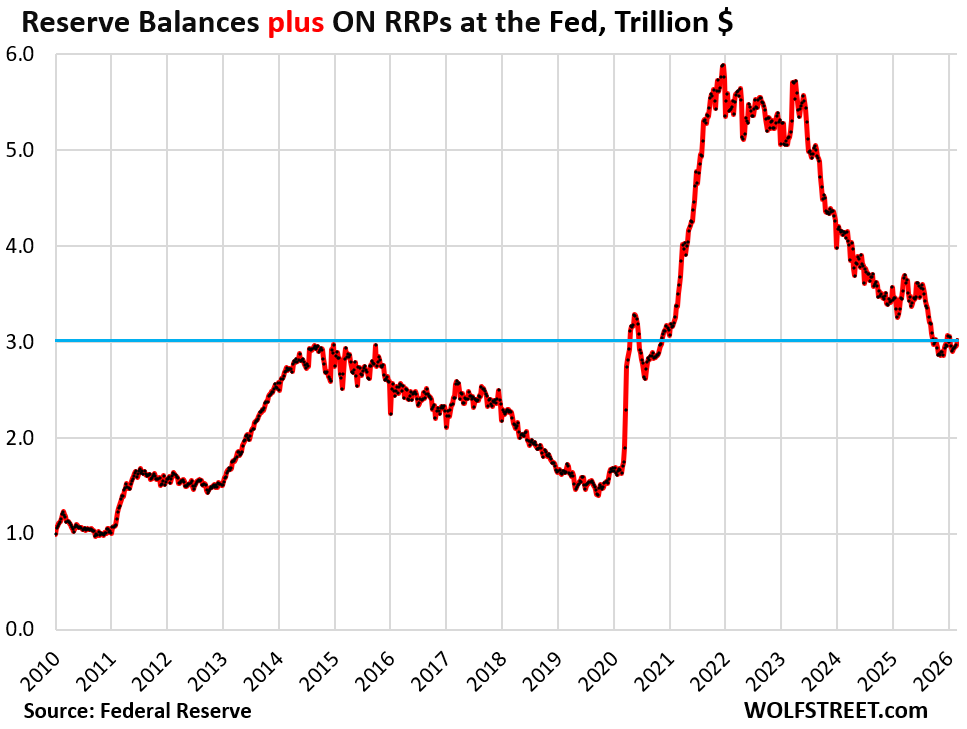
Reserves and ON RRPs represent instantly available liquidity in the financial system. They’re liabilities on the Fed’s balance sheet, not assets.
Banks have cash on deposit in their reserve accounts at the Fed. They pay each other through their reserve accounts, via the Fed’s central payment system. Every financial transaction flows through the reserve accounts. Banks also keep their excess cash in their reserve accounts. The Fed pays banks currently 3.65% in interest on their reserve balances.
The purpose of the RMPs is to increase the level of these reserves.
Money market funds put their excess cash on deposit at the Fed via Overnight Reverse Repurchase Agreements (ON RRPs). The Fed pays 3.50% in interest on these repo balances.
Reserve balances have risen by $83 billion since RMPs started in December, to $3.02 trillion.
ON RRPs are down to $0 billion. Back in mid-2022 through March 2023, they exceeded $2 trillion.
The chart shows that QT has wrung nearly $3 trillion in liquidity out of the financial system since the peak at the end of QE, but that liquidity remains high, or “ample,” as Powell would say. And Warsh can do some careful trimming here:
Enjoy reading WOLF STREET and want to support it? You can donate. I appreciate it immensely. Click on the mug to find out how:

![]()
The SRF looks like it’s been used substantially less starting early January of this year compared to October through December 2025. Does this hint to Powell getting his wish of a more “ample reserves” regime? I’d like to see Warsh and the other FOMC members wittle away at the reserves month by month. Heck, even $5 billion per month of QT (in addition to continuing having MBS roll off the balance sheet) would be something.
Conditions still feel loose. Anectodally, I don’t know anyone tightening their belt right now. Isn’t that part of a healthy dynamic market, where participants sometimes need to tighten their belts?
Also, WTF Congress. Stop pumping money into the economy!
MC Bear,
We all feel this way. But Fed Chair Arthur Burns wants QE, not QT.
They want to buy trillions more Treasuries & MBS.
They want to buy stocks & junk bonds.
They want to buy crypto & college debt.
Then they want buy Porsches, Lotuses, & Lamborghinis. Then they will spend billions on fixing up the Eccles building.
I’m currently reading on how the Roman Empire fell. Standby to see if history is repeating itself.
I refuse to take this economy seriously anymore.
Wolf,
Find it interesting that T-bill yields out through 6 months all currently higher than EFFR…so much for the pipe dream of installing a Fed chair to aggressively cut Fed Funds.
Yes, T-bills yields are in the upper half of the Fed’s current target range for the EFFR = 3.5%-3.75%. For example: 6-month yield 3.66%, 3-month yield 3.68%, 1-month yield 3.71%, so slightly above the EFFR (3.64%). This is fairly typical for market expectations of no change in the Fed’s policy rates within the term of the T-bill.
I think market participants are underestimating the change Warsh will install , over time, at the Fed.
I think he will lower short term rates, certainly by August , with the Quid pro quo of shrinking the Fed’s balance sheet at a pace that is designed to ameliorate bond market fears of the inflationary impact of lowering rates.
Would love to be a fly on the wall to listen to the internal arguments between Warsh and the many PhD’s at the Fed. It’ll be fascinating.
Yes. He will have his hands full. He will likely get some support from some of the other governors and presidents. Logan, Williams, and Waller have in the past discussed a smaller balance sheet, and before he became a candidate for the chair job, Waller dissented on slowing QT last spring.
Its fun to look back at the 2009 point in these charts….
Back in time, prior to what the Fed has morphed into since it emergency measures which never seemed to have diminished.
2009, when the national debt was $9 Trillion. Could the national debt have ballooned to its current level without the accommodations of the Fed?
Ample Reserves to be available to “prevent overnight interest rates from deviating ” , which in effect is to prevent the workings of a free market and always to keep rates down, not up.
“…and always to keep rates down, not up.”
No, the deviation problem goes in both directions, which is why the Fed has two “floor rates” (interest on reserve balances & interest on ON RRPs) and two ceiling rates (SRF rate & Discount Window rate), which bracket the overnight rates.
The floor rates kicked in several times in recent years, including during the SVB collapse when overnight rates and short-term T-bill rates plunged, but were quickly stopped and pushed back up by the floor rates.
The Fed calls this “rate control.” It wants overnight rates to stay within its target range, in both directions. The Fed makes monetary policy via its policy interest rates that are supposed to control the market’s short-term rates.
Monetary policy rates, be definition, control overnight interest rates so that there is no free market for overnight interest rates outside the range allowed by the policy rates. That’s the purpose of a central bank.
The FED shouldn’t acquiesce to the Treasuries’ needs. Let the markets discipline Congress. US debt needs further downgrading.
The “markets” CANT discipline Congress!
It only disciplines the people. It flushes out bad actors and shaky businesses, but the congresspersons’ checks are non-discretionary.
Also, the markets are gobbling up this government paper at rates that seem dubious for (my?) 10year inflation expectations.
We have no crisis yet there’s triple the assets owned compared to the Fed of the financial crisis. Shouldn’t the Fed at least cut back down to that 2010 asset level as quickly as possible?
That’s the $30-40 Trillion dollar question!
The economy (as measured in GDP) has doubled since the 2008 peak.
The balance sheet appears to be over 6X the pre-GFC level.
The things that have more than doubled are: Government debt, asset markets (including the myriad derivatives and craptos etc), the costs of living.
I do think the fed balance sheet is too much. However, if the fed starts to shrink it’s balance sheet, the market has to pick up all that plus all the new t bill and t bond offerings from the government. That will drive up the yield further driving up consumer and business loans. Massive deficit spending is the real reason why the fed isn’t moving more off the books. I would like to see a chart of daily repo balances to see if we’re coming anywhere near close, but I suspect we aren’t.
The balance sheet is still big enough to invert the short-end segment of the wholesale and retail funding yield curve. There is substantial substitutability of short-term vs. long-term debt.
MW: US stocks are moving sharply lower after February jobs report adds another worry for investors
DJIA -1.38% SPX -1.24% COMP -1.01%
BX:TMUBMUSD10Y 4.175%
this week; market starts morning way down then spends the entire day slowly recovering.
if it starts way down and stays there, or sags, would be an interesting change.
The economy appears healthy but I am curious how much the market has been driving the economy (tail wagging the dog) and the purported K-shaped effect. If the market stays flat for a while, I guess we’ll learn.
“if it starts way down and stays there, or sags, would be an interesting change.”
interesting change today.
Controlling interest rates and liquidity levels might be OK if they did it with an eye on our long term financial health. What we see today are rising debt-to-GDP levels, rising wealth disparity, and continually rising asset valuations. These long term health parameters are flashing red.
The economy is strong, but for how many people and for how long?
BlackRock curbed withdrawals from one of its biggest private credit funds after client requests for redemptions spiked. This is not good. FYI, all mutual funds can halt redemptions whenever they want (read small print in prospectuses), another reason to avoid them.
THURD2,
Karma is coming for BlackRock.
Not even Goldman Sachs is hated more than BlackRock.
Their risk analyst is probably looking for a new job.
Blackstone?
US oil surges 11% toward a record weekly gain, as the Middle East conflict spurs worries over production cuts
WTI Oil 92.19 +11.18 13.80%
Trump’s latest Truth sends global markets haywire – US crude oil prices skyrocket
Global markets have gone haywire after Donald Trump made new demands in the Iran war.