The Fed has now shed 22.3% of the Treasury securities it bought during pandemic QE.
By Wolf Richter for WOLF STREET.
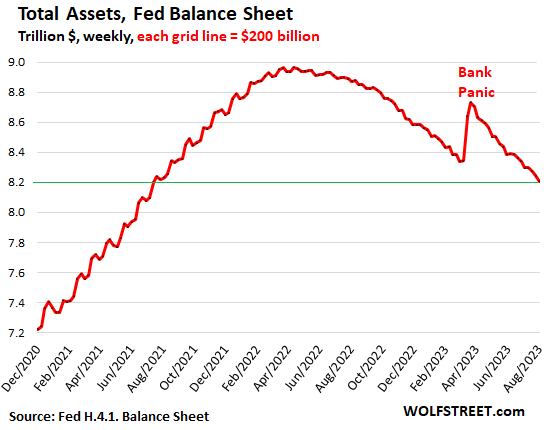
Quantitative Tightening (QT) continues. The Fed’s total assets dropped by $91 billion in July, and by $759 billion since the all-time peak in April 2022, the biggest drop ever, to $8.21 trillion, according to the Fed’s weekly balance sheet today.
Since the height of the bank panic in March, the Fed has shed $527 billion in assets, as QT continued on track and as bank liquidity support measures are unwound.
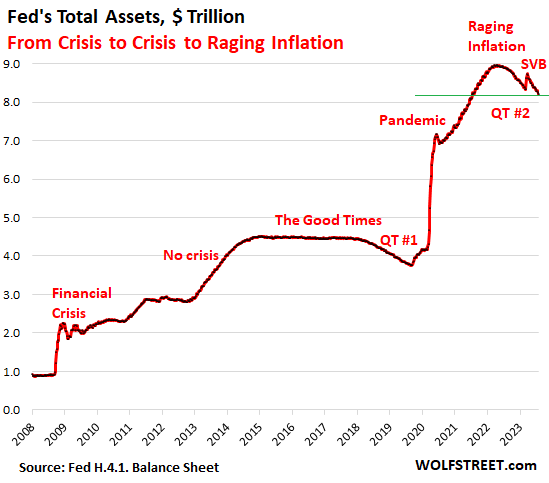
The chart shows the details of the banking crisis, and how it is being unwound. The next chart down shows the long view:
From crisis to crisis to raging inflation: During the nearly two years of QT #1 between November 2017 and August 2019, total assets dropped by $688 billion, compared to $759 billion in one year of QT #2:
QT marches on.
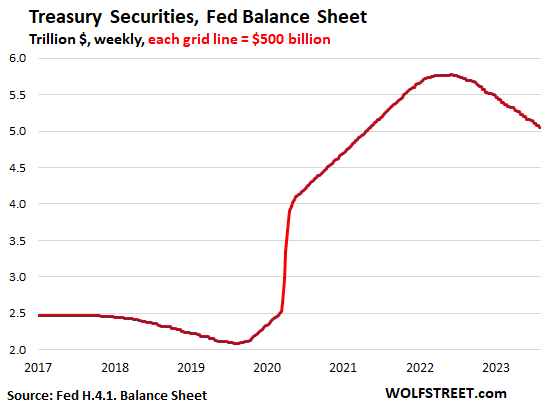
Treasury securities: -$58.5 billion in July, -$723 billion from the peak in June 2022, to $5.05 trillion, the lowest since May 2021.
The Fed has now shed 22.3% of the Treasury securities it bought under its pandemic QE ($3.25 trillion).
Treasury notes and bonds “roll off” the balance sheet mid-month or at the end of the month when they mature and the Fed gets paid face value for them. The roll-off is capped at $60 billion per month, and about that much has been rolling off, minus the inflation protection the Fed earns on Treasury Inflation Protected Securities (TIPS) which is added to the principal of the TIPS.
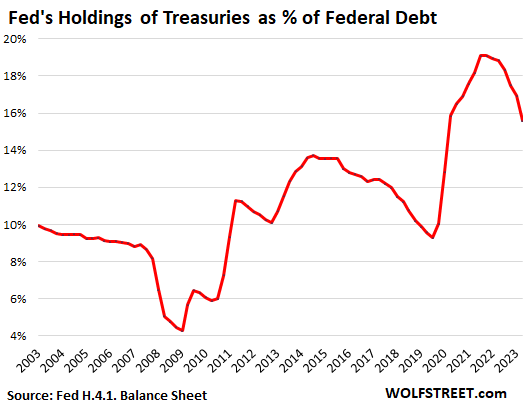
The Fed’s declining weight in the Treasury market. The Fed’s holdings of Treasury securities have now declined to 15.6% of the total $32.59-trillion pile in Treasury securities outstanding.
The drop in share occurred because the Fed has been cutting its holdings, while the government is issuing a tsunami of new securities to fund its deficit spending.
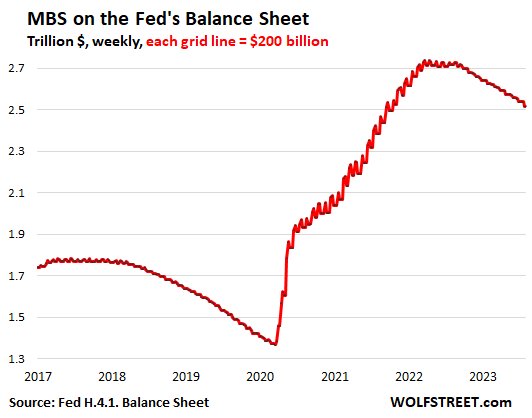
Mortgage-Backed Securities: -$21 billion in July, -$223 billion from the peak, to $2.52 trillion, the lowest since October 2021.
The Fed only holds government-backed “Agency MBS,” where taxpayers carry the credit risk, not the Fed.
MBS come off the balance sheet primarily via pass-through principal payments that holders receive when mortgages are paid off (mortgaged homes are sold, mortgages are refinanced) and when regular mortgage payments are made.
The run-off in MBS has been well below the cap of $35 billion per month because passthrough principal payments have slowed to a trickle, because fewer mortgages are getting paid off, because home sales have dropped and refis have collapsed:
The banking panic measures.
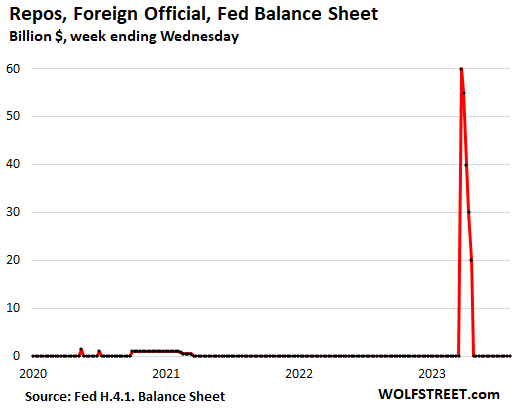
Repos with “foreign official” counterparties: $0, paid off in April. The Swiss National Bank likely used this program to fund the dollar-liquidity support for the take-under of Credit Suisse by UBS.
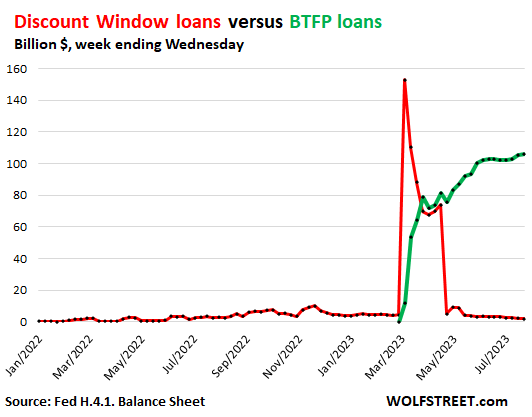
Discount Window: -$1.5 billion in July, down to $1.9 billion, compared to $153 billion in March. Discount Window lending to banks has been around for a very long time. Since the last rate hike, the Fed charges banks 5.50% to borrow at the Discount Window ( “Primary Credit”). In addition, banks have to post collateral under strict rules and at “fair market value.” This is expensive money for banks; they would normally be able to borrow for less from depositors without having to post collateral. So banks pay off these Discount Window loans as soon as they can.
Bank Term Funding Program (BTFP): +$3.7 billion in July, to $106 billion. This bank lending facility, set up during the bank panic, is similar to the Discount Window but less expensive, more flexible, and with easier collateral rules for the banks.
Banks can borrow for up to one year, at a fixed rate, pegged to the one-year overnight index swap rate plus 10 basis points at the time of the loan. Banks have to post collateral, but it can be valued at purchase price rather than current market price. This is still expensive money for banks, but less expensive than at the Discount Window. So banks paid off the Discount Window loans and borrowed from BTFP.
The chart shows loans at the Discount Window in red, and the loans at the BTFP in green:
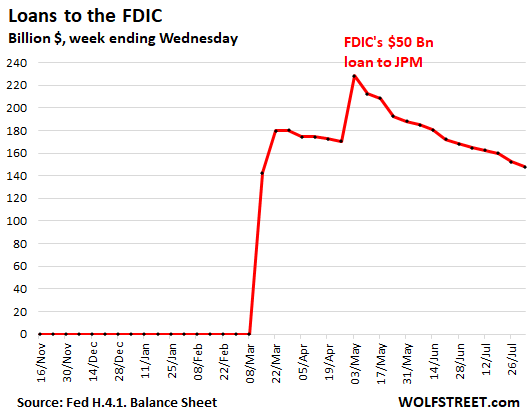
Loans to FDIC: -$17 billion in July, to $148 billion. The FDIC has been selling the loans and securities it took over from the collapsed Silicon Valley Bank and Signature Bank. As the FDIC returns those funds to the Fed, the loan balance declines.
Enjoy reading WOLF STREET and want to support it? You can donate. I appreciate it immensely. Click on the mug to find out how:

![]()
Correct me if I’m wrong. The Fed bought treasuries of varying lengths. I’m sure Wolf could detail those amounts across the intervals: bills, notes & bonds. At this point, we’re still working through the low-end of the notes. If so, it seems like the slope of the runoff will get less steep as we move further along the maturity curve. If true. this means there’s a looking runoff slowdown: 3 to 5, 7 – 10, & 20 – 30.
And my point the other day about the tsunami of interest expense full expects that the CONTINUED slowdown tax receipts will create a very ugly ratio of interest to revenue. It’s a known issue for anyone paying attention.
In terms of the Treasury run-off, there won’t be a slowdown for a while. The Fed built a mechanical booster into the QT system when it designed it, and it has been working:
The Fed holds $260 billion in T-bills (as of now), which it maintains at that level unless the run-off of notes, bonds, and TIPS is below the cap of $60 billion. Then it lets enough T-bills run off to fill in the gap to $60 billion. This has happened a few times. The biggest one was last September of $13 billion and October of $14 billion — right at the beginning of QT. Most other months, the fill-ins, if any, were small. In July, there was the third-biggest fill-in of $10 billion.
And so now, after all this, the Fed has $260 billion in T-bills left for fill-ins. It used up $60 billion in 13 months. So that $260 billion should be good for at least another year, maybe quite a bit longer. I’d have to spend some time with the maturity schedule to nail that down, and I don’t feel like it, LOL.
The Fed could use some of those T-bills to fill in the MBS gap.
The Fed has reduced its treasury holdings, but the deposit run on banks, causes the money to go into money market funds, that then buy treasuries. The Fed then reimburses the banks with loans.
It’s a shell game.
Where do people come up with this braindead bullshit???
LOL
I am surprised at how slowly the FDIC loans have been liquidated. I thought usually these things got sold to other institutions pretty fast.
The FDIC took over about $600 billion in assets from the three banks. Now there’s $145 billion left over, including the $50 billion loan to JPM to fund part of the First Republic purchase, which will likely sit there for several years. In other words, the left-over loans, securities, and other assets from those three banks is now down to about $95 billion.
The FDIC sold a bunch of run-of-the-mill loans in bulk right away, and those never made it into this advance from the Fed because they were gone and paid for in no time. But there are also some very special CRE loans from Signature Bank that are hard to place, and they’re just starting to look for a buyer for them. The MBS are getting sold into the market at a steady pace every week, rather than just dumping them all at once, which could crash prices, and the FDIC wants to get maximum prices to minimize costs.
Goethe: A person only hears what they understand.
Or, put another way by Simon of Simon and Garfunkel: man hears what he wants to hear and disregards the rest.
Or, as I have observed: People are more likely to be upset by the questioning of their limited understanding than to question if their understanding is limited.
Soldier on!
“as bank liquidity support measures are unwind.”
Should be “unwound”.
“Where do people come up with this braindead bullshit???”
No errors detected.
Good on you Wolf! Keep us straight.
The shell game fails because if the Fed “reimburses” banks with loans, those loans would show back up on the Fed’s balance sheet. That’s not what’s happening right now.
Re: The chart shows loans at the Discount Window in red, and the loans at the BTFP in green
Excellent and awesome chart! Always nice to see a representation of the pea and shell games.
What is the Fed balance sheet as a percent of GDP?
What is a reasonable target for the Fed balance sheet as a percent of GDP?
Some interesting numbers to examine would be the:
~ 10 year average
~ 25 year average
~ 50 year average
~ average of each decade, or beginning of each decade
I’m guessing the number has quadruple over last 25 years…
Why?
How is the FED’s balance sheet as a percentage of GDP relevant to anything?
Why would you want that info and what would you do with it?
I noticed on FRED that reverse repos are no longer decreasing. I wonder why? Stuck at 1.78T.
Just to clarify: RRPs are a liability, not an asset. They’re demand driven. This is where money markets stash their extra cash (lend money to the Fed) to earn 5.3% risk free with next-day liquidity.
This is a great alternative for T-bills, and so money market funds keep a portion of their cash in RRPs. Money market funds have continued to attract cash from investors that are pulling their cash out from bank deposits.
Banks put their extra cash into reserves. So there has been this shift going on from reserves to RRPs. More here:
https://wolfstreet.com/2023/07/14/the-feds-liabilities-qt-pushed-down-reserves-rrps-by-865-billion-tga-gets-refilled-currency-in-circulation-hits-record/
Wolf, I noticed the same as Ev Last. As the case comes together for further inflationary pressures (deficit spending/energy increasing/PCE at 4.1/etc) Would RRPs coming down be considered inflationary?
My understanding was that RRPs were used as an inflation countermeasure, acting as a sort of sponge to soak up money to keep it parked and out of the general economy–money which would otherwise be chasing after yield/assets thus fueling inflation.
“My understanding was that RRPs were used as an inflation countermeasure,”
RRPs have been around forever. What was new is paying interest on them back in April 2021. This was a time when yields on Treasury bills fell below 0% in the market because there was too much liquidity chasing after them.
The Fed doesn’t want negative interest rates, which can cause money market funds to “break the buck” and trigger a run on the fund, which can quickly turn into contagion. That was the issue back then. Money market funds are always a problem.
So by paying at first 0.05% on RRPs, the Fed channeled that MM liquidity from Treasury bills onto its own balance sheet. This was in the spring of 2021. It put a floor under the short-term Treasury yields, and kept them positive at the time. The Fed then raised the rate on RRPs with its rate hikes, to now 5.3%, and those RRPs are still putting a floor under short-term Treasury yields.
This wasn’t done to deal with inflation — at the time the Fed blew off inflation. It was done to keep short-term yields positive and bracketed to the Fed’s money policy yields, and to keep MM funds from breaking the buck.
Drawing a link between inflation and RRPs is not logical to me, one way or the other. Consumer price inflation is a very complex and still insufficiently understood phenomenon, and a lot of factors go into it.
The fed is selling these bonds at huge losses. When the fed lose money, the taxpayer pays for it via devalued currency and higher inflation. That means you and me who work hard and our purchasing power is being stolen. The word “Taxpayer” is now a slur. My blood boils whenever I hear it.
The bonds are rolling off.
Correct. Zero losses for the Fed.
Are they selling or holding to maturity?
Holding to maturity.
There is a loss at the Fed. Bonds were purchased at a premium and are redeemed at par. I don’t know how they account for it though.
BradS,
Thank you for the question. I used to post this chart and explanation in my balance sheet articles, but it’s the most boring chart ever and the most boring explanation ever, it’s way too geeky, and the weekly amounts are not big, and so I stopped posting it. You just gave me an excuse to post it.
Investors pay a premium for a bond when the coupon interest payment exceeds market yields. So you pay more to get that higher coupon payment, and that additional amount is the “premium” you’re talking about.
The Fed amortizes the premium over the term of the security in equal increments against the higher interest income from the higher-than-market coupon interest payment. So they have the bigger coupon payment, minus a small deduction for the write-off of the premium, which brings the income in line with market yield at the time they bought the security. By the time the securities mature, that premium has been fully amortized, and the book value of the securities = face value, and there is no loss when the security matures.
The Fed accounts for the still “unamortized premiums” in a separate account, and you can see how every week the balance is shrinking as it amortizes the still unamortized premiums in equal increments against the higher coupon interest payments it receives from those securities.
The Federal Reserve is NOT ‘selling bonds at huge losses’ at all, and in fa ct there are NO LOSSES WHATSOEVER to the Federal Reserve as it rolls off maturing US Treasuries at maturity.
Fed and government accounting is so far above my understanding. Is having a loss in nominal dollars a loss in real terms because of inflation?
The Fed gets face value of the securities when securities roll off. There are no losses, nominal or otherwise, inflation or no inflation.
Semantics.
Of course when they get $1000 for a bond with a face value of $1000 at maturity there is no loss on the principal value of the bond.
There is however, a loss on the purchase price of the bond if they bought it at over face value.
The Fed does in fact have huge capital losses on its bonds and this is shown in the unamortized premium chart above. This amounts to around $300 billion.
This capital loss is partially offset by interest income they receive/received from the bonds.
But the Fed is losing money every week on the difference between the rates it pays and receives. Wolf had a chart of this in the past and I have seen it elsewhere, earlier in the year there were some articles on it, but i cant find a recent number. They were losing 2 billion a week in January, I assume it is even higher now.
Of course, since they call it a deferred asset, they just pretend it isnt a loss.
It has stabilized over the past eight weeks at around $2.2 billion a week. This fluctuates with RRP balances and reserve balances (which have been coming down), and rate hikes (going up).
I think if the Fed ever loses money, e.g sells an asset for less than purchased, the loss is treated as an accounting item and transferred to something called the “deferred account.” Where it sits until better economic times arrive when it is gradually extinguished. It avoids e.g media screams of “fed crisis.”
I learned this from Wolf. Hope it’s about right!
It’s really interesting that almost a quarter of the securities have rolled off and the market has barely blinked. Sure, the 10 has tanked, but if you’d told me a year ago the b/s would be down a trillion, FFO at 5.5%, I would have thought the 10s would be north of 5%. Nope!
Me too. I attribute it to the extraordinary fiscal policy that is in place. In my opinion we are getting a short term goosing of economy by stealing from our long term growth rate. Most politicians don’t care about long term anything.
Curves only inverted about 15% of time. Might as well take the risk free money while its being handed out until recession gets here unless you know how to be a gunslinger in the financial markets.
Old School
Don’t fall for the historical analysis of the Yield Curve.
Those doing so look to years when the Fed held essentially no long term debt….and the curve inverting.
But this is so much different…..the Fed holds around $5 Trillion in long term debt…held off the market….intended to depress long rates thus promoting an inverted curve. Yield Curve Control….done so to project a certain “mood”.
This manipulation of the curve is just that and indicates only that.
Agree. A lot of the demand for long bonds we see today is actually trading activity. People are buying long bonds thinking the economy will enter recession and the Fed will respond with interest rate suppressing QE. It’s the continued presence of QE in the Fed’s toolbox that keeps the long term rate suppressed.
As Wolf stated, the Fed seems to realize QE was a bad idea, but I will not bet on that until I see the Fed withholding QE in the face of a decent recession. As long as QE remains in the toolbox, it can be used. It’s the Fed’s best tool (and perhaps only tool) for propping up asset values in the short term, and the Fed seems to love inflated asset prices.
Bobber, I think you are right, which is why Congress needs to prohibit QE as a matter of law. If that’s the case, you’d see the long term yield skyrocket almost immediately, and it would get inflation under control quickly.
I think the Fed loved inflated asset prices when they thought it was “free.” Now that they realize that inflated asset prices drive inflation, they might not love it anymore.
I don’t think it will be all that different than times before. Inverted yield curve will hasten end of this cycle and the Fed will cut rates once recession comes. Just a matter of timing.
Einhal
Congress should prohibit QE?
Well I agree that the increase of the money supply must be connected to a growing GDP…..instead of a whimsical decision by an unelected cabal behind thick oak doors.
As for Congress….one need only look at the “intent” of the Constitution which places the minting of money in the hands of Congress. Now electronic creation of money was not around then, but the “intent” was clear. One might say that Congress would be reckless as well, but at least they are accountable to the voters, unlike the unaccountable and unaudited Fed.
Old School
“I don’t think it will be all that different than times before.”
Perhaps
But the era of the Fed having nearly no long term debt….and now having around $5 Trillion must make a difference…..5 Trillion is a bunch of money. Imagine that debt bouncing around now looking for a bid.
But you miss my other point, which is the Fed WANTED and WANTS the long end depressed….they sent long rates to 4000 year lows…intentionally.
It would be interesting if we could only do away with the impact of the Fed and see what would happen to the markets. Between the Fed and the government spending like a drunken sailor, we have a system that has massively pulled forward future expenditures with financing.
We have a very painful future ahead for the average American, the only question is the timing.
It’s because the market is betting on a return to ZIRP and QE next year. You know how people always say the market is “forward looking?” That’s what the market is looing forward to. If they’re right, then buying stonks at P/Es of 40 makes sense. If they’re not, well, just look out below.
SOON gp:
Patience is not only a ”virtue”,,, it is also a good strategy, ”sometimes.”
Wolf,
Do you think we will start seeing more zero coupon treasuries being offered in the near future?
This would seem to be the best move politically for Janet, because it would avoid outlays for interest payments while still getting funding.
The spread between coupon and zero treasuries has still been fairly tight, so wondering if this is going to come into the playbook.
Obviously there would be some long term implications, but not sure the current crowd is thinking that far ahead.
Zero-coupon bonds pay interest similar to T-bills: they’re sold at a discount, and when they mature, the holder receives face value. The difference between the auction price and face value is the interest paid by the government, and it’s accounted for. So the government doesn’t avoid the interest payments. It’s just all in one big lump-sum when the bond matures, rather than via bi-annual coupon payments. It doesn’t offer any advantages to the government. I didn’t see any mention of zero-coupon bonds in the TBAC.
Yellen wants zero coupon since she expects the FED to pause and reverse. Also, she doesn’t want to blow up future interest payment. So far, the economy is not co-operating. Tight labor market and GDP growth will make it uncomfortable for the FED to pause. I am thinking we will have 2 more hikes (1/2 pt) for this year then the pause. It will be a long long pause – at least 1 yr. But the Treasury is stuck between a rock and a hard place.
While I appreciate seeing some of this money supply tightening just looking at the graphs tells me it’s going to be a really long time before they get the Fed assets back down to anywhere near what they were prior to the pandemic. And frankly, I doubt they ever will. If that’s true, we will be dealing with this debt induced inflation for another decade. Raising the interest rates helps, but rolling $4 Trillion out of the “assets” would be even more helpful. That debt is going to put a serious dent in GDP.
That’s because this government needs inflation to help with their spending addiction. They’re not going to stop spending, and they can’t tax their way out of this optically, because they’d need to tap the sacred middle class and retirees. The inflation is on purpose, and the QT is just window dressing.
This way they can tax the untouchables without most of them not even knowing it. But in reality, the spending spree and $100T in unfunded liabilities will be here so long as the credit card still works. When the market stops buying our debt, the Fed sill step in and put the inflation machine back into high gear with more balance sheet buys.
They’re going to crash the ship into the rocks rather than proactively manage the problem, and curb entitlements and spending. I genuinely thought that appraising $1T in interest payments might bring some of these children at the Capitol around to more fiscal responsibility. Doesn’t look promising.
I kind of feel bad for the Fed. The unserious legislature keeps the party going, and keep sending the bad news and tab to the Fed to solve.
Exactly, I doubt they will ever get their balance sheet in order. The Feds balance sheet represents the borrowing or confiscation of saver’s purchasing power.
The MBS Holdings are now a big unsolved problem for the Fed. As you mentioned due lack of refi and sell activity, nearly no maturities on the agenda. I wonder, why the Fed doesnt start some outright sales except testing the operational market funktions?
Ok, they are indirected government guaranteed, but will they hold the MBS forever?
They won’t hold them forever because eventually, in at most 29 years (assuming they were issued at the end of the craze), the homeowner will pay it off.
Political risk. If the Fed sells MBS and the housing market crashes, their fingerprints will be all over it and politicians will blame the Fed.
Runoff is going at 80 plus percent of the Fed target. This is pretty good for a government agency. Best to let things play out.
Every Fed and gov intervention and new ‘facility’ reeks of gov incompetence and corruption.
Can’t wait for the Fourth Turning to throw this nightmare out of our lives (check out Neil Howes new book btw!)
“MBS Holdings are now a big unsolved problem for the Fed”
Indeed. And that is why the Fed stayed away from such antics for decades.
But Bernanke “broke the mold”……and won a Nobel Prize.
Curious, the results of his actions are yet to be resolved…
but we do know that the real estate market has never been so disfunctional and illiquid…..and the Fed has a $1 Trillion unrealized loss on their balance sheet.
I’m pretty sure the real estate market was far more “illiquid” 10-15 years ago. Even nice houses in desirable areas weren’t selling in 2010
All those trillions and not even a hint of moral hazard. Is the Fed magic or what?
‘The Fed only holds government-backed “Agency MBS,” where taxpayers carry the credit risk, not the Fed.’
And yet another good reason not to pay taxes: no credit risk.
Life is good.
“‘The Fed only holds government-backed “Agency MBS,””
well rules are fast and loose….
Remember the SPVs the Fed used to circumvent the dealing restriction to federally backed securities?
Remember FDIC insurance limits of 250K?
The Fed has become much like the other autonomous “branch”, the SCOTUS…who can do just about anything they want and find justification for doing so with a word salad or two.
To my untrained eye, absent the bank panic facility we’d be below $8T which is encouraging.
Haven’t been impressed at all with the glacial QT but its working so ill bite my tongue. Im probably most peeved by the MBS rolloff which is a trickle and shows no sign of acceleration.
Wolf, in past tutorials you showed that the asset side can never go below the liability side of the balance sheet. What does that look like now graphically??
On every balance sheet, even your own if you do one:
Assets = liabilities plus capital.
So the sum of the Fed’s liabilities plus capital (capital is set by congress and doesn’t change) will always be equal to the Fed’s assets.
The four big liabilities at the Fed (money it owes others) are:
– Reserves (cash owed banks)
– Reverse repos (cash owned money market funds and foreign central banks)
– Currency in circulation (paper dollars, money owed the holders of those pieces of paper)
– Treasury General Account (the government’s checking account).
Those four accounts largely determine the assets the Fed has to have. As those accounts shrink, the assets are going to shrink. RRPs can go to zero, but the other accounts cannot go to zero, and that determines the minimum balance sheet the Fed must have. More here:
https://wolfstreet.com/2023/07/14/the-feds-liabilities-qt-pushed-down-reserves-rrps-by-865-billion-tga-gets-refilled-currency-in-circulation-hits-record/
👍🏻
Fed printed almost 5 trillion in two years. In 18 months, it tightened just about 800 billion. It makes roughly 500 million tightening per year. One tenth of printing speed. In this pace, it will take approximately 10 years (by the end of 2031) to remove the money the Fed printed in the pandemic from the system. Everybody knows that Fed will not tighten straightly for 10 years. Not even 5 years. That’s why everybody is bullish and buying every asset they can find (even the junk ones). That’s why there will be lots of money in the circulation forever and inflation will persist for the foreseeable future. Bye bye 2% inflation.
Your numbers are all wrong.
1. QT has not been going on for 18 months, but a lot less. QT started in June 2022, but was phased in slowly, and at first you couldn’t see much because of the lags. It hit full stride in September 2022.
2. The pace has been about $1 trillion per year, not $500 billion: The pace over the past three months has been over $90 billion per month ($1.1 trillion per year). The pace before the March bank panic was around $80 billion a month ($960 billion per year).
3.Sometime during October, the balance sheet will fall below the $8 trillion mark and a couple of weeks later, it will have fallen by $1 trillion from the peak. I will certainly make a big deal out of those events, LOL.
4. By the end of 2024, at this pace, the balance sheet will have a 6-handle, having fallen by $2 trillion.
5. QT is designed to run in the background for years. Eventually it will slow down as the Fed runs down its pile of assets that are maturing every month.
Looking at these charts, the parabolic path of QE, reaching max height, versus downward arcing path of QE obviously connects to the reality, that a little over a year ago, interest rates were pretty-dang close to zero.
It’s amazing how people currently chasing euphoric bull market bubble mania, tune out that extremely long period, when banks weren’t paying out interest to customers.
The mechanics of lagging interest rate hikes and this trajectory of QT — connecting to 5%+ money market yields, is the complete polar opposite of the fright stupid, risky, moronic brainwashed mindset of anyone thinking this downward QT arc is an investment opportunity.
Simple: the Fed has trained the public to expect bailouts and be made whole on any down turn. Now moral hazard in turbo mode is front running the Fed, anticipating a crash by going.. ultra long 🤷🏼♀️
“the Fed has trained the public to expect bailouts and be made whole on any down turn.”
No arguments with that statement.
Absolutely right. I can say that I have been thoroughly conditioned to expect Fed intervention in the next downturn. Especially any blow-up that even resembles a credit freeze. The fed has ballooned their balance sheet to address every crisis and even every little hiccup that has taken place during my adult life (as I approach 40). The GFC, 2014 for no reason, a mild stock correction in 2019, a bad flu, and that time a poorly managed bank failed a few months ago. I feel absolutely certain that they will step in with QE the next time the economy sneezes. Humans survive by pattern recognition. The brain is wired to recognize patterns, even sometimes where they don’t exist. Our creation, neural networks are quite simply sophisticated pattern recognition machines. Right or wrong, Fed intervention is how we’ve been programmed.
“… the Fed has trained the public to expect bailouts …”
Add in the FDIC and Treasury covering ALL the depositors in the SVB debacle.
Now, keep an eye on the FTX SBF fiasco……..watch that evaporate and the “losers” made whole. Just watch.
I hope the Fed keeps going with QT, but synchronized Wall Street crying is deafening when trouble hits, especially when store-bought members of Congress chime in. Lobbyists demand value for their dollar.
The key question today is – what will central bankers do? Will they do the right thing, or will they continue down the expedient path, in an effort to preserve the status quo.
MBS rolloff is frustratingly slow. I get that the Fed doesn’t want to (publicly) tank the housing market, but I’d wager most mortgages are getting paid off as slowly as possible (min monthly payment). After all, why would you pay extra towards the principal of a 3% mortgage when you can stuff that cash into a CD earning 5+%?
I agree with that, but I guess the question is how they would define “tank the housing market.”
Is returning it to December 2019 prices “tanking” it? Or is that just unwinding the excesses?
No one ever asks why someone who bought a house in 2013 is entitled to have tripled their money.
Good point. I’d say returning to 2019 levels is simply unwinding the excess (and I bought in 2020). Home prices should not be this high.
I also feel the Fed balance sheet returning to 2019 levels is also just unwinding the excess… but we have a long way to go to get there.
Home prices will go up as long as there is an increase in population in the USA. Which happens every year. Supply of houses is not keeping up with demand, especially now with housing starts declining with higher mortgage rates.
Home prices fell a whole bunch in 2005-2012, despite a faster increase in population than now.
Very hard to say. The real question is actually this: Is an asset’s price a measure of its value or of the dollar’s value?
We doubled the money supply in a short period of time, so it shouldn’t be a surprise that asset prices exploded even if real value went nowhere.
If housing dropped to 2019 prices in today’s dollars, then yes that would constitute a thoroughly “tanked” market. If the dollar is realistically 30% less valuable than it was in 2019, then matching 2019 prices would equate to a 30% drop in real terms. We can’t ignore the several trillion additional dollars floating around now that didn’t exist in 2019.
But if housing prices dropped, then the dollar is by definition, more valuable with respect to housing.
No one ever asks why somebody who bought Apple at $5 a share is entitled to have made 50 times their money…..
No one asks why why somebody who bought it Lin at $5 a Bitcoin is entitled to have made 6000 times their money.
Nobody asks why a baseball player, a football player or golfer is entitled to make 500 times a minimum wage earner per year……
As to Apple and Bitcoin, these people took a RISK.
As to the sports figures, they are the beneficiaries of a tax loopholes in which salaries can be deducted and contracts ALSO depreciated. Golfer’s money is considered advertising or charity deductions.
And no one asks if someone who bought stocks in early 2009 or April of 2020 is entitled to those gains either…should we be? Whats the difference?
AEI Housing said under an accommodative scenario prices could spike 6% this year and 7% in 2024. They claim their research is some of the best. Who really knows? IMHO…Most of the time house prices depend on the FED policies. Take it with grain of salt. Below is their research indicators and then at the end is their summary.
——————-
Expanded Housing Market Indicators use and connect many different datasets:
• HMDA
• Public Records Data
• National Mortgage Risk Index (agency MBS data)
• CoreLogic’s LLMA and Black Knight’s McDash (servicer data)
• Fannie Mae’s Loan Performance data and Freddie Mac’s Loan-Level Data (acquisition data)
• FHA Snapshot data (endorsement data)
• Data from Zillow on existing home sales and unique listings
• National Mortgage Default Rate (NMDR) – based on 58.5m purchase & refi loans
• MDR is a stress test, similar to a car crash safety rating or hurricane rating for buildings.
• MDR assesses default risk based on the performance of the 2007 vintage loans with similar characteristics.
•Monitor market stability through accurate, real-time tracking of leverage. Series begins in September 2012. Data are for government guaranteed loans.
• Historical NMDR – based on 92m purchase loans. Covers a quarter century of mortgage risk.
• Home sales – based on 47.6m home sales
• Data measure home sales for entire nation and include property and borrower level data. Series begins in January 2012.
• Supply/Demand – based on over 2,200 counties
• Data measure months’ supply at metro and county level.
• New Construction Sales – based on 5.1m new construction sales
• Data identify newly constructed home sales. Series begins in January 2012.
• House Price Appreciation – based on 28m sales of existing homes
• Using a “quasi” repeat sales index (see appendix). Series begins in January 2012.
Here is a summary of their predictions:
•June 2023’s YoY HPA was 2.9%, up from 2.1% a month ago but down from 14.3% a year ago.
• YoY HPA has bottomed out and is expected to continue rising through August 2023 based on Optimal Blue
data
Base Case HPA Projection for Dec. 2023 and Dec. 2024 of +6% and +7%, respectively
• Assumes mortgage rate at 5.75%-7.25%, unemployment rate <=5.5%, and months’ remaining inventory <4.5 months.
Bullish Case Projection for Dec. 2024 of +12%
• Assumes mortgage rate at 4.25%-5.75%, unemployment rate <=5.5%, and months’ remaining inventory 5.5% and 6 months.
Note: These things might occur at different times over the projection period.
I would bet a lot of money the housing prices are not going to spike 6% over the next 12 or so months.
No way.
Actually, I am already betting a lot of money, just indirectly. I would gladly do so directly though.
My favorite chart here is the “Fed’s Total Assets” It is scaled from $0 – 9 Trillion and goes back to 2008.
What strikes me about this chart is the quickness to flood the market with money for any glitch and the slowness to unwind it in “The Good Times”. How long before the next big ramp up? Do not know, but there will be another Black Swan event, and the flood gates will open.
Combine this with absurd government deficit spending and you will find you have built a house of cards – or are playing a Jenga game with a big pile of pieces already removed.
Don’t know when it will come tumbling down, but it will. It never ceases to amaze me how long these things take to play out.
QE = buying assets, such as Treasury securities and MBS, to have on the balance sheet long-term to push up asset prices.
Injecting short-term liquidity is not QE, and it gets unwound in weeks and months as you can see, and vanishes.
The Fed has switched strategies officially in the summer of 2021, before QE, when it re-instituted the “Standing Repo Facilities” that it used to have before QE before 2008. It used to use repos to inject short-term liquidity during a market disfunction, such as during the days after 9/11 when markets sort of froze. And after a couple of weeks, the markets functioned again, and the repos matured and vanished. There was no QE, and within a month, the balance sheet was back to normal.
The Fed has acted on this principle in March 2023, during the bank panic when it used $400 billion in short-term liquidity facilities to end a bank panic and bail out depositors. By now, a big portion of that $400 billion already unwound, and the red is unwinding.
So that’s how the Fed will likely respond in a future crisis, like it did before 2008, with brief temporary liquidity measures that quickly go away, but without QE.
Does a future treasury debt default hold true to how the fed would handle that sort of crisis? I mean it’s never happened since the creation of the Fed in 1913. I wonder what the fed would do in that situation. I actually agree with the rating downgrade this past week, the June 2023 debt ceiling debate was just too close for comfort. It only passed the senate by 63 votes when they needed 60 votes.
If the US were a company, it should be BB-, so higher level junk. That said, SVB was A-rated when it collapsed. So there’s that.
In terms of countries that issue their own currency, I don’t even know why they have a credit rating at all since effectively they cannot default.
But countries should have an “inflation rating” — the risk of future inflation — because that’s how countries default these days. The US debt problem will be sharply reduced by this inflation. We’re already seeing that in ratios such as debt-to-gdp, which is coming down.
Higher interest rates pose a problem for the budget over the shorter term until the effects of inflation kick in solidly — inflation drives up tax revenues! If we have 10% inflation and an economy with “real” growth of 2% (nominal growth 12%), then tax revenues are likely to rise by 12% roughly. In addition, $1 in debt issued 10 years ago will be refinanced, when the 10-year note comes due, with $1 dollar today that has a much lower purchasing power. This is how over the longer term, inflation lowers the burden of the debt, at investor expense.
A country that issue their ovn money can not default. On the other side, the state governing a country can cease to exist.
With the state gone the currency may also cease to exist and all money of that currency may become worthless.
Wolf,
In your reply you state: “QT = buying assets”. I think you meant to say “QE”, both here and several other places in your reply. No big deal, the point you are making is buying assets long term pushes up asset prices or can used short term to defuse a liquidity “crisis”.
My real point is that over the 15 years of the chart, the “ups” are more frequent, bigger and quicker than the “downs”. For the six years prior to 2008, the balance sheet only grew at $50 billion per year! Your chart beautifully illustrates what has happened since then. You can argue there are “good” reasons for it, but that chart shows what really happened.
Even the $400 billion liquidity injection over two weeks in March illustrates the point. It took three months to work off a two week ramp up. Indeed, the rate of decline since the March “crisis” has been greater. But, my quick and dirty calculation projects that it will take a full year to get back to the old trend line. So, extra money will be sloshing around for a while longer. Quick to rise and slow to fall.
We have developed an expectation that the Fed will “fix” any problem by throwing money at it. Agree, there was an “official” strategy change in 2021 and today things are rosy so QT is on autopilot. How quickly can that be changed in response to the next “crisis”? And, “stuff” will happen, the depravity of man guarantees that. Maybe there will be another ten years of “good” times. I do not expect that, but we get to watch it unfold as history progresses one day at a time.
Cheers!
1. “In your reply you state: “QT = buying assets”. I think you meant to say “QE”…”
Yes. I got them all flipped. Trying to cut back on coffee and so I microwaved my brain instead to stay alert. Might not have worked.
2. “My real point is that over the 15 years of the chart, the “ups” are more frequent, bigger and quicker than the “downs”. ”
You forgot to read the rest of the comment. The era you’re talking about is likely over, for the reasons I spelled out in the comment. I explained how the Fed is now set up to deal with problems, and it’s not through QE. You see it in the bank panic measures. So please read the comment. It’s important.
There’s still too much money sloshing around in the economy. The O/N RRP facility is prima facie evidence.
Powell is making progress. If it weren’t for “excess savings” (or “precautionary savings”), and that’s still in the trillions, he’d be done. Economist project that “precautionary savings” will be exhausted by the end of 2023.
https://www.frbsf.org/economic-research/publications/economic-letter/2023/may/rise-and-fall-of-pandemic-excess-savings/#:~:text=Should%20the%20recent%20pace%20of%20drawdowns%20persist%E2%80%94for%20example%2C,at%20least%20into%20the%20fourth%20quarter%20of%202023.
“A picture (a graph) is worth a thousand words”. It’s easier to read Wolf’s articles than dissect the numbers on the FED’s balance sheet.
This theory of “precautionary savings” is BS and it needs to finally die.
Look at household assets to get a feeling for their “savings”: tens of trillions of dollars in stocks, tens of trillions of dollars in bonds including Treasuries, something like $10 trillion in bank savings products such as CDs and savings accounts, plus $5 trillion in money market funds. This doesn’t even include equity in their homes.
Even the bottom 50% of households have $4.5 trillion in assets. The next 40% have $40 trillion in assets. The top 10% have $75 trillion in assets (Fed data). The majority of spending comes from the big spenders, not the bottom 20% who don’t have much to spend.
Declining liquidity is the result of a dearth of income, the ingredient from which debt is paid.
The “liquidity” whereof we speak — household liquid assets — isn’t declining.
I love how your articles become content for CNBC Fast Money. Too bad they aren’t giving you any credit
Random servicing the debt outtake from Fred blog, November 2021 (when Fed rates were near zero):
“As the Federal Reserve curbs its purchases of Treasury securities and contemplates increases in its policy rate to combat inflationary pressures, the cost of servicing the national debt is likely to rise. The macroeconomic consequences of such a development are difficult to forecast, since they depend on a variety of factors. The political consequences, however, are likely to manifest themselves as heated debates over the need for fiscal austerity measures”
I think higher inflation (3-5%) for longer will be a good thing. It will help America curb its consumption which is by far the largest driver of pollution and climate change.
Further higher inflation for longer will help with the national debt. I think there will be enough rational politicians willing to set aside their power struggles long enough to make sure there is something worth struggling over.
That consumption thing is so big. When I was born in the 1950s there were 3.5 billion people on the planet. Now we have 8 billion. It’s highly likely I will see 10 billion and possibly 12 billion. All of that in one lifetime.
Everyone of those people wants everything. How big and sustainable is the natural resource abundance of the earth?
Be forward looking because the ‘times they are a changing’.
Wolf,
Bill Gross was talking about tracking 20 year zero coupon treasuries because he felt that this was a good way to visualize the path and speed of interest rate changes.
He felt that this is likely to be hitting the same rate as the short term rates within 6 to 9 months, if the stagflation thesis is correct, and serves as the “canary in the coal mine”.
The reason for focusing on 20 year zeros is that it simultaneously incorporates liquidity risk and timing risk.
He also mentioned that one needs to see how these behave with future long term treasury issuances to see potential stress in the market.
What do you think about this?
What moments we waste scheming. At this moment in time, I think the 20 year is under priced, even if there is a recession.
The listless Fed is likely to hold onto their current, manufactured, yield curve.
Maybe. Best wishes
“Fed Balance Sheet QT: -$91 Billion in July, -$759 Billion from Peak, Biggest Drop Ever, to $8.2 Trillion, Lowest since July 2021”
Here is some perspective: The Fed balance sheet was $4119B on 2/27/20. By 3/26/20, a month later, the Fed balance sheet was $4970B, an increase of $851B. By 7/30/20 or roughly 5 months later the balance sheet was $6916B, an increase of $2797B. All numbers were obtained from the federalreserve.gov website.
I am glad to see the Fed balance sheet going down and not up, but the difference between Fed balance sheet increasing vs decreasing is beyond tremendous. The Fed absolutely, positively never should have purchased even $1 of MBS – that had to be all about offloading the Fed member banks bad paper.
Exactly. What was the emergency that required the Fed to buy over $2T of MBS. Sure, we had a pandemic, but what does that have to do with subsidizing home purchases, which were largely speculative?
They drop the stimulus so freely. It’s no wonder we’ve suffered 20% CPI in three years and 300% asset inflation the past decade.
Well, it wasn’t the populist frenzy that resulted from the Fed’s sponsored financial kegger. It was the Fed’s role in instigating the stampede that is reprehensible.
The Fed buying ANY long term paper was a departure from the norm and history of the Fed.
And Bernanke got the Nobel for that poor decision….and we still wrestle with the ramifications. Real estate market dysfunctional and the Fed with a Trillion dollar unrealized loss in those purchases (and others)
Nice work. /s
Well, I have to hand it too you, once again pulling off one of the most difficult tasks that life demands. Reporting the facts, without undue emotion. I’m able to pull it off for a short while. You seem to be able to process the data, no matter how absurd, as if it were, well, the facts.
Good article, food for thought. Each figure presents the normalization of absurdity.
Good on you.
To me, your excellent graphics tell a story of a Fed that lost it’s way. An ignoble servant of concentrated wealth who went all in and lost.
This miserable institution bailed them out. Covered their gambling losses with public money. It is hard to support an institution with no integrity. IMO
I say this with full knowledge that love is the only remedy for what ails us. The thing about having seven siblings within a 12 year window is that we have lived together for 40 years without incident and suddenly we are all at risk of dying from a plethora of possible causes.
Just saying.
QT hasn’t “bit” yet. If you look at the amount of bonds/bills owned by the Fed maturing in any given month, it’s far beyond the 60 billion tightening. More like 100-300 billion rolling like a wave as the extra over 60 Bn is rolled into whatever the treasury is selling that day/week/month. Probably just lobbing into 1,2,3 month bills which are auctioned weekly. So the SOMA remains a buyer in size at treasury auctions as they keep rolling over short term bills. This will last through 2024 and only by about 2025 will the Fed start to be mostly absent from bill auctions.
I downloaded the CSV file posted by the NYFed listing all the holdings by CUSIP. Some manipulations to tease out the maturity month year and then some calculations to factor in the roll off and you can see the exact progression of QT and the mountain of bills that will be rolled forward like a bulldozer pushing dirt forward.
The 60 Bn a month eventually whittles it down. That’s when treasury auctions get a little wobbly, IMO.
how do we interpret BTFP still creeping up?
Discount Window crept down = some banks switched their loans from the Discount Window to BTFP because the rate is lower and the collateral requirements aren’t as strict. The combined sum has been flat for two months.
See second-to-last chart, red line (Discount Window) and green line (BTFP).
thanks