In numbers and charts: The weight changes in the major CPI categories pushed up overall CPI.
By Wolf Richter for WOLF STREET.
There has been a hullabaloo of sorts in certain circles recently about the adjustment of weights for the calculations of the Consumer Price Index (CPI) by the Bureau of Labor Statistics. Swirling around in this hullabaloo were suggestions that certainly the BLS is adjusting the weights to manipulate CPI down and further deceive Americans about inflation. So we’re going to look at the actual weights and numbers and charts, to see how the weights changed in recent years and for 2023. So meet the surprises.
There are about 330 expenditure categories of goods and services that make up CPI. For example, “white bread” is one category, summarizing the prices of many different types and brands of white bread. In this manner, the CPI basket covers just about everything consumers are buying. Each of these goods or services is assigned a weight in the overall index that determines its “relative importance” in the overall index. All goods and services added together have a weight of 100%. That never changes. What changes are the weights of the individual categories, some weights increasing, others decreasing, but the sum always = 100%.
The BLS adjusts these weights based on the changing purchasing patterns by consumers. When consumers spend a larger portion of their total spending on item X than they used to, the weight of Item X increases. Conversely, they will spend a smaller portion of their total spending on Item Y, and its weight is then reduced. The idea is to keep the CPI basket up-to-date with current consumer purchasing patterns, which shift over time.
These adjustments used to be made on a two-year cycle. Starting with 2023, the adjustments of the weights will be made every year to capture shifts in spending more quickly. During Covid, there were massive shifts in the spending patterns, causing mind-boggling distortions in the economy. But because the weight adjustments occurred on a two-year cycle, they initially missed the big changes. So going forward, the adjustments will be made annually, the BLS said.
Here are nine major categories that together account for 83% of overall CPI:
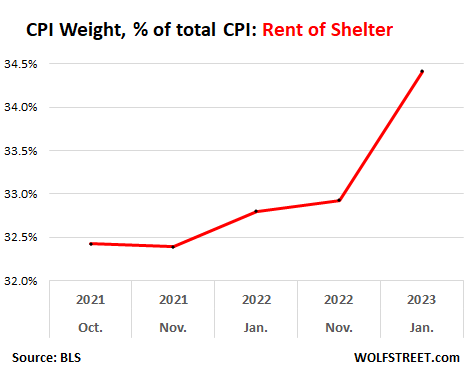
“Rent of shelter,” a high-inflation biggie: weight increased, pushed up CPI.
The weight of “rent of shelter” – a stand-in for housing costs that roughly accounts for one-third of CPI – was increased in 2022. Because the CPI for “rent of shelter” spiked in 2022, the higher weight made the overall CPI worse in 2022. It was then again increased by a much larger amount in January 2023 for the current year.
The weight was increased from 32.05% in November 2021 to 32.42% in January 2022, and to 34.04% in January 2023.
In January 2023, with the CPI for rent of shelter a red-hot +0.8% month-to-month and +8.0% year-over-year, the higher weight made CPI even worse:
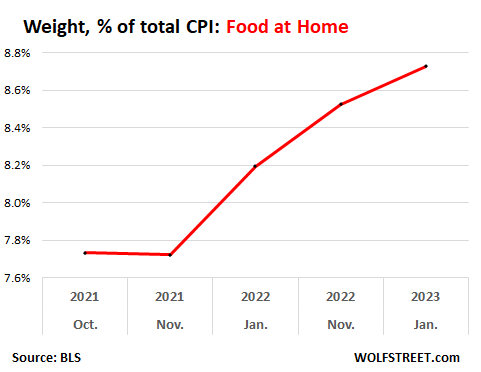
Food at home: weight increased, pushed up CPI.
The weight of food at home – food and beverages that folks buy at stores – jumped in 2022 with a surge in purchases in 2020 (remember, it was on a 2-year cycle). The weight has now jumped from 7.7% in November 2021 to 8.7% in January 2023.
The year-over-year CPI of food at home has been in the double digits for 10 months in a row. And the higher weights made CPI even worse so far:
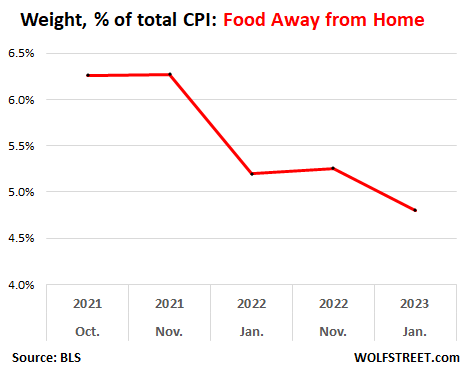
Food away from home: weight dropped, pushed down CPI.
Food away from home includes restaurants, delis, vending machines, cafeterias at schools, company work sites, etc. This industry got crushed during the pandemic. Restaurants have recovered, except those trying to make a living off the office lunch crowd; those got hammered by working from home, which also hammered company-provided meal services in office buildings that used to be touted as a big benefit. Many companies closed those eating facilities because people are working from home. So overall, people were eating more at home, and used the company-provided lunch and dinner facilities less often.
And the weight of food away from home dropped from 6.3% in November 2021 to 4.8% in January 2023, with the biggest drop occurring for 2022, and a smaller drop for 2023.
The CPI for food away from home has been running hot at over 8% for much of last year (in January 2023: +0.6% month-to-month and +8.2% year-over-year), and the decline in the weight pushed down overall CPI:
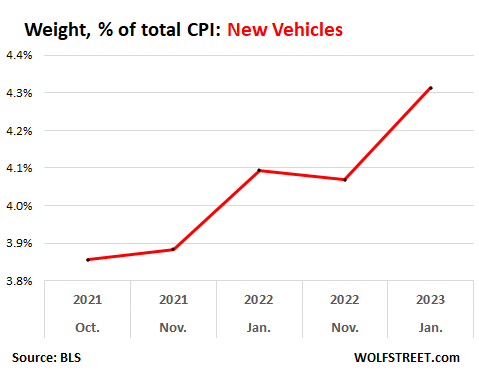
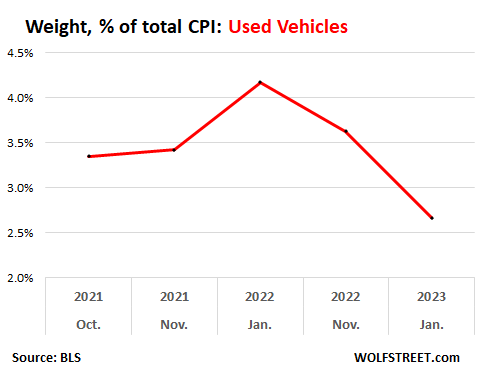
New and used vehicles: Weight changes pushed up CPI.
The number of new vehicles sold to end-users plunged in 2020, 2021, and 2022 to levels first seen in the 1970s due to supply-chain shortages, particularly semiconductor shortages. With inventories depleted, the prices of new vehicles shot higher, and month after month for 12 months straight, from October 2021 through September 2022, the CPI for new vehicles jumped by over 10% year-over-year.
The weight rose from 3.9% in November 2021 to 4.3% in January 2023, which, given the increase in new-vehicle CPI, made overall CPI worse.
Used vehicle sales volume dropped substantially from pre-pandemic levels, largely because of the most mind-boggling price spikes ever, with the CPI for used vehicles spiking by 45% year-over-year in the summer of 2021, and enough people just said no, and for the past 12 months, the CPI for used vehicles actually dropped.
Weights were adjusted higher in January 2022 to 4.2%, but then were reduced to 2.7% in January 2023. Because used vehicle prices have dropped for a whole year, the lower relative importance of the dropping CPI for used vehicles pushed up the overall CPI so far:
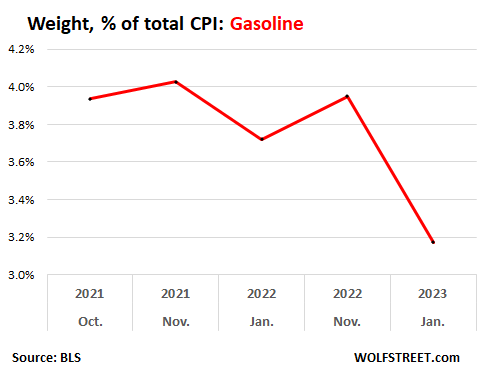
Gasoline: weight dropped, as consumption dropped.
Gasoline is one of those products that when the price spiked through mid-2022, people cut their consumption. According to EIA data, consumption of gasoline in the US, as measured in barrels per day, fell by 4.5% in 2022 from 2021.
Over the last six months of 2022, gasoline prices plunged. In January, the CPI for gasoline was just a tad higher than in January a year ago
The weight of gasoline dropped from 3.9% in November 2021 to 3.2% in January 2022. With little year-over-year price change in gasoline in January, overall CPI wasn’t impacted in a major way.
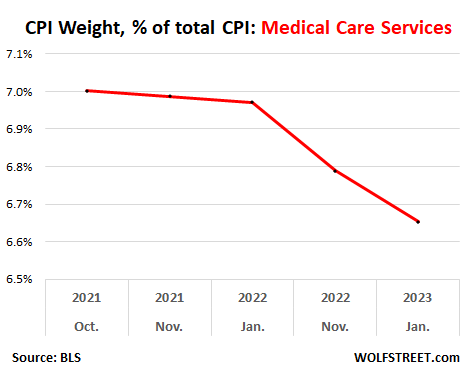
Medical care services: weight declined, and in interesting twist, pushed up overall CPI.
This category does not include medical drugs, a category of its own. Weight dropped from 6.97% in January 2022 to 6.65% in January 2023.
This is an interesting twist. Medical services include health insurance. Starting in October 2022, health insurance CPI was massively adjusted downward for the next 12 months, making up for the overstatement in the prior 12 months. After this adjustment, the health insurance CPI month-to-month has been deeply negative, and dragged overall medical care services CPI into the negative (-0.7% in January month-to-month).
By reducing the weight of medical services in overall CPI in January for 2023, the negative medical services CPI weighs less in overall CPI, and the reduction in weight of this negative number results in pushing up overall CPI. You might have to read this sentence a couple of times – like I said, an interesting twist.
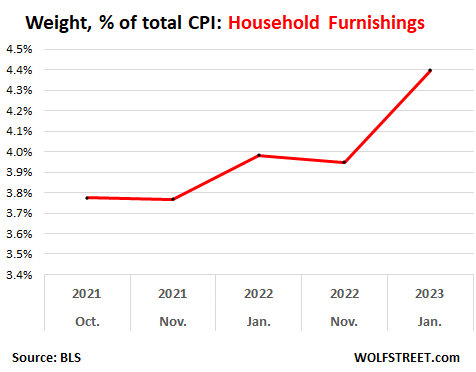
Household Furnishings: weight increased, pushed up overall CPI.
Remember what we said: these weights are adjusted on prior years’ consumption pattern. And during Covid, consumers bought all kinds of stuff to fix up their homes and patios – furniture, window and floor coverings, appliances, lamps, tools, dishes, etc., for all kinds of reasons, including to prepare the home for working from home, causing an epic spike of these types of purchases.
And the weight increased from 3.8% in November 2021 to 4.4% in January 2023. With the CPI for household furnishings jumping 0.5% month to month and 6.4% year-over-year, the higher weight of this hot category pushed up overall CPI.
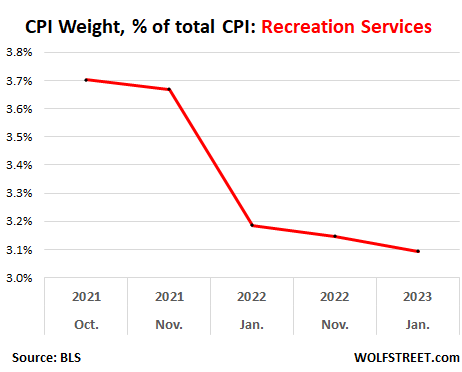
Recreation services: weight declined
This category includes video and audio subscriptions, cable, streaming services, etc. The CPI for this category has increased by 3.9% year-over-year.
The weight dropped from 3.7% in November 2021 to 3.1% in January 2023. I’m not sure why. Maybe people started going out again, and spending less on at-home entertainment services:
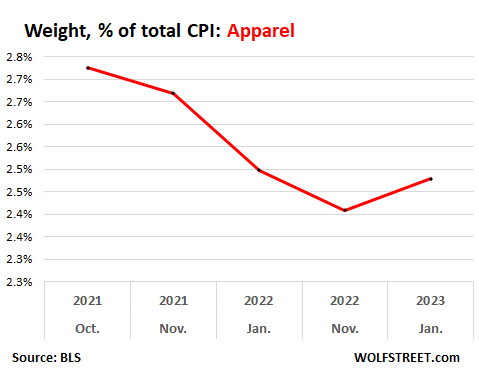
Apparel: not buying those office clothes?
Working from home was a nightmare for clothing retailers that sell clothes that people wear to the office. But some of it may now have turned around, perhaps amid a bout of revenge spending on travel attire.
The weight dropped from 2.7% in November 2021 to 2.4% in November 2022, but in January, the weight was raised to 2.5%. The CPI for apparel was hot in January, at 0.8% month-to-month, but year-over-year was up only 3.1%.
Enjoy reading WOLF STREET and want to support it? You can donate. I appreciate it immensely. Click on the mug to find out how:

![]()
Superb analysis, better than any other source. I am of the opinion that the government does cheat on inflation measurement by using substitution, hedonic adjustment, and owners equivalent of rent, but this weighting adjustment process doesn’t look like it’s a means to further lie and cheat like the other adjustments clearly are.
It’s interesting how hedonic adjustments only seem to impact good and not services. Services are 70% of the economy, but when services decline as they did during COVID, I don’t recall ever hearing about any hedonic adjustments to account for changes in service levels, which are impact by wait lines, staffing shortages, poor phone support, etc.
Is that a big hole in the fence?
In 1980, did you have to wait two months to get a medical appointment scheduled?
Well said.
From looking at my BCBS Health Insurance premiums alone (I haven’t visited a doctor for several years, even though I am in my 70’s and COVID shots were free), I am firmly convinced that Medical services are being ridiculously lowballed in the CPI formula.
I also find it irrational (to be as polite as possible) that the cost of Internet Security Software (e.g. Norton 360 annual subscription is now $128.39, UP over 20%!) is NOT, as far as I know, included in the “services” computation. I’m pretty sure having a secure internet connection is a non-optional part of the reality based cost of living now. I am also pretty sure that HAVING an internet connection is a non-optional part of the reality based cost of living now.
Another “irreverent observation” that I must make is that, Eating Out, unless you are homeless, IS 100% OPTIONAL (everybody CAN brown bag it to work!), I think it is irrational to include it as part of the “cost of living”.
“Norton 360 annual subscription is now…”
Years, ago, we replaced Norton with Windows defender which is included for free with Windows. Works at least as well.
So our YOY CPI on anti-virus software has been 0%.
I found Norton to be a shitty program that’s more into spamming you than protecting your machine, and it takes up massive amounts of resources.
So you can kick inflation in the groin and install a little deflation in your home through substitution, LOL.
Of course, if you’re using a Mac, you gotta pay.
“Eating Out, unless you are homeless, IS 100% OPTIONAL (everybody CAN brown bag it to work!) I think it is irrational to include it as part of the “cost of living”.”
That’s a joke, right??? Or are you trying to telling me that only those things that keep you alive should be in CPI, and everything else should be removed? You just need a tent to stay alive, so any solid structure that you might rent should be removed from CPI??? And any food beyond the basic, should be removed? And BEER?????????????????? You lost me there.
…some very good academic cases have been made for beer being the driving force behind the development of agriculture, and hence, non-nomadic civilization…
may we all find a better day.
Actually MUST agree, like totally dudes and dudettes with 91B20 on this question!!!
While many think ”lazy ness or similar” are the basis of innovation and creativity,,,
IMVHO,,,
DESIRE,,, as he or ”they” suggested, especially desire for booze, six, etc., are, in fact the ”real” drivers…
Thanks again Wolf for this clearly ”telling it as it is” website and the wonderful ”commentariat”,,, also at least trying to tell truths to power here in…
i dont think that this analysis addresses hedonic adjustments at all. Only the composition in the basket of goods purchased.
Question for the rental unit owners here on wolfstreet. Are you still seeing your markets supporting rent increases? Have the increases moderated in your area?
I sold my home 13 months ago, and been renting and had to renew my lease. I was paying $3100 (on average, (garbage, water, … made the final monthly rate vary depending on tenants consumption) and in my renewal lease, they wanted to increase it a whooping 10%, the full amount permitted by my city ordinance, but I negotiated it down and will be paying on average $3350 including RUBS: Ratio Utility Billing System).
1) Russia is selling oil to China and India at a discount. Iran have to compete with Russia, bartering with China. The Iranian econ is in a dire shape. Iran became an enslaved nation in China silk road.
2) Winter 2023 is over. Europe survived, but within 3 quarters winter 2024 start.
3) If 2024 winter is harsh and US isn’t good enough NG & oil prices will rise.
4) The stock markets might rise, but in Jan 2024 gasoline CPI might cannibalize rent cpi and rise from 3% to mid teens. Higher energy prices affect food at home cpi, food away from home cpi, new and used vehicle cpi, medical care service cpi, furnishing, apparel, recreation…
Harsh winters may be a thing of the past. Its in the 80’s this week in Texas and 90’s next week.
Texas just need the La Nina to end, third year of it in a row, first time this century. La Nina brings wacky weather, really hot hot dry summers and warm mild winters to the southwest and Texas. Oh yeah, cant forget the drought, it bring drought as well.
Weren’t some politically inclined people shrieking about a Texas winter apocalypse just a couple years ago?
The past of 2 years ago when freezing temperatures almost ruptured Texas’ grid?
V/Cas/A – that’s the issue, it’s NEVER ‘one and done’ with the natural environment (“…climate is what we expect, weather is what we get, and it will weather, whether or not…”, as my old Climatology prof. used to say…).
Snowing here in the Coast Range at 1500′, 70mi. N of SFO as I type.
may we all find a better day.
Nat Gas prices are back to 1999 prices. Crazy. We are a hair within COVID lows. We now have a glut of nat gas. High prices in oil and nat gas always seems to be folllowed by a glut and a price crash.
I read that Europe wished they did fill their nat gas storage with expensive nat gas now that it is 70% cheaper. LOL
——————
Europe’s natural gas prices have tumbled to their lowest level in nearly 18 months in the latest sign the region has avoided a much-feared energy crisis.
Benchmark wholesale gas prices fell almost 5% Friday to hit €49 ($52) per megawatt hour, their lowest level since September 2021 and a fraction of the all-time high of €320 hit in August last year, according to data from Independent Commodity Intelligence Service.
Gas stores across the European Union were 65% full on Thursday, according to Gas Infrastructure Europe, an industry body. That’s well above the 45% the EU averaged at this point in the five years to 2022.
It all depends what you want to measure with the CPI. I’m not a fan of changing the weights yearly. It would be good to have in addition a measure where the weights are unchanged, say for 5 or 10 years, to measure price changes instead of habit changes.
The classic example is food. In an economic downturn, if people switch from expensive food to cheap food, like from steak to burger meat, the CPI will be reduced because the weight of steak will be lower and the weight of burger meat will increase.
It’s very hard to find reliable data about price level increases, because the quality changes of products are almost impossible to measure.
“It would be good to have in addition a measure where the weights are unchanged, say for 5 or 10 years”
How about publishing Volcker’s CPI right next to our current “Chinese”
veracity CPI ? And let the little people decide which one is telling the truth.
I already know the answer.
“The basket of goods in the Consumer Price Index thus consists of about 80,000 products; that is, several hundred specific products in over 200 broad-item categories. About one-quarter of these 80,000 specific products are rotated out of the sample each year, and replaced with a different set of products.”
So it seems like you could find “steak” in the data for some years, and get a long term comparison. Although there might be some hedonic adjustment for grass-fed steaks.
The CPI is a snapshot and nothing else. It is not really useable to track changes or for what if calculations. As a snapshot it is given far to much importance.
“You might have to read this sentence a couple of times.” 😂 “ Revenge spending.” 😂😂😂 I’m dead over here! 😵🪦💀
I would have to agree with all the adjustments, with the exception of Medical (understanding the adjustment from earlier over balancing).
The “rent of shelter” is a curious number…. a vague calculation when there is better “real” data available. A “survey”? Anyone ever been asked to be part of that survey? Anyone ever know anyone who has been asked?
The PCE index, the one the Fed allegedly follows, allows for substitutions….chain weighting. People switching from one good, when the price is too high, to another good less desirable. That seems to be a curious calculation as well. Biased to low readings. Comments?
“The “rent of shelter” is a curious number…. a vague calculation when there is better “real” data available. A “survey”? ”
Your “real” data is asking rents, which are illusory rents advertised by landlords for their vacant units. Few tenants pay them because there isn’t a lot of turnover of tenants.
Asking rents is the single worst measure or rent inflation because it measures advertised rents not actual rents paid by tenants. For CPI purposes, asking rents is total BS.
The Zillow Rent Index is based on asking rents, as are all the others I have occasionally covered here.
For the CPI, “rent of residence” is based on a survey of a large number HOUSING UNITS (by address!) whose tenants are asked the same questions over time, and when tenants move, the new tenants that moved into the same housing unit are asked the same questions about what rents they pay, and the rent changes are tracked that way over time for this particular housing unit.
This is the best measure of “actual rents paid by tenants” that we have. There are suggestions that it lags by some months, so it might not react as fast as we want to. But it’s still the best measure out there of actual rents paid by actual tenants.
Well, Wolf, with that level of G granularity in “rent of residence”…the G should be able to publish detailed, metro level (monthly?) stats…do they? Or just an aggregated lump?
(I honestly don’t know and am sincerely asking…I’ve never seen that level of granularity referenced, but maybe the G does put them out, buried a few links deep).
“Asking rent” isn’t perfect, but it is at least metro specific, monthly, and trend/scale indicative (ie, if landlords couldn’t make them stick somewhat…they’d stop “asking”).
I really hope the G makes such disaggregated rental stats avl…but wonder why I’ve never seen them referenced.
For example, here are the major CPI categories for San Francisco. Scroll down to “shelter”:
https://www.bls.gov/regions/west/news-release/consumerpriceindex_sanfrancisco.htm
Okay, that’s helpful.
I wonder if anybody on the internet shows all the individual CPI metro shelter numbers on a single page – considering the popularity of the rent surveys, it would seem to be an obvious project.
(Of course, the G could do it fastest, having all the data already in a database)
I’ll Google around.
“I wonder if anybody on the internet shows all the individual CPI metro shelter numbers on a single page”
It’s easy to say this in a comment, and when I post of those types of articles, few people read them. They’re all over the internet. But unless to stick a clickbait title on it, few people will read them. I have covered CPI by metro a bunch of times, including these two. Not many people read this stuff:
https://wolfstreet.com/2019/05/10/in-these-us-cities-americans-suffer-hot-inflation-but-there-are-cool-spots-too/
https://wolfstreet.com/2018/06/12/inflation-by-us-metro-red-hot-to-lukewarm/
Healthcare inflation going down? It’s one of the main reasons I left the USA… I don’t think it has decelerated. Was the adjustment to ignore the money employers pay or something. I forget, and I am too lazy to look it up again.
Bobblehead,
RTGDFA. It said:
“Starting in October 2022, health insurance CPI was massively adjusted downward for the next 12 months, making up for the overstatement in the prior 12 months. After this adjustment, the health insurance CPI month-to-month has been deeply negative, and dragged overall medical care services CPI into the negative (-0.7% in January month-to-month).”
And it provided this link for you to educate yourself with:
https://wolfstreet.com/2022/11/10/services-inflation-spiked-to-second-highest-in-4-decades-would-have-hit-new-high-if-not-slowed-by-biggest-ever-adjustment-of-health-insurance-cpi/
If you’re “too lazy,” as you said, to look it up or even read what is already in front of you, fine, but don’t comment on it.
Even more relevant is the %age of adult citizens who can even afford to buy a home. Statistics from the 70s-80s indicate 70%+ adults could afford a home. Today, it’s something like only 48% are eligible in buying a home.
In some mega-metros, it is closer to 25%.
Of course, Healthcare costs have increased exponentially in the last few years. Inflation rates have only increased those costs.
You were smart in leaving the US. We have friends in Western Europe who are amazed at the insurmountable costs of surgeries, pharmaceutical and general health care costs in the US.
But other servicesare also the highest in the Western World: monthly tech bills, auto/home insurance, and rental costs. It should be pointed out, those services are all in the hands of Big US Monopolies. There’s the difference.
The CPI for medical care services was 25% year-over-year last September. This includes Medicare premiums. This was bigger than reality. And so now they adjusted it for the next 12 months to bring the index back down each month.
Wolf, I’d like to hear you discuss the “DOW JONES STOCK INDEX” and how substitutions in the index from year to year make it look better than it would be without them.
A steadily rising DOW since, say, 1900 looks good.
But if the original buggy whip companies were still in the index, their zero value would flatten the ever-rising line of the average.
Thanks,
B.I.L.L
The problem with the DOW isn’t the substitution. All indices do that as companies grow or die.
The problem with the DOW is that it is an average of stock prices — not based on market cap. This has some crazy effects. For example, when Apple did a big 4-1 stock split in 2020, which cut the stock price by 4, the most valuable company in the US plunged in the DOW listing to #16 now, with a weight of less than 3%. United Health is #1 and weighs nearly 10% because it has a stock price of $500. It’s a completely stupid setup for modern times. But that’s how it was done forever. The media need to stop citing the DOW, and it needs to fall into oblivion.
The government lies, it lies about everything, and it lies 100% of the time.
The CPI is a joke. Shelter at 32%? How many people do you know who only spend 32% of their budget on housing? Or 4.8% on food?
For CPI to be a credible statistic, it would need to be weighted realistically to what peoples actual expenses are based on their household budgets.
All governmental bureaucracies are political tools used to deceive the public.
Jdog,
You’re spouting off BS. At several levels.
One-third of homeowners own their homes free and clear, and their housing expenses are a tiny part of what they spend.
Another third of homeowners bought their homes a long time ago, and their mortgage payments are relatively small.
Lots of well-to-do people with high incomes rent in expensive cities like NY City and San Francisco, and rent is just a small part of their income.
In some states, such as Oklahoma, rents are cheap, and don’t eat up big portions of incomes.
If you have the attitude that government data “always lies,” go somewhere else, because WOLF STREET isn’t the site for you.
Wolf. Don’t send people away and discourage them from being exposed to your analyses. I do not always agree with you but I find your analyses of high quality that must be incorporated into my opinion. Sometimes I think it is the timeframe we disagree on but that is just predicting the future and no one has a handle on that. So I listen to a lot of opinions.
I agree with the “do not send them away” part. I know it has to be a pain in the ass but bad speech is countered with good.
Wolfstreet is one of the places that good speech happens. When one comes from let us say one more sensational blog’o’spheres, it takes sometime to work through all the BS. I know I had an adjustment period. We as commenters can help by stepping up and lending our voices to the side of sanity.
Our current Federal Govern ment is the most corrupt during my 65 years of life. I do not blame you for distrusting anything they put out.
Jdog,
Lots of people say this, but how many people use CPI to budget their life? I’d guess out of ~300M ppl in the US none do, at most we’ll bring it up with our employers for raises and such. It’s just a market indicator representing a fictional person. After tax I currently spend 25.6% of my income on shelter, and 9.6% on food lol. CPI doesn’t represent me very well, am I supposed to complain about overweighting on shelter? I know for many people shelter makes a larger proportion of overall budget though.
Personally I would love it if there was another indicator available to track prices without hedonic adjustments as others here suggest, it would be helpful but there is a point to making that adjustment as well. The CPI is “deceitful” to the public only to the degree of their ignorance about how it works. The CPI isn’t really meant for them anyway.
I dunno, we can all see how much we spend on everything ourselves, don’t need CPI or Core PCE for that.
This was meant as a reply to Jdog.. not sure what I did there to screw it up lol, sorry
> It’s just a market indicator representing a fictional person.
It’s a statistic. Based on samples, aggregated numbers
We have to get to some kind of measurement. With various qualifications, that gives us data-driven decisions. Of course it doesn’t reflect you personally, or those just like you. But when i see Jerome, I’ll be sure to tell him about your perspective.
Retailers are still pouring on mark-ups on items people mostly buy, such as prepared foods and snack items. Soft drinks, chips, and lazy couch food keep inflating in price and consumers keep on buying even if it is starting to go on the credit card. If you want to actually cook, you can still get by.
It is obvious retailers are pushing on the situation for all its worth, it’s what corporations are designed to do. So, no help with inflation there.
There are many ways retails consumers are not helping themselves in the current conditions. If things take a downturn, those will be the first to bottom out. As they always are.
I’m beginning to wonder what a downturn is and if the predicted crash will ever happen. I don’t think the top 5% will ever be hurt too bad with The Fed and Gov covering their backs. It’s up to the rest of us to be in the right situation and use some prudence with our lifestyle come what may.
Walmart just announced warnings they are seeing pullback from consumers now so the following quarterly earnings may fall. If junk food and soft drinks are ever removed from food stamps (like they should) it would really be rough for retailers’ big profits. So that won’t happen, right politicians?
This is precisely why we cook all of our breakfasts and dinners. We never eat chips, dips, and all processed.
Years ago, a CEO of one of the US largest “cereal makers” came out and honestly stated: “the kids are, in effect, simply eating sawdust.” Ditto that with flour manufacturing. :)
Rubicon – did the breakfast cereal folks also reveal that magically-additional ingredient-sugar!-that makes the MDR of cellulose so tasty?
may we all find a better day.
Random thing related to the increased price of my Newman salsa ($4.59). My salsa used to cost around $2.50 a jar, which is a massive exponential increase in cost, which I believe is not being captured in cpi measurement. I’m currently making hedonic adjustments, by diluting overpriced jars of salsa with cans of crushed tomatoes. For those of us currently eating cat food, the eventually switch from canned products to low quality dry pellets will be entirely unwelcome and inhumane.
The Chained Consumer Price Index for All Urban Consumers (C-CPI-U) increased 6.6 percent over the last
12 months. For the month, the index increased 0.8 percent on a not seasonally adjusted basis. Please
note that the indexes for the past 10 to 12 months are subject to revision
Salsa prices are up?
¡Ay, caramba!
The trick for hard cat/dog food is to heat up some inexpensive beef or chicken broth and pour a little over a bowl of the dry stuff. This is a “tip” from a retired guy on a fixed income. (a little broth goes a long way here)
Don’t taint that good stuff by supplementing it with junk from outta the tin! Newman’s Own remains one of the best products you can buy. Consistently excellent and virtually free from all harmful byproducts according the ewg website which measures such things.
Wolf has extraordinary patience to chip away at the surface BS of the BLS figures and to point out what the data is saying. Since there are few alternatives to BLS and Gov’t data, Wolf’s digging seems to expose what might still be of some value, be that good or bad. Thanks WR!
Hopefully, I won’t be banned for providing a link to Fred here.
This mixes apples and oranges into a junkyard hodgepodge of economic ignorance, but it graphically tells a story about the C-CPI-U definitely heading higher (+0.8) in general contrast to the (current) 12 month Treasury rate trajectory.
What this indicates to me, is the impact inflation is having on yield performance. As inflation trends higher, at a faster rate than treasury yields, that indicates the Fed has to stop acting like old nuns driving along in an old bus with a flat tire, limping along, at a glacial pace, pondering if they shoul pull off to the edge of the cliff, and allow the inflation truck to accelerate.
Obviously, we don’t want this bus load of nuns to act super recklessly and simply hand the steering wheel over to God, but as everyone on the bus can see, the current situation is falling apart rapidly.
The lingering foul smell of transitory inflation is now smelling like burning rubber!
Thanks for publishing this stuff. It’s frankly awesome. This is the sort of detailed and deep-dive that is always going to be missing from The Washington Post, The Economist, etc.
On a side note – white bread is a category unto itself? I can’t remember the last time I bought ‘white’ bread!
Whoever buys lots of white bread will be “chained” to higher medical costs later.
Evan,
Yes, good old white bread is a category.
You pinpointed exactly why weights have to be updated — you don’t eat white bread any more. And you’re not the only one. Lots of people stopped eating white bread.
In my younger years, sliced white bread in plastic bags covered the majority of the bread aisle, and grocery stores didn’t have bakeries. I ended up baking my own German-style sourdough bread with a dark crispy crust, the way I like it. But now, even grocery stores have bakeries, or they have a deal with local bakeries, and you can buy good freshly baked bread (that doesn’t come in a plastic bag). And bread consumption has shifted away from sliced white bread in plastic bags to other styles of bread. So over the decades, the weight of white bread in CPI had to decline to reflect what consumers actually purchase.
My Kroger has migrated from “baking” in its bakery, to “thawing” frozen baked goods. Some still stiff with frost on the insides. Even the “fresh boxed cookies” are cold as ice if you pick them up shortly after they are put on the shelves.
Found a real bakery in town about 12 miles away, they are open at about 6am and close at 2pm or when the goods are sold out, but everything comes out of their ovens. None of that weird aftertaste either.
Mmmmm!!
Lets not forget that bread of any type is a manufactured product. I have been reminded by farmer friends that the cost of wheat in a loaf is less than the cost of the plastic bag to contain it.
Fact checking: A bushel of wheat yeilds about 70 loaves of bread
Current price is around 8$ per bushel but lets make it 7 bucks for ease of the math .
Therefore there is 10 cents worth of wheat in an average loaf.
I have no idea how much the bag costs.
DaveP,
Yeah, but when I baked my own bread, the cost of wheat and of the sourdough starter (which I kept going for years) was not a huge factor — though I didn’t buy a bushel of wheat from a farmer but a big bag of wheat flour and a big bag of rye flour at the grocery store at retail price. And they were good for a few big round loaves.
What was not irrelevant was that it took me an entire Saturday afternoon to do: prepping, kneading, letting it rise, kneading a second time, letting it rise a second time, baking, etc. and cleaning up the mess.
When you buy good bread, you’re paying for the cost of actually making something good, and for making it properly, and for the know-how that goes into making it. You’re not paying for flour.
The time it took to make bread is the reason I quit doing it.
Wolf – thanks for illustrating the oft-neglected truth that the fruits of civilization are much greater than the sum of their parts…
may we all find a better day.
Hubby has been baking our own bread for years, years before covid. White, sourdough, baguettes for dinner parties. Little rounds of sourdough to dip in good oil.
When half of everyone decided to bake bread during covid we had to order pricey yeast online. And bread flour was impossible to find.
Hey Wolf,
I got a bread machine to produce excellent (as good as botique) Rye, Wheat, & rarely White Bread, (which is the basic recipie Rye & Wheat derive from), but have not been able to yet produce our Famous Bay Area Sourdoughs.
I figure I’ll have to get a local yeast colony going to capture that unique Bay Area Sourdough taste, and likely abandon baking in the breadmaker for a conventional oven, where I can get the moisure content of the air up enough to grow our delicious Sourdough crust. I’m thinking a cup of water in the oven, or maybe a spritzing of the loaf at key times?
Is your research and analysis of bread baking as objective and clear as your most excellent economic analysis? To mix the metaphor;
Economically, I’d say we need a new batch of starter yeast (ethics-goals), new flour (fix Edu-end crimigration), and a new oven (market/market rules & leaders), when I look at the process and product of our political economy… That’s one messy kitchen!
And to think, we started with a fine recipie (the Constit.), and the freshest ingredients (untouched resources of a continent untouched by post-stone age industry, ie, virgin…), and this is where we are… Our contemporary, “loaf,” and the process of, “baking,” it certainly represents some long-term bad baking/kitchen practices that desperately need to be corrected…
Well, like, “they,” always say, you won’t like what you’re, “eating,” if you see the factory floor it was cooked-up on. Coming to Wolf Street I know I’ll get the best view of the factory floor you are capable of, which is pretty darn accurate, and even rarer these days, an honest perspective.
Good One Wolf:
Went to work full time in the only supermarket in Naples, FL in late April 1961to support family who had always been and were still on ”commission” only.
White bread sandwich loaf — 24 inch loaf– was a frequent ”loss leader” for ten cents… $0.10 USD…
Couple of years later another supermarket came into that market, so that loss leader continued for years, and at least did the intended to bring most folks into our store…
Wolf
A brief explanation of how the CPI came to exist may be instructive to some.
Great articles, I donate when I can. Thanks for your work.
In the meantime, I can offer that the annual CPI in 1913 was 9.883, and in 2022 it was 292.655. So, officially 30x.
The index seems to have begun about 1913, when the Fed was created.
Average salary, 1913 skilled/semiskilled workers: 500-650 dollars/year, ranging from teachers to trades.
Average personal income in the U.S. in 2022 is $63,214, and the median income is $44,225. If average, about $50K. So, maybe 75 to 100x.
Obviously, a lot of general labor types are not represented by the average wages listed above but today’s typical wages are about 50 times the wages in 1913. There was also massive wage and price inflation that took place 1914-1920 until the ‘forgotten depression’ of 1921, not necessarily due to WWI which the States only entered in its last year or so.
It’s worth pondering that inflation is a global concern, as is global recession. Global recession is unfolding slowly, even if people are in denial today.
We’re just now beginning to see small impacts of Fed tightening from last summer, but it seems inflation isn’t under control.
In the euro area, year-on-year inflation as measured by the Harmonised Index of Consumer Prices (HICP) fell to 9.2% in December, from 10.1% in November. Energy inflation continued to fall, but inflation excluding food and energy kept increasing in December.
Next time someone accuses me of comparing apples and oranges tell them it’s legit. CPI does it all the time.
That’s precisely what CPI tries NOT to do.
Try? They’re obviously no students of Yoda.
Actually to me you have made a good case that the CPI track changes in consumer spending pattern as much as it track prise rises. ;)
Yes, they’re very much linked in a dynamic complex two-way relationship, where prices change buying patterns and where buying patterns change prices.
If I were emperor, I’d have an elite Metrology Squad constantly patrolling all bureaucracies, instantly executing any bureaucrat who even THINKS about changing a measurement method.
Did anyone else notice that Lael Brainard resigned and left the Fed?
She seemed at odds with Powell who insists on 2% inflation.
“Central bank’s No. 2 official has advocated for a marginally less aggressive approach to raising rates”
BS. Biden name Brainard director of the National Economic Council (NEC) to replace Brian Deese, who left. That’s a big job. And Brainard accepted it. She then resigned from the Fed to take that job. This was ALL OVER THE NEWS because this was a big thing because she was considered a dove, a counterweight to Powell and Bullard et al.
“This was ALL OVER THE NEWS because this was a big thing because she was considered a dove, a counterweight to Powell and Bullard et al.”
Which was my point exactly: “She seemed at odds with Powell who insists on 2% inflation.” So where is the B.S. in that?
“So where is the B.S. in that?”
This:
“Did anyone else notice that Lael Brainard resigned and left the Fed?”
Another week and the goalposts of the “market narrative” have shifted. Now, we’re to believe that the 2% inflation target is a relic with no value whatsoever. I’d love to see a timeline of these pathetic declarations; starting with “the FED can’t raise rates”
“Swirling around in this hullabaloo were suggestions that certainly the BLS is adjusting the weights to manipulate CPI down and further deceive Americans about inflation.”
This is what happens when politicians and unelected bureaucrats destroy the standard of living and lie to the people for decades – a deep-seated mistrust that casts doubt on everything, whether true or not.
Lately I am seeing more and more people arriving at a conclusion that the FED is not truly interested in bringing inflation down, that they covertly want higher inflation to inflate away all debts, both public and private.
Inflation is theft of the fruits of a man/woman’s labor. They are literally stealing your hard work to prop up the asset prices of the wealthy, and enable crooked politicians to keep plundering.
“Inflation is theft of the fruits of a man/woman’s labor. ”
And you wonder why the saviors of little people like Bernie, Warren, etc. do not want Fed to raise higher…..
Just an observation…not a political point.
I made a comment a few threads ago that a certain Toyota vehicle model has been increasing by roughly $4,000 per year over the course of the past 3 years, going from $35k to high $40ks. This means that every month a person waits to purchase a new vehicle, it’s costing them an additional $300 for the same thing. I know that the prices are set for each new model year, but if you break it down on a monthly basis, that’s what you get. This is a shockingly awful way to run an economy.
I bought some more U.S. TreasuryDirect ibonds today. They adjust the interest rate to the CPI every six months.
Great analysis. Love to see facts behind the figures.
I’m curious as to how bad the latency is in regards to real-world “shelter” price changes vs. how long it takes to peak and begin dropping in CPI.
Though I know from following various housing and rent data reports most prices peaked months ago, (though YoY comps are still positive). But, the shelter line in the CPI chart is hilariously slow. I’m wondering if the data from the housing spike and crash back in 2009 would be a decent indicator of when we can actually expect the CPI Shelter slice begin to drop.
Wait… don’t confuse “asking rents” with actual rents that all tenants actually pay.
The Zillow rent index, Zumper, Apartment list, etc. all publish “asking rents.” But very few tenants pay asking rents.
The CPI for rent of residence is based on housing units by address, and whoever is in these housing units (houses and apartments) answers the questions about how much in rent they pay. So this data tracks rents in the SAME set of housing units. It’s the best measure we have of actual rents being paid by all tenants over time.
The lag is only a few months because each housing unit gets asked every six months, rather than every month. And they rotate through. So when a new tenant moves into the same housing unit and pays a higher rent than the prior tenant, it will take a few months before those new tenants get the survey and respond to it. That’s where the lag is.
The spike in asking rents in 2022 never made it into the CPI rent measure because very few tenants actually paid those asking rents because the turnover isn’t that big. So actual rents won’t come down, even as asking rents are dropping from the spike. Tenants are still getting rent increases.
BLS 2022: Oops we made a colossal blunder on health care last year so we’ll mark down the CPI each month for 2023
BLS 2023 tba: Oops we made a colossal blunder on last year so we’ll mark down the CPI each month for 2024
…fill in the category
The Canadian CPI report today says inflation is falling but the bond market and almost everyone else didn’t believe the report. Yields on the 5 year government of Canada treasury bond spiked upwards after the CPI report.
Month-to-month number jumped. That’s why. Just like in the US. Meaning, inflation is now heating up again.
The health insurance CPI is confusing. If people don’t get sick at all and make no claims, then is that inflationary or deflationary using their retained earning to payouts methodology?
During COVID there were far fewer claims because of restrictions to access to medical care and general shopping for pharmaceuticals. Post-COVID there would have been a “boom” in medical treatment (I would guess) while premiums are not affected in either case.