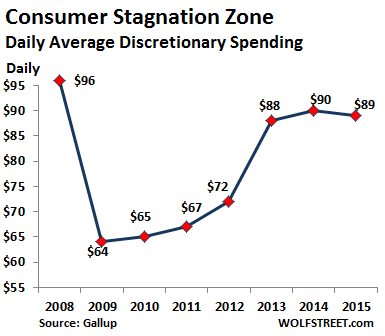
The stagnation zone
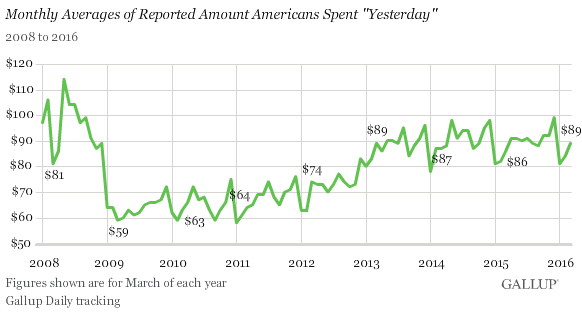
Our ever exuberant US consumers spent on average $89 a day in March on “discretionary” items, according to Gallup’s Daily Tracking survey. That was up five bucks from February, which is within the typical range of seasonal increases. It matched the previous high for a month of March since the Financial Crisis: March 2013. In March 2014 and 2015, consumers spent less: $87 and $86 respectively. Flat for the past four years!
But March is a peculiar month, with strong predictive qualities for the entire year. Gallup:
For each of the past six years, the spending average for March has been a rough bellwether for that year’s spending, coming within $3 of the annual average. The months of April, June and October have come within this same range of the yearly averages since 2010. This did not hold true in March 2008 and March 2009, however — years in which the recession and the financial crisis dealt their immediate blows.
And just how flat have the past years been?
This chart shows the monthly averages going back to 2008, when the survey began. The plunge and spike in 2008 was followed by the collapse as the Financial Crisis hit home. Then spending gradually recovered until 2013, when, at lower levels than 2008, it became range-bound — a spending pattern that Gallup calls euphemistically, “fairly consistent since then.” The stagnation zone:
The March results are based on phone surveys of 15,243 adults aged 18 and older in all 50 states and Washington, DC. These folks are asked, among many other things, how much they spent “yesterday.”
When these results are averaged out month after month over the years, going back to 2008, while ignoring the impact of inflation – and there has been a lot of inflation in housing, health care, vehicle prices, tuition, and other big items – we get this:
If it were adjusted for inflation, it would look worse. And based on the results of March 2016, if historical patterns hold, this year will likely add another link to the stagnation zone.
Many people have felt this way. They’re not making more, and they can’t spend any more on discretionary items because that’s all they’ve got. So rent goes up and health care goes up, and they shell out more money for tuition or the payment on their new car, but they have to make cuts elsewhere. Gas gets cheaper, so they can spend a little more on groceries or they might save up some to be able to pay the deductible and copay and go to the doctor. It just gets shifted around. Nip and tuck.
So why doesn’t the official “consumer spending” data match this stagnation over the past few years? Consumer spending in inflation-adjusted dollars, as tracked by the Bureau of Economic Analysis, has risen 12% from the pre-Financial Crisis peak in November 2007 through February 2016. It’s up 8% since March 2013, the peak month in the Gallup survey! Something has to give, no?
In part, these differences are rooted in how the beans are counted. Tracking the complex and vast economy of the US that never stands still in order to be counted is a devilishly difficult task and subject to big errors, revisions, and systematic inaccuracies. We get that. But there’s another factor – and that impacts why many consumers actually feel that the conditions in their own lives don’t match the published economic numbers.
And these consumers are right to feel that way.
Here’s the “secret.” Actually, it’s not a secret. But no one wants to mention it. The US population has grown from 301 million in 2007 to 322 million in 2015. That’s an increase of 7%. Now our slow-growth economic pie gets divided up over 21 million additional people! But they’re also spending some money; hence the increase in consumer spending.
Which is exactly why the unemployment problem has become so intractable: Since the bottom of the Financial Crisis in 2009, the US population has grown by 16 million people. But since then, only 14 million jobs have been added.
Slow economic growth is toxic in a country with significant population growth!
So when consumers are asked how much they spent “yesterday,” it’s a measure of per-capita spending, not total spending.
Over the eight years from the fourth quarter 2007, the pre-Financial Crisis peak, through the fourth quarter 2015, per-capita inflation-adjusted GDP has inched up a total of only 3.1%! The most minuscule understatement of inflation (whether by accident or not) spread over these eight years would turn per-capita economic “growth” negative! A very likely scenario.
And this explains what consumers say when asked about spending and other things that then don’t match the official national statistics: It’s very tough out there for individual consumers regardless of the aggregate numbers.
Enjoy reading WOLF STREET and want to support it? You can donate. I appreciate it immensely. Click on the mug to find out how:

![]()
Many people think the things they want ought to be free. Don’t get me wrong…I like a bargain once in a while as well as anyone, but I expect to work for what I want and I expect myself to contribute to the sum of human accomplishment.
What I don’t want is to be forced to buy stuff I do not want(lightbulbs for example) and I do not want the currency debased(it is stealing the livings of widows and orphans)(it is making a stretchy measuring tape).
So slow economic growth is toxic to Whom?
1)The princes and princesses here at the University took about 3 minutes to figure out they need to work hard: slow economic growth taught them reality.
2)The well-endowed (full of false promises) retirements of public servants will have a shock, but the drinking of that poison cup has yet to happen in most states, and I hesitate to mention it but vows made that are evil have no moral force; the pensions of teachers and others are not to be enforced at the cost of the enslavement of every citizen of each state(and the financial wizards get theirs every year for management).
3)The elderly retired people have indeed gotten it in the neck by the hidden tax of inflation…but at least unlike Japan and China they have some offspring who might care about them(offspring are resistance to the State as are parents).
4)The financial wizards do indeed resent having their free takings reduced by non-ZPG when they can no longer leverage their gettings by the numbers.
To have more jobs, encourage people who work for profit, let there be an accurate measure of value, and may we sovereign consumers have responsibility for our choices!
Great thought-provoker Wolf!
Agnes,
“Offspring as resistance to the state.”
I remember bumping into a curmudgeon old neighbour at the shops. He was wound up by something and announced “I have ten million dollars in the bank.”
Glancing at his shopping bag and seeing the usual out of date white bread and discounted milk, I corrected him “no sir, it’s got you.”
…
If you think offspring are resistance to the state you have already surrendered.
Roland
Our ever exuberant US consumers spent on average $89 a day in March……………..
US$89 a day?
Gee you must have some really rich consumers in the US to be able to spend that much a day, every day on discretionary items!!
That works out to some A$3600 a month………………
“US$89 a day?”
That’s about $32,000/year.
BLS reports that median U.S. hourly wage is $17.40/hour, or about $36,000/year, in May 2015, before taxes.
http://www.bls.gov/oes/current/oes_nat.htm
A survey like Gallup’s Daily Tracking, which claims that people spend more on “discretionary items” than they actually earn – much less after the costs of “housing, health care, vehicle prices, tuition, and other big items” – is not likely to have much validity, if any.
Lee and Walter:
Actually… Median household income in the US is $52,000 a year (2014). So paying some taxes and other non-discretionary things and then spending $32,000 for the rest sounds about right.
Plus, they’re going to borrow some too … credit card, home equity line of credit, etc. American consumers know how to spend money they don’t have.
BTW, Walter, spending $89 a day = 2,759 in March (31 days), or $32,500 a year (365 days).
Aaah, but is the median calculated from all income earners, including people that don’t file tax returns?!
Data compiled from tax returns omits all the people that don’t need to file.
So where does the median 52k come from, IRS data? Employer data? or what?
And the ‘spent yesterday’ thing, also could have a bias, such as, if the survey were always done on a Friday, or Sat or whatever. Is it always the same day of the week? I don’t spend randomly, do they pick the day after a statistical known large/small/average spending day to do the survey?
The median of $52,000 (2014) comes from the Census Bureau.
Your question about the survey bias is resolved when you check out the survey methodology, which you can get by going to the linked article. There is a link in it that takes you there.
Wolf,
It would be very interesting to see the median income by percentile in light of the greater national take by the top 10%.
These articles might not answer your question 100%, but they get pretty close. Check out the charts further down in the articles:
https://wolfstreet.com/2015/12/27/i-was-asked-whatever-happened-to-inflation-after-all-this-money-printing/
https://wolfstreet.com/2014/08/20/this-chart-is-a-true-picture-of-whats-dragging-down-the-american-economy/
Wolf,
Do you consider the mandatory insurances and the cost of housing, including property taxes, discretionary? How about food?
In my world, the only real discretionary money I have left after paying all the bills I have to pay to live.
Yes some people live beyond their means and many have campaign tastes on a cheep beer budget but that use to be acceptable with average incomes and now it isn’t. It use to be that a few people were in trouble for their spending habits and now it is most people.
To me discretionary is what is above what is absolutely mandatory and needed to survive in any given environment. We the People are being squeezed by those who can and they call it Free Markets.. which really means Free for them to turn the majority of us into paupers.
Hey guys, friends, readers….
All of you who’ve been quibbling over “89” and “discretionary”: I think you missed the crux of the article. The crux is that population growth in a slowly growing economy creates a situation where on a per-consumer basis (per-capita), it’s stagnation. Or worse.
If you didn’t get to that part and got hung up on “89” and “discretionary” in the first paragraph, I suggest you read the thing to its end.
:-]
“Median household income in the US is $52,000 a year (2014).”
The Gallup Daily Tracking survey unfortunately refers to individuals, not households.
“Plus, they’re going to borrow some too …”
Debt is not included in the definition of discretionary income. From Investopedia:
If housing is ‘discretionary’ what isn’t discretionary?
I always thought it meant stuff you could buy or not.
Thank you Wolf, I checked it out. Since they do this 350 days a year, excluding holidays, that’s a good sampling. Less than 5% of days missing.
See my comment to Walter (just below)
Some days I spend more than others. You can’t cherry pick the day when you spend the most and multiply by 30. Also the people who make 6 or 7 figures skew the average. It would be nice to see a breakdown based on income. I’ve had to get more aggressive shopping for deals, and I’ve cut out as much medical spending as possible due to high copays. Fortunately I work in trucking which by its nature can’t be cut to part time. My most expensive prescription has been disallowed by my company insurance so I have to pay cash in full for that. And the wheels turn.
Julian,
A consumer related question. I recently moved out of south Florida and got mover quotes from 5K to 13K for the same move. They were all over the place on pricing. What’s up with that?
I think they borrowed $89 a day then spent it.
Are car leases discretionary? Well, it’s off to bartender school.
March is a bad month to use as a sample because it is the first month when most people begin to get their tax refunds. Most people can’t file their returns until early February and wait at least 3 weeks for the electronic refund. My refund went out as fast as it came in, so my discretionary spending skyrocketed in that month. Afterwards nothing.
What refunds?? …….they all got sucked into that black hole, otherwise known as the ACA!
Read Gallup’s methods of gathering these stats. Sounds sketchy to me. They poll 40% landline and 60% cell. What are demographics of landline users (most people I know ditched theirs years ago)? Who in their right mind would answer a poll on their cell phone? Do the final people they end up with even understand what “discretionary” means?! I seriously doubt it.
However, since they use the same methods each time, the fact that spending is stagnate (as graphed) is the only thing that bears out as real. Ignore the $89 number and just look at the trend.
“Ignore the $89 number and just look at the trend.”
Exactly.
It is absurd to believe that the median household, with a median income of $52,000/year, has $32,000/year to spend on luxuries, not when 76% are living paycheck to paycheck.
It is easier to believe that half of U.S. households have no discretionary income at all, and that the survey refers to the average of those who actually have discretionary income.
“It is easier to believe that half of U.S. households have no discretionary income at all, and that the survey refers to the average of those who actually have discretionary income.”
When I visit the shops here in Netherlands lately, I’m easily outspent by hordes of people from Syria, Pakistan, Africa etc. who have a very good time spending my money on new clothes, nice food etc. These shoppers officially have no income, while according to the tax office I have an income that is many times more than in reality (they assume one makes 4% money on a savings account and tax based on that income, irrespective of the real rate which is close to zero).
All these statistics are just BLS***, don’t look under the hood. Looking at longer term trends can be instructive if you consider all the underlying changes in society and in BLS accounting over the same time, but do we really know what is going on behind the screen?
Averages are hugely misleading as they can be strongly skewed. That’s why a median number is much more useful. Bill Gates spends $2000/day and I spend $20. Our average is quite high, but nowhere near my reality.
Hi Tim. Could not reply to you directly. Here is the Gallup Methodology : http://www.gallup.com/185462/gallup-daily-work.aspx?utm_source=METHODOLOGY&utm_medium=topic&utm_campaign=tiles
RE: population growth.
There are surveys that show that most of the ‘jobs’ are going to immigrants so if you are a native born American there has been little if any job growth for you!
I too question the $89/day on DISCRETIONARY goods and services. My house is paid for so my monthly budget is about half fixed expenses ( property tax, HOA, utilities, insurance etc and about half discretionary but I am also fortunate enough to be retired at 63 so I’m not ‘typical’.
The $89/per day is based on reported spending so it is probably biased to the high side as people tend to exaggerate both their incomes and spending though it could also reflect the wealth disparity in the US. A NFL or MLB player may blow through $5000 per day in ‘discretionary’ spending and god only knows what the Larry Ellison’s and other billionaires spend on the accoutrements of their lifestyles.
Surveys have been proven to mislead people. I feel now like second class citizen because my family income is about triple nation average and we spend about the same money monthly as mentioned in this article. The left over is saved and some of that invested.
We have no debt and take couple vacations every year.
The truth can’t be nowhere near that $89 spending per day, unless money is borrowed, which again in return is why blogs like this exist.
Anyway, I would be more happy to see how much average consumers save per day (probably zero, but hey Wolf this could be next interesting topic).
Cheers.
The savings rate in the US is currently 5.4%. Which is pretty high by recent US standards. It seems people aren’t spending all of the money they save from lower gasoline prices.
Paying down debt also counts as saving, according to one economist I’ve read. (since all income is either spent or saved, ie consumption or savings, paying down debt isn’t comsumption) So the savings rate doesn’t translate directly into cash balances that are spendable. Some of it is debt deflation.
exactly. In my country the savings rate has always been relatively high, and over the last years it went up, ‘people are saving more!’, while the total amount of money in savings accounts and other deposits declined and consumer spending is more or less stagnant.
One important reason for the ‘increased saving’ is that more wealthy people are paying down their mortgages. Due to the Dutch mortgage tax deduction (the tax office pays at least 40-50% of the mortgage cost) most home buyers took out the maximum mortgage even if they had the money to pay cash, for a risk free 1-2% extra return on capital. Paying down a mortgage was very unattractive but the recent ZIRP/NIRP policies are changing that.
We now have some mortgages with negative rates in the Netherlands (although not available to the average home buyer, AFAIK) so who knows what is going to happen next …
When humanity gets to the “higher” intellect they will realize they can work 9 months have 3 months vacation and end up with a happier and healthier being.
And with that everything will be made better built faster and will last longer!
Unfortunately untill you have greed that’s not possible.