Compared to May 2019, sales were down the most in the West (-32%) and Northeast (-31%), less so in the South (-15%) and Midwest (-17%).
By Wolf Richter for WOLF STREET.
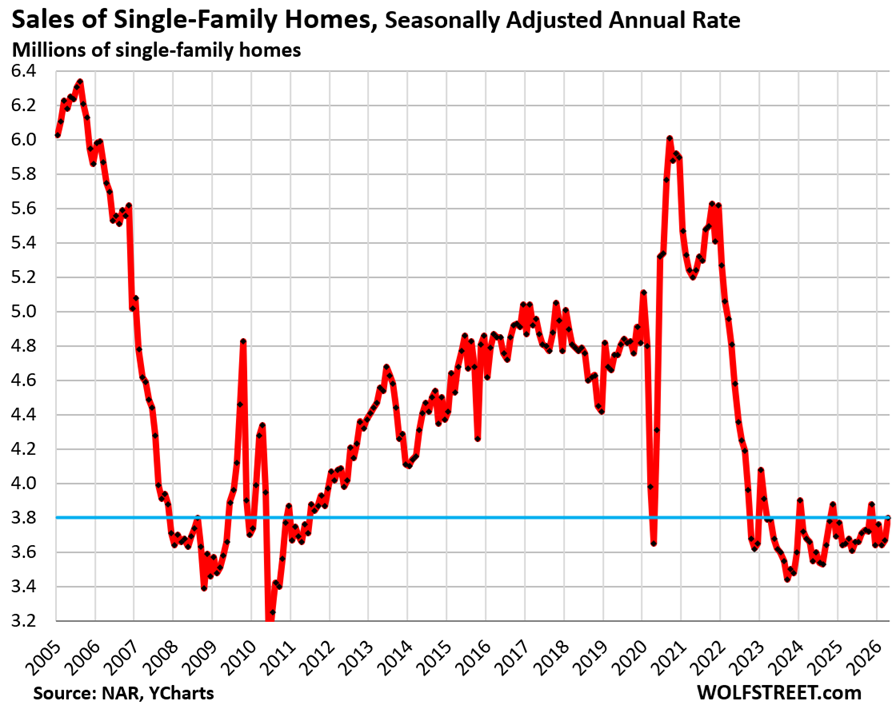
Sales of existing single-family homes that closed in May rose by 3.5% from April, seasonally adjusted, to an annual rate of 3.80 million sales, remaining in the same rock-bottom range that had commenced in the second half of 2022, according to data by the National Association of Realtors today.
Compared to May in prior years (historical data from YCharts):
- 2025: +3.3% (year-over-year)
- 2024: +3.8%
- 2023: +0.3%
- 2022: -21.0%
- 2021: -26.9%
- 2019: -20.0%
- 2015: -18.8%
- 2009: +6.1% (Housing Bust)
- 1996: -2.6%
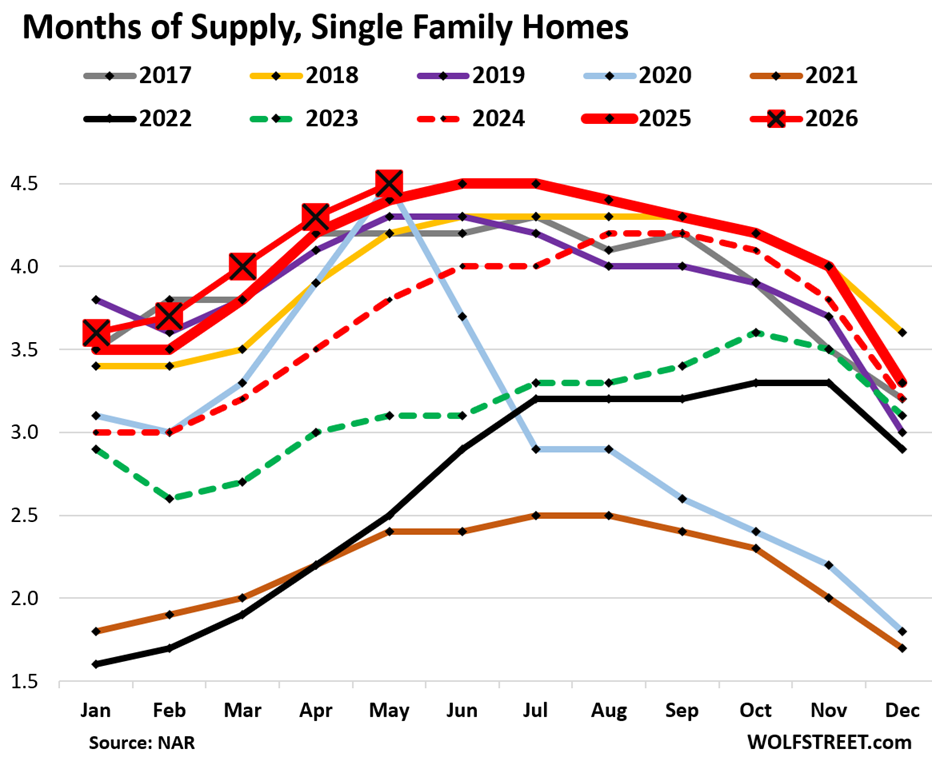
Supply of single-family homes rose to 4.5 months in May (red line with big red squares in the chart below), same as in May 2020, and both were the highest supply for May since 2016.
Supply is a function of inventory and sales (demand) – how much inventory there is in relationship to sales. Sales have hobbled along rock-bottom, while inventories have been rising (historical data from YCharts).
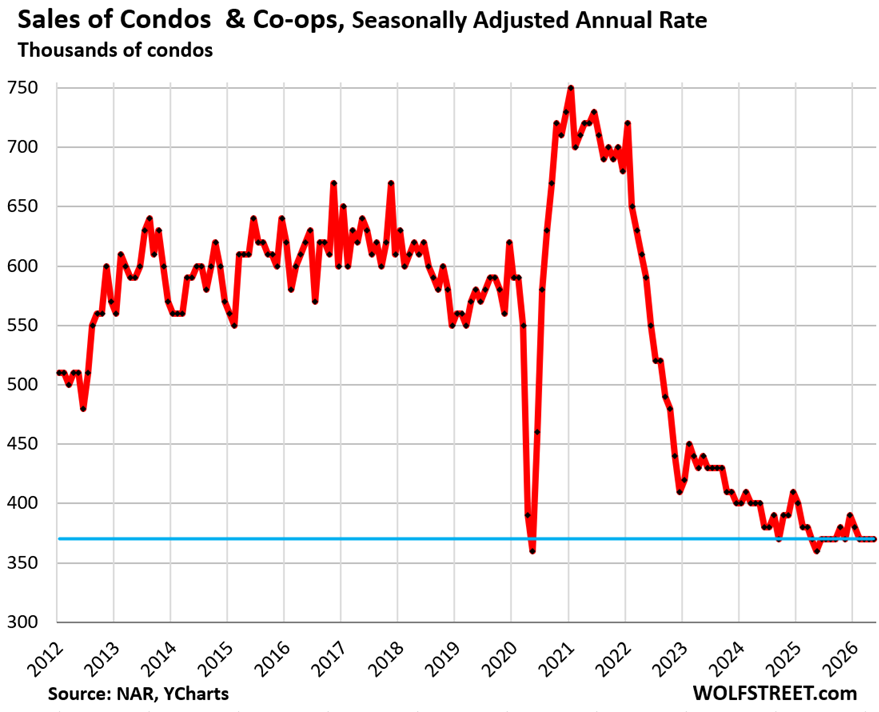
Sales of condos and co-ops remained at a seasonally adjusted annual rate of 370,000 for the fourth month in a row, near the very bottom of the data, which go back only to late 2011.
Not seasonally adjusted, 35,000 condos were sold in May, and on this basis, sales have been increasing from the January low, but seasonal adjustments flattened them out. Year-over-year, not seasonally adjusted, sales were unchanged.
The seasonally adjusted annual rate compared to May in prior years:
- 2025: +2.8% (year-over-year)
- 2021: -48.6%
- 2019: -36.2%
- 2012: -27.5% (first May in the data series)

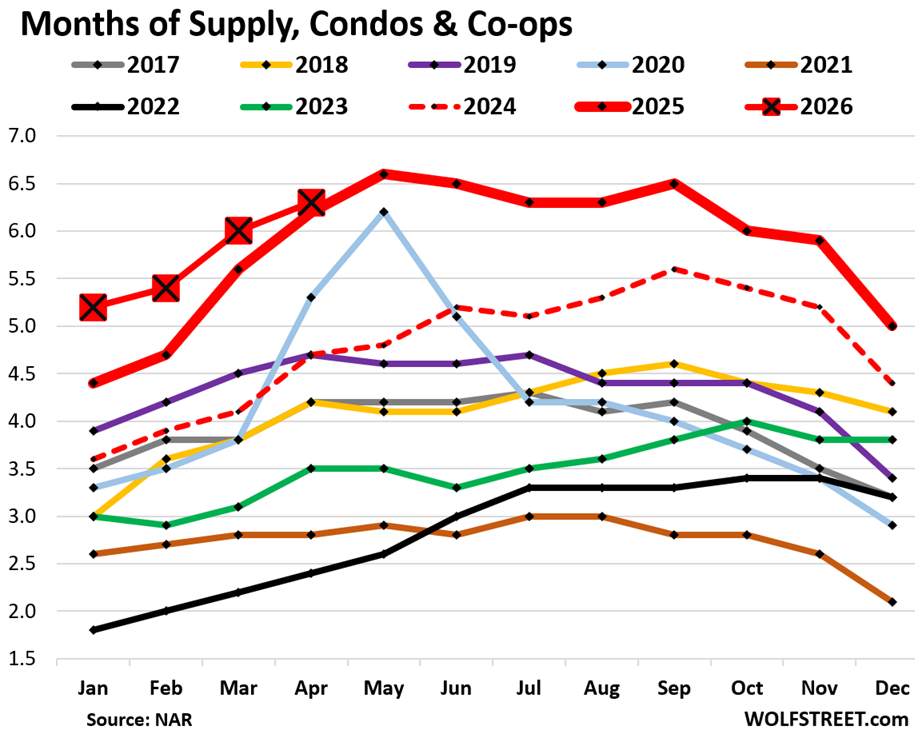
Supply of condos: Condo supply in April was revised up to 6.3 months, the highest for any April since April 2012, the first April in the data series (red line with big red squares in the chart below).
The National Association of Realtors has had an issue with its condo supply data this year. The originally reported figure has been an outlier-low supply figure, but then a month later, it gets massively revised higher by close to 2 months. This has been happening every month this year.
NAR had originally reported supply for April as 4.5 months, which was a total outlier in the figures, and I didn’t include it in my chart because I didn’t want to look like a goofball. Today, as expected, NAR revised April condo supply up to 6.3 months, nearly 2 months more than originally reported. So today, April was included in the chart. For May, NAR reported supply of 4.6 months, which is obviously way too low. A month from now, it’ll revise the figure to something close to 6.4 months’ supply, and the revised figure will be included in the chart.
National median price v. local prices.
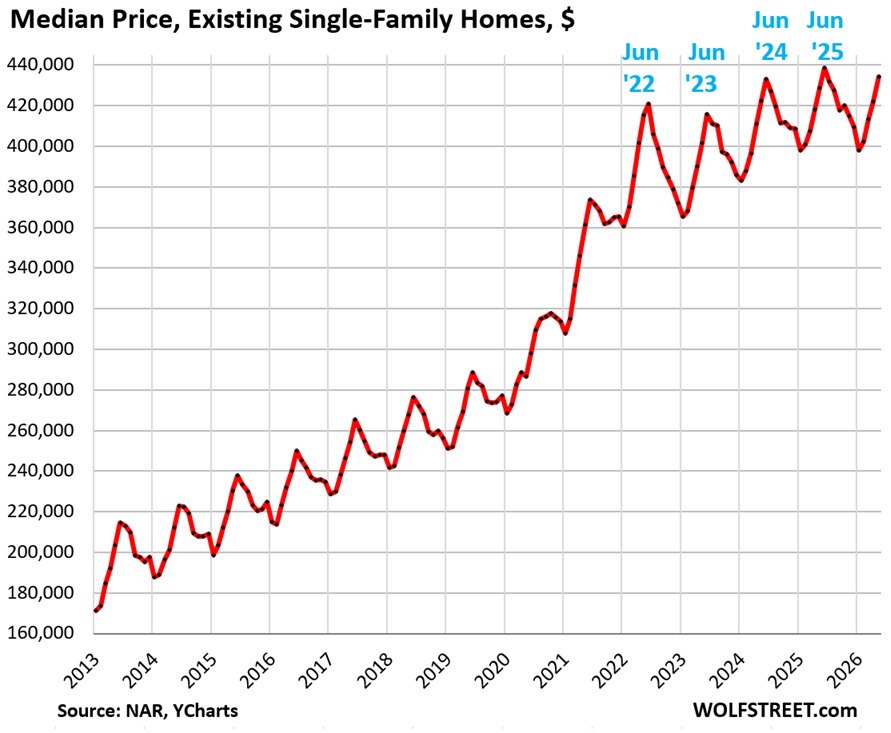
For single-family homes, the national median price inched up year-over-year by 1.3% in May, not seasonally adjusted.
The median price of single-family homes had exploded by 41% from June 2020 through June 2022, from already high prices. Those now too-high prices are the fundamental economic problem dogging the housing market. Higher home prices also trigger higher property taxes and higher homeowner’s insurance premiums (insurance companies have to figure replacement costs), which are triggering the “affordability issues” that have kept home sales in the freezer.
But mortgage rates, compared to the times before the Fed’s QE, before 2009, are normal to low. See chart below. They were just distorted by the Fed’s QE in the years before 2022.
From a macro-economic perspective, the national median price is an interesting and valuable data point.
But for people buying or selling a home, the national median price is irrelevant. What matters to buyers and sellers are prices in their local markets, and price dynamics in those local markets vary dramatically.
Single-family home prices have dropped by 10% to 26% in 15 bigger markets, including:
- Austin, TX: -26%
- Oakland, CA: -25%
- New Orleans, LA: -20%
- Sarasota County, FL: -17%
In some other bigger cities, prices of single-family homes have continued to rise year-over-year to new highs, notably:
- New York City: +5.1%
- Chicago: +3.9%
- Milwaukee: +3.7%.
The ups in some markets and the downs in other markets have been nearly balancing each other out on a national scale, to where the national median price has been inching higher at a rate between 0% year-over-year (January 2026) and 1.5% year-over-year (March 2026).
In May, the national median price of single-family homes rose 1.3% year-over-year to $434,300.
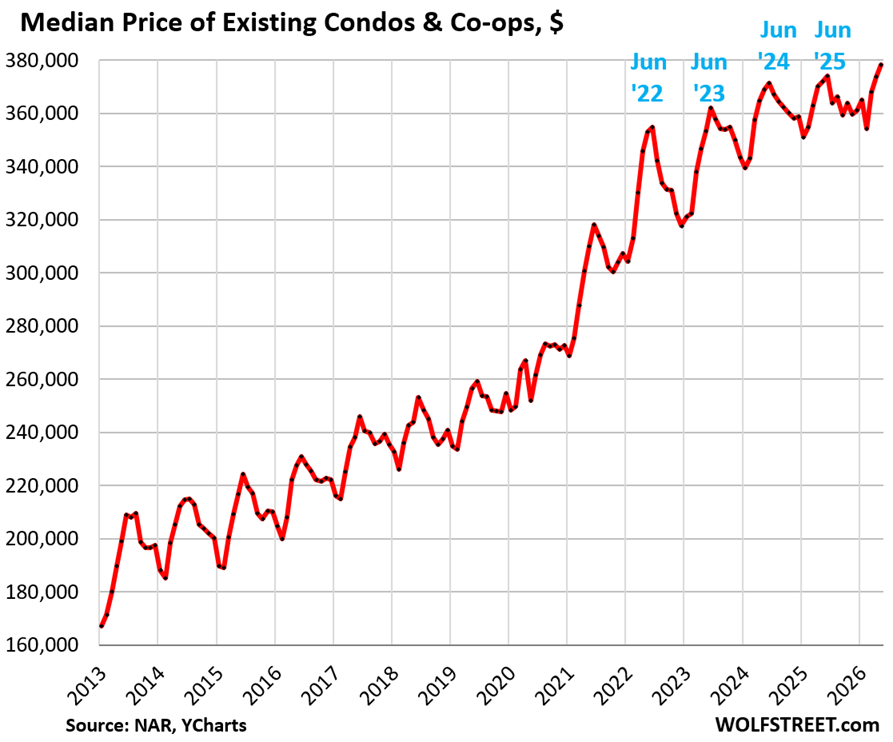
The national median price of condos and co-ops rose year-over-year by 1.7% in May. The year-over-year readings have ranged in recent months from -0.8% (September) to +4.0% (January).
On a local basis, condo prices have plunged by 15% to 33% in 24 markets from their highs, with several markets dropping below their highs in 2006. From peak:
- Cape Coral, FL: -33%
- Oakland, CA: -31%
- Petersburg, Fl: -28%
- Austin, TX: -27%
- Fort Myers, FL: -26%
- Sarasota County, FL: -24%
- Tampa, FL: -20%
- Garland, TX: -19%.
Sales by region of existing homes of all types.
On a month-to-month basis, sales of existing homes (single-family, condos, and co-ops combined) were unchanged in the West and rose in the South, Midwest, and Northeast, seasonally adjusted.
Compared to the same month in 2019, sales were down the most in the West (-32%) and in the Northeast (31%). In the South they were down by 15%, in the Midwest by 17%. A map of the four regions is below the article at the top of the comments.
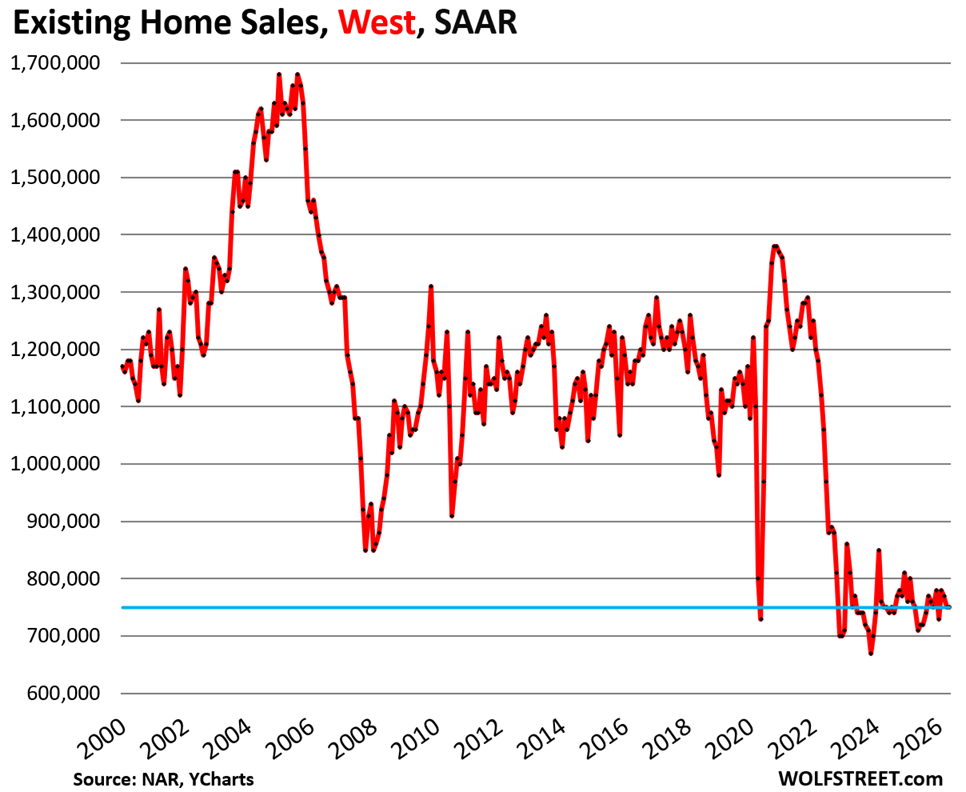
In the West, the seasonally adjusted annual rate of sales was unchanged in May from April, at 750,000 homes.
Compared to May in prior years:
- 2025: +5.6% (year-over-year)
- 2024: 0%
- 2023: -2.6%
- 2022: -29.2%
- 2019: -32.4%
- 2018: -35.9%
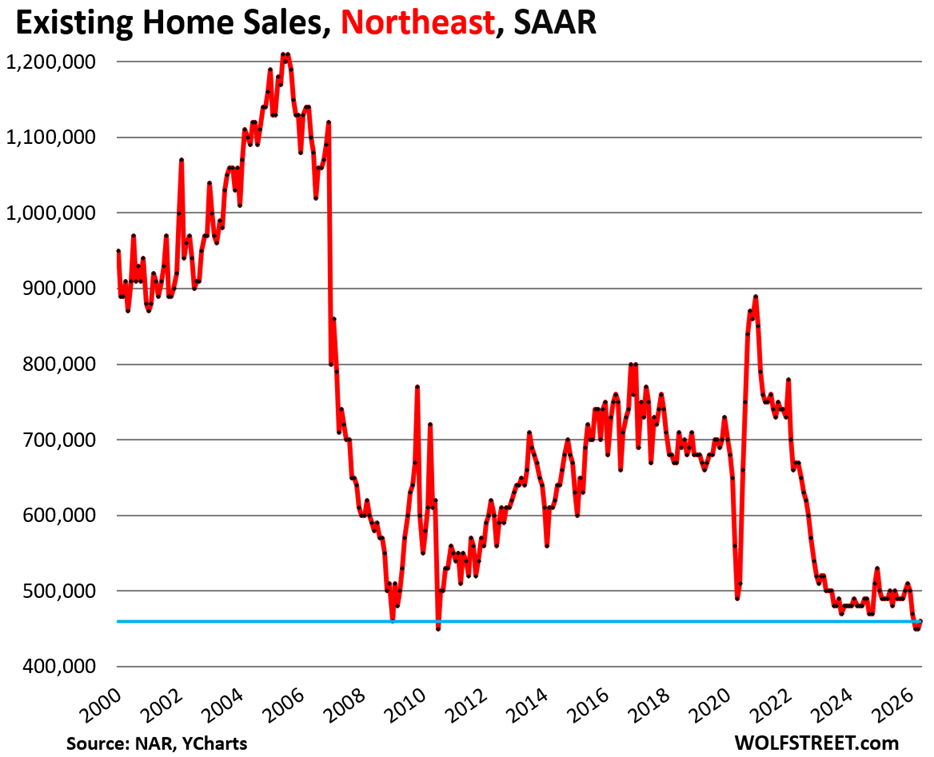
In the Northeast, the seasonally adjusted annual rate of sales ticked up to 460,000 in May, just a hair above the record low level in NAR’s data, which goes back to 1999.
Compared to May in prior years:
- 2025: -8.0% (year-over-year)
- 2024: -4.2%
- 2023: -8.0%
- 2022: -31.3%
- 2019: -31.3%
- 2018: -31.3%
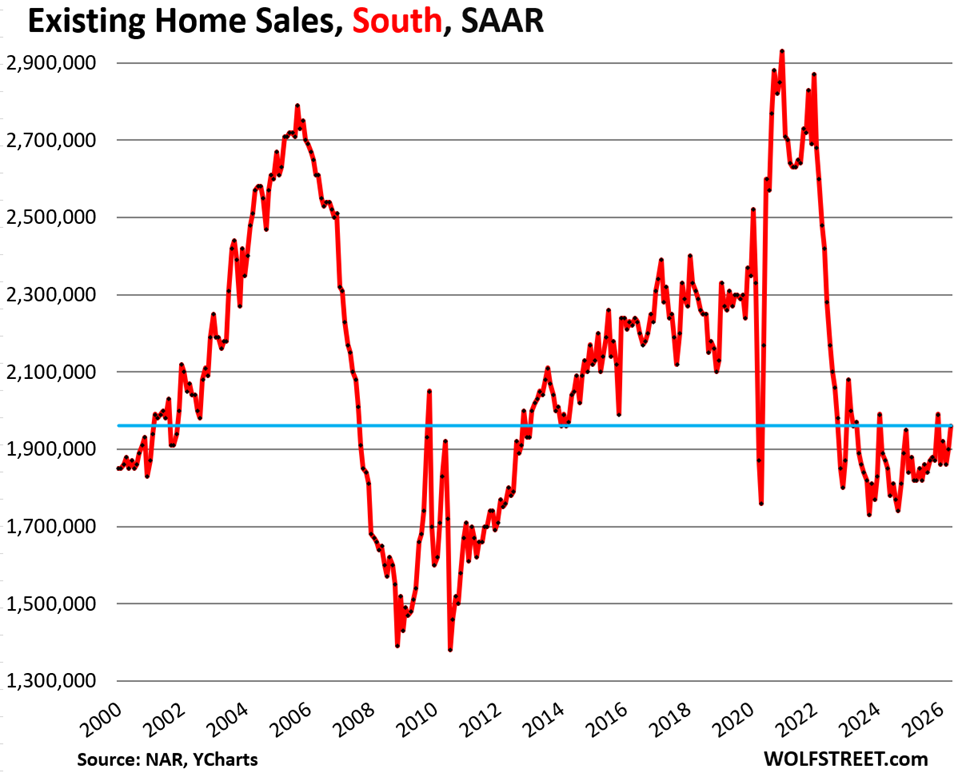
In the South, the seasonally adjusted annual rate of sales rose by 3.2% in May from April, to 1.96 million homes.
Compared to May in prior years:
- 2025: +5.9% (year-over-year)
- 2024: +5.9%
- 2023: -0.5%
- 2022: -19.0%
- 2019: -15.2%
- 2018: -14.4%
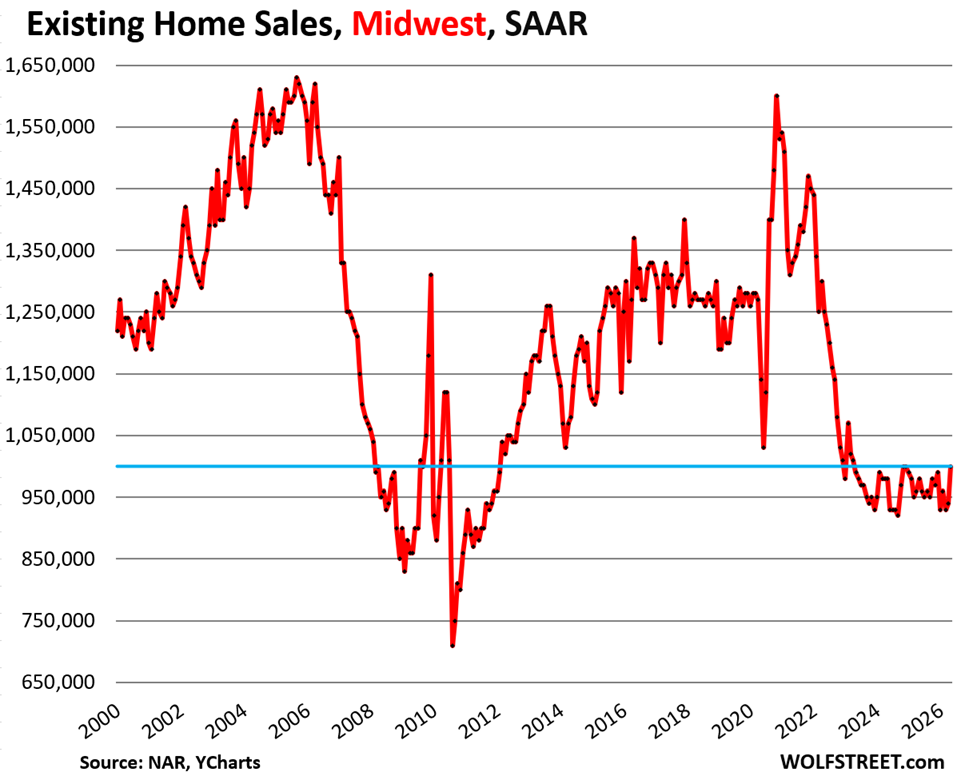
In the Midwest, the seasonally adjusted annual rate of sales rose by 6.4% in May from April, to 1,000,000 homes.
Compared to May in prior years:
- 2025: +2.0% (year-over-year)
- 2024: +2.0%
- 2023: +1.0%
- 2022: -20.0%
- 2019: -16.7%
- 2018: -21.3%
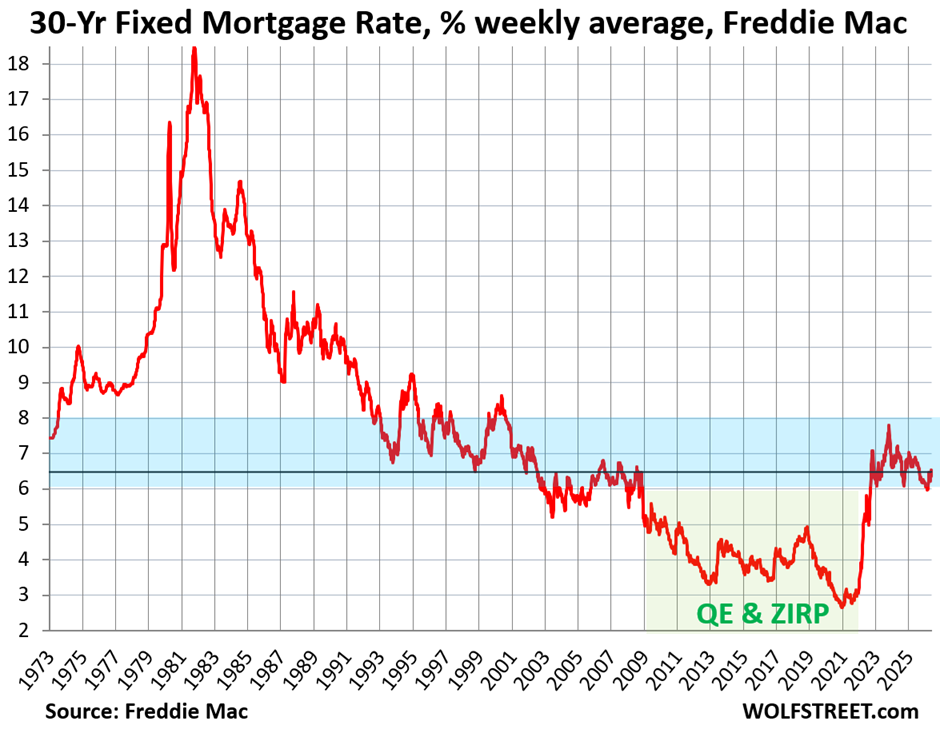
But mortgage rates are not high. The average 30-year fixed mortgage rate ticked up to 6.48% as of June 4, according to Freddie Mac’s weekly measure.
Mortgage rates track the 10-year Treasury yield, but are higher, and the spread between them varies. The 10-year Treasury yield is at 4.53% at the moment [my weekend commentary on the Treasury market].
Inflation in May will likely clock in at over 4.0%, and these mortgage rates are only 2.5 percentage points above the rate of inflation. Mortgage rates are not high; inflation is high.
Mortgage rates of 6.5% are at the lower end of the range that prevailed in the decades before the Fed’s QE which started in 2009. Mega-QE during the pandemic, which triggered the below-3% mortgage rates and the negative “real” mortgage rates (adjusted for inflation), was the main culprit in the explosion of home prices from mid-2020 to mid-2022, and thereby the main culprit of the “affordability” crisis since then. Mega-QE also helped trigger the worst inflation in 40 years.
In case you missed it: As Home Sellers Grapple with Reality, Listing Prices Fall by Most in at Least a Decade
Enjoy reading WOLF STREET and want to support it? You can donate. I appreciate it immensely. Click on the mug to find out how:

![]()
Here is a map of the four Census regions of the US:
Decade plus high of supply.
Sales at near record lows.
Interest rates creeping up.
Affordability non existent.
The actual population shrinking.
There is a simple yet elegant solution to this if government would get out of the way “making things fair” and also stop the devaluation of the dollar.
Great news for the Americans who are being hiring instead of the H1bs and illegals, such as my son.
Buy now at lower prices and higher interest rates
Later, when the Fed over re-inflates later ( they always do) with lower interest rates, then re-mortgage the principle at much lower rates.
Wish I knew this secret when I was young. My dad didn’t tell me. In the 1980’s, I thought the road to financial success was lots of degrees in economically important work. Oh well, at least my children know now.
Monetary illusion.
Real wages are falling now. Latest data from BLS. Inflation is destroying workers purchasing power.
When the house mortgage payments 29 years after purchase are paid in dollars that are inflated by 100%- or 300%, that really does reduce the financial burden. That’s not an illusion.
Buying a house on a fixed rate mortgage, and suffering through the recessions is one of the best financial decisions anyone could make.
Wish my dad told me that.
Wolf, I’m recalling the analysis you did a while back about the percentage of mortgages below 5%, below 4%, etc. that were still outstanding.
If a majority of these low-rate, pre-2022 mortgages are still being held, that would explain the lack of supply in the market. Nobody wants to move and give up their low rate.
On the other hand, if these are being whittled down to a small % of the housing market, some other explanation would be necessary.
Here it is:
https://wolfstreet.com/2026/03/27/update-on-the-lock-in-effect-in-the-housing-market-below-3-4-mortgages-fade-very-slowly/
Looks to me like 50% of potential inventory is tied up in sub-4% mortgages. Perhaps another 20% is in the 4-5% range – just guessing.
I’ve decided that this factor alone is sufficient to explain the near-halving of home sales volumes.
Well, based on Wolf’s data, I’ve decided that there’s plenty of inventory.
Dude! Did you read the title? Supply at 10 year high! I mean sure, transactions are lacking because “the supply” is priced too high.
“If a majority of these low-rate, pre-2022 mortgages are still being held, that would explain the lack of supply in the market. ”
Read the article please. There is no lack of inventory.
Low volumes at extreme high prices indicate a lack of inventory. See Wolf’s earlier analysis of too-high listing prices, compared to the prices that will actually clear a sale.
It seems much of the for-sale inventory is priced at stink bid “buy me out” levels by sellers who are able to wait months or years fishing for a desperate buyer. Some of these are accidental landlords, some are elderly people or estates biding their time, and others are willing to move for the right price.
If more of the homes currently financed under 5% would come onto the market, you’d have sellers with an actual motivation to sell and price discovery would follow. In the status quo there is no real price discovery, only a bunch of highball offers.
As it is, people are reluctant to exit mortgages with rates below the rate of inflation, and way below what is likely in the future. It does not make financial sense to ever exit such properties because the leverage against inflation is just too good. Even estates are renting houses out rather than sell them, because a low mortgage makes that so profitable.
You can have my 3.25% mortgage when you pry it out of my cold, dead hands. I suspect a lot of pre-2022 homeowners think this way.
Plus, where would we go? We’d just have to overpay to someone else to have our next place to live.
What do you think about the graph “Months of Supply, Single Family Homes” in the article above?
It means there’s lots of people out there who don’t mind if it takes two or three years to sell that house, or if they never sell that house. In any case, they refuse to cut the price because they see it as a waiting game. Prices always go up, they believe.
Both the bubble and Homeowners flipping us the bird! The bubble ain’t bursting and the owners’ are not reducing prices.
So according to real estate lore, over 6 months supply is a buyers market and under 4 months is a sellers market. 4 to 6 is a balanced market. Guess it is more complicated than that though.
“So according to real estate lore, over 6 months supply is a buyers market and under 4 months is a sellers market. 4 to 6 is a balanced market. ”
This was true long back but not true in this age with technological advancements where homes can be closed faster.
That was the case 15-20 years ago when listings were printed on paper and took weeks to get in front of people, and when sales and mortgage documents were mailed USPS around the country, etc. The administrative delays from the day a brokerage signed the listing agreement to when the sale closed and the listing was pulled were very long, lots of wasted time, which is all part of the 4-6 months. Now, with so much automated and instant, 6 months indicates a massive problem.
While the velocity of bringing house to the market has improved over the past 20 years – the acceleration is over and velocity on its own cannot have any lasting effect on how many months of inventory is a lot and how many is little. In the future, AI Agents can theoretically shave off a fraction of time here and there, but the tech-driven one-time pull forward of the real estate on offer has already settled years ago. It’s back to regular 3Vs: Volume, Velocity, and Variety.
I just tried to find the tweet that I learned this from, but couldn’t: There is only a single analysis I’ve seen that has backed up this universal adage. Like surely if it’s so commonly parroted, there has to be an obvious, statistical basis for it, right?
The only data I’ve seen that supports it was a scatter plot of “months supply” vs “returns on equity” where the trendline dipped negative when years that saw market supply above 6 (I think it was constrained to “peak selling season”). But it was very sparse data for the negative return/high supply years.
Obviously 5lb bag of salt because I’m a yoohoo on the internet, but it has frustrated me that something so universal can be so arcane.
I also wonder if there’s a notion to “list in Spring, sell by Fall” being the preference of most households and that corresponding to roughly a 6 month window. That seems more in line with the level of regression analysis most realtors are equipped to do. :)
So maybe without QE during the financial meltdown, housing prices should have fallen more with higher real mortgage rates. And maybe RE prices wouldn’t have reached such heights as they did in 2020-2022. The core inflation over the last 3 years is due to dumb fiscal policy not QE monetary policy. QE created higher asset price inflation (RE and Stocks). US Govt. Covid checks and other fiscal policy (turned fraud) during covid caused core inflation to spike. Asset price deflation is coming. Be patient but be careful what you wish for. Deflation can hurt a lot more than inflation. However, it create great buying opportunities. Keep the powder dry.
Do real estate agents have any sort of influence on existing home pricing decisions made by home owners who are looking to sell?
I would imagine that with the market in deep freeze, and builders managing to increase their own sales volume, the agents would have an incentive to try and lower expectations (maybe not for the owners who bought at the damn peak, but everyone else).
I live in southern Europe and our home affordability situation is different in many ways (usable housing stock is low and transactions seem to be at an all-time high) but at least the big pandemic-era QE and low-mortgage lock-in effect seem to be a common factor, so I’m trying to understand as much as I can about the US and other markets as well.
Agents want listings. How to get listings? Tell the seller that they can get a 2022 price for their house. Doesn’t matter if it’s a lie, a listing is a listing, and there’s a chance that the listing could result in a sale and a commission check for the agent.
That’s all there is to it. It’s realtor greed that is preventing sellers from coming to terms with reality.
I agree. I have sent emails to listing agents accusing them of the same.
RE will be replaced by AI in 5-10 years, so maybe this problem will end.
You just haven’t got a clue haven’t you!
I agree that one of the techniques that listing agents use is false encouragement to sellers about the prospects of selling their houses at high prices. You are overestimating the ability of the average person to critique bad ideas.
Let’s not forget the sellers’ greed.
List like it’s 2022!
So they are going for more listings to maximize the chances for sales to go through, got it. Thank you, everyone. (sounds like it won’t help them either in the long term, but humans be humans.,)
“ Supply of Existing Single-Family Homes at 10-Year High”
A ten year high in supply should likely mean a ten (or more) year LOW in prices, but no – we live in Bizarro World where up is down, insanity is the norm, and if you’re not a multimillionaire, you’re a nobody.
Ten year high. What a travesty, as far as prices are concerned.
Yeah Econ 101 supply and demand graphs are useless in this environment.
Some movement is better than none but wow is it sticky.
After the financial crisis ended, the Fed kept the printing presses going 24/7 with zero or near zero interest rates for nearly ten years. This so called “new monetary paradigm” was not surprisingly doomed to fail. Thanks to Greenspan and his successors. The toxic program just needed a catalyst, in this case Covid, (and an irresponsibly spendthrift legislature) to blow the lid off of the inflation sarcophagus. All else: unattainable selling prices, hesitancy to payoff low interest rate loans and high rents, inter alia, have naturally followed.
In your June 8 post, you show a chart of US Median List Price decreasing YoY since 2022. Yet in this post, you show the price increasing YoY. Can you please clarify?
You do need to read the articles. Would save me a lot of time, and would give you a lot more detailed info. Win-win.
June 8 article showed “listing prices” of homes listed for sale in May, and it includes a fatiguingly long explanation what those “listing prices” represent and what they mean.
Today’s article shows the median price of “closed sales” — sales that closed in May. Nothing to do with listings.
Real Estate is in a recession heading for a depression.
Like in 2006-2007? Doubt it.
The Fed really doesn’t want the foreclosures. The Fed will prevent that.
Imagine what 2% interest rates will do to buyers.
Trump is already considering programs that will make houses more affordable to buyers while preserving prices, because he knows the Fed hates him and won’t life a finger to accomplish affordability w/o lowering prices.
BTW – did you know that recent poll showed that ICE is more popular than the DNC ? So, Trump definitely knows how to put together a popular program.
There is no chance at all we’ll see 2% mortgages while both 10 year treasuries + headline inflation are cruising past 4%.
The only way such a dream materializes is if USA goes full socialist, and the government starts directly funding mortgages at such artificially low rates.
Wow, preserve high prices and keep them affordable, lol.
When wages go up, which will happen in the next few years because of fewer H1bs and illegals taking our jobs, and interest rates going down ( which will happen because of semi-socialist policies of the Fed), yep, prices won’t going down much, but those prices will be much more affordable.
I also predict that the U.S. will subsidize mortgages by reducing mortgage payments for more children.
America is changing alot ( and so is Europe – did you see yesterday that “immigrant houses” are being torched in Belfast ?).
In 20-40 years, America will be deporting people merely for being Islamic (we will change our federal constitutional law in order to win the civilizational struggle against Islam), all of the illegals will be gone, our developing technology (especially in quantum computers and fusion energy) will rule the world.
I live in Dallas, and I see that what is happening here is coming to the rest of the U.S. A civilizational struggle against Islam and all foreign enemies is ahead of us, like Europe had from the 1330’s to around 1600, and we will change our laws and economic policy in drastic ways to win.
And don’t forget how the coming reissuance of the U.S. currency by 2035 will change things.
I feel like I just lost a lot of IQ points reading the MS post.
Don’t worry about, I have brains to spare.
I bought my first large house in 2007 in Texas, even though I knew prices were going down, because I guessed correctly that house wouldn’t slump more than 5%, and I was correct.
So, I benefited from the strong TX economy and the low interest rates from the next few years. The low interest rates are from the Feds semi-socialist policies.
And if you think the Fed has abandoned semi-socialist policies just because they are holding on to relatively high interests rates for now, I promise you are wrong.
We will have very low interest rates sometime in the next 2-4 years, to improve employment levels. It’s a guarantee, regardless of how high inflation goes.
2 things can be true at the same time!
Make houses more affordable while preserving high prices? Sure, they could send checks to everyone who buys a home. Maybe they could put Trump’s picture on the checks.
To Wolfman and his Wonderful Readers: Exit to Wolfstreet’s main page and read the titles of the
three most current article Wolf has written – they SPELL TROUBLE for the housing market – big time. Maybe even the perfect storm in housing. Do read the articles (if you haven’t) especially if you comment so Wolf doesn’t say ‘read the
%#£€*’. The signs are there! “I see signs!’
The writing is on the wall!
I think most of the commentators have the analysis wrong. Sales of existing homes are one of the lowest levels ever, however new homes are selling well- and relative to the prices of existing home they are a good deal.That’s why Berkshire bought a home builder- there is a built in structural advantage which is likely to linger for years and maybe a decade.
New homes are sold by builders who are offering big incentives on prices, financing and upgrades to move their inventory. Existing home sellers or realtors don’t have that clout and only care about getting every penny out of the sale. Most existing homes need a lot of work too. Berkshire buys underperformers with great management.
If you talk to the suppliers, real building suppliers….not Home Depot or Ronas, and keep in mind big builders actually have their own internal supply networks and specialty trucking to keep working, those suppliers will tell you the home building and reno industry is not doing well. It;s okay in some markets, but totally stagnant in others. Cheaper to sit on property than vacant finished homes. When I worked as a carpenter going through previous downturns good employers will often keep building to keep their people working, otherwise they lose good employees. They are happy to break even. My relatives still working construction remain busy, booked up for well over a year, but they are doing specialty renos and new builds for wealthy and retired with stable income. Starter homes? not a chance.
Yep, in north Texas, homebuilders are discounting 10-18% below existing homes. Their margins are 30% w/o discounts, and the builders have decided to keep their doors open even under lower margins, than just go bankrupt.
Would be interested to know how much TX and FL are driving the increase in national supply, given their large price declines.
If those two markets are responsible for the majority of supply, prices in other markets could hold steady or increase even with national supply increasing.
The unwinding of the housing market is/will be like watching paint dry. We could have another decade of slowly falling home prices ahead of us.
When it’s all over, prices will likely be down 40% from the 2022/2023 peak.
We already are 3 years into slow down. May be few more years.
It’s all a game of psychology.
In my hood, people are buying homes for 1.4 mill USD to rent out for $5k/month.
Once, general population understand that home prices have no where to go but down because of many reasons, you’d see exodus to exit.
In a fair world with libertarian economic politics, that prediction would be true.
This world isn’t run by caucasian engineers. It’s run by political appointees who can’t do 5th grade math and they will inflate like hell starting in 2-4 years.
This past Sunday, I went for a 15-mile bicycle ride around central Tucson. While I was pedaling merrily along, I counted “for sale” signs.
During this 15-mile ride, I counted 30 signs. That is a new high.
I haven’t seen this kind of “for sale” sign proliferation since Housing Bubble 1.0 started bursting during Q3 2005.
until the stock market crashes, if it ever does, there is limited imputus for people holding homes to sell. If the market crashes dynamics change and they gotta cut bait on the houses. Imho.
Don’t sell.
Leave it to your kids.
They hate the basement.