
Prices for Germany, France, Italy, Spain, Netherlands, Poland, Belgium, Sweden, Ireland, Austria, Norway, Denmark, Romania, Czechia, Finland, Portugal, Slovakia, Hungary, Bulgaria.
By Wolf Richter for WOLF STREET.
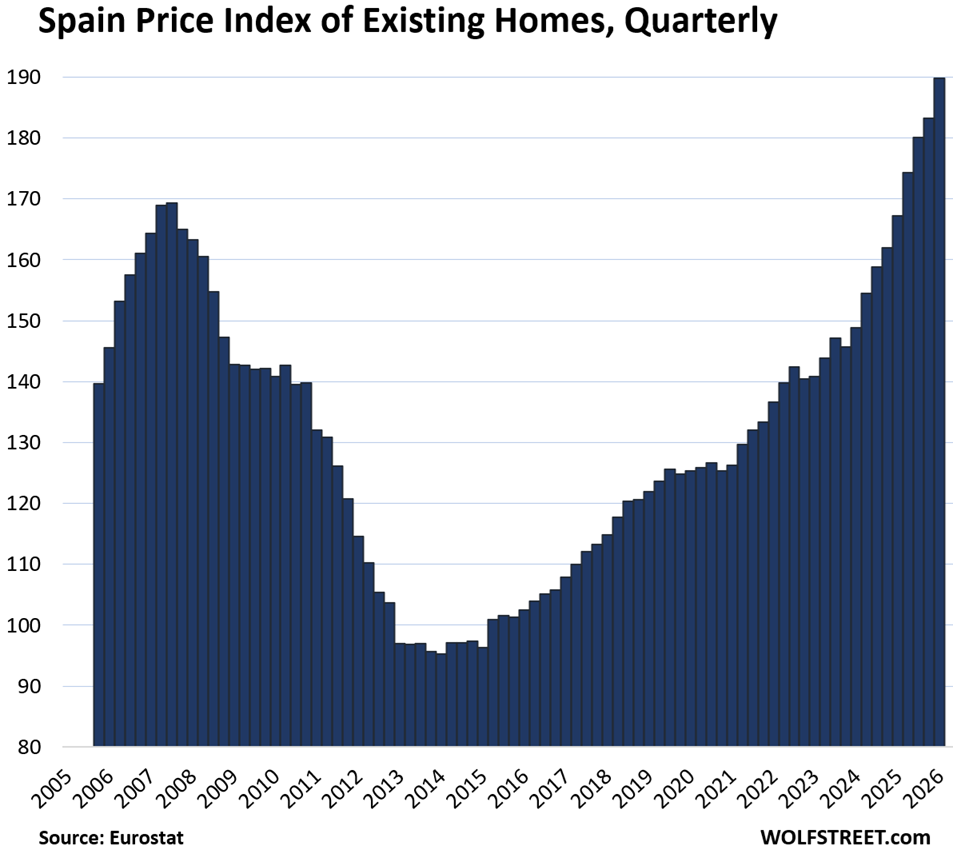
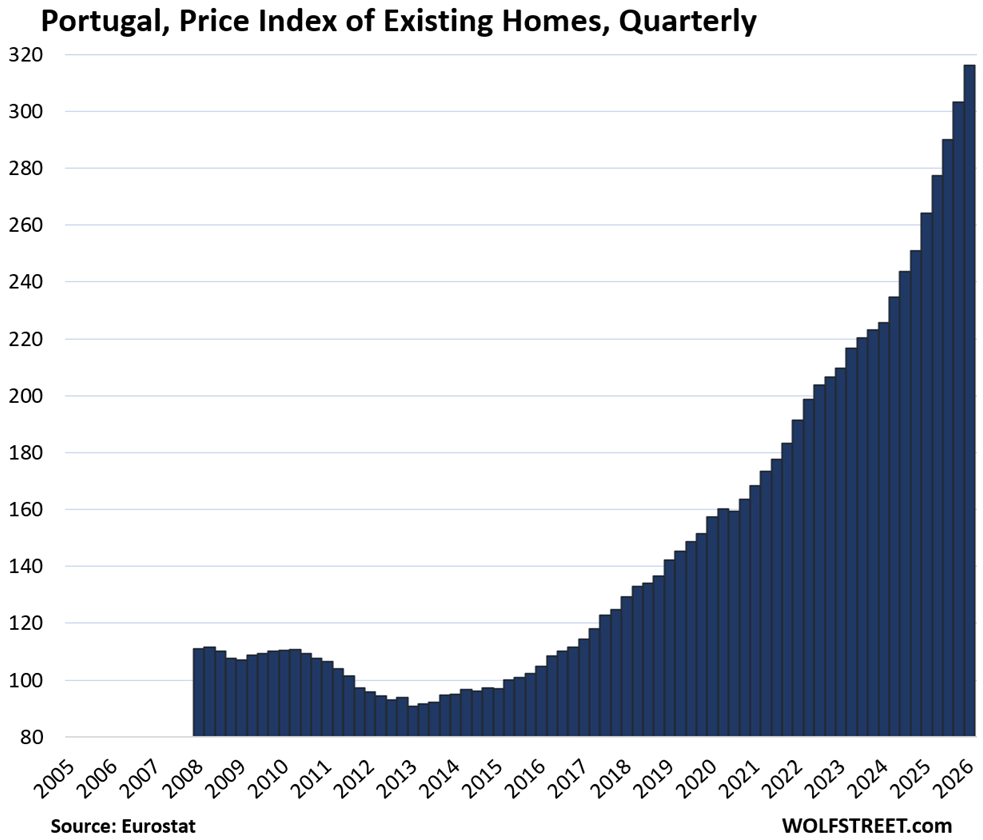
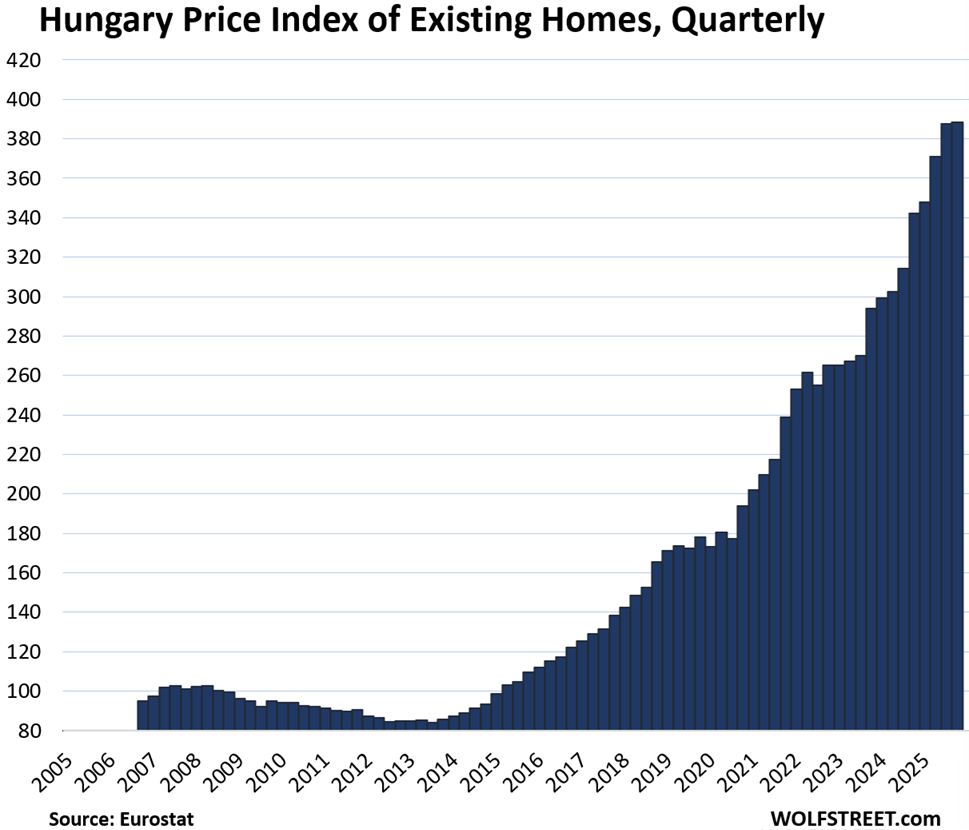
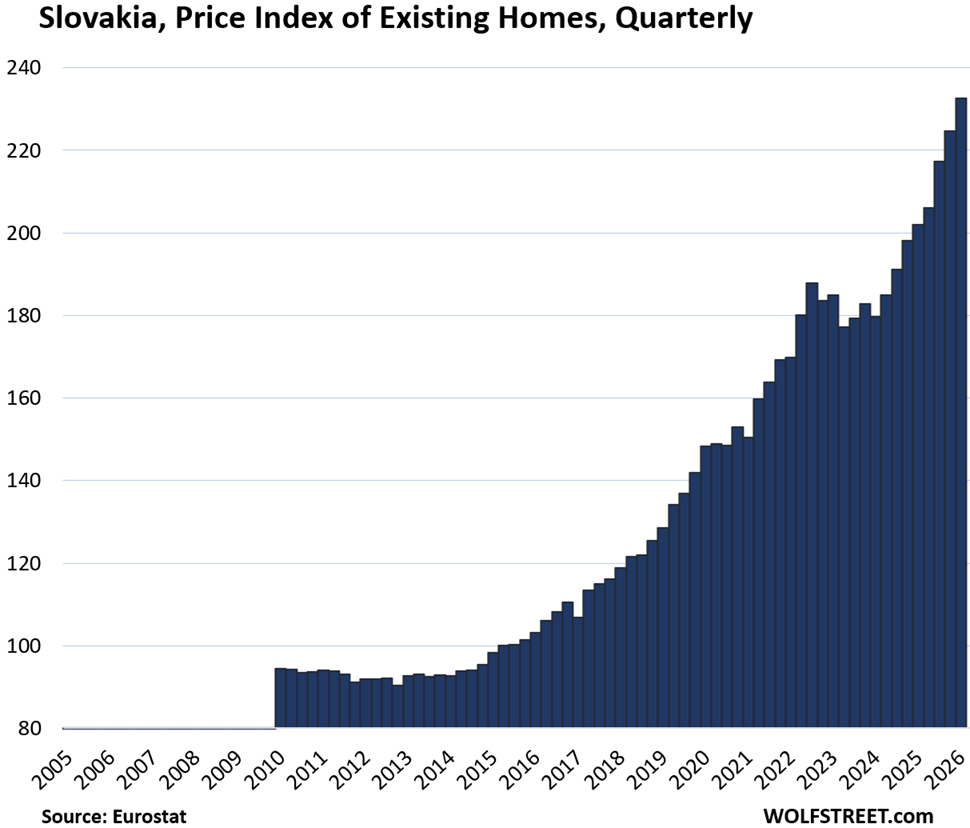
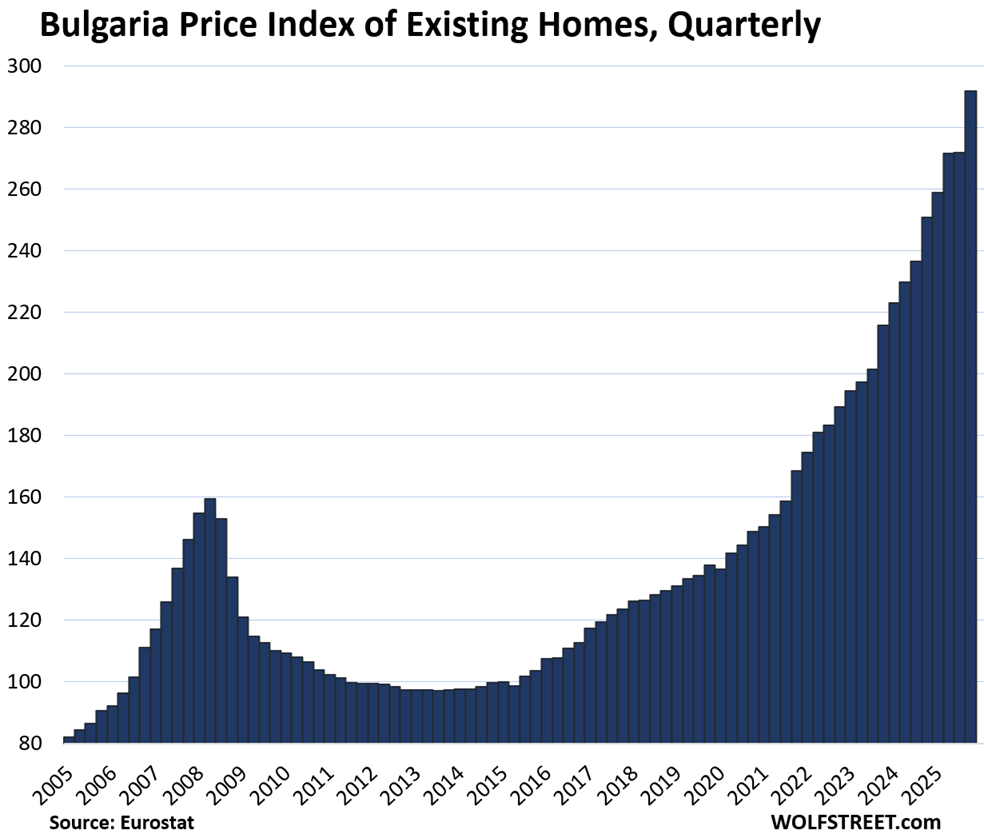
Prices of existing homes have been on an astounding run in some of the 19 largest countries in the European Union (EU) and in the European Economic Area (EEA), led by Portugal (+19.7% year-over-year), Bulgaria (+16.3% year-over-year), Slovakia (+15.2% year-over-year), Hungary (+13.5% year-over-year), and Spain (+13.5% year-over-year).
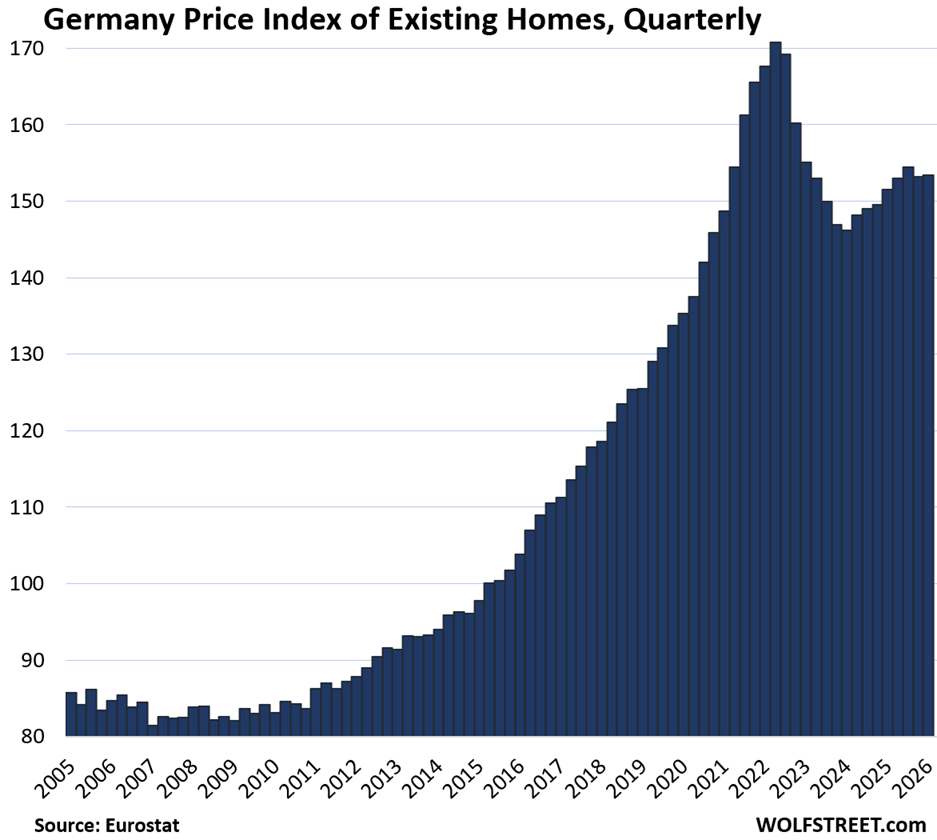
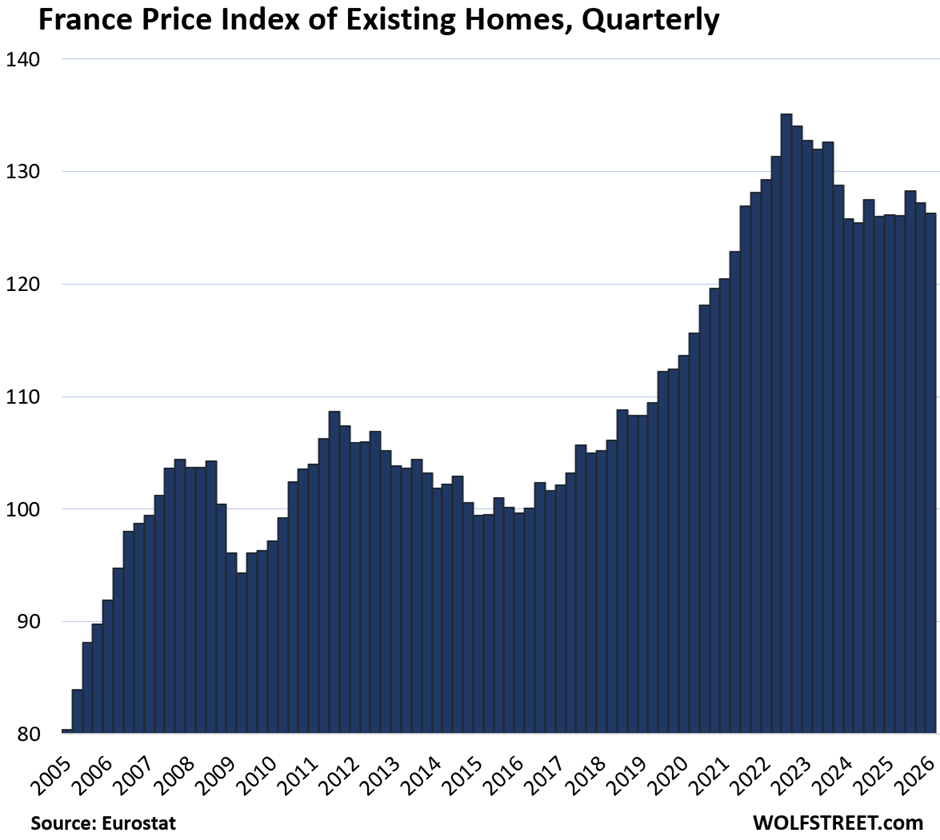
But in other countries, prices of existing homes have dropped from their highs reached some years ago, including the two biggest markets Germany and France.
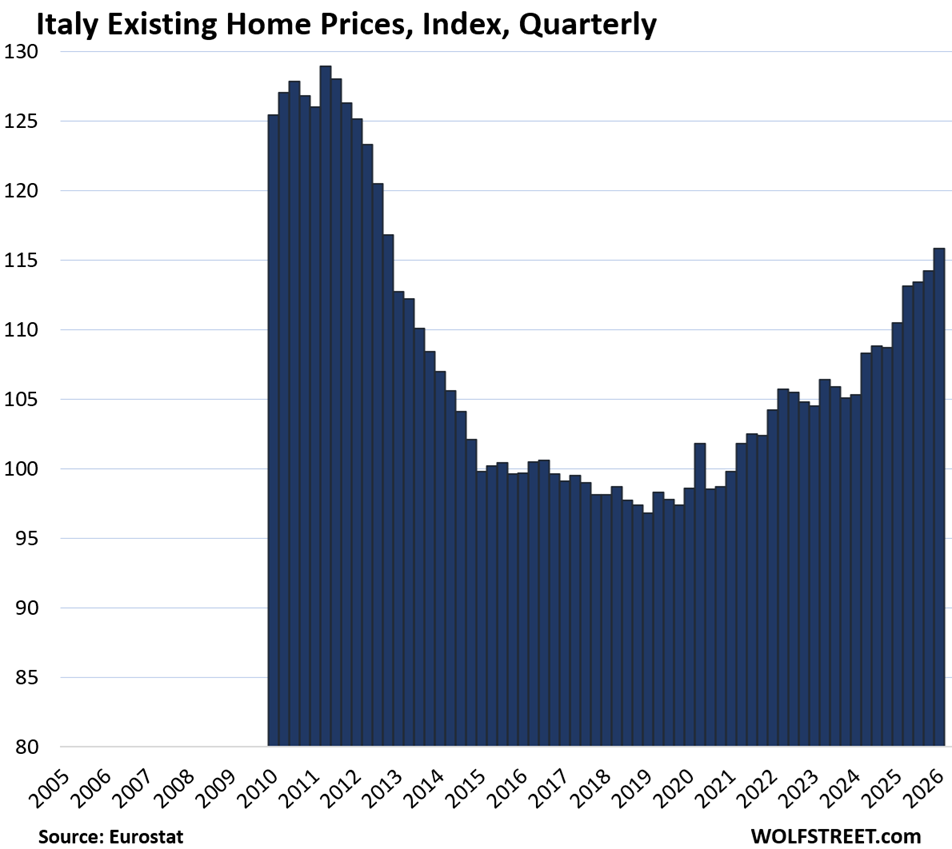
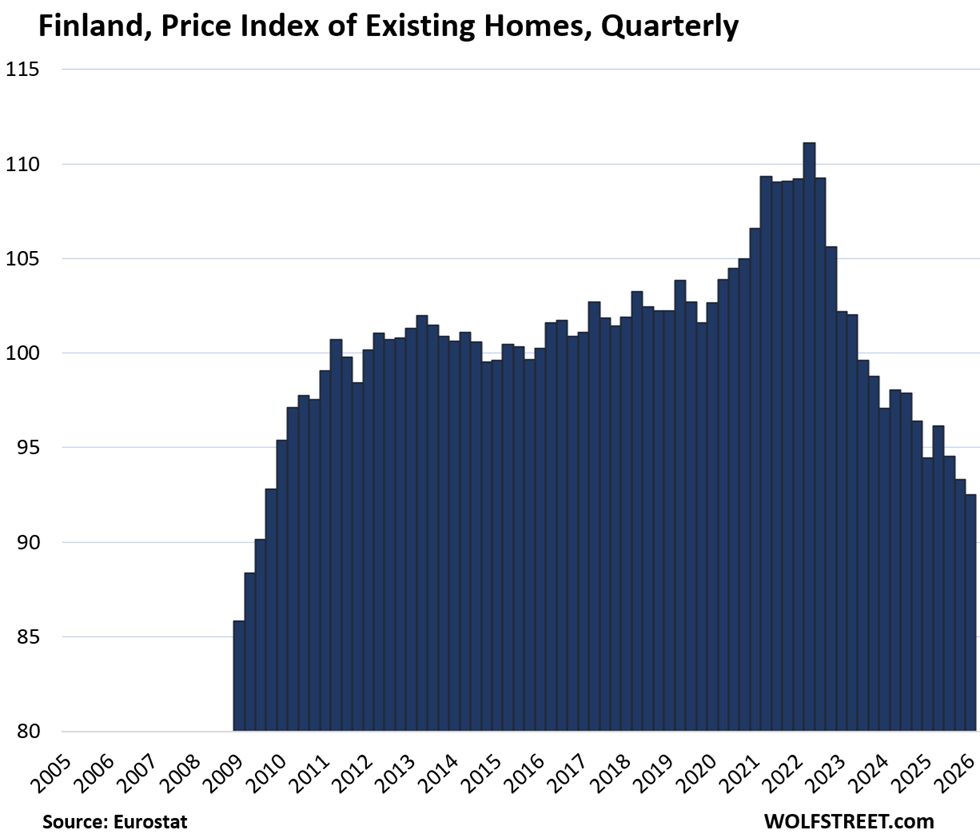
In Italy, prices of existing homes have surged in recent years, but are still below where they’d been during the prior housing bubble which imploded 15 years ago. And in Finland, prices have fallen by 16.8% from the peak in early 2022 after Russia invaded Ukraine, which made Finland very nervous, and prices are back to 2010 levels.
So this is our quarterly wild ride across the 19 largest housing markets in Europe, based on the new data from Eurostat through Q1 2026 for existing homes. But Greece is missing from this lineup as Eurostat does not provide home price data for Greece, noting that transaction-based data is not available for Greece.
Countries with prices below a peak in prior years and year of peak:
- Finland: -16.8% (Q2 2022).
- Italy: -10.2% (Q2 2011)
- Germany: -10.2% (Q2 2022)
- France: -6.5% (Q3 2022)
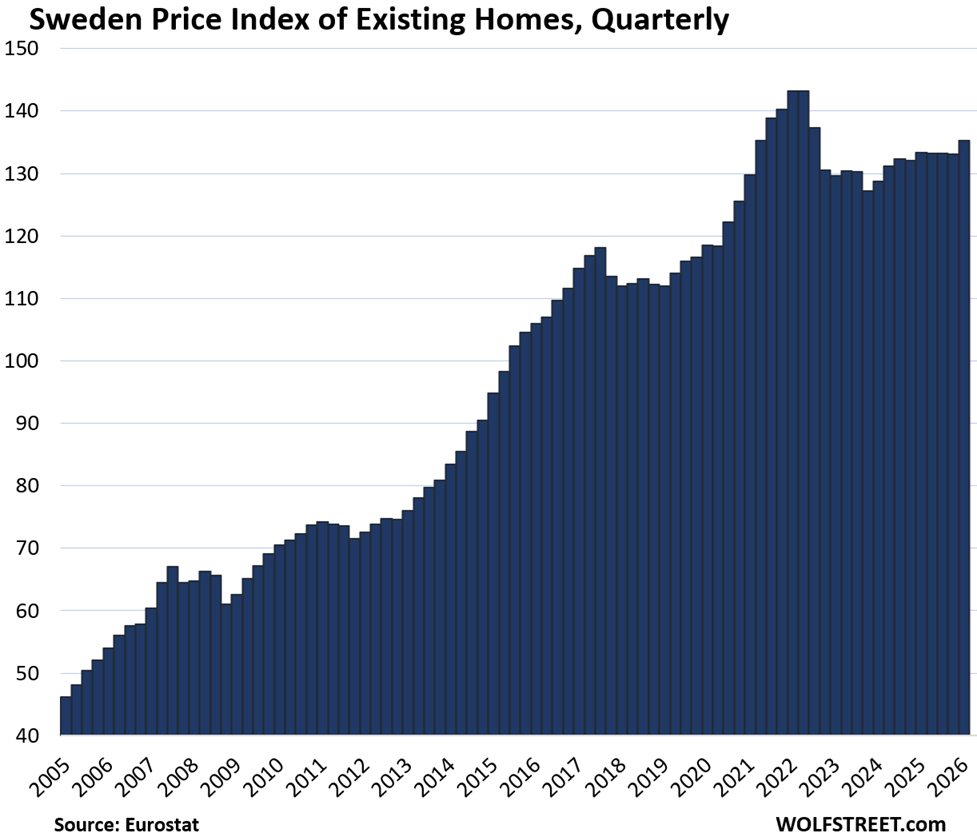
- Sweden: -5.5% (Q2 2022)
- Austria: -3.2% (Q3 2022)
Biggest price gains since 2010:
- Hungary: +308%
- Portugal: +186%
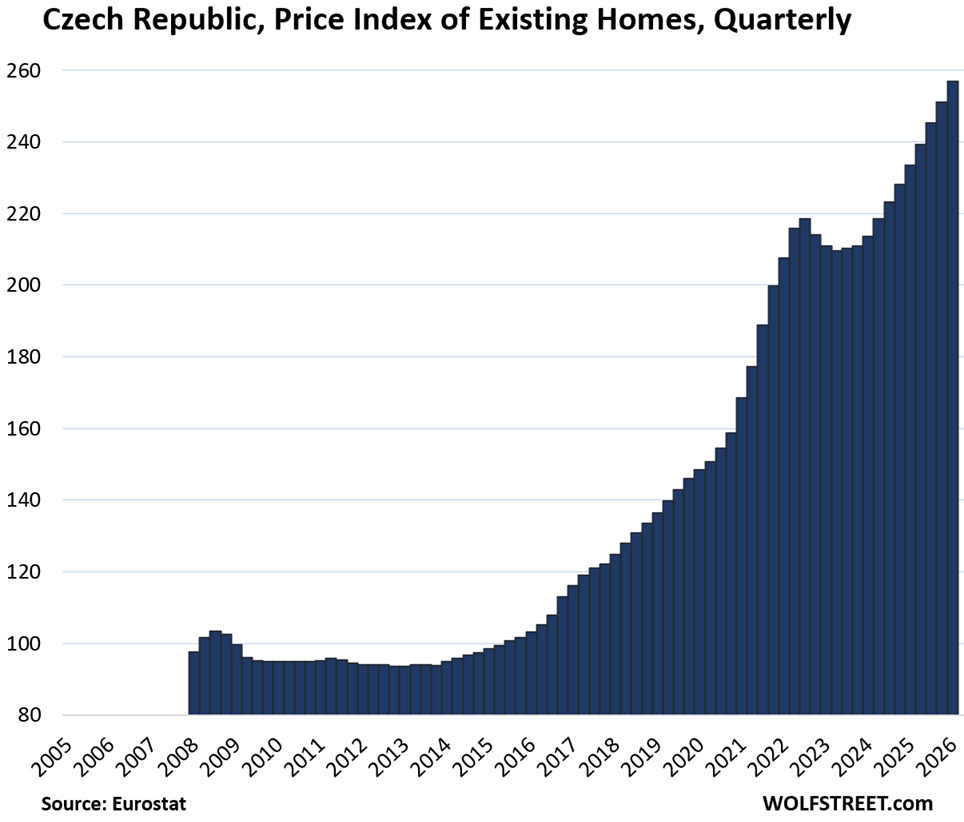
- Czechia: +171%
- Bulgaria: +165%
- Slovakia: +146%
- Austria: +129%
- Poland: +119%
- Norway: +118%
- Netherlands: +96%
- Sweden: +92%
Double-digit year-over-year gains in Q1 2026:
- Portugal: +19.7%
- Bulgaria: +16.3%
- Slovakia: +15.2%
- Hungary: 13.5%
- Spain: +13.5%
- Czechia: +10.1%
Biggest quarter-over-quarter gains in Q1:
- Bulgaria: +7.3%
- Portugal: +4.2%
- Slovakia: +3.6%
- Spain: +3.5%
- Norway: +3.3%
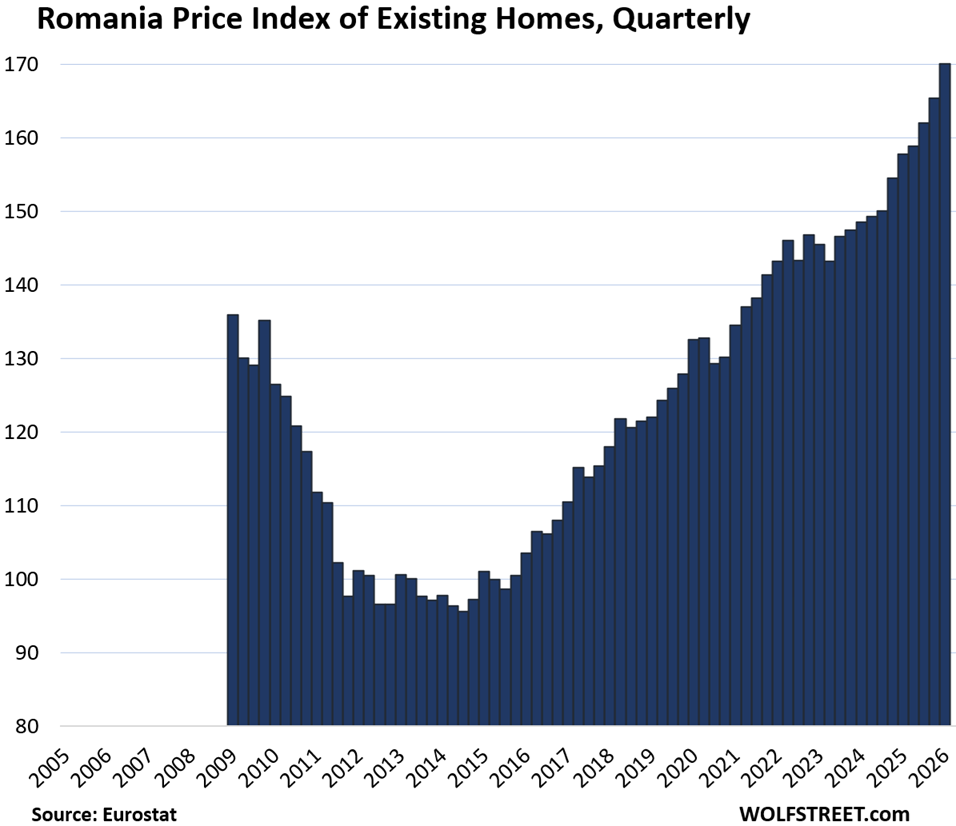
- Romania: +2.8%
- Denmark: +2.8%
- Poland: +2.6%
- Czechia: +2.3%
Home price indices for the 19 largest EU/EEA countries:
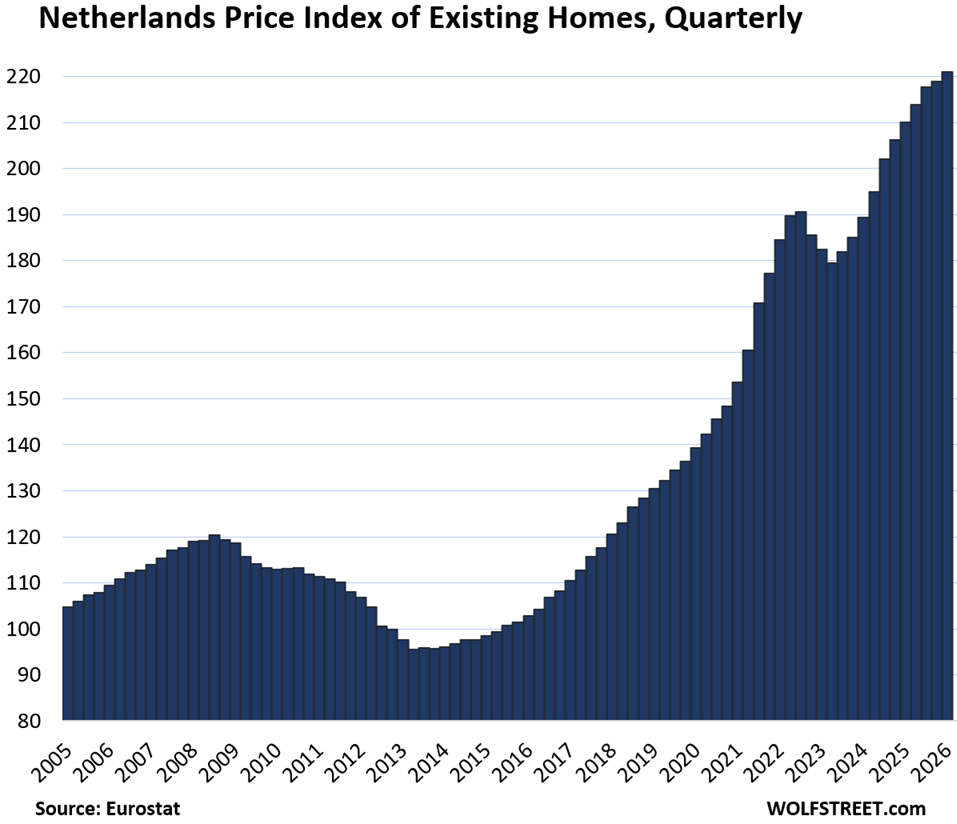
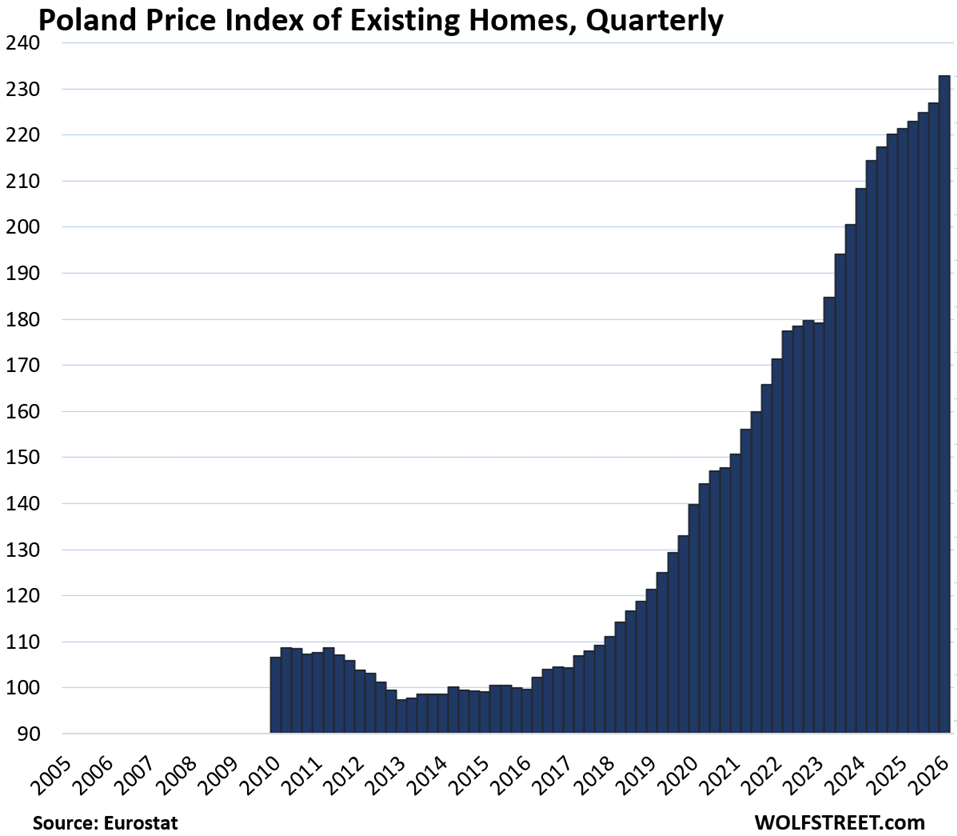
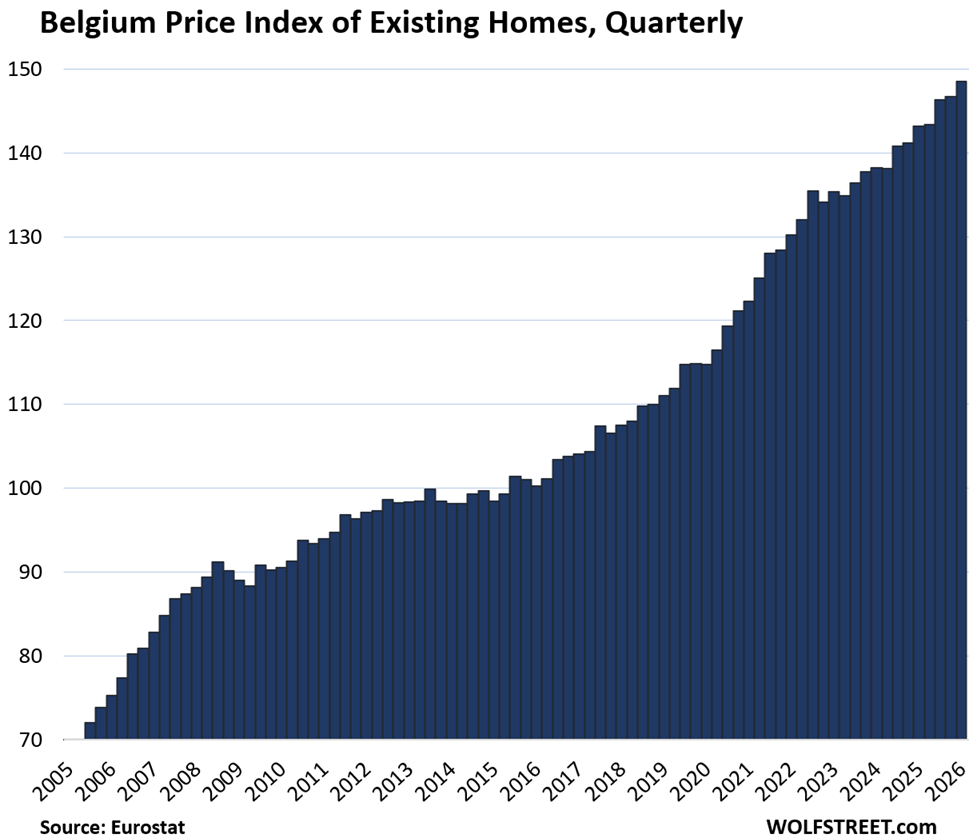
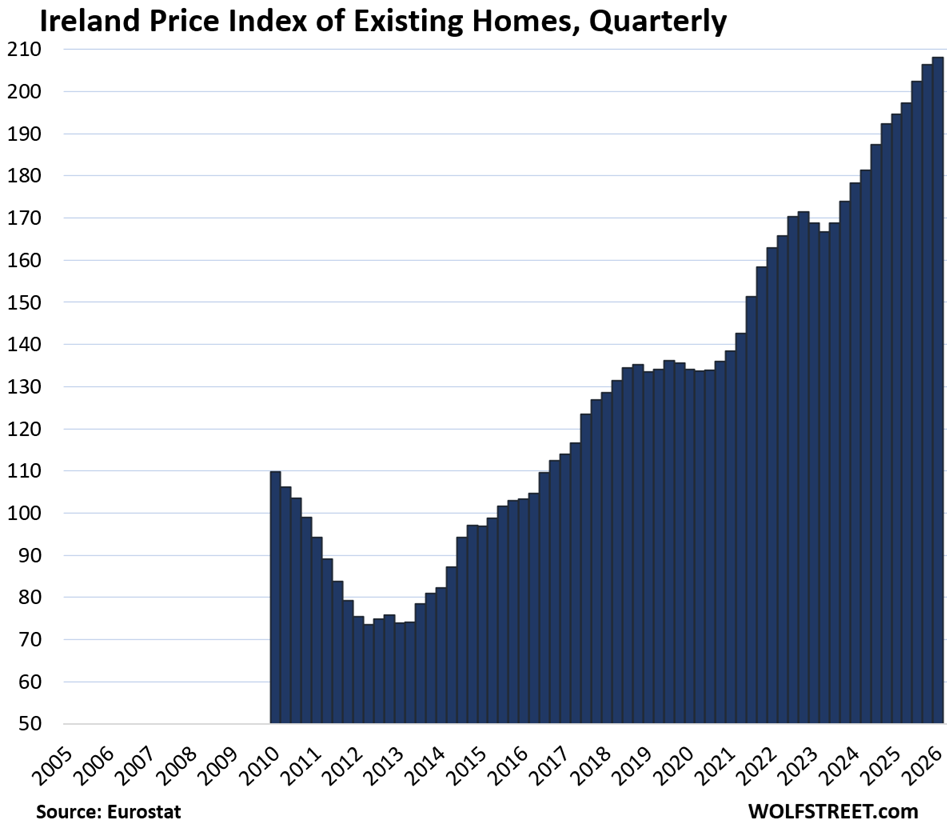
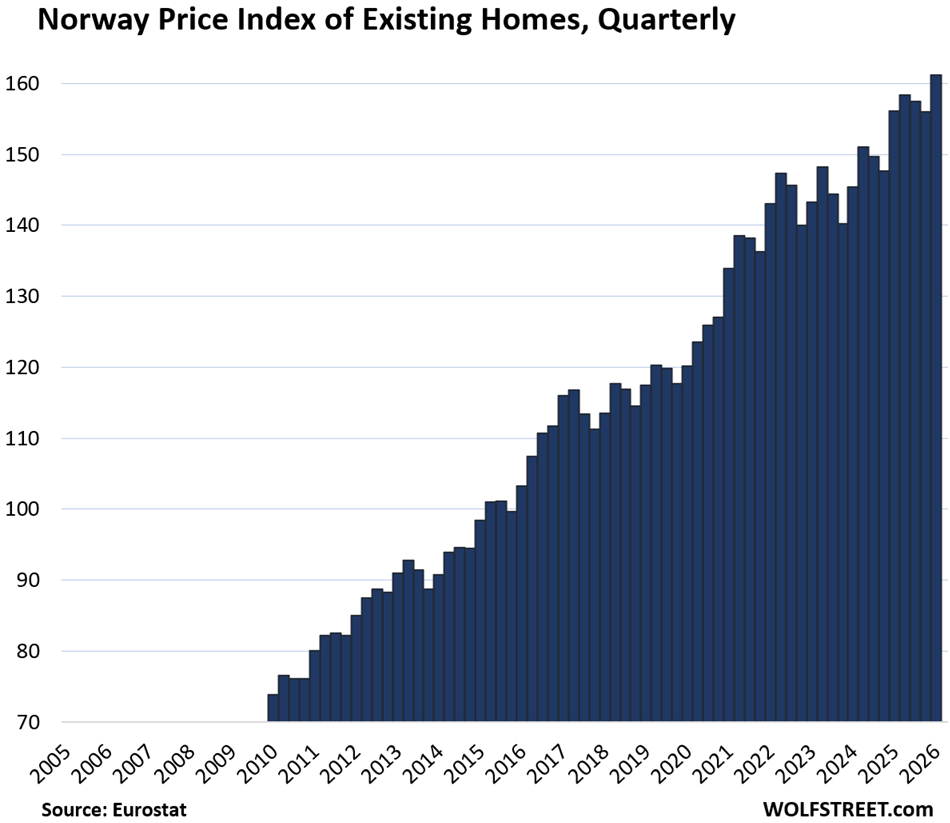
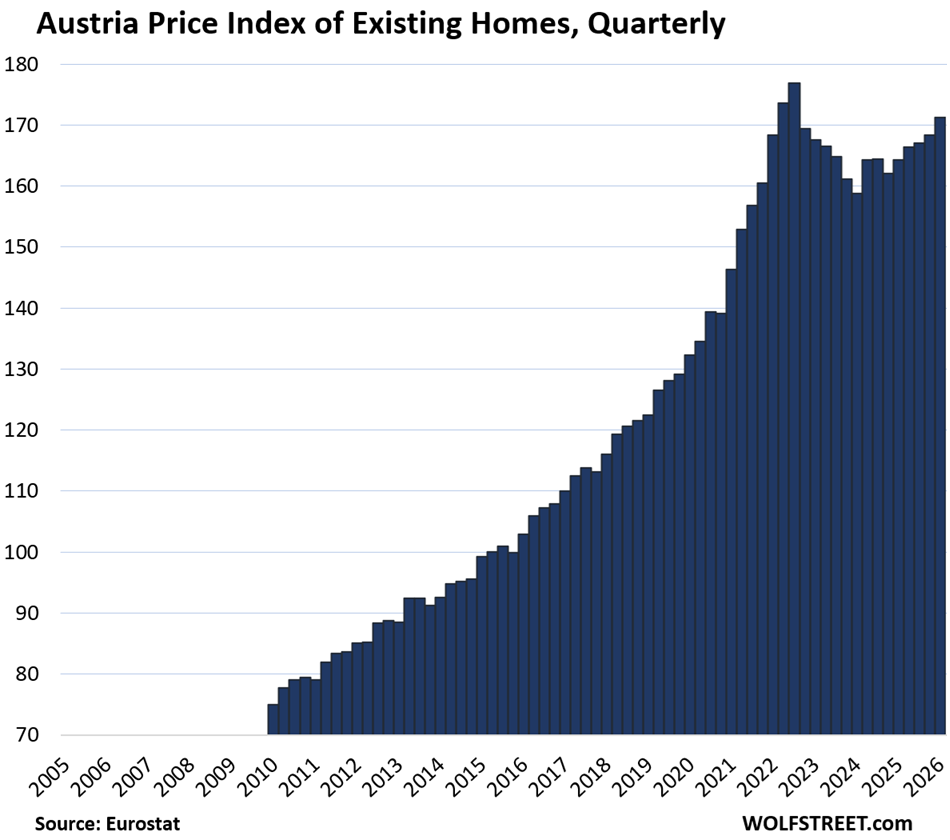
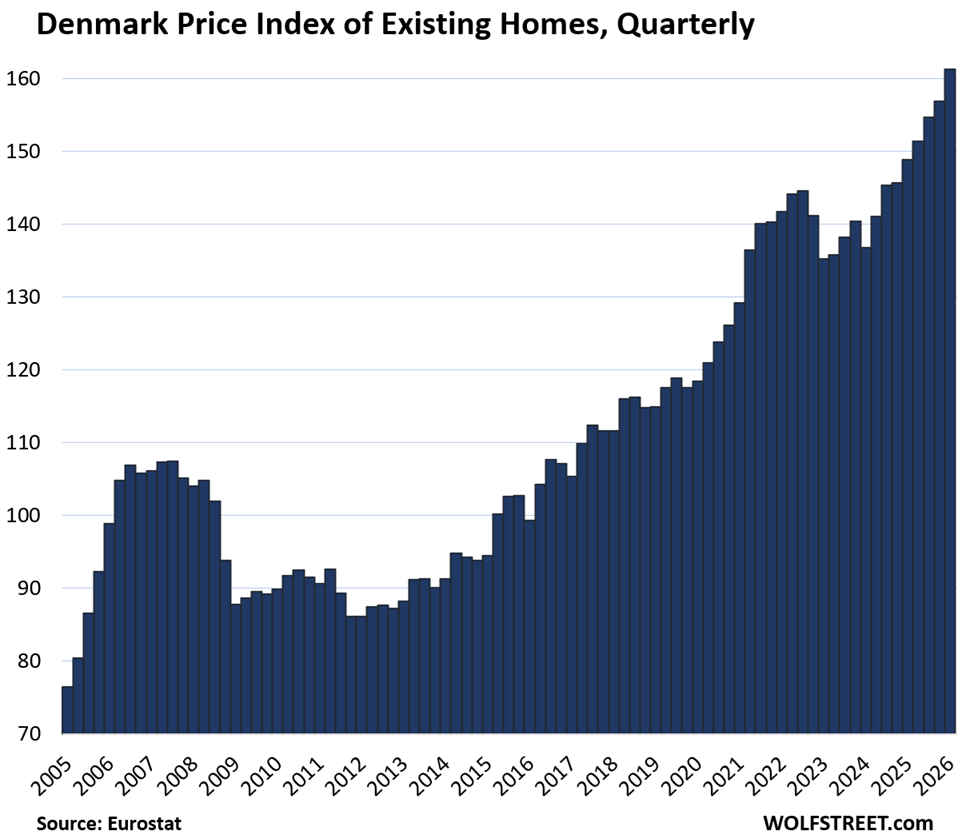
Eurostat’s transaction-based data goes back to 2005 for some countries; for other countries, it goes back less far. I put all of them on the same timeline going back to 2005 for easier comparison.
The vertical axis shows index values (where the values for 2015 were set at 100), rather than prices in currency, so it’s not possible to compare the price levels across the markets.
The little tables show three or four columns, from left to right: % change since 2010; quarter-over-quarter (QoQ) % change; year-over-year (YoY) % change; and % decline from the peak in prior years, for the six countries where that occurred.
| Germany, Prices of Existing Homes | |||
| since 2010 | QoQ | YoY | From peak |
| 85% | 0.1% | 1.3% | -10.2% |
| France, Prices of Existing Homes | |||
| Since 2010 | QoQ | YoY | From peak |
| 30% | -0.7% | 0.1% | -6.5% |
| Italy, Prices of Existing Homes | |||
| Since 2010 | QoQ | YoY | From peak |
| -8% | 1.4% | 4.8% | -10.2% |
| Spain, Prices of Existing Homes | ||
| Since 2010 | QoQ | YoY |
| 35% | 3.5% | 13.5% |
| Netherlands, Prices of Existing Homes | ||
| Since 2010 | QoQ | YoY |
| 96% | 1.0% | 5.2% |
| Poland, Prices of Existing Homes | ||
| Since 2010 | QoQ | YoY |
| 119% | 2.6% | 5.2% |

| Belgium, Prices of Existing Homes | ||
| Since 2010 | QoQ | YoY |
| 64% | 1.3% | 3.8% |
| Sweden, Prices of Existing Homes | |||
| Since 2010 | QoQ | YoY | From peak |
| 92% | 1.7% | 1.4% | -5.5% |
| Ireland, Prices of Existing Homes | ||
| Since 2010 | QoQ | YoY |
| 89% | 0.8% | 6.9% |
| Norway, Prices of Existing Homes | ||
| Since 2010 | QoQ | YoY |
| 118% | 3.3% | 3.3% |
| Austria, Prices of Existing Homes | |||
| Since 2010 | QoQ | YoY | From peak |
| 129% | 1.7% | 4.2% | -3.2% |
| Denmark, Prices of Existing Homes | ||
| Since 2010 | QoQ | YoY |
| 79% | 2.8% | 8.3% |
| Romania, Prices of Existing Homes | ||
| Since 2010 | QoQ | YoY |
| 35% | 2.8% | 7.8% |
| Czech Republic, Prices of Existing Homes | ||
| Since 2010 | QoQ | YoY |
| 171% | 2.3% | 10.1% |
| Finland, Prices of Existing Homes | |||
| Since 2010 | QoQ | YoY | From peak |
| -3% | -0.9% | -2.1% | -16.8% |
| Portugal, Prices of Existing Homes | ||
| Since 2010 | QoQ | YoY |
| 186% | 4.2% | 19.7% |
| Hungary, Prices of Existing Homes | ||
| Since 2010 | QoQ | YoY |
| 308% | 0.2% | 13.5% |
| Slovakia, Prices of Existing Homes | ||
| Since 2010 | QoQ | YoY |
| 146% | 3.6% | 15.2% |
| Bulgaria, Prices of Existing Homes | ||
| Since 2010 | QoQ | YoY |
| 165% | 7.3% | 16.3% |
Enjoy reading WOLF STREET and want to support it? You can donate. I appreciate it immensely. Click on the mug to find out how:


Thanks for another interesting article. Interesting that Norway goes up consistently (but not out of control).
Apparently, that’s where people want to live…I’ve been to some of them. Beautiful places.
no, people are just crazy about FOMO and continue to borrow at the edge of their means. In Bulgaria, for the second quarter, transactions have been falling by 9 to 25 percent, but ASKED prices continue to rise. This is also the case in most European countries.
BTW, these are NOT “asked” prices. All this data is based on “transaction prices” – of sales that closed. That’s why Greece is not included because Greece doesn’t provide transaction prices. It only provides data based on “valuation” by the Bank of Greece.
I guess I shouldn’t be surprised to learn that Greece doesn’t report actual closing prices. My home country never made any headway at dealing with systemic corruption and that’s the way the local privileged class likes it. Haven’t progressed at all since the Goldman Sachs glory days in the 00s.
Home and rent prices have definitely skyrocketed in hyper-touristy Athens and most islands with knock-on effects on areas much farther away. But even supposedly reputable financial Greek newspapers report BS asking prices found on the main real-estate listings platform spitogatos.gr (though a few articles at least clarify that these *are* asking prices).
Not sure how most people can make financial decisions like that. I will be inheriting a condo at some point in the future and looking forward to getting rid of it ASAP.
I was reading there is actually ample stock sitting empty in need of moderate renovations, even in places with huge investor demand like Athens, but people either can’t afford to fix it up or it’s stuck in inheritance or legal limbo. The government is supposedly taking measures to make that stock more available, but there is very little chance of politicians doing anything right in that country.
“Greece doesn’t provide transaction prices. It only provides data based on “valuation” by the Bank of Greece.”
Golly, I wonder what that suggests…
When push comes to shove, governments are just as happy to lie to you, keep you ignorant, etc. as the worst imagined individual.
(And history has many, many, much, much worse examples than “hide the salami” Greece.)
That’s why the “government as savior” concept is so dangerous.
Love traveling Europe but cant just tolerate the cold weather
Nothing beats socal weather
Portugal weather beats it.
Hungry and Portugal are wild.
Portugal has a lot going for it that definitely creates pressure. If I had to emigrate, it’d be a top destination for me. Decent COL, decent weather, great location, low friction country far away from Russia and the Middle East. I imagine they along with New Zealand has to hold back visa/immigration applicants from disillusioned US citizens with some serious efforts.
My logical emigration location would be Finland given my Dad’s heritage and family there, but damn if living next to Russia sounds like constant stress.
Well this set up looks familiar!!
In Bulgaria this is ridiculous because most old homes are shitholes and new homes are lacking infrastructure – overdevelopment, no parking, septic tanks, even no roads. The question is – when this stupidity will end?
Speculative excess in the housing market frequently ends when interest rates rise 2-3%.
With 86%+ ownership rates and people thinking home price appreciation is the answer to everything, I would say: longer than we can stay solvent.
Even if ownership rates were low, large investors would probably swoop in to buy multiple properties and turn them into all-inclusive holiday package destinations, like it’s been happening in Greece and elsewhere. Without a major recession / black swan event, I personally have little hope of seeing normal house prices again.
Supply and demand.
When demand decreases and stays at the bottom, prices start to go down. In Bulgaria, all Airbnb properties will now have to be declared, which is accompanied by taxes and VAT registration. Most people have one property that they rent out for short-term rent. They will give up because the profit will drop and the problems will increase. These properties are already on the long-term rental market. In Bulgaria, only 8 percent live in rent.
A lot of them went for sale. New listings for sale jumped 25 percent. People think that the mantra of rising prices will be eternal. And Canadians thought so, as did Americans and Europeans, but things always repeat themselves
Do policymakers and politicians in all of the bubble countries (North America included) honestly think this rapid asset inflation is sustainable and a good idea? Almost everyone is doing it.
Except for the hapless homebuyers/homeowners who have to shell out more dollars towards higher property taxes, insurance and maintenance costs – everyone else is making more money as prices go up – including the banks/mortgage companies, insurance companies, real estate brokers, government agencies collecting property taxes, and Home Depot/Lowe’s.
Who do you think has lobbyists all over the place and contribute to PACs – individuals or these companies/agencies?
You say it as if politicians have our interests at heart.
Well, if the Fed is responsible for the Covid bubble — money for free — how explain the predominant upreach of these charts? At least some of these countries must have maintained more restrictive (and expensive) lending during the same period?
I wonder also whether a correction, much less a crash, is inevitable. We’re not talking about tulips or a promise of South Sea riches. In the late 1970s I thought central Parisian apt prices were ridiculous. If only…..
With static or declining populations, what’s driving the demand?
If I had to guess it’s foreign buyers and the really wealthy doing well worldwide.
Gulf country Arabs and Asians and Americans and such are all buying homes in Europe. If not multiple.
Along with Airbnb. Cannot be discounted that taking millions of units and making them into makeshift hotels with operating businesses hasn’t inflated prices.
There’s only a handful countries with declining populations. For the majority of Europe lower birthrates are offset by net migration and population growth is positive.
Actual reasons (differing per country)
– Building stagnation due to regulatory pressures and (land)speculation
– Urbanization, skyrocketing prices in cities, some rural areas being abandoned. This combines poorly with space limitations of some older european cities. Much more reluctance in europe to put down high-rise appartments in cities.
– More liberal / right-wing leaning governments strengthening position of home owners and weakening that of social housing organizations (used to be big builders in various EU countries). Combines poorly with financial culture that’s not geared towards investing in RE by individuals.
And then you have the short-term fluctations like the Airbnb crush that is now winding back down, or some hype from international capital wanting to move to this or that city (see parts of London being bought by qatar/emirates).
Do you have the data for Luxembourg?
Yes.
Could you show them with us please? I am very curious to see the result.