How the long-term Treasury debt grows: Treasury notes & bonds outstanding rose on net by $59 billion this week.
By Wolf Richter for WOLF STREET.
The US government sold $646 billion of Treasury securities during the week, spread over 10 auctions. Of these auction sales, $527 billion were Treasury bills, spread over seven auctions, with maturities from 4 weeks to 52 weeks, most or all of them to replace maturing T-bills; and $119 billion were 3-year and 10-year Treasury notes and 30-year Treasury bonds. That $119 billion in issuance replaced $60 billion of maturing notes, and no bonds matured, causing the total amount of notes and bonds outstanding to increase on net by $59 billion this week.
This was also the week two big inflation reports were released, showing that consumer price inflation had accelerated to 4.25% in May, and that producer price inflation had accelerated to 6.46%, which, along with another Iran-deal announcement on Thursday, created some special dynamics for long-term yields.
But Treasury yields of 1 year and shorter are not impacted by inflation. They’re boxed in by the Fed’s policy rates and by market expectations of those policy rates within their remaining maturity window.
In the secondary market, the short-term yields, after edging up in prior weeks, were roughly unchanged this week, all them across the board now substantially below the rates of inflation – so negative “real” yields. And they continued to point at a rate hike late this year.
These are the seven T-bill auctions this week, amounting to $527 billion:
| Type | Auction date | Billion $ | High Rate | Investment Rate |
| Bills 4-week | Jun-11 | 75 | 3.595% | 3.665% |
| Bills 6-week | Jun-09 | 69 | 3.600% | 3.665% |
| Bills 8-week | Jun-11 | 80 | 3.610% | 3.681% |
| Bills 13-week | Jun-08 | 95 | 3.640% | 3.725% |
| Bills 17-week | Jun-10 | 74 | 3.665% | 3.761% |
| Bills 26-week | Jun-08 | 82 | 3.690% | 3.812% |
| Bills 52-week | Jun-09 | 53 | 3.750% | 3.914% |
| Bills | 527 |
“High rate” and “Investment Rate” are the two different calculations of the yield that the Treasury Department provides with its T-bill auction results. T-bills are sold at a discount, and at maturity, the holder gets paid face value; the difference is the interest. There are no coupon interest payments. The “high rate” reflects the yield calculation of that process.
To make this discount yield comparable to the yields of coupon securities (2-year to 30-year), the Treasury Department re-calculates it as “investment rate,” which is higher than the “high rate.” And around the time of the auction, the “investment rate” is close to the “constant maturity yield” published by index providers to reflect trades in the secondary market for that type of remaining maturity.
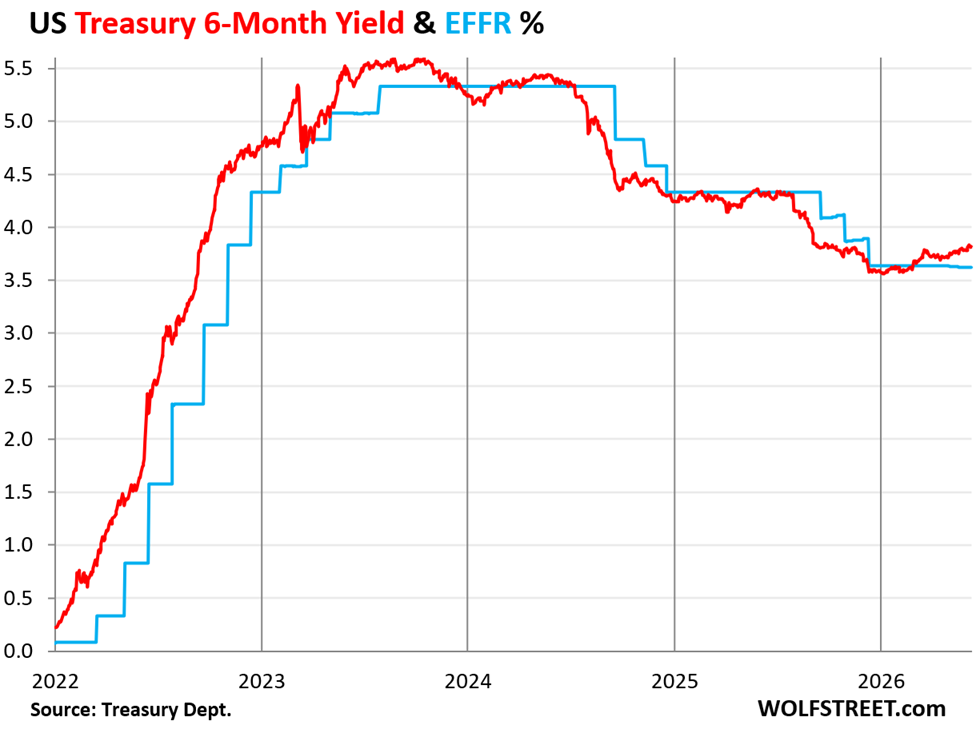
The 26-week (6-month) Treasury bills sold at auction last Monday came with a high rate of 3.69% and an investment rate of 3.812%. In the secondary market at around the time of the auction on Monday, the 6-month “constant maturity yield” was 3.805%.
It points at a rate hike late this year. In the secondary market, the 6-month yield closed on Friday at 3.80%. It has been well above the Effective Federal Funds Rate (EFFR, now at 3.62%, dotted blue line), which the Fed targets with its policy rates. This is an indication that the market has assigned a substantial chance of a rate hike within the 5-month or so predictive window of the 6-month yield.
How the debt increased this week:
The Treasury Department sold $119 billion of notes and bonds at three auctions this week.
| Notes & Bonds | Auction date | Billion $ | Auction yield |
| Notes 3-year | Jun-09 | 58 | 4.192% |
| Notes 10-year | Jun-10 | 39 | 4.538% |
| Bonds 30-year | Jun-11 | 22 | 5.020% |
| Notes & bonds | 119 |
But only $60 billion of securities of these maturities matured, and the amount of Treasury notes and bonds outstanding rose by $59 billion this week:
The $58 billion of 3-year notes that sold at the auction on Tuesday at 4.192% replaced $40 billion in 3-year notes sold at auction in June 2023 at 4.202%, that mature on Monday. So with this week’s auction, the total amount of 3-year notes outstanding rose by $18 billion ($58 billion new notes replacing $40 billion of maturing notes).
The $39 billion of 10-year notes that sold at the auction on Wednesday at 4.538% replaced $20 billion in 10-year notes sold at auction in June 2016 at 1.702%, that mature on Monday. So with this week’s auction, the total amount of 10-year notes outstanding rose by $19 billion.
The $22 billion of 30-year bonds that sold at the auction on Thursday at 5.020% replaced no maturing 30-year bonds because in 1996, 30-year bonds were issued only twice a year, in February and August. Now they’re issued every month. And the entire $22 billion sold this week added to the outstanding balance of 30-year bonds.
New issues being now so much larger than the maturing issues they replace, and new issues not replacing any maturing issues — such as the 30-year bond this week, or all 20-years bonds which started being issued in 2020, and none mature for another 14 years — are among the dynamics by which the total pile of Treasury notes (2-year to 10-year) and Treasury bonds (20-year and 30-year) increases constantly, even as the Treasury Department said, to calm the bond market’s supply fears, that it is not further increasing the auction sizes for notes and bonds this quarter.
Long-term Treasuries face inflation fears, but not this week.
The inflation reports this week didn’t frazzle the Treasury market too much perhaps because something like that had been expected, and there’s still the widespread hope that this inflation was only triggered by energy prices, and that these energy prices are bound to come down when some kind of deal is reached between the US and Iran.
The bond market thereby ignored inflation in non-housing services, which has accelerated for the past six months and in May shot up by the most since March 2024, and the continual surge of electricity costs driven by the demand from AI data centers that is unrelated to the price of crude oil.
And the long end of the Treasury market then got another hopeful announcement about a deal with Iran on Thursday, June 11, which caused long-term yields to drop sharply in the secondary market, only to bounce back part of the way on Friday.
But the $119 billion of Treasury note and bond auctions had already taken place by the time of the Iran announcement on Thursday afternoon, and so they sold at the auction at higher yields than where the secondary market closed on Friday.
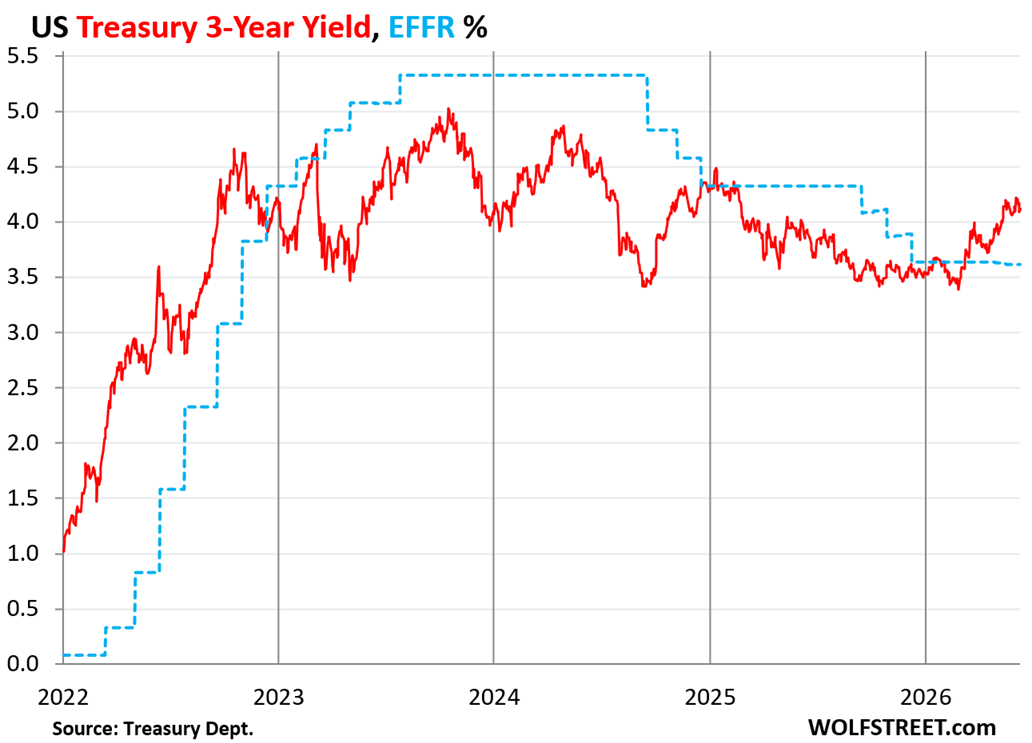
The 3-year Treasury notes that sold at auction at a yield of 4.192% paralleled trading in the secondary market at the time. Two days later, after the stuff about a deal with Iran came out, the yield in the secondary market fell by 10 basis points, to 4.09% by early Friday, but then bounced back some, and on Friday closed at 4.14%.
This yield is now 52 basis points above the EFFR, signaling that the bond market expects multiple rate hikes during the front part of the three years.
And at 4.14%, the yield is below CPI inflation of 4.25%, and so the “real” yield of these 3-year notes is now negative, and were purchased at the auction at a negative real yield.
The 10-year Treasury notes that sold at auction at a yield of 4.538% came with coupon interest of 4.375%, and so they were sold at a discounted price of $98.70 for each $100 of securities, for this coupon interest rate to turn into a yield of 4.538% on the purchase price. At maturity, holders get paid the full $100.
The next day in the secondary market, the yield dropped by 10 basis points from the moment of the Iran announcement to Friday in overnight trading, to 4.44%. It then bounced off, and closed on Friday at 4.49%, roughly 5 basis points below the auction yield. For the week, the yield declined by 6 basis points.
Lower yields of long-term debt mean higher prices for holders of existing securities. Note how the long-term bond market has completely blown off the Fed’s rate cuts.
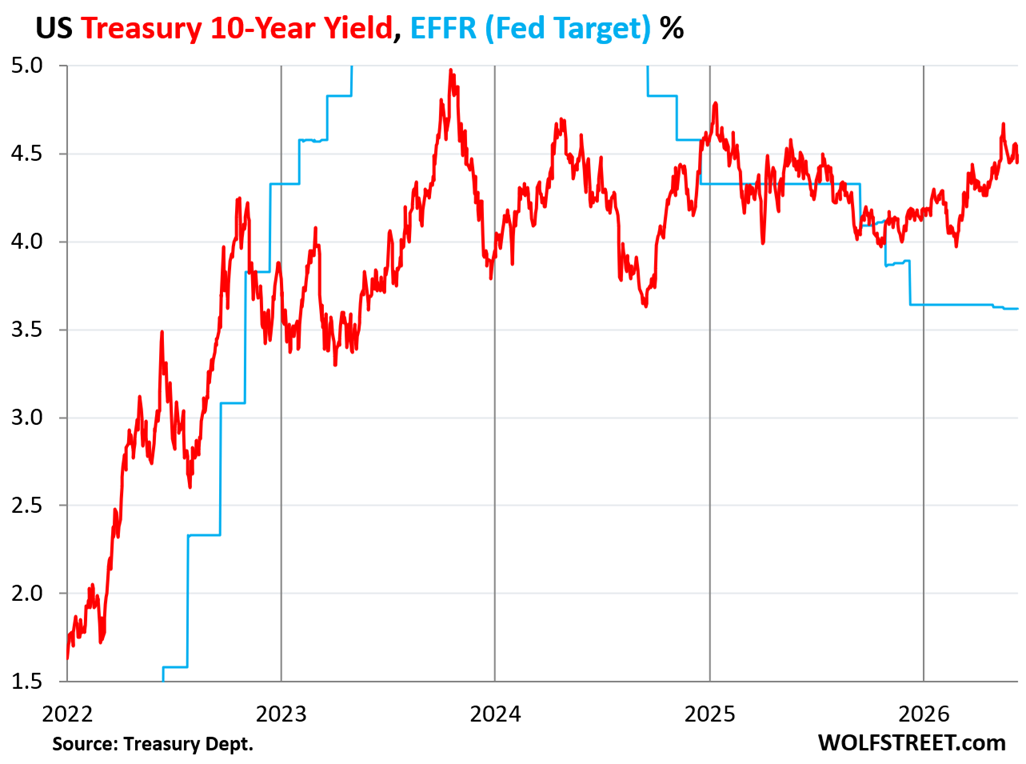
CPI inflation at 4.25% in May has approached in leaps and bounds the 10-year Treasury yield (4.49%), and so the “real” 10-year Treasury yield (yield minus inflation) is on the verge of turning negative, which is a very unattractive place to be.
For long-term debt, inflation can be brutal if the yield is too low to compensate the holder for the loss of purchasing power plus some. And given the Fed’s reluctance and slowness to deal with inflation, and given current and future governments’ eagerness to let the economy “run hot” in order to deal with the otherwise unsustainable fiscal mess, inflation isn’t going back into the bottle. It will be allowed to percolate through the economy for years to come. And the bond market will have to live with it.
It’s higher yields that allow the bond market to live with higher inflation.
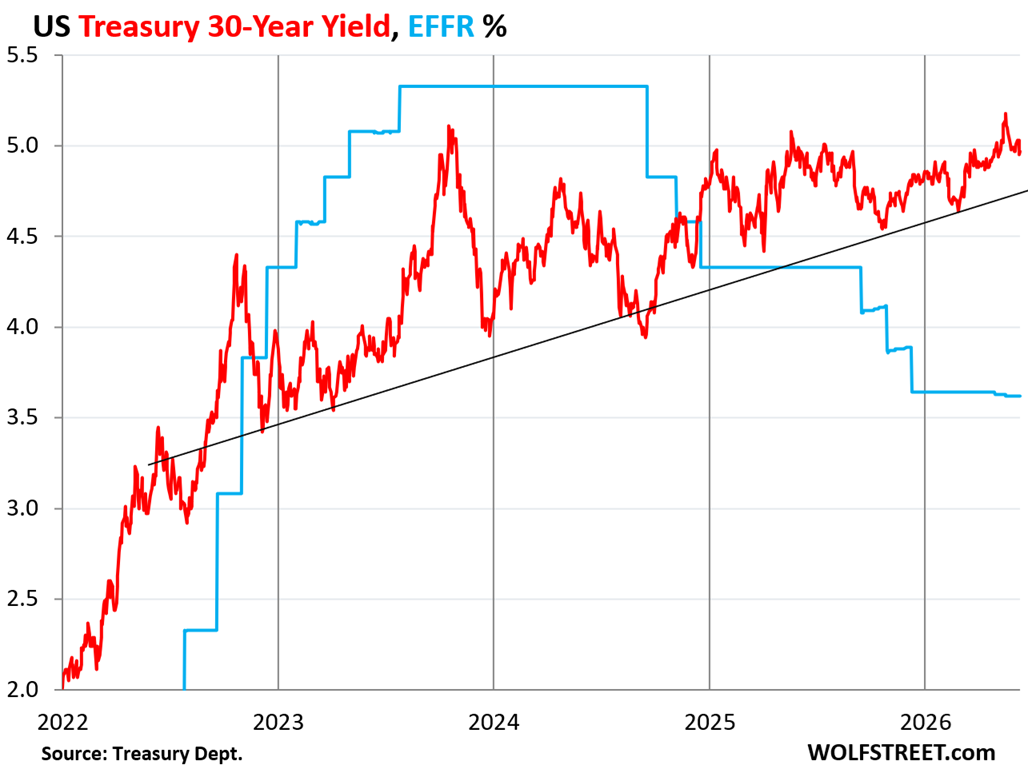
The 30-year Treasury yield has been zigzagging around the 5% line since early April. On Friday, it closed at 4.97%. A week earlier, it closed at 5.01%.
My imaginary trendline that connects some of the lows still holds: a five-year trend of higher lows, while the yield-yo-yo has been narrowing as the bond market appears to be getting less uncertain about the trend.
Enjoy reading WOLF STREET and want to support it? You can donate. I appreciate it immensely. Click on the mug to find out how:

![]()
Who bought these securities?
We bought some. But not all. Other people bought some too 🤣
(We bought T-bills on auto-rollover).
There is lots of demand for this stuff or else the yield would be far higher.
Maybe paywall guy is on a … Treasury Ladder! 🪜
😂 🥁
Right. Take away the “Fed Put” and let’s see all the real demand.
LOL!
Wolf – which broker do you trade T bills through ? Is there any advantage to “auto-rollover” versus just buying a T bill directly yourself ? Is it time saved, commission, or both?
Thanks
You can only set up auto-rollover for T-bills that you buy at Treasury auctions either through your broker or through TreasuryDirect.gov
You cannot set up auto-rollover for T-bills that you buy in the secondary market from someone else through your broker. When those mature, you get the cash, and you have to find something else to do with it.
The advantage of auto-rollover is that T-bills in your portfolio act like a money market fund — you don’t even think about them until you want the cash to buy something else, and then you can take them off auto-rollover or you can sell them. You can sell T-bills like stocks on the spot, to the highest bid; unlike money market funds which you have to sell back to the issuer and wait to get credit for it the next day or two.
T-bill yields currently are higher than most MMF yields because there are no commissions or fees involved. MMFs have fees that eat into your return.
Regularly putting in orders manually for T-bills to replace those that have matured is a hassle. Plus you can run into some timing issues with your cash. Watch the settlement dates. It could trigger margin interest, or you could have cash sitting around for days earning nothing.
I’m bummed that they got rid of the C of I account in the t direct website
A suggestion. While we can reply to your original post, there’s no button to reply to your reply to a post. If that was possible to implement might help with the organization a bit.
Thanks for the detailed response re auto-rollover. My broker allows buying /rolling over funds for a T Bill maturity the day before maturity without margin interest. And yes it’s a bit of a pain in the butt but doing it 3-4 times a year not a big deal for me, personally.
Comments are nested 4 deep to avoid unreadably narrow columns on mobile phones. If there is no reply button, use the last reply button above, and it’ll put your comment in sequence. Add the name of who you’re replying to.
Nominal fixed income should be the last place anyone should be investing with the amount of inflation we can foresee incoming.
And if you absolutely need a bond allocation, make it iBonds or STIP, or invest in a foreign currency of a government not printing an accelerating number of units each day.
In a less interventionist, more laissez–faire, free market world, could the EFFR – and the entire Fed as well – simply be replaced by the 2 yr. U.S. Treas yield? I don’t see the need for the Federal Reserve System. Let the markets sort out what rates should be.
While we’re at it, let’s get that inflation thingy back down to zero per centum. Of course that would require fiscal restraint by Congress, but that’s an oxymoron. Is it too late now with a $39T national deficit, ignoring unfunded liabilities for the moment?
I wouldn’t be buying anything longer than 2 yr. maturities right now, and I’m not even liking those with now negative real rates, which BTW, are a tailwind for precious metals and commodities. To me right now, it looks like inflation and currency debasement as far as the eye can see.
“Once you have a populist that can vote it self money, you print too much & that’s how the entire damn Roman Empire collapsed” -Charlie Munger
“No republic has long outlived the discovery by a majority of its people that they could vote themselves largesse from the public treasury.” – Alexander Fraser Tytler
“Those who cannot remember the past are condemned to repeat it.” – George Santayana
What has been will be again,
what has been done will be done again;
there is nothing new under the sun. – Ecclesiastes 1:9
Absolutely and the design guarantees it will occur…the debt connundrum is the mathematical reality built in the institutional design…so real reality takes over the scripted reality of money itself…pro pagan da right up to the reset or planned decline…and they are unable to change behavior as the design reinforced their behaviors…
Yes, you got it. But let’s be constructive. If you are retired and need income, where do you put your money? Land might be a good answer provided you get revenue from it, Farm product, golf course sales, tree farm, etc. Perhaps you rent out part or all of your home(s)?
Treasury bills and interest bearing deposits are no longer worth while. The return is lower than the inflation rate. But they do have two remaining attributes: liquidity and safety.
Perhaps more discussion of these attributes of government bonds here would be more helpful then just interest rates and inflation.
Yet in 4 months the return on treasuries bought this week may comfortably exceed inflation. Don’t forget the tax advantages as well in that in places like California where I live, you don’t get taxed on that income. Treasuries create reliable largely risk free monthy cash flow. And an astute investor can buy low sell high and get an added return if savvy enough.
Federal Reserve Bank of New York website:
“Specifically, in evaluating participation in the New York Fed’s repo operations, the New York Fed will expect a primary dealer to bid in every operation commensurate with its size, and its bid rates should be reasonable when compared to the range of rates in the market, taking into account market volatility and other risk factors. In other open market operations, the New York Fed will expect a primary dealer to bid, or otherwise participate, in operations at levels commensurate with its size and presence in the market.”
“…New York Fed’s repo operations, …”
The topic here has zero to do with repos. These are Treasury auctions. Not “open market operations” by the New York Fed.
The internet gives you brainrot.
The second sentence of the paragraph states: “In other open market operations…” This Federal Reserve specific paragraph appears to have two operations, but the commonality is describing the Federal Reserve’s expectation of the primary dealer bidding in auctions. The Federal Reserve writes this paragraph similarly to what would be found in a contract clause.
The entire paragraph refers to the Fed’s balance sheet operations with primary dealers, including “In other open market operations…” these are operations where the NY Fed buys or sells securities for the Federal Reserve’s balance sheet (“System Open Market Account” = SOMA).
If you want to say that primary dealers participate in the Treasury auctions, you can just say that. In stead of citing this paragraph about the Fed’s balance sheet actions, you should have just said:
“primary dealers” just that.
And then for extra credit, you can cite a figure, such as $3 billion purchased by primary dealers of the $22 billion 30-year bond sale this week, and you would have been good to go. And none of that went on the Fed’s balance sheet (SOMA).
It is interesting to watch us sail blithely into peril due to our inflation stimulated interest rates. And we are really have a duration issue going back to the beginning of covid. When we should have sold the back end 30s in huge mass.
It is going to accelerate from here, with the liquidation of the Social Security and Medicare Trust funds in the next five years. This is going to require another $2.7 Trillion to be issued in addition to the deficit funding.
And all of this will require much more annual interest payment on all the accelerating debt.
A really bad spiral is coming, but hey, for right now, only old folks worried about beeeg inflation are worrying.
A few years ago I was predicting this crisis would arrive in 2035, and now it has accelerated. It will be in full swing by 2028. And it will take some major pain to get it under control.
But for now, we party on. This is going to be the opposite of the 2008 crisis. Now we return to the bad old days. Our fiscal position is crazy compared to any remembered history.
Math is hard, and everyone is simply going to have to watch it happen. The real question is how many other countries are going to print in lockstep to preserve their ability to export? Or will they decide at some point not to follow the devaluation of the world’s reserve currency?
The lessons of the 1930s are pretty clear, a hard money policy cutting loose from the dollar will have really harsh consequences on the trade positions. China has rode it down so far, but they are starting their gradual exit from dependency on US trade. And that will be a very fraught experience for us.
In short, this is going to be a learning process, and a lot of damage.
When you have ignorance of the design and purposely done by an elite class who designed the rules to acquire more of everything and concentration of Instutional power you end up in this future…they balanced the budget 2 times 30 years ago ..this system has been gamed by debt, deficits, and money creation…they may get their new world order yet as Bush quoted in 1990…this all looks planned ..
Citizen AllenM,
History shows that when empires get to this point there really is no turning around. This is exacerbated by highly individualistic culture and privatization of many things you would like prioritized where the majority of society benefits. If it isn’t profitable then it doesn’t happen which is why you see crumbling infrastructure and so on. I put a lot of this on Reagan but he is just a product of material conditions and politicians have supported it since if you view their actions.
It is more likely to get worse rather than better as the institutions such as trade unions and such that would organize and resist are non existent or empty shells.
Will be interesting to see how the world aligns during this slow paradigm shift in the world which a few decades ago seemed unimaginable. There is a solid chance the world comes out better as a whole although clearly suffering will occur to get there but what struggle has ever occurred without it?
I’m glad you pointed out extreme individualism as a root cause of all this.
When I hear a boomer or GenXer talking about how they voted for tax cutting, deficit-increasing policies because it increased their ability to buy a fancy new vehicle and because they’ll be dead when that bill comes due, I can see a set of values that would seem shockingly selfish in a less hyper-individualistic country or time.
The generations raised by people who survived the Great Depression learned that obtaining money and stuff for themselves was the most important value in life. What was a survival skill in the 1930s became a life philosophy in the latter 20th century: consumerism.
But an obsession with accumulating luxuries and status eventually became the downfall of the empire. Under their watch, the US went from having minimal debt to having over 125% of GDP in debt, and the benefits programs that had become part of the post-industrialization social contract became insolvent.
They will not change in old age. If anything, they are becoming more selfish, casting votes to whomever they think will juice the market more. We’ve already seen politicians chasing the crypto vote.
Aren’t there just 3 options with respect to Social Security?
1) Increased taxes
2) Reduced benefits
3) Increased debt
Seems if 3 is no longer an option, then the fight will be over 1 and 2.
Of note, COLA didn’t exist until 1972, when it was authorized by Congress.
1983 saw more reforms, including raising the full benefits age from 65 to 67.
Congress can fix things with such changes, has done so in the past, and will do so in the future.
These might be intense political fights, though, as we saw in France when Macron tried to raise the retirement age.
Right. I grow weary of all this hand-wringing that nothing can be done about the debt, and we’re just doomed, doomed, doomed (to quote Shaggy).
In theory something can be done. In practice, politically, nothing can be done until it reaches a crisis stage. The media industrial complex will crucify anyone who dares to tip toe into fiscal restraint because children, minorities, pregnant women, people of color, the marginalized, and the victims of systemic racism will suffer, die, go hugry, lose their homes, and their jobs so the wealthy can continue to bleed American dry.
“2nd Wave of Inflation Approaches 10-Year Treasury Yield”
Weimar Powell will go down as the worst FED chair in history. He completely failed at his job, caused the worst, self-inflicted inflation in US history, then proceeded to intentionally “let it run hot” and then cut rates while it was still raging. Rat b_stard.
I didn’t think it was possible to do worse than the trifecta of Greenspan-Bernanke-Yellen, the architects of the disaster that became known as QE.
But for feckless conduct, Powell surely takes the cake.
All of them, including Powell, passed on bigger mess than what they started with.
Bernanke once said we could keep employment up by paying people to endlessly move dirt around. I think the “work” of the last Fed Chairs provides good evidence for that theory.
The market is still willing to take a negative yield, just to get their money back at the maturity date. That tells me inflation is not a major worry compared to the alternative investments.
It also tells me there will be no dollar crash in the near future. If investors thought that they’d be finding other places to park their money. The euro and those much sicker economies of europe — no way. Japan or the UK… nope. China, not a chance and it’s still a semi closed market. Gold and silver, way off the highs from a few weeks ago, so no panick to get in there.
We went with Wise Money Israel about 5 years ago.
The 1M to 1Y rates are almost flat. There is a jump from 1Y to 2Y.
Thereafter, the 2Y to 10Y are almost flat. There is a jump to 20Y and
30Y. If Kevin hikes and the 10Y drops in Aug ==> the yield curve will
be inverted or flat. Last year the yield curve was a curve. Last Fri
it’s rising in stepping stones.
The 10Y might drop in Aug, Sept and Oct.
Re: “COLA didn’t exist until 1972, when it was authorized by Congress.”
That’s because generalized cost-of-living inflation didn’t really exist under the gold standard prevailing for most of U.S. history until the 1960s. See wtfhappenedin1971.com
🤣
During the 6 years 1945-1950: 40% CPI inflation.
During the 10 years 1950-1959: 24% CPI inflation.
During the 10 years 1960-1969: 28% CPI inflation.
.
.
.
During the 10 years 2010-2019: 19% CPI inflation.
These gold buggery falsehoods that inflation didn’t exist under the gold standard are just ridiculous.
Inflation happened in ancient times when people used only coins too. And there were problems with metal debasement at mints, people slicing coins, etc. Basically as long as there is money, people and governments will manipulate it in some way, whatever form it may take.
tuesday tried buying 5yr tip (auction) at stated rate1.8%. well know brokerage firm did offer it at stated rate; other well known brokerage firm offered it at 1.25%. Other than greed would someone know why???
The 5-year TIP auction takes place on June 18. What you did was put in an order for 5-year TIPS. If you specified a yield in your order, it means that you put in a competitive order and might not get the order filled; if it does get filled, it will be filled at the yield established at the auction. If you didn’t specify anything other than the quantity, you put in a noncompetitive order, and you will get your order filled at the yield established at the auction.
I don’t fully understand what you mean with another brokerage firm “offered it at 1.25%.” But let me try: the 5-year TIPS to be sold on June 18 has a fixed coupon interest of 1.25% of face value. Given that the current market yield is about 1.8%, the TIPS will be sold at a discount to face value. If the yield established at the auction is 1.8%, the discount would be quite a bit so that the coupon interest of $12.50 per $1,000 of face value will amount to a yield of 1.8% after the capital gain is figured in that you get when you get paid full face value at maturity.
Like grandparents of any generation, we baby boomers will need someone younger to clean up after we’ve made a mess. Given our numbers, though, our mess is exceptionally large.
Millennials are a bigger generation. Boomers’ kids. They and GenXers are now deeply into running the show.
One way to look at the 10-year rates is that folks are not demanding high enough rates to compensate for inflation. But suppose I look at the treasury market as part prediction market, where some big-money players much more knowledgeable than me are voting on the future. Perhaps there’s a signal there that we might be heading for recession, sharp disinflation, a steep stock market downturn, and greater demand for low-risk investments. But that’s not what’s happening now, of course, and the easy prediction is we’re heading for raging inflation. Perhaps current yields represent a compromise, a push-and-pull, between these two disparate outcomes.
Selling treasuries to pay interest on the interest….
Ain’t that the truth Wes. Responsible finance is out the window.
When will FEF rollback their Reserve Management Purchases? I know they slowed down their amounts after Tax Day but they haven’t let it mature which should be seen in Balance sheet.
They said they will freeze level in December 2025 and then it will grow organically.
But buying at predetermined pace of 40B from December 2025 is not organic growth. Otherwise we would have seen little more higher rates in T bills too.
Since mid-May, the Fed has been buying about $25 billion in T-bills per month: $15 billion to replace the MBS that come off the balance sheet, so that doesn’t add to the balance sheet but replaces a long maturity with a short maturity; and $10 billion to add to the balance sheet.
The initial T-bill purchase takes place in the secondary market through the primary dealers. When those T-bills mature, the Fed rolls them over at the T-bill auctions (the SOMA line in the auction results).
Thanks for the reply Wolf.
I am not sure if I understood. Lets say FED bought 200 B in T-Bills as part of Reserve management (from Secondary Market). I am keeping simple calculation. 5 months X 40 B each. Now Tax day pressure is over. Will FED let those 200B worth of T-Bills mature and not renew. So it gets absorbed by Market and comes off from FED balance sheet?
Isnt that what they told us in Nov 2025 meeting. WE will freeze Balance sheet and let it grow normally/organically?
If its not going to come off even after 2 months after Tax day, thats just BS.
I know we cant technically call it QE, but that’s liquidity injection in the System. It is equivalent of rollback of what QT they did from Jan 2025-Nov 2025.
1. I have explained this many times in prior articles.
2. All this is the old plan concocted under Powell. Now there’s a new sheriff in town, and the new sheriff wants a smaller balance sheet, so all this may change pretty soon.
3. Under the old plan, the balance sheet would expand roughly with the economy (nominal GDP). This was the case over the long term forever before QE before 2009. The balance sheet before 2009 expanded over the long term roughly at the pace of the economy, for reasons I have explained here many times, including charts. The pace of the reserve management purchases may be slightly too small do that – see #4 and chart
4. In Q1, the balance sheet as percent of GDP declined further to 21.0% from 21.1% in Q4. What the RMPs have accomplished is that the decline has slowed.
The more interesting question may now be, who is buying this negative-yielding debt? What does the Fed’s Balance sheet look like these days?
Full faith and credit…
“What does the Fed’s Balance sheet look like these days?”
Last week’s weekly balance sheet was $3 below the balance sheet a month earlier. This is what the balance sheet looks like these days:
Why would anyone buy us debt if the real yield is very low, 0 or negative? I would rather have physical precious metals that even though they don’t pay a dividend they more or less maintain your purchasing power. And you don’t have to pay crazy cost of storage and insurance. That’s your choice. I don’t compare the price of precious metals to the USD or any other Fiat currency for that matter. All of them are are being debased and are doomed for the long run.
Don’t forget, gold can go down as well as up.
Maybe the buyers know something we don’t.
So many people think the debt transmission plumbing by the Fed matters in great depth. Nope. Just read the fiscal idiocy, plug in the debt growth, and you can see the future. The shock absorber of the fed is going to malfunction in time, and it will become far more apparent how deep the poo really is when they seriously start considering cutting Social Security payments to retired people. And the outrage is going to be epic.
OOOh, look at what Elon said, put the oldsters on the ice floe, and fly me to Mars.
Repeat after me, the Fed is simply the debt absorbing plumbing regarding how much paper we can print for seigniorage. Markets will take all that paper, but AT WHAT PRICE/Rate? Tell me when that breaks, and we have a beeeg crisis. I was anticipating 2036, but then this administration can back for round two, and wow, nothing like breaking stuff fast, and letting it all hang out.
In short, stop reading all the Great Stuff on the Fed that Wolf publishes that really does talk about how it works, unlike the zerobrain stuff, and just relax. Because we can’t do anything but vote. LoL.
And guess what, everybody is still parking their short term cash in what? US Treasuries, like Wolf. And I can’t blame them, because we currently don’t have alternatives that really work. But this too will change, and when it does, watch out below.
And like any good inflationary time, equities that soar with inflation. Others get splattered by it, so invest wisely.
Housing crash like last time? Nope, people are still going to pay their mortgages, and the cost of replacement is starting to really bump. You don’t get the same crisis as last time, you get a new one.
Seems to me it’s a sign that there is way too much money sloshing around.
When will it end? Now the IPO’s are sucking up billions, like it’s confetti.
And Musk just said Spacex revenue will be a trillion in 2030! From 18 billion currently, and more in 2031. The banks and lenders are pushing pallets of cash out the door.
Is Warsh holding the bag like his predecessors. We’ll see sooner or later.
Do you likely the SLR will be changed similiar to COVID but permanently or much higher than current? This would allow Fed to essentially print money but not look that way as banks could buy them up and this fuel risk asset growth. Fed balance sheet declines but money significantly increases as a result of less banking regulations.
Trying to sense what this would mean and whether any of that signaling might occur Wednesday.