It’s just not the same anymore with QT and rate hikes. Household balance sheets by wealth category.
By Wolf Richter for WOLF STREET.
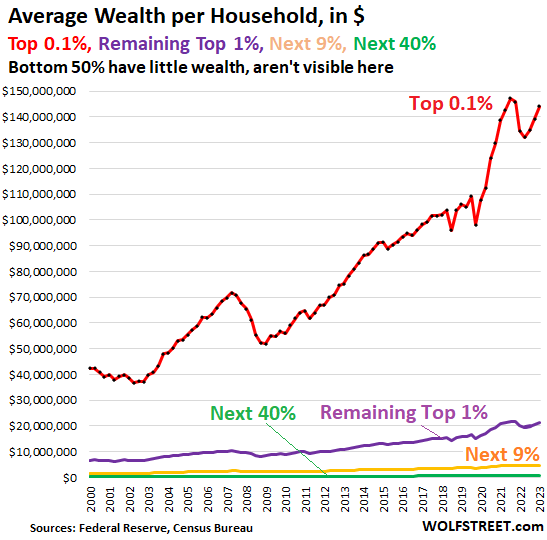
The Fed released its always shocking quarterly data on the distribution of wealth on Friday. It divides US households by category of wealth: The “Top 0.1%,” the “Remaining Top 1%,” the “Next 9%,” the “Next 40%, and the “Bottom 50%.”
What’s always shocking – though we’ve known it all along – is the huge wealth disparity between these groups of households, even between the “Top 0.1%” and the “Remaining 1%,” and even between the “Top 0.1%” and the “Next 9%.”
What’s shocking is the immense wealth disparity. the Top 0.1%, about 130,000 households, hold nearly 13% of the total wealth. The top 10% hold 56% of the total wealth. Their wealth compared to the rest of the Americans, and especially the bottom 50% forms the immense wealth disparity in the US.
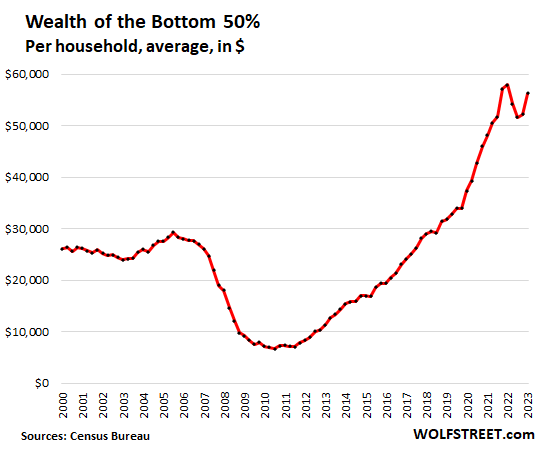
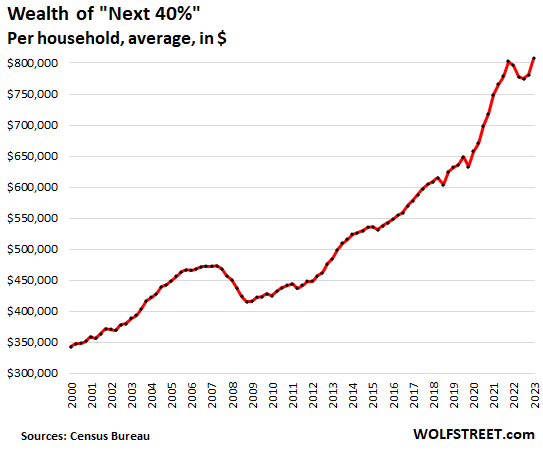
And yet, the majority of Americans have at least some wealth. The “Next 40%” of households – those between the top 10% and the bottom 50% — are doing quite well. Their net worth is on average $807,000. And even the upper portion of the bottom 50% have some wealth (assets minus debts), though it’s not much.
The Fed’s data doesn’t break down the bottom 50% further, but we know from other data that the bottom 20% are somewhere near or in poverty, while the upper portion of the bottom 50% are doing OK.
Wealth by wealth category, average wealth per household, in Q2, 2023 (wealth = assets minus debts):
- “Top “0.1%” (red): $144.1 million. Since Q4 2021, their wealth dropped by $3.1 million on average
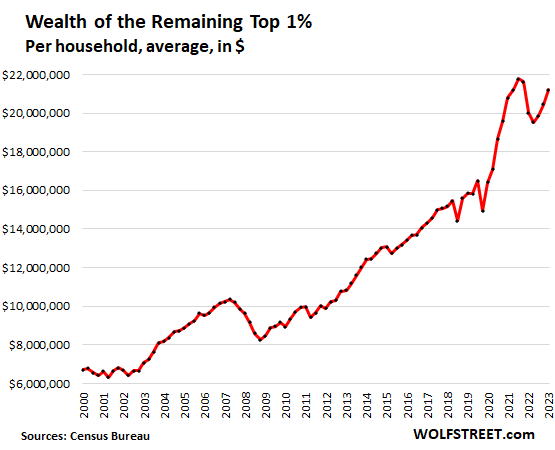
- “Remaining Top 1%” (purple): $21.2 million
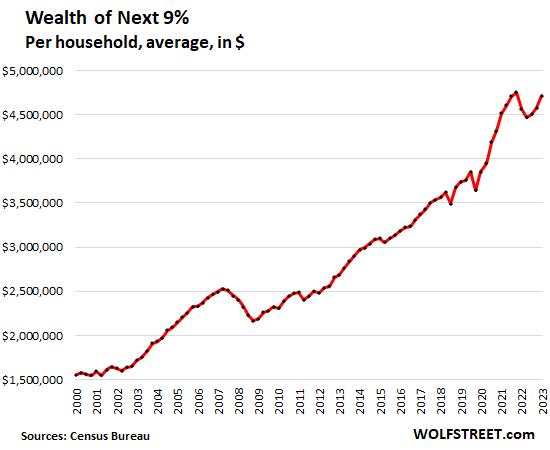
- The Next 9% (yellow): $4.7 million
- “Next 40%” (green): $807,000
- “Bottom 50%” (not visible in the chart): $56,000.
The top 50% (= 65 million households) are between fairly well off to immensely rich. The “middle class” might be the “Next 40%” plus the upper portion of the bottom 50%.
Wealth per household in each wealth category was obtained by dividing the Fed’s wealth category data by the Census Bureau’s number of households. So for example, the Next 40% are by definition 40% of households, or in Q2, nearly 52 million households.
Household balance sheets by wealth category, Q2 2023
Note: “Defined benefit” pensions are classic pensions where beneficiaries are promised a monthly pension for the rest of their lives. This includes classic corporate pension plans, teacher retirement plans, Social Security, etc. “Defined contribution” pensions are 401ks and similar plans.
| Bottom 50%, balance sheet, Q2 2023 $ | |
| Net worth | 56,295 |
| Total Assets | 151,267 |
| Real estate | 81,261 |
| Durables goods | 30,556 |
| Stocks, mutual funds | 3,528 |
| Defined Benefit pension | 5,061 |
| Defined Contribution Pension | 9,273 |
| Private businesses | 3,607 |
| Other assets | 17,983 |
| Total Liabilities | 94,972 |
| Home mortgages | 47,427 |
| Consumer credit | 42,823 |
| Other liabilities | 4,722 |
| Next 40%, balance sheet, Q2 2023, $ | |
| Net worth | 807,313 |
| Total Assets | 963,137 |
| Real estate | 375,920 |
| Durables goods | 63,153 |
| Stocks, mutual funds | 76,578 |
| Defined Benefit pension | 169,511 |
| Defined Contribution Pension | 96,017 |
| Private businesses | 35,912 |
| Other assets | 146,046 |
| Total Liabilities | 155,824 |
| Home mortgages | 114,404 |
| Consumer credit | 34,480 |
| Other liabilities | 6,940 |
| Next 9%, balance sheet, Q2 2023 $ | |
| Net worth | 4,711,287 |
| Total Assets | 5,038,016 |
| Real estate | 1,155,684 |
| Durables goods | 141,536 |
| Stocks, mutual funds | 1,154,434 |
| Defined Benefit pension | 772,783 |
| Defined Contribution Pension | 501,168 |
| Private businesses | 503,693 |
| Other assets | 808,718 |
| Total Liabilities | 326,729 |
| Home mortgages | 280,116 |
| Consumer credit | 28,421 |
| Other liabilities | 18,193 |
| Remaining Top 1%, balance sheet, Q2 2023 $ | |
| Net worth | 21,213,030 |
| Total Assets | 21,761,076 |
| Real estate | 3,843,064 |
| Durables goods | 404,068 |
| Stocks, mutual funds | 9,398,154 |
| Defined Benefit pension | 352,719 |
| Defined Contribution Pension | 686,185 |
| Private businesses | 2,957,698 |
| Other assets | 4,119,188 |
| Total Liabilities | 548,047 |
| Home mortgages | 426,281 |
| Consumer credit | 31,564 |
| Other liabilities | 90,202 |
| Top 0.1%, balance sheet, Q2 2023 $ | |
| Net worth | 144,091,336 |
| Total Assets | 145,236,769 |
| Real estate | 11,200,546 |
| Durables goods | 3,349,574 |
| Stocks, mutual funds | 65,392,845 |
| Defined Benefit pension | 293,812 |
| Defined Contribution Pension | 1,205,150 |
| Private businesses | 41,123,712 |
| Other assets | 22,671,130 |
| Total Liabilities | 1,145,441 |
| Home mortgages | 504,133 |
| Consumer credit | 170,541 |
| Other liabilities | 470,766 |
Primary beneficiaries of Easy Money: Biggest asset holders.
During QE and interest-rate repression, the already wealthiest people got immensely richer, as shown by the explosion of the wealth of the “Top 0.1%” (red line in the top chart) and of the “Remaining Top 1%” (purple line) through 2021.
The Fed has never made a secret out of its official policy, the “Wealth Effect.” Yellen published a paper about it in 2005 when she was head of the San Francisco Fed; Ben Bernanke published an editorial in the Washington Post in 2010, whacking dumfounded Americans over the head with his explanation of why the Fed was going for the wealth effect. The effect was supposed to be that this wealth somehow trickles down.
What we got instead of the wealth-trickledown is the worst inflation in forty years that followed the biggest wealth disparity ever.
I explained the Wealth Effect here, also citing the various references, including those from Yellen and Bernanke.
But the Fed has become quiet about the wealth effect recently. The failed policy has been replaced by a record amount of QT and rate hikes. It’s like “wealth effect” has suddenly become the dirty word that it has always been.
The Fed’s QT and higher interest rates have begun to reverse the wealth effect and have lowered the wealth disparity a little. The Top 0.1% have given up on average $3.1 million of their wealth since the peak in Q4 2021, despite the big gains in Q1 and Q2 this year.
In Q1 and Q2 this year, stocks have seen a historically huge bounce – and you can see in the charts above how part of the lost wealth was recovered. But Q3 is negative for stocks so far. The Fed will release the wealth data for Q3 in three months. The rapid wealth gains or losses at the top are largely due to changes in equity valuations.
Enjoy reading WOLF STREET and want to support it? You can donate. I appreciate it immensely. Click on the mug to find out how:

![]()
I’m happy to learn that the Wealth Effect is slowly being reversed. However, this reversal is being done on a statistical basis only. In other words, the specific people whose interest income was taken from them by the Fed’s QE policy will never be compensated for their loss. The same is true for all those who paid far over FMV for their house. Let’s not forget the pensioners whose plans had to buy garbage peddled by Wall Street in the searched for yield. In the meantime, many of those whose assets increased far above FMV were able to sell them and put the proceeds beyond the reach of QT if not inflation.
“In other words, the specific people whose interest income was taken from them by the Fed’s QE policy will never be compensated for their loss”
This.
And let’s not forget that the asset valuations that go into determining net worth can evaporate very, very quickly (if, say, they have been artificially propped up by 20 yrs of ZIRP rather than actual economic growth…) – see pre and post 2008 home “values” and stock “values”.
ZIRP just created an *illusion* that those assets were more valuable than they were…by destroying the “risk-free” US Treasury rates that most/all fixed income assets are priced at a spread too.
That says *nothing* about the intrinsic value of alternative (to T Bond) investments…it simply herds the ocean (eventually puddle) of USD holders into riskier/more dubious/stupid/doomed investments in an impotent attempt to “restart” the US real economy (disemboweled by superior Chinese/foreign competition post-2000).
Sorry. The wealth disparity has not been reduced if you consider how poorer Americans lost money through inflation, while wealthy companies could pass it through via increases in costs. It will not be actually reduced, ever under our current, tax loop-hole-filled system, unless you assume that the .1% wealthiest Americans report all of their wealth accurately and do not hide any of it off shore in tax shelters or in gold or negotionable, bearer instruments, etc.: e.g., in case the government takes over gold holdings, as they did using Executive Order 6102.
If you are that gullible, I have a bridge that you may be interested in buying in Brooklyn for a very fair price. LOL Read about the Panama Papers or watch “Britain’s Second Empire: The Spider’s Web,” which only discusses 55 trillion pounds hidden in British Commonwealth tax shelters, not the rest of the world’s tax shelters where much more wealth is also hidden or real estate or mines or other resources owned through anonymous entities, e.g., in South America. Who do you think is owed trillions and trillions in US dollars (payable in money usually consisting of US dollars) by virtually every country in the world?
“Read about the Panama Papers”
Read the Pandora Papers if you haven’t. What are the top two countries on the list? What a coinkydink that both of those massively corrupt countries are in the US news almost daily.
Sometimes Fed monetary policy picks winners and losers. Sometimes Fed monetary policy picks losers and losers.
How do I determine how much my Social Security benefit adds to my net worth?
Net present value of future cash flows and average life expectancy for your demographic might work.
I simplify by adding to my net worth the amount of money that would have to be invested in a treasury to generate that cash flow.
I am not sure that Social Security will pay me until I die, and I am surprised that Social Security is still giving money to multi-millionaires (and even multi “billionaires”). I’ll admit that I gave my parents bad advice over 20 years ago to start taking Social Security at 62 since I thought they would be cut off by now. Since Congress can end Social Security for multi-millionaires tomorrow. I plan to start taking it at 62 in a couple years assuming that I will get cut off before I die. Before anyone thinks I am a “silver spoon” kid with “millionaire” parents, my parents are “accidental” multi-millionaires. None of my parents (or grandparents) went to college and my Mom’s parents paid $3K (three grand) for the SF home she grew up in back in the early 1930’s. My parents paid $23K for their first home on the SF Peninsula in the early 1960’s and when they bought another bigger home in the early 1970’s after my grandmother had a stroke and came to live with us for $55K they kept the first Burlingame home and my grandparents’ home in SF as rentals. My Mom quit her job to stay home with her Mom that had a hard time moving around and for most of my life we were broke (40 year old guys that didn’t go to college didn’t make a lot of money) and I worked every day after school from 6th grade to finally graduating from a state college at 24 (to pay my own bills, car expenses, and buy my own clothes). Today Zillow says all three of the homes my parents own (and the crappy Burlingame duplex I bought for under $500K in the mid 1990’s) are all worth over $2mm.
All Social Security payments equal out at 78, no matter when you start taking payments, or at least they used to unless that age has been pushed longer due to “reforms” in the 80s.
So taking SS at 62 only backfires if you live a long long life. My advice to anyone that cared to listen is to take it right away and you’ll be a winner no matter what. Either by outliving your life expectancy (hopefully with healthy years at the end) or collecting more than you would have by waiting if you don’t make it to the 78+ mark.
Of course the people I grew up around were all public employees in a state that did not participate in SS, so when they did earn SS, it was through side jobs and second careers and the benefits were minimal. And again through those “reforms” in the 80s, one of which was the windfall elemination provision, the first step of your benefit calculation (which for some retirees was their entire calculation) was cut in half so one relative’s SS was chopped to $250 from $500 per month.
Congress and Regan thought that $250 per month was a windfall. That’s what your government thinks of the working classes. Not much.
Everybody pays into Social Security, even multimillionaires. So everyone gets a check. It was designed that way back in the 1930s to avoid upper income folks doing everything they can to cut it for lower income folks, like they do for welfare programs. That’s why SS is so popular: even folks in the top 5% or so sees it as a little additional income and a security blanket if everything else goes wrong. So they side with the bottom 50% instead of the top 1%.
It’s also what made the Trump/Biden stimmie payments so popular: everybody got something. It wasn’t viewed as fedgov “taking may hard earned money and giving to THOSE people!”.
If retiring at 62 was self-admittedly “bad advice” for your parents then I am not sure why you think it will be good advice for yourself.
Congress has been remarkably reluctant to tamper with Social Security benefits. it has been 18 years since George W. Bush’s reform proposals got shot down. There hasn’t been a whisper of SS reform in Washington since then.
The main reason SS has not been messed with is that it’s just not that big of a budgetary problem. It spends more than it takes in, but it is fixable with adjustments in taxation.
Medicare and Medicaid are the programs that are wildly underfunded and could not be reasonably fixed with policy. They spend 6 dollars for every one they bring in, roughly.
SpencerG asks:
> If retiring at 62 was self-admittedly “bad advice” for your
> parents then I am not sure why you think it will be good
> advice for yourself.
I don’t plan to “retire” at 62 (I plan to work at least part time until I die) just start getting my Social Security checks as early as I can.
I’m in better shape than most people my age and there is a good chance that I’ll live for 40 more years and politically I think that a Social Security “means test” that cuts off people that “don’t need it” will happen before I die.
I may be wrong, but since I’ll be investing 100% of my Social Security money I still might come out ahead if I get it until I die.
ApartmentInvestor,
It seems you misunderstand how changes in SS benefits are made, such as stretching the retirement age. They’re not made to age groups that have already reached retirement age or are even close to retiring. They’re made to age groups that will retire way in the future. SS has plenty of time to make changes. It sits on a $2.7 trillion Trust Fund (surpluses over the decades) that its current deficits (small) can use up before changes need to become effective. Changes to benefits are effective by year of birth, way in advance of retirement age, and they change the benefits of future retirees. When I was in my 30s, my retirement age was changed. Thanks, Reagan. It went from 65 to 67. And it was phased in slowly. So I had over 30 years to prepare for it.
My strategy is to wait till the last moment when I turn 70 before taking it. Spousal benefits and survivor benefits are part of the reason. My spouse (who is a lot younger and earns less) gets either her own SS or 50% of mine, and mine is going to be a lot bigger than hers. So when she reaches SS retirement age, she can draw 50% of my benefits, while I draw 100%, and she can continue to work and contribute to her SS, and if her SS benefits exceed 50% of mine, she can switch over to hers at 70. Married couple need to research the spousal benefits carefully.
I look at SS as an old-age insurance – insurance in case I live decades past my life expectancy at birth during which time all kinds of S can hit the fan. In that case, the payout is going to be huge.
Social Security is not a welfare program but rather an INSURANCE TRUST FUND that all working people pay into for at least 40 quarter making them eligible for benefits regardless as to their income at the time of claiming SS benefits.
Roughly speaking…an easy problem to solve. Look at the schedule for your SS payouts each month starting with the first eligible month after reaching 62 until you reach a target year (e.g., 70). Sum the total. Then figure out how many years it takes to make up the foregone income. If you think you will live longer than that then wait (i.e., if your primary goal is maximizing total payout) – assuming you can maintain a desired standard of living until reaching the target age. This is obviously a back of the napkin calculation based on nominal dollars. The other consideration Wolf raises (spouse/partner) definitely has to factor into the decision process.
Life expectancy has been dropping lately.
Another issue: can I do the things I want to do at 75 and older I expect/desire to do at 62? Can’t advise you there – that’s about where one’s fun meter/joie de vivre pegs.
Wolf – regarding wealth disparity – is the data saying that 40% of households have an average household income of over 800,000 dollars from your charts – that is impossible and does not make any sense. and their next assets are over 1.5 million dollars – something definitely wrong with this data —
It’s not income…. it’s net worth. Assets minus liabilities.
The data is “wealth” not “income.”
Lots of Americans are fairly wealthy (though it may not feel like it). Who do you think owns directly and indirectly the $47 trillion in homes, the $45 trillion in US stocks, plus a bunch of foreign stocks, the $26 trillion in Treasury securities, the $30 trillion in corporate and housing bonds, the $7 trillion in money market funds, and the $10 trillion in savings deposits?
A great many older people with paid off homes in expensive states who saved over the course of a 40 year career easily meet those numbers. Compound interest favors people with a long time horizon and spending discipline. It’s harder for the younger generations because the Fed purposely inflated real estate by buying MBS and holding interest rates far below market value.
You’re on the right path.
Average does not reflect variance/stnd deviation/skew, etc..
I don’t know if the charts are as precise as they are accurate. A conundrum of chaos caused by imprecision.
Regarding wealth disparity, one has to be in denial to not see the economic carnage that new age of Fed funded kings has wrought.
A dominant system, seeking the lowest production cost, with little or none tariffs on imported products.
Avarice triumphs love.
ApartmentInvestor,
I think you will be doing yourself more harm than you imagine. Yes, means testing is an option before Congress. But Republicans don’t like it because it impacts the rich… and Democrats don’t like it because it turns Social Security into a “welfare program” rather than an old age insurance program… and welfare programs are always subject to getting squeezed.
In addition to what Wolf says, the other consideration is that as soon as you start taking “early” Social Security you are limited in how much you can earn in a year before you have to start paying 50% of all extra income as tax to the Social Security Administration.
From the SSA website… “If you are under full retirement age for the entire year, we deduct $1 from your benefit payments for every $2 you earn above the annual limit. For 2023, that limit is $21,240.”
Obviously it depends on what they consider to be an “earning” as to whether that will impact you or not. But if your apartment rental income is not considered to be earnings for this 50% penalty then I doubt they would be considered such for means testing either.
It is your life of course… I am roughly your age and I get the appeal of having a few years of income that you can bank until you actually retire for good. In fact that is EXACTLY how I intend to use my military Reserve retirement when it starts in fifteen short months. But unless you think that you will lose coverage to means testing in those years between 62 and 67 then it it likely to be YOU limiting your Social Security payouts rather than Congress.
More research may be required…
It is crazy how “retirement” age that always seemed so far off sneaks up on you.
Thanks to Wolf and Spencer about reminding me to think about my wife and income tax.
I have not had a “job” since I was 40 so I’ll get a smaller than average SS check and it will not be a big part of my monthly income.
As a self employed “Apartment Investor” I know I’ll never have to get a W-2 job again since I have plenty of work to keep me busy working for myself.
P.S. To Wolf, If I’m mailing a check to your PO Box should I make it out to “Wolf Richter” or “Wolf Street Corp.”?
“Wolf Street Corp” would be great. Thank you!
Perhaps. I stopped reading your comment when you exhaled the following assertion:
“But Republicans don’t like it because it impacts the rich… and Democrats don’t like it ” because it impacts the rich.
If you wait too take your social security payment until your 70, you have to live to 91 for the cash flow to be equivalent, assuming you spend it as you get it.
Dang…
I don’t know where you are getting your numbers… but the graph in this article shows that you are off by almost eight years. The Social Security breakeven point when a 70 year old retirement surpasses a 62 year old retirement is at year 83. The breakeven point between retiring at 67 and 70 is at year 85… still well below age 91.
The thing is that your 80s are an important time in your retirement planning… simply put, unless you are very lucky or very rich, you will have used up most of your other retirement vehicles by your early 80s. This is particularly true of you started earlier in drawing them down. So having a BIGGER Social Security check each month is critical if you live that long.
Also, in the case of ApartmentInvestor… he doesn’t sound ready to actually retire at 62. As I said, ANYTHING over $21,000 will be taxed at FIFTY PERCENT until he reaches the age of 65 and then at 33% until age 67. If he is well off enough that he is word about means testing Social Security benefits… he could EASILY end up having a negative amortization in which he pays more into Social Security each year for five years than he actually takes out.
You can calculate the future value(FV) of an annuity at a precalculated rate of interest for a predetermined lifespan.
SS uses a rate of increase of about 2-3% until a breakeven point at about age 78-81. At age 62 your SS payment at 2% for 19 years should give you a FV for modeling purposes. You can adjust the model based on actual rates of increase and or expected lifespans based on personal demographics. You can look up the FV formula online.
SS is an inflation adjusted annuity. Find out what it would cost you in present day dollars to pay for an inflation adjusted annuity that is comparable to your SS monthly payment at a future point in time. Then subtract 25% for the anticipated SS shortfall around 2033. After that date the trust fund is depleted so I use a 75% payout, similar to what the SS trustees predict. In my case the present day value is around $400-500,000. Reasonable to add to net worth if so inclined. Articles available on line, just look. Pay close attention to Wolfs language in the box, carefully chosen words.
What is rarely acknowledged is what an incredibly successful system or old age, self funding. insurance program it has been. It is only in danger in the sense that Congress borrowed and spent the trust fund and don’t want too pay it back.
Cantillion effect.
Cantillion effect…
The closer to the “king” effect has been replaced by who is closest to the FED
Except, were one susceptible to accepting the idea of an American oligopoly of kings, by virtue of their concentrated wealth. Which of course, has always been anathema to the core of American society who, foolishly, believed they were free.
Howdy Folks. The big difference is being able to rape and pillage the golden goose. At least the rest of US have something to strive for. Anyone here take one of those rape courses?
Proving once again the American consumer is just fine. Tons of wealth and full employment. Recession is not imminent.
The bottom 50% have a net worth of about 86K. Fifty thousand of this is the equity in their bubble-priced house. This can evaporate faster than it grew. Economic disparity is a main reason for political strife and government downfalls.
Sadly it probably includes a 1M social security pension (40k/yr in the future)
The consumer continues to punch above their weight, but given what some upper middle class consumers earn, their net worth is abysmal, indicating that this class of people are consumers first, not savers. A society of savers would not have gone all in on bigger is better – houses, cars, schools, infrastructure, etc., etc., etc.
Outspending our resources is the new race to the bottom and it’s going to be a very hard fall for consumer-first societies (coupled with climate scorching indulgence makes for a fun future) when the music stops. My only selfish hope now is that the big drop off is at least a few generations away in the future.
And half the country or more seems to have an aggressive fantasy of straight-up pedal-to-the-metal and ignore all warning signals. This is accompanied by a campaign of rage and disparagement toward anyone questioning that. That makes it even more interesting.
Howdy Arya Stark. THEY planned the higher inflation thats coming. Pretty sure the actors are just following a script.
I have too agree. An invasive species that is accused of doing unspeakable things to the golden goose. A mystical creature that once existed but now is about to be eradicated for not genuflecting before one of the kings.
Something trickled down all right. Just like the trickle down we got from all those tax cuts shifted to the deficit. A steady drip to a roaring torrent of bullshit as they laughed all the way to the bank. They say pull up your bootstraps while they drop their drawers.
“The rich get richer and the poor get poorer“
Shelley, 1841
Capital sticks to itself, militarizes, and runs from any accountability. – Rough paraphrase of Marx/Engels. Yes, they had plenty wrong, and birthed many horrors, but this part is hard to disprove.
Still haven’t figured out whom “they” may be.
The fallacy of capitalism as, necessarily , a fascist enterprise is a misunderstanding of the society that the GI’s invented. After seeing so much death and destruction at the behest of the wealthy.
The world that Marx was trying to quantify was a primitive hypothesis, based on observations of everyday life that have been obsolete for, several centuries.
This is manifestly untrue. The poor in the US are miles ahead of the poor in Africa and India (crapping in the fields, living on miller floor and a little oil, working 60 hours a week, no running water or electricity). That’s why people are pouring across our southern border, because manual labor in the US pays 10 or 20 times what it does in Central America.
It’s a great quote. Which begs the question:
Is this descriptive of America or Dickensian England.
Herp – if the ‘bootstrap’ argument comes up in a conversation, i’m always fascinated by responses to my rejoinder of the then, in the interests of ‘equality’, obvious necessity of implementing a 100% estate-tax policy…
may we all find a better day.
Leaving one’s life earnings for the federal government seems a good incentive to not leave any, in so far as one can plan to spend or give it all away. Even the uber-wealthy that rail about low tax rates on their own don’t seem interested in sending extra checks to the IRS.
So then, the main endeavor of people in our society is to end up with the one dynasty that has all the money (and so “owns” everything) and then builds a nation or government as they see fit? Maybe even a museum or two, or some charities named after them? And of course enough to relatives to keep the dynasty going forever.
Seems like a stupid “purpose” to base your thinking on…..who thought that inane goal up? Someone teach you?
But yeah, it then becomes logical to never give the IRS (or anything/anyone else one doesn’t like) any of this “hard earned money”. I Just love that phrase)
Calvin said God just predestined it all, so it’s not even a choice. maybe?
And so that’s why you can’t call the dynasty builder a pig, or make him give the IRS money…..I guess…..sorta makes sense…..
Oh yeah, we had a discussion here a while back about the economic use of bootstraps. Wolf said he actually owned a pair with straps once, but didn’t have the strength in his fingers to lift himself up by them….maybe some folks do, is that your point?
There is no need to apply a 100 PCT wealth tax as a knee jerk effort to assimilate the rejoinder. Wealth in America has always been understood by the everyday person to be a privilege that bore the burden of responsibility.
Don’t want to offend the $ 100 million welchers whose existence is dependent on the success of the propaganda campaign.
Somehow, they deserve it.
“Given the choice, I’d rather we were younger, albeit poorer, again. Who wouldn’t?“
Not everyone has this perspective. Wife and I are in our early 40s, in the top 5%, have no debt, and wouldn’t trade it to go back to our 20s or 30s. In fact, most research shows that people get happier as they age (and presumably grow more wealthy).
If the housing bubble corrects and the stock market sours I wonder how many folks in the bottom 90% will go from wealth positive to wealth negative.
There are so many one-offs that are now tapering out that feuled this enormous bubble. Off shoring when there were much larger wage disparities and cheap fuel for shipping, killing off defined pensions and forcing all that money into the stock market via 401ks now diced into so many bits that shareholders no longer enact discipline on poorly performing companies, private equity buying up wealthy companies with borrowed money then stripping the wealth out and selling the bones in an IPO, gov’t protecting rentier rackets like healthcare and higher education that raise costs without adding additional value. There is too much to list and much of it has been played out. What now?
Good points….
The current situation appears to be unsustainable… Which means that a downturn will happen sooner than later, and it will be compounded by a crash in stock and real estate markets.
The ILLUSION of wealth today has never been greater, probably only exceeded during the summer of 1929…
I hope that answers your question of “What now?”
Re private (pirate) equity, j Powell was a partner in the Carlyle group before Obama nominated him for fed chair. The system really is rigged.
Trump nominated Powell to be Fed chair to replace Yellen, who’d been nominated by Obama. Powell is a Republican, Powell is Trump’s man.
Yes. But….Powell was nominated to be a Fed Reserve Board governor by Obama.
A lawyer by trade.
Reason is not in their vocabulary.
But if you add the “T”…
They get all excited ;)
I think these tables are an indication that monetary policy is grossly mismanaged. If anybody cared, you’d think we’d see some Congressional hearings on the matter.
Congress critters are interested in their take before any other consideration. You’d think those legions of fool PhDs at the Fed would understand that Congress can’t be trusted with free money.
There’s a school of thought that the Fed is any but independent.
I question your logic. I agree Congress doesn’t care. I disagree the poor don’t vote, or had their voting rights stripped away. They do vote! They are the reason we have representation that is ineffective. They were told free lunch, and they believe that! So they voted for it! So, you may be correct that the future Pres. will water the lawn with Gatorade, it will make us carbon neutral….. but it will be because WE , the people, voted for it!
No, its Brawndo. Its what plants crave. Gatoraide is for something else.
I’d love to see proof of one single person that has had legal voting rights stripped away.
Votes are effectively stripped away via gerrymandering, predominantly performed by one party. We also see restrictions on access. For example, in this day and age, there is no reason people should not vote via mail or electronically, but some states prohibit it. They’ll also reduce physical voting access in poor areas, making people wait in line 2 to 8 hours or more. Meanwhile, in wealthy areas, people almost always vote without these problems.
To say voting rights are not eroded in some locations is defying obvious evidence. I don’t know how common it is, but it’s ridiculous to see any of it.
Bobber, you have to be 12 years old without even an ounce of historical memory to think that “gerrymandering (is) predominantly performed by one party.” If that were the case then for most of my life that party would be the Democrats. It wasn’t until after the 2010 Census that the Republicans got into that game in a big way. But even now, Massachusetts… a state that routinely has a third of its population vote for a Republican President… has ZERO Republicans in Congress among its NINE representatives. It has been like that since 1996. Other “Blue” states are likewise tilted.
In other words, both sides do it… and no… it doesn’t mean that you have lost your voting rights. It means that politics ain’t beanbag.
The rest of your post is likewise just MSNBC talking points with no basis in reality. If you want to see people’s voting rights ACTUALLY being abridged… go see how some Democratic areas treat their military ballots. Try King County, Washington in the 2004 election for a specific example that ended up in court.
Spencer, you helped make my case. Voting rights are restricted. Your points are reactionary dealing with party affiliation.
Bobber, are you being intentionally funny or just deliberately obtuse?
I especially love, “in this day and age, there is no reason people should not vote via mail or electronically.” Ha! Among other reasons, it’s too easy to cheat, as 2020 proved.
I had a friend who used to say to people like you, you’re either stupid or ignorant. And I don’t think your stupid.
Ergo: The systemic near-collapse circa 2008 was reversed not by economic, monetary, fiscal and technological innovation but by underpaying and overworking average working Americans … year after tedious year.
Good point!
And the systemic near-collapse was caused by a myopic Fed and greedy bankers.
The current situation is not that much different from late 2007, except that most of the egregious lending this time is to corporations and commercial real estate owners, rather than to residential real estate speculators.
This time there is more systemic (read sticky services) inflation than in 2007… which means that the Fed will not be able to drop rates to zero and start printing money again this time without repeating a 1970s style runaway inflation.
= A much worse recession than most understand is coming
Exactly
How are pensions valued? Is it the cash out value, estimated proceeds from future distributions, or something else?
I think it’s the value of fixed income you’d need to achieve the same payout, if I’m right then higher rates means the amount required to pay out a given amount has fallen considerably, thereby decreasing the pension price. Happy to be corrected on that.
I assume you’re referring to this eye-popper…. “Defined Benefit pension for the 1%. And I think you have it right. they have an annuity that would be theoretically worth that much in risk-free assets. In times of super low rates, that number is crazeballs high. Hell, at 0% rates, it’s an infinite amount of money.
I am, though, shocked to see that in the 1% category. I wouldn’t think that many 1%ers are of the DB pension lineage. I highly question the accuracy of that number.
You should see the executive pension plans.
It could be a lot of public employee pensions from states like IL, CA, etc. Like a 4% return in perpetuity for a household bringing in 400k from the government in retirement might be worth 10M, I don’t know. Tons of those folks out there anyway.
David Novak, former CEO of Yum Brands left with a pension worth $234 million. I think he holds the record.
One of my college friends got a “firefighter” job after college.
He worked with the guys below and has a DB pension of over $200K/year + Amazing Health, Dental and Visions plans (I pay almost $3K.month for less)
https://transparentcalifornia.com/pensions/2021/contra-costa-county-pension/?e=CCC%20FIRE%20PROTECTION%20DISTRICT
Next weekend I’ll see his new GT3 Touring for the first time at the Rennsport Reunion at Lagna Seca (His wife also has a six figure DB pension from the Community College she worked for and they just built a new garage for the new GT3, his GT4 and 914-6).
Be interesting to see the ages represented within those income categories. Defined benefit pensions where I worked were phased out almost a couple decades ago. Only older still had any of that benefit. Maybe the 22 milllion or so government employees stiil get them, just don’t know.
You should see the California State CALPERS and CALSTRS pensions at http://www.transparentcalifornia.com Highest CALPERS pension is 551k per year.
@ Apartment Investor,
“One of my college friends got a “firefighter” job after college. He worked with the guys below and has a DB pension of over $200K/year + Amazing Health, Dental and Visions plans (I pay almost $3K.month for less)”
You had me at 914-6… but the above…ok, wow, I do NOT want to hear any more whining about how the middle class, blue collar, or whatever have been getting screwed. Firemen (firepeople?) are as middle class/blue collar as it gets.
(flame suit on)
This clearly shows that the top 50% are keeping the economy going in terms of consumer spending. Granted, $2T in extra federal spending goes a long way towards keeping a recession at bay, but that’s nothing compared to this wealth affect.
The top half are getting stock appreciation and asset appreciation.
Who pays for that, ultimately? The little guy.
It’s always the little guy keeping the system going, in the end.
So, if I tap my red slippers together like Dorothy and say, three times, “I am wealthy” … I’ll be wealthy. Got it.
Wolf, are you able to give (or can you point us to) a reasonably dumbed-down explanation of how defined and contribution benefits are actually calculated to arrive at a figure for wealth? Is it a snapshot of an individual’s current 401k balance and/or imaginary amount their defined pension would pay over a lifetime if they retired now? Or are assumptions being made about amounts available at retirement age and then accruals based on that? Or…?
Defined benefits: Not sure how they did it, and I don’t have the time to did it out. But the standard calculation of future cashflows is “net present value.” You can look up “net present value” to get the formula. In addition, average life expectancy would figure in there.
Defined contributions (401k) are valued at current market value of the assets in it.
Those numbers mimic bitcoin and most other crypto coin owners too. The top 1% own 90% of bitcoins.
Silly to invest in such an a poorly distributed asset.
It could be that it was the Bitcoin holdings that made the owners member of the 1% club, given the insane “appreciation”. I know of zero, zero, HNW types who would do anything other than short BTC so they could more fully enjoy its tanking.
The problem with bitcoin, is that it has been very much used by criminals both actual and political.
Crypto is worthless when the Grid goes down. And it will.
Your home is worthless too when the grid goes down. Now one is going to buy it, no one can even pay for it when the grid goes down. Nor will you be able to buy food, get fuel for your generator, etc.
Does this include the actuarial value of defined benefit pensions and social security ?
If do, that’s a huge omission, substantially increasing the wealth of many.
Another factor not evident from the raw data (especially lower down) is that it doesn’t control for age. It’s no surprise that the middle aged and pre-retireees are a lot wealthier than the young
Totally other topic – the shape of the top 0.1% curve looks awfully like the shape of the Fed balance sheet.
1. Yes, you just didn’t read it. Maybe you just looked at the pictures?
2. Goofball. In terms of the economy, age of the household (these are HOUSEHOLDS) doesn’t make one iota of difference. Older people naturally have more time to accumulate wealth, though some end up homeless. Some people are born rich, etc.
3. Yes.
Urban Dictionary:
Goofball, a term of endearment between online friends. LOL
Asset holders(especially homeowners) won the lottery if they owned a home before the pandemic. Just imagine, all of them up hundreds of thousands of dollars. The rest of us are outside looking in.
Think of it this way, SOL. It doesn’t do them any good, if they need someplace to live. It could be worth 10x, but what are all these owners going to do, sell and rent, or be homeless to enjoy their “winnings”? You may as well say that all business owners, and stock holders and classic car owners and whatever other assets you covet are lottery winners, too. Except they aren’t, because everything is more expensive now!
(yes, I hate inflation, and this all pisses me off)
SOL writes:
> Asset holders(especially homeowners) won the lottery if
> they owned a home before the pandemic. Just imagine,
> all of them up hundreds of thousands of dollars. The
> rest of us are outside looking in.
It is nice to look at a balance sheet and see in increase in net worth, but my “cash flow” is actually less than the pre-pandemic years. Construction/Renovation costs in CA have gone up even faster than property values, so has the cost of insurance and utilities.
You’re right about the “outside looking in” feeling. I’m in the bottom income percentile and every day I feel like l’m an alien in my own country and cannot relate to all the phenomenal wealth around me. I’ve never felt so poor and outside of america. It’s disorienting in a way. Oh well, sorry for the downer.
I’m right there with you , despite working hard and contributing to a better environment. I’ve lived a very frugal like and thought at 59 I’d have some breathing room by now but instead I’m tightening more and live more frugally. Never thought I’d be at this place financially after being financially responsible for decades. It’s not what you know it’s who you know which will cause the downfall of this BS fiscal policy
If you’r moving between the 0.1 percent to the next group or vice versa moving from the remaining top percent to the top 0.1 percent it has an effect on the 0.1 group that make it seems stronger , close to the edge we meet the top.perfomers.
If you are born with not much and you work your azz off, you get something.
That’s it.
Enjoy the shows, the sunrises and sunsets.
Crippling medical debt or just crippled? Not all workers have the aptitude for high earnings…hopefully enough to catch a show once in awhile though? That’s still cheaper than therapy.
I think the disparity wouldn’t be such an eye-gouger if it weren’t for QOL going backwards.
Backwards in the sense that all of the important items, needs- staples of a first world country such as shelter, vehicles & medical, food are becoming truly unaffordable long term for many of its residents.
Uhh no.
Just was putting the charts in a poetical light.
I know so many who started out with zilch. Yeah sure the avearge divorced parents, college, sales jobs etc.
Where are they now? Kids, house. Net worth maybe 200k @ 55-60.
That’s America!
Yet the top .01, is born with $10 mill. Then has $70 mill. When they are 55-60…
anyway, enjoy the sunsets.
“If you are born with not much and you work your azz off, you get something”
Perhaps, if you’re lucky. More likely in all of human history you got the minimum required to keep your family alive and the balance of your labor, and theirs, goes to the laird. You get just enough to keep the clubs and torches and pitchforks out of the hands of the peasants.
But apparently there’s this one place where they neglected to disarm the peasants, so they have to keep buying them off. That’ll work until it doesn’t. Wealth disparity has always led to envy and the destruction of the offensively rich when the downtrodden have the means and get mad enough, unless the offensively rich are smart and publicly give away lots of loot first. Like bribing an italian customs official with a sacrificial bottle of Scotch that he could just take anyway.
The US is a pretty nice country to be rich in, but the not rich are not that badly off either, as these charts seem to show. Sweet balancing act, hope it doesn’t wobble.
Luck definitely plays a part in the people who really hit it big, but hard work, education, and an entrepreneurial outlook almost inevitably reward work in a relatively free economy like the US over a 40 year timespan. Sure you can have poor health or other setbacks. But most people who fit that description do just fine and luck has little to do with it.
It is interesting that when writing the laws of the land that John Adams had just recently successfully defended british soldiers who violently quelled a riot.
Legaleses might be the height of our brilliance. It’s tough to understand but boy does it make sense when you do.
This isn’t true anymore in many cases perhaps in decades past but not for decades.
Hi Wolf,
I am a 23 year old who recently graduated from college and now work as as software engineer. I understood the wealth effect from your blog because I live in Silicon Valley where the median home price is $1.8 million USD and where almost every married couple above the age of 40-50 has a net worth of at least $4 million combined.
I am currently at 200k net worth and am far ahead of the bottom 50%. I want to reach the next 40% (800k) as fast as possible.
For financial independence, everyone should aspire to get to $5 million (90-99th percentile)
If you see this data source as of Quarter 2 of 2023,
https://fred.stlouisfed.org/release/tables?rid=453&eid=813668
You will see that
The Total Net Worth of the 90th to 99th percentiles is:
$54,808,044 million USD
The Total Number of Households in 90th to 99th percentiles
11,890,546 households.
This means that the average household net worth for the 90th to 99th percentile:
$4.609 million USD.
RTGDFA.
That’s the exact data I cited, from the Federal Reserve, released on Friday. Except I gave you charts and tables and did the per-household math for you. Why does this site attract people who cannot read and then feel compelled to post comments?
For the trickle down wisdom effect?
Sam wrote:
> I live in Silicon Valley where the median home price is $1.8 million
> USD and where almost every married couple above the age of
> 40-50 has a net worth of at least $4 million combined.
My wife (with an ivy league undergrad degrees) is close to 50 and grew up in the Silicon Valley (Portola Valley) and I am close to 60 and grew up farther up the Peninsula and I can tell you that nowhere near “almost every” married couple over 40 has a net worth of $4 million. Most (almost all) the people I know still have a lot of mortgage debt (most “owe” more than they originally paid for their Bay Area homes and just a tiny fraction of the “parents” of the people I know have a net worth over $4mm (my wife’s parents are worth less than $4mm still have a massive mortgage that was used to put three kids through college and grad school).
Portola Valley is very nice. Home values here are very high, however (4 million+). Thanks for this insight. I would have guessed these tech people would have been able to accumulate a greater degree of wealth.
My in-laws live in a “modest” Portola Valley home (that Zillow says is worth just over $3mm). Most of my wife’s close friends went to top 5 colleges and do real well but it is hard to “accumulate wealth” when you spend like “drunken sailors” sending your kids to private schools (Menlo and Woodside Priory are both over $58K/year), pay $20K a year to share a ski cabin (Plus the cost of passes and equipment for the whole family) and lease a new Tesla and Range Rover ever few years (or two Teslas and a Range Rover after you learn that the Model X is not a great Tahoe SUV).
I’m genuinely confused by all these young 20-somethings bemoaning the fact that they’re not instantly rich out of college, while also having greater wealth than 99.999% of all Americans who have ever come before you.
I have a friend who is 26 and goes through regular bouts of deep depression because his income is “only” $135k. Today he was crying because he can’t afford a 650k luxury condo in his preferred neighborhood of a major metro area. I have coworkers 12 years younger than me who recently embarked on a failed campaign to get our managers to increase their pay to match mine, despite the fact that I have 3-4x the work experience they have. Little do they know that they’re already making almost twice what I made at their age.
If you have 200k at 23, you’ll be fine. What does it matter if you hit 800k at 30, 35, or god forbid, 40!!! Trust me, when you hit that 800k, it’s not like you’ll magically stop stressing about your wealth. Odds are decent that you’ll only be stressing about it MORE. You’ll have spent so long making it your top priority, that you’ll have nothing else to give your life meaning aside from accumulating more, more, and more.
A life well lived has very little to do with net worth, real estate, or stock portfolios. It has much more to do with relationships, family, community, and an impactful purpose. Best to learn that lesson sooner rather than later.
I blame television. Thirty years ago everything on TV was ordinary middle class folks scraping by but finding happiness in spite of it. Think of all the family sitcoms of the 90s. Nowadays everything in pop culture is billionaires and bling and the most expensive things imaginable. Shows like Succession and real housewives make people think that exceptional wealth should be easily attainable. Except none of them seems the least bit happy
Kern – look back to ‘Lifestyles of the Rich&Famous’ and the continuing, inexplicable (to me, anyway) continuing ‘Murican appetite for news and entertainment about British (or any country’s, really) royalty (demonstrating that Easy Street (or, perhaps just a more-interesting life) should be obtainable by simple accident of birth? Pray, has anyone ever heard a fortune-teller inform ANYONE that their ‘prior lives’ or ancestors were never royalty, but essentially those of stablehands?).
may we all find a better day.
Equal opportunity.
“…why there hasn’t been a shareholder revolt…”
When the shares are voted by Vanguard and Blackrock, not likely.
Fascinating stats. Thanks for presenting this Wolf.
Focusing on the “Next 40%”, which to me represents what’s left of the Great American Middle Class:
Net worth ~$800K, which includes:
Real estate assets ~$260K
Paper wealth assets ~ $300K
First of all, $800K sounds like a lot, but is really not much money at all in today’s expensive world. One medical event and it is gone.
But a good part is a result of inflated asset values over the past decade.
This is why the Fed/Treasury do not want the housing bubble to deflate signficantly and why they have been allowing major companies to juice stock prices with debt (used to be not allowed because it is a very bad idea).
We are one significant crisis away from a serous and society crashing Depression. This is why the US government is pulling out all the stops to prevent the dollar from losing its hegemonic status in the world. This is also why Powell desperately gambled with the inflation impulse experiment from COVID, hoping to gain some breathing room with debt.
But where we are now in our “economy”, trying to save the day is like “threading a needle through the eye of a needle”.
I guess young people are in the bottom 10% of the bottom 50%. Student Loan payments are more than their chequing accounts lol.
A striking similarity between the top 0.1% and the bottom 50% was that both socioeconomic markers gained a lot from 2020 to 2022. That’s about it.
I was totally impoverished in college, in grad school, and after grad school when I graduated with my first masters into the Double Dip recession. And so were most of my friends. This is normal. Or at least was normal. Not many people are born with a silver spoon in their mouth. It takes time to work through all this.
Same here. It took me 10 years to save the bare minimum for a downpayment on a house (and the government did not care that I had no wealth, and still taxed me as if I did). So many young seem to think that if they can’t get rich in the next 5 years, or the road looks steep, the deck is stacked impossibly against them. B.S. Nose to the grindstone, work HARD (not TikTock/snowflake hard) for a decade or TWO, and SAVE money, like as in 30%, work through ALL your vacations, and THEN report back. Chances are good you’re 90%th for your age by then. That’s what a lot of us did, and IT SUCKED.
Social media must have a huge impact on this mindset. All we (of the 50-70 age) had was Lifestyles of the Rich & Famous to torture us. The <50 crowd today have the Kardashians and whatever other glamorous celebs on 5 different social media sites triggering all kinds of FOMO.
Nah. I’m <50, a millenial. Graduated BS 2009 into the GFC, had interned with a company for 2 yers that made no offers to the interns. F it…got a MS and really liked research, worked hard for a PhD. Took a bit to pay off debt and catch up on replacing junker cars, etc. but, doing great. Be careful with your generalizations. I am sure that you worked hard to dig out of the double dip recession, as Wolf has stated that he did, but dont forget that the Kardashian crowd that you are belittling had to deal with economic trouble too.
I understand that recessions hurt everyone. But disinflation bringing prices back to affordable levels for those that don’t have the hard assets now seems to hurt the rich more than the the less well off. Why is disinflation being resisted and a soft landing so eagerly anticipated? Is it another version of the “trickle down economics” lies being sold to the masses?
Disinflation is merely the slowing of the rate of inflation. You mean DEflation.
Deflation.
The argument goes: why buy something today if you expect prices to drop again tomorrow?
Deflation obviously hurts borrowers.
Deflation can be a disincentive to investment.
It turns on prevailing economic conditions and presumed group psychology.
“Trickle down economics”…
Before I say this, know that since Trump, I hate Republicans at least as much as Democrats. So this is meant to be half funny more than a partisan political statement:
The Dems believe in “trickle up economics “. I don’t know if they’re just stupid, or if they are actually quite cunning and greedy, but they give out a bunch of money to dumb people, (and call themselves Robin Hood), and those dumb people turn around and waste it all, giving it to greedy corporations, which in turn gives money to rich asset holders, “trickling up”. Corporate Democrats get rich.
I’m not knocking it. Whatever works. But it’s absurd when they use the term “trickle down economics” like a bad word. Both sides suck balls.
I’m not saying this as a jilted poor person who missed out. I’m just saying this as a casual observer. It’s funny, but it’s not.
I find this interesting…
“Top “0.1%” (red): $144.1 million. Since Q4 2021, their wealth dropped by $3.1 million on average
“Remaining Top 1%” (purple): $21.2 million”
Not that I’ll be in either category but what’s up with the .1% on average giving up ‘only’ 3.1 million versus the remaining giving up the much higher average?
Is this just a balance between populations of each group or is there a financial reason (bad investments?) type correlation?
Great report. Because the rich has the vast majority of the assets, wealth disparity is directly correlated with money printing. When FED prints money, rich get richer and poor get even more poorer and vice versa. The increase in wealth in Q1 and Q2 arises from the fed instantly printing of $300 billion in March 2023.
I don’t know what FED tries to do, but the result is whenever they print more money, the wealth disparity becomes wider. But they stubbornly print gigantic sums of money again and again and again…. Speed of QT never becomes even close to QE.
10 year US Treasury yields are moving up nicely and are now north of 4.5% for the first time in almost 20 years.
Great article! Two graphs I’d love to see: log-scale plot of the 4 lines (top 0.1%, remaining 1%, next 9%, next 40%), something like %-age of total wealth for each of the groups (to make it easier to see that next 40% increased in share over the past few years.
In finance, log scale charts are only used if you try to hide some embarrassing truth, such as surging wealth disparity, expressed in millions of dollars, from QE and interest rate repression.
Log scale charts serve their purpose in engineering and science, but for finance they’re the ultimate and most insidious form of visual manipulation.
Precisely, Thanks for the podcast you just posted :) I enjoy your podcasts immensely. I work with my hands and audio information is an excellent learning tool. I find you to be an excellent teacher and find your teaching invaluable. Thank you dear Wolf
Thanks!!
So what can we say to dispute these charts?
This is all just politics of envy and victim thinking. Every penny of wealth is earned in our capitalist economy. Correct?
“This is all just politics of envy and victim thinking.”
BS. It’s the Fed’s monetary policies that created the biggest wealth disparity ever. How can you refuse to see this? It was part of its official policy, the “wealth effect,” as I explained.
Do you feel entitled? Do you feel that the Fed owes you money-printing and interest-rate-repression forever to keep inflating the prices of your assets forever, so that you can take credit for this Fed-triggered asset-price inflation? Is that the new sense of entitlement swirling around out there?
You may be disappointed. Now we have inflation, and QE is over.
I agree with all of that, except one part, which is “QE is over”. I hope that is true, but I have serious doubts. Since we’re using Japanese economics here, if these deficits continue to rise, the interest debt won’t be serviceable without yield curve control as is the situation in Japan. And yield curve control implies more QE.
I gotta see something on the fiscal side of the house before I start believing QE is over. This “deficits don’t matter” mentality looks reckless to me.
I think you forgot to add /sarc-off.
Yes, I forgot the sarc.
Claims of victim mentality and envy are weak reactionary defenses to a monetary policy that has obviously favored wealth holders for decades.
Decades ago wealth holders did put the wealth that was accumulated back into creating jobs raising salaries to reflect that prosperity that was created.
This hasn’t been so for decades
Wolf when did this sleight of hand begin to happen?
The bottom 50% has seen nominal wealth double since 2000, but the BLS CPI calculator tells us that the dollar is now pretty close to half what it was worth back then. Worse yet, anybody who was old enough to understand money in 2000 can confirm that the dollar has lost a good bit more than half its value in reality if asset/energy/food prices are considered… You know, the stuff that people actually need on a daily basis. So in real real terms (not gov-reported real terms), the bottom 50% has probably lost significant wealth since 2000.
“anybody who was old enough to understand money in 2000 can confirm that the dollar has lost a good bit more than half its value in reality”
In the early 2000s, the local town pool had a soda vending machine which charged $0.50 for a 12oz can and $1 for a 20oz bottle.
Today, the vending machine in my company’s lunchroom charges $1.75 for the same 12oz can – over 3x more.
I know this is one super-specific anecdote, but I keep thinking about it.
But the quality of soda has gone way up since 2000! /s
1) Unfulfilled promises bs. The republican produces the buck. The buck
stops at the white house. If the republican will not produce the buck,
for whatever reasons, the gov will shut down, unless the gov cuts.
2) The next president might cut gov debt to mitigate congress, reduces
our global profile and promises, to save our empire.
3) The next president will chop the Pareto top and be with the boys.
4) The top 0.1% : forget about your $65M DB pension. Amortization will chew up your durable goods. Socks & RE will deflate in real terms.
5) The Pareto top will deflate along with Trump & Biden who already lost their 0.1% assets and unfulfilled promises
It’s true that many forms of wealth can dissipate quickly, like stocks and RE, but that’s not true if the Fed prints money in response to every asset price downturn. The Fed has come to the “rescue” very quickly after the last two significant asset price falls, so asset prices never really suffered a fall for any serious length of time. The “rescue”, of course, was really just money printing that sowed the seeds of inflation, which takes from the 90% and gives to the top 10%.
At the same time, the Fed sees no problem with asset prices rising 300% in a decade. That’s not considered inflation in the Fed’s deranged playbook.
In short, the dramatic wealth concentration we’ve seen will continue and likely expand if the Fed continues its current monetary policy of supporting stock and RE markets at every sign of weakness.
You put that beautifully! The Fed seems to be the instigator of our distorted economy.
RTGDFA. At least read the headline!
I’m always struck by people who refuse to read the article, or even the headline, and that then post BS about that article. This article has wealth categories, it’s wealth by wealth category, and it’s about wealth disparity between these categories.
If the wealth effect can support an increase in consumption expenditures in a time of depressed demand surely a reversal of the wealth effect can reduce those expenditures in times of inflation.
That should be obvious, but the Fed doesn’t incorporate it into policy. We just saw 20% CPI inflation in 3 years and 300% asset inflation in a decade. Do we see the Fed trying to reduce inflated asset prices? No. We see the opposite. The Fed is slow walking QT in an attempt to reduce CPI inflation while supporting ridiculously high asset prices.
This may be why long rates and stocks are up this year. People are starting to realize the Fed has no interest in reducing asset prices. It’s inflation fighting attempts are half hearted.
Ditto Bobber. FED has no interest in pushing the asset prices down as this is going to hurt them, their masters and FnF.
It’s a little difficult for them to do. Cities, counties, schools, etc, all rely on real estate taxes to fund their follies. If asset prices drop dramatically, tax receipts crater and all the highly paid administrators are shown the door…. right after the clerical and janitorial staff that does actual work gets launched.
The thing you’re clamboring for probably won’t work out the way you think it will. Rarely does.
El Katz,
In the great majority of locations, the RE valuations are used to allocate the local tax burden, not determine the amount of tax. So the total RE tax burden is ultimately based on the local government budget, not RE valuations.
For example, if RE prices drop 20% across the board next year, they’ll just increase the property tax rates upward to try and arrive at the same tax level to fund the budget. If RE taxes go up 20% across the board, they should be reducing the property tax rate, unless they’ve dramatically increased the budget because of increased spending, inflation, etc.
@El Katz:
It’d work out if FED has the will.
So, it is OK to inflate the housing prices by more than 60% in last 3 years thus making basic needs of housing out of reach of millions of young working families and future generations as well.
But looks like, it is not OK to normalize this by bringing home prices down.
In my experience, when my home valuation went up, my taxes followed. In one neighborhood, the prior owner did not file an appeal when the neighborhood underwent a re-assessment and the home I purchased from him had a higher tax payment than one across the street that was larger, similarly situated, and had a lower assessed value because that owner took the time to appeal.
In CA, the sale price of the property triggers a re-assessment (whatever you pay is the new basis for real estate tax purposes). The purchase price, factored against the assessment (it was 1.25% in Orange County) determined your property tax.
If what you’re saying is true, whey are “portable tax basis” and homestead exemptions, etc., even a thing?
“Slow-walking”?
Approximately 90 Billion per month is starting to add up. The effect of QT does not get headlines, but there are nearly a trillion dollars of bonds that the fed no longer holds and investors have purchased (at higher yields).
Again, perfectly expressed!
Business Insider reports that China doesn’t have enough people to fill all of their housing; a tremendous source of wealth disparity for us, while we work to generate enough homeless to fill all of our city streets. Perhaps a review of the different methods of food, clothing, and mainly shelter would provide insights.
There are homeless people in China too. But China’s police have a more muscular approach to people living on the streets, and so you don’t see them.
Chinese retail investors own empty apartments like American retail investors own stocks. Same thing. Results may vary.
After, two full days without an article, I was preparing to organize a search party to verify Wolf’s well being.
I generally prefer Pew’s definition of middle class which is defined around the median (2/3rds to 2x).
Nationally, the last Fed SCF was released in 2020 and put the 2019 median household net worth at $121,700… With some very sloppy inflation adjustment lets call it $146k which would put middle class net worth somewhere between $97,000 and $292,000.
Likewise median household income for 2022 was $74,580 which under Pew’s definition, would put middle income between $49,720 and $149,160.
RTGDFA.
What is this article about? The median wealth???? NOPE. It was about:
WEALTH DISPARITY
AT LEAST READ THE TITLE.
It’s exhausting to deal with commenters who refuse to read anything and then feel compelled to comment.
Violation of commenting guideline #1
https://wolfstreet.com/2022/08/27/updated-guidelines-for-commenting-on-wolf-street/
I have already deleted a bunch of comments to this effect. I just left this up as an example. If you cannot read the article, don’t comment on the article.
Doesn’t Wolf usually publish less on the weekend? That’s the pattern I’ve noticed at least
I was just teasing, if you look at the recent post history, rarely a day goes by without a post on something. Wolf is incredibly prolific. Unbelievably so given the depth with which he approaches the data, which I find is often full of shadowy definitions which he untangles so well. It’s what keeps me coming back.
I didn’t publish on Saturday, but on Sunday, because on Saturday I was busy all day buying a used 2020 Fusion Hybrid for a cream puff price lol — to replace our 2018 Fusion Hybrid that got totaled the other day. So I missed one day on the weekend. Except this time, it was Saturday, rather than Sunday.
Wolf – congrats on finding a satisfactory replacement voiture. More importantly, hopes that your good lady has suffered no ill effects from the incident…
may we all find a better day.
At some point people have more money than can easily be spent. I see a bunch of money in a computer somewhere as a meaningless thing. More like points in a video game. Most of that money will be blown in the second or third generation anyways.
Those wealth disparity charts really underscore exactly what capitalism stands for – socioeconomic darwinism. Only the strongest “survive”, by hoarding as many assets as possible. It’s an undisputed law of nature and applies remarkably well to the American economy. The “trickle down” theory is about as honest and accurate as a pride of male lions deciding to share their females with a competing pride. Never going to happen.
On a different note, it would be interesting to see the trend in wealth as a function of age/demographics. Or maybe the relative proportion of certain age groups for each wealth category. Considering so much wealth is contingent on asset appreciation one might expect an increased reliance on age to build wealth (instead of broke ’till 30, will broke ’till 40 be the new norm?).
This chart represents what happens when someone (the Fed) artificially pumps up assets with artificially low interest rates. Capitalist economies always have wealth gaps, but the standard of living is high. Communist economies have less wealth gaps because everyone is poor, well, except for the corrupt leaders that is.
Tiresome argument.
US hasn’t been full bore capitalist for a long, long time.
Gov’t, least qualified to make market decisions/policy, has had its hands on the economic tiller since forever.
History does show, however, that the various flavors of socialist economy are great for everyone! New Economic Policy! Bring it on now ! /s
Extreme ideology of whatever bent never delivers. Power hungry elites seek out control first.
One more thing that stand out at me: The higher you go up the scale, the smaller the liabilities are as a percentage of assets. The 0.1% group’s liabilities don’t even equate to 1% of their asset value. The bottom 50% are at 2/3rds of their asset value being tied up in liabilities, trapped paying a much larger share of their wealth toward interest on their debts. And that’s just the average of the group… People in the lower 50% are doing pretty good if they’re simply worth net-0 as plenty of people probably have liabilities that exceed their assets, especially if their student loan liabilities ever become a reality again. The negative net-worth crowd is probably growing as house prices cool. Equity can be a here-today-gone-tomorrow kind of thing in the short to medium term.
I guess the upper 50% are really providing the fuel for inflation. I’d be tempted to claim that the lower 50% are simply building debt at a feverish rate to keep up, but other WS articles have thrown some cold water on that notion. We’ll see what effect the resumption of student loan payments has (if the they ever resume at all).
“Average Wealth per Household” chart: It’s better to make it relative to the leftmost point, showing the growth in % with time.
I heard that as far as there is growth for everyone, it doesn’t matter if the rich grows by 300% and and the other by 20%.
In terms of wealth disparity — and that’s the problem here:
Homeless guy has $5 in his pocket, and you give him $5, and now he has $10 in his pocket. His wealth grew by 100%!!!
Billionaire has $1 billion, and Fed inflates markets, but homeless guy cannot participate, and the billionaire’s $1 billion becomes $2 billion, and he has a 100% gain also. So it’s fair since each had a 100% gain???
You can kill someone with the reckless application of percentages.
The wealth disparity between the homeless guy and the billionaire jumped from nearly $1 billion to $2 billion due to the Fed’s monetary policies. That’s the scandal.
I’m waiting for someone to come and say that we need to look at these charts in logarithmic mode just to watch Wolf unleash on them, alas so far nothing 😂
Seba – skip up. Wolf unleashed the dogs on implied log scales @timestamp 1135hrs…
may we all find a better day.
…correction, 1136 hrs (hand tremor strikes again…). Apologies.
may we all find a better day.
Ahh there it is, thanks!! 😂
Unpopular opinion: wealth tied to a physical asset (like a home) is useless if you don’t plan to sell that asset.
My house may be ‘worth’ x amount of dollars in theoretical resale, but I can’t access that wealth unless I sell it. And if I sell it, I’ll have to pay more in rent, and will be sitting on a pile of depreciating dollars. Ergo, I’m not any better off.
I wonder how many others have wealth in assets that they cannot access without being out on the street.
I agree. Primary home should not be counted towards wealth.
Ever heard of a second mortgage or HELOC?
That would have been valid when rates were still low, but I can’t afford to borrow at current rates.
This bull s$hit about people having wealth because their home sells for XXX is get tiring to hear. Yet I hear it over and over again from nearly everywhere. The people of this country are getting brainwashed by all the corporate and mainstream media and are becoming brain dead in the process. Your home is nothing more than a roof over you head and should be used as such, not as some speculative investment.
Well, you either have an asset which you don’t sell because you “don’t want to”, or if you do sell you have a pile of “depreciating dollars” and “paying more in rent” as you rightly say, but it’s still wealth isn’t? Someone without an asset such as a home is still paying more in rent and they don’t have a pile of depreciating dollars to do it with or to buy other kinds of assets with the pile, but you could should you sell your home. Your asset is also quite useful I would say even if you don’t sell it, it keeps you and anyone significant/dependant out of the elements and in relative safety compared to the street, you’d have to “pay more in rent” without it 😉.
I do get what you’re saying though, compared to someone with even more wealth that may have multiple properties or other assets you’re not as wealthy and they have a lot more flexibility than you and your single asset. However, compared to someone with 0 assets and no pile of cash, you are definately a lot wealthier and have more flexibility, it’s a matter of perspective.
I consider primary homeownership wealth in 2 ways.
1) It should be compared to Owners Equivalent of Rent. As you pointed out, the “wealth” amount should be determined from what the equivalent cost to rent the identical home. ie if you own a mansion in Brentwood that would rent for $20K/month, you are measurably wealthier than a person who owns a 2 bedroom house in the Midwest that would rent for $800/month. That is putting a price on luxury and quality of life.
2) The real value of a primary home is to live in your entire life without being driven out due to higher rents. It is equivalent to an insurance policy which also has long term measurable value.
It turns out it is also likely the final gift I leave my heirs after I leave this Earth. Then it has measured value with a stepped up basis but not to me in this case.
I agree with your first point. With regard to your second point, I view the “wealth” in our home somewhat differently, but along the same lines.
My wife and I don’t have defined benefit pensions. We made it a retirement goal to pay our home off. If we hadn’t been successful in that, we would have eventually sold it and paid cash for a less expensive home. The reason is that insurance, maintenance, and taxes are far less expensive than renting a comparable home. Owning the home means we need to draw less from retirement accounts and other savings to fund the lifestyle we want, and thereby gives us greater control over how much we owe in income taxes each year. Functionally, we view it as a small untaxed pension. Hopefully, it will be the final gift we leave our heirs too.
That’s a good point.
Any rent paid on a rental house will be taxed first as earned or unearned income. A mortgage-free paid-for house doesn’t have this expense (except for insurance, property taxes, and maintenance. This is likely the minimum rent you would ever pay as a renter since the landlord also has to also cover these expenses.)
I suppose if you sold your house, took the 500K tax exclusion and paid rent from that pile of cash, it may be similar. 500K at 2K/month rent would last about 20 years if rent never went up.
“My house may be ‘worth’ x amount of dollars in theoretical resale, but I can’t access that wealth unless I sell it. And if I sell it, I’ll have to pay more in rent, and will be sitting on a pile of depreciating dollars. Ergo, I’m not any better off.”
Take some time to think about what you’re saying here. Do you see how your logic is inconsistent? You own a home and have two choices: 1. sell it and realize your equity, or 2. keep it and pay less in rent.
If you go with option one, you can use the “wealth” you’ve extracted from the sale of your home to pay rent. That is definitely useful since you need a place to live. On the other hand, you can also use the proceeds to collect interest or make another investment. That is also very useful.
If you go with option two and keep the home, you save on rent as you say yourself. Saving on rent is useful. Since you will continue to own a physical asset, you also won’t have “depreciating dollars” which apparently you do not want so that’s useful too.
I’m just trying to point out that wealth tied to a physical asset, especially a home, may be illiquid, but it’s still useful. Depending on your situation, it can provide shelter at below market rates, it can be sold and turned into cash to be deployed elsewhere, it can be borrowed against, it can provide an inflation hedge, etc. I think your real complaint is about the illiquidity of physical assets, which don’t provide the financial flexibility you seem to want.
I think I see what you’re saying – the wealth *is* the physical asset, regardless of what it would theoretically sell for. No disagreement from me.
I guess the point I was making is: as an existing homeowner with no plans to sell, I’m *worse* off if the resale value of the home rises, because my costs also go up with it.
You are saving yourself:
1. Rent costs (you live there rent free)
2. You are not subject to rising rent.
3. You pocket much more than a renter or mortgage payer. You pocket the savings, if you still work or live off retirement funds.
4. You live in a free ticket to a nursing home (they sell your house for you for your care).
sorta cons:
Upkeep, property taxes, HOAs, large expenditures for appliances (HVAC etc). But most renters cough up rent and landlord re coups at some point off rent increases.
“You live in a free ticket to a nursing home (they sell your house for you for your care).”
This is something I had not considered. Great point.
You can access your wealth as collateral underlying a loan
The key is whether you can invest that debt in assets that either increase your net value or (different objective) produce an income stream that exceeds the cost of borrowing.
Always. Risk management.
Note: not an argument that risking one’s primary residence is a smart thing to do.
As I mentioned in another comment, I cannot afford to borrow at current rates.
Some people have the kind of unique homes that could never be reproduced, and have locked in a kind of lifestyle that anyone would envy, and therefore they will always FEEL wealthy, even if they never intend to sell. It can be enough to turn a “weird old guy” into an “eccentric gentleman “.
And…some old people sell their houses to raise cash or do a reverse mortgage, etc. of course a home is part of one’s wealth.
Muss – so THAT’s what they’re calling me! (‘an eccentric old guy’)…
may we all find a better day.
MW: Popular US Treasury-bond ETF crashes to lowest level in more than 12 years as yields surge causing bond values to plunge…
Long rates are continuing to move up today.
There really is only one explanation for this. It means long bond buyers are getting more worried about the inflation outlook and recurring deficit spending.
The Fed hasn’t shown the resolve to throw the economy into a needed recession, and it could be chasing high inflation for a LONG time.
This talk of beating inflation while engineering a soft landing is ridiculous. How can they reasonably expect to tackle inflation with recurring $2T government deficits?
MW: US government shutdown would be definitely be ‘credit negative,’ Moody’s warns
MW: 10-year Treasury yield sees highest close since 2007
Obsessing about the top 10% is a waste of time. It will always exist, it always has, regardless of the economic system.
Our focus should be lifting as many of the “bottom 20%” to be equal to the “upper portion of the bottom 50%”, and ensuring mobility from the bottom 50% to the upper 50% is still possible.
I find all the Marxist commentary interesting. If we go down that road, there will be less disparity between the bottom 90% because we will all be poor. The upper 10% will be little changed.
By definition, there will always be a top 10%, and there will always be a bottom 50%. So that’s not the problem.
It’s the disparity between them that’s the problem because when the Fed uses monetary policies to inflate asset prices, the top 10% get vastly richer and the bottom 50% have to pay for it with vastly higher COSTS for everything they buy or rent. That’s how it’s been.
In IMHO, QE is the most powerful neoliberal tool in the Fed’s tool box. Wolf, as you pointed out the gains are completely disproportional for the top 10% and especially the top 1% and .1% compared to all other wealth groups. It makes you wonder why the Fed refused to stop its QE program in the face of harsh criticism from the likes of M. El Erian and Bill Gross.
It’s a minor quibble, I disagree when you state it’s the disparity that is the problem. I completely agree with your analysis that the fed’s actions have caused inflation and the lower income earners will pay higher the price, so to speak. I see the disparity as a symptom, not the cause.
The wealthy will always disproportionately benefit from an improving economy and increasing asset values. I believe there is a situation where wealth disparity increases without the detriment to low income earners.
That’s just not what is happening now
Are you sure?
Extreme wealth concentration also equates to hugely disparate political power/influence…exactly what we see happening in the US for a while now.
We can get to social unrest another time.
…when the big boys argue amongst themselves internationally, as they always do eventually, what conditions make one willing to frontline soldier for any of them???
may we all find a better day.
I didn’t see any Marxist commentary, unless you consider equal opportunity and fair representation to be Marxist.
Please point out what you consider a Marxist comment.
Perhaps a bit of hyperbole on my part, but if you read some of the comments late last night and very early this morning, I think you’ll see what I was referring to. I might be a bit sensitive to it because it’s a common refrain among people I have spoken with who are millennials or Gen Z. They feel like they have been screwed by the system and the only solution is to tear it all down.
When I bought my first house in 1999, interests rates were almost 9%. I had a budget that caused my bank account to dip into overdraft protection every month. Payments were timed with paychecks to get the balance above negative in time to avoid interest charges. After other bills, there was very little left over for discretionary spending. I counted on hard work and promotions to dig out of it. Yes, home prices are higher now, but so are wages. BTW, I think it would be a very bad time to buy a house at the moment, but I’m sure with a little patience the math will change.
When I was a kid, interest rates were in the teens and my family was very house poor. My parents argued about money constantly, but eventually the finances worked out.
My Great-grandmother was a flapper in the roaring twenties. Imagine her dismay when the Great Depression hit.
This too shall pass.
All groups of people and other animals end up in some sort of hierarchy. There are always a few at the top, and then everyone else, be it communism, socialism, capitalism, marxism, nazism, monarchy, a business, a classroom, a family, a pride of lions. There are alphas, and then there is everyone else. That is just the way it is. Many have tried to change it. It does not change (“meet the new boss, same as the old boss”). Some would call it Social Darwinism. It does not bother me, I just adapt and roll with it.
True. But the various economic systems shield vastly varying requirements for supporting social structures (e.g., legal systems, labor fungibility, etc.).
Marx (wearing a sociologist hat – not his Ricardian economic hat) highlighted this distinction. Schumpeter brings this out brilliantly in his masterpiece Socialism, Capitalism and Democracy.
That 141M seems daunting even from the 1%.
I remember those days at the bottom 50%.
What do you think about the Zillow Rent Index? Will the Rent CPI be lower in the future?
The Zillow Observed Rent Index (YoY) usually leads the rent component of the Consumer Price Index (CPI) by 6-12 months. Since rent prices account for the largest proportion of CPI and PCE, the Zillow Rent Index can be seen as a leading indicator for both.
https://en.macromicro.me/collections/5/us-price-relative/49740/us-cpi-rent-zillow-rent-yoy
The chart you linked is the typical clickbait fodder to mislead people who cannot think straight.
Here is the actual Zillow index in dollars (not YOY change) and the actual OER (not YOY change), and you will see that both are still surging. Zillow had a little dip late last year, but this year has re-surged. Here is the detailed discussion:
https://wolfstreet.com/2023/09/13/the-acceleration-of-inflation-in-the-second-half-has-begun-disinflation-honeymoon-terminated/
Home prices up 5 months in a row. Wealth effect still operational?
You can be certain the crime rates will rise.
Wow. This is my favorite article from you so far, Mr. Richter.
It breaks my heart.
Thank you for putting this together, and thank you for doing what you do.
Cheers
P.S. I’ve added the t out of respect
I wonder if you work in transfer payments to all of this what the bottom 50% look like? Of course keep in mind there was an article in NY Post five years ago regarding a study of the tax payers in NYC. They found out that 79% reported on average of $60K in annual income, which would be impossible to live on in the city in 2018. NYC, like many larger cities have a large part of their populace who work in what are all cash workplaces.
This is “wealth” no “income”
Any transfer payments that didn’t get spent are part of “wealth” and are included.
We are getting poorer precisely because a narrow elite has organized society for their own benefit at the expense of the vast mass of people. Political power has been narrowly concentrated, and has been used to create great wealth for those who possess it.