The foundations have crumbled. All bets are off.
Over the last 20 years, margin debt – when investors buy stocks with borrowed money – went through three multi-year run-ups, each topped off with a spike, followed by a reversal and decline: during the final throes of the bubbles in 2000 and 2007, each followed by an epic stock market crash – and now.
That pattern of jointly soaring and then declining margin debt and stocks even occurred during the run-up and near-20% swoon in 2011.
The grand cycle began in February 2009, at the trough of the Financial Crisis, when margin debt had dropped to $200 billion. It was followed by a multi-year record-breaking run-up, topped off with a spike that culminated in an all-time peak of $507.2 billion in April 2015. Then margin debt reversed and began to decline. On cue, the stock market began to decline a month later. Margin debt zigzagged lower, and stocks did too. But in February this year, stocks suddenly bounced off sharply – without margin debt.
The New York Stock Exchange reported on Monday that margin debt declined again in June, by $3.7 billion to $447.3 billion, just a hair above where it had been in February.
This chart by Doug Short at Advisor Perspectives overlays margin debt and the S&P 500 from 1995 through the end of June. The data is expressed in today’s (“current”) dollars to eliminate the impact of inflation. Even adjusted for inflation, margin debt and the S&P 500 hit a record high in April 2015. By the end of June 2016, the S&P 500 was again at a record high, but margin debt had dropped 12%. That divergence (red arrow) hasn’t happened for at least the past four decades:
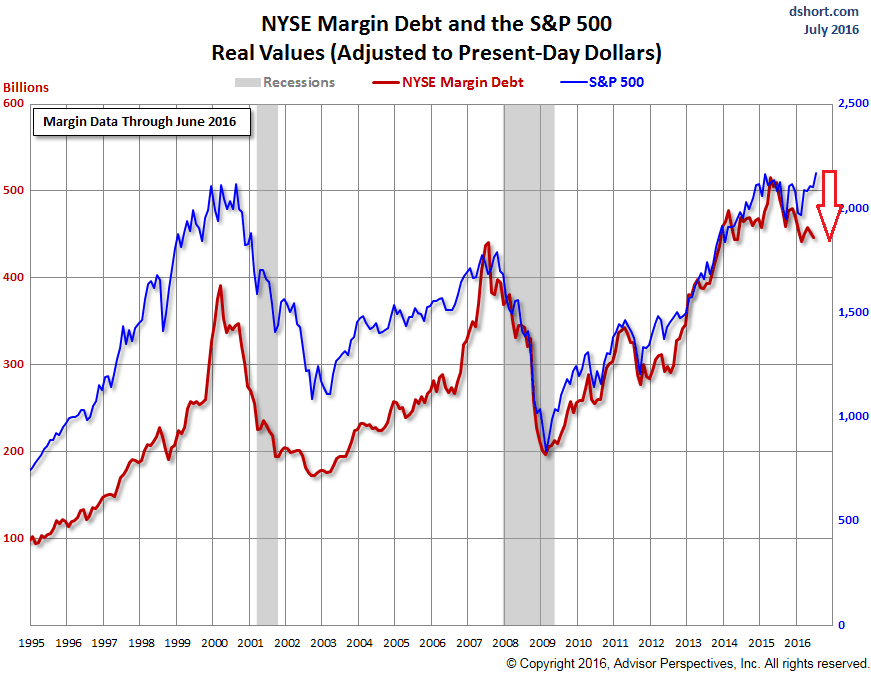
There’s a reason for this relationship. Margin debt is the great accelerator for stock prices, on the way up and on the way down. When investors buy stocks with money they don’t have and that the broker creates for them, it drives up stock prices, and these higher prices allow investors to borrow more money against the same number of shares, which drives up share prices further. Leverage is a wonderful mechanism to create demand.
But when stocks tank, spooked investors begin selling stocks and pay down their margin debt. They’re deleveraging, taking risk off the table. If stocks fall sharply, investors may be forced to sell – or the broker will do it for them at the worst possible time – to pay down their margin debt to stay within the margin limits. Forced selling drives down prices further, which begets more forced selling. And prices spiral lower.
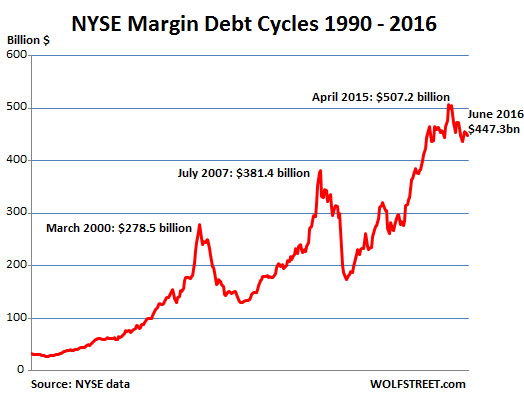
As the chart shows, margin debt has a nerve-racking habit of peaking right around the time stocks begin to crash. In March 2000, margin debt hit a record of $278.5 billion (actual, not adjusted for inflation), just as stocks had begun to crash. A few years later, with the crash having faded from memory, margin debt spiked again, peaked at $381.4 billion (actual, not adjusted for inflation) in July 2007, and fell off. A few months later, stocks sold off. That sell-off eventually turned into a blistering rout.
Here are the margin debt cycles not adjusted for inflation:
Compared to the size of the economy, the margin-debt peak in April 2015 was bigger than the prior two peaks: 2.8% of GDP versus 2.6% in 2007 and 2.7% in 2000. Each of those prior peaks in margin debt was followed by a collapse in margin debt, and a spectacular crash in stocks. But this time, it’s different.
That divergence fits the pattern in this crazy era of central-bank market management. Seven-plus years of “whatever-it-takes” central-bank-created global liquidity, QE, and interest rate repression to zero, and below zero, have changed the assumptions and dynamics of everything. NIRP refugees – investors fleeing relentless negative interest rate policies and financial repression in their bailiwicks such as Europe or Japan – are spreading the effects of their central bank policies around the globe. And capital flight from some countries, such as China, adds to the impact.
That this time it’s different also shows up in other assumptions and dynamics: business sales have been declining since mid-2014. Earnings have been declining for about that long. Even “adjusted” ex-bad items earnings of the S&P 500 companies have booked four quarters in a row of declines. The S&P 500 aggregate price-earnings ratio, based on GAAP, has soared to over 25, a dizzying number that sets off all kinds of alarm bells.
And yet, the global flood of liquidity keeps pouring into this market, and fundamentals no longer matter, sales and earnings no longer matter, risks no longer matter, and money is free, or nearly free, for institutional investors. But the foundations have crumbled. And all bets are off. That’s what this divergence of margin debt and stock prices tells us. It’s a very precarious position to be in.
Record moneys suddenly pile even into the material that debt crises are made of. Read… Why this Spike Will Perforate Yield Chasers
Enjoy reading WOLF STREET and want to support it? You can donate. I appreciate it immensely. Click on the mug to find out how:

![]()
I find it hard to believe this will last much longer, fundamentals will re-assert themselves sooner or later. Then again I guess anything is possible in the central bank wonderland we find ourselves in…..
Fundamentals will matter again once the current e-con-omic /financial system has been fully wiped out.
Politicians, banksters and their kin will do everything they can to prevent such a reset from happening and keep filling their pockets. So probably ‘later’ rather than ‘sooner’.
Central banks don’t need “no stinkin margin debt” They just print money to buy stocks.
“In March 2000, margin debt hit a record of $278.5 billion (not adjusted for inflation)”
On the graph, it looks more like $378B (or more).
Yes, correct. The chart is in “current” dollars, so adjusted for inflation. The numbers I cited are the actual peaks at the time, not adjusted for inflation.
We’ve had quite a bit of inflation over those years, so unadjusted numbers make a chart look really crazy.
My own chart of margin debt is not adjusted for inflation, but I stopped using it because it no longer means much.
Now that I have gotten two questions on the same topic, I added my own chart of margin debt not adjusted for inflation. It looks crazy as I said, but check it out.
Thanks for adding.
Think the March 2000 number was a typo. As far as this gap not appearing for 4 decades, I see 2 gaps in the last 4 years, one in 2012 and a smaller gap in 2015. So the current gap may not mean anything. But I do agree with the premise that margin debt helps to drive stock prices and that a downturn should eventually be reflected in the market. But as the article stated, too much capital is fleeing other countries and is pouring into the US.
Just to clarify: the chart is in today’s (“current”) dollars to adjust for inflation. So in today’s dollars, the past figures get larger than they would be without this inflation adjustment. But the numbers I cited in the text for the margin-debt peaks in 2000 and 2007 are the actual (nominal) levels at that time. So you have much smaller nominal peaks in the past.
That’s also why I expressed the peaks as a % of GDP. This is another way to get around the distortions that inflation creates after so many years. As a % of GDP, margin debt in April 2015 was the highest in the past four decades, at 2.8%.
My own chart that I used to use is not inflation adjusted. And it looks really crazy! So I stopped using it.
I added my own chart not adjusted for inflation. Check it out. It does give you a feel for what inflation has done to our monetary unit…
:-]
ChrisM,
Sorry its not capital flooding the US, it is fiat.
The overall percentages of actual “number difference” is in play. Therefore, how does the percentage chart look? Also, with the now accepted as common, $1 TRILLION+ debt per year as standard, nearly any historical chart, could be, out the window. Also, we are knocking on the door of negative interest rates. An influence that I only “think” I may have a clue about, with no validity…. only common sense.
THIS IS WHY, several years ago, I have gone back to my roots as a trader and am now only trading “Base Commodities” that have REAL relationships to one another.
1st Stanza: (This is always appropriate)
Turning and turning in the widening gyre
The falcon cannot hear the falconer;
Things fall apart; the centre cannot hold;
Mere anarchy is loosed upon the world,
The blood-dimmed tide is loosed, and everywhere
The ceremony of innocence is drowned;
The best lack all conviction, while the worst
Are full of passionate intensity.
And if you have 3 seconds! This explains it all!!! Have a great day.
https://www.youtube.com/watch?v=UmzsWxPLIOo
Institutions and individual investors have been sellers in the last 7 years.
Corporations have been the big buyers.
Is there any indications that corporations are no longer big buyers ?
Maybe I’m missing something but I see margin investors, maybe the smart money this time, taking profits and being replaced, on the other side of the trade, with cash buyers. This doesn’t make the market any sounder, but explains the chart and the article’s assumption that outside money is being attracted at these levels.
I still think the whole market is nuts but at this point, what difference does it make.
Is it possible this market is uniquely Bear Proofed… Is the Fed and other central Banks “funders and buyers of last resort”… until they own huge chunks of the market?
Just sayin’: recent events kinda’ point in that direction withe the Fed as the actual PErma-Bull.
Aren’t we stuck with low rates forever? Any attempt to raise them, even by a tiny amount, causes stocks to drop significantly and most people, including voters, don’t want that. We are definitely in new territory here (long term near-zero rates) and thus the difficulty in predicting the direction of stock prices based on historic patterns of cause-and-effect. Good luck Wolf trying to predict where we are going with this! And you do a fine job trying to figure this all out…your conclusion that ‘the foundations have crumbled. All bets are off” is a very honest assessment. The system is now rigged to force people into inflated stocks and real estate or riskier investments because safer historic investment options return so little. The near-zero interest rates provide the stimulus for the slower growth economy we are now in. Increasing stock and property values gives the appearance of a growth economy but is it real? Can higher and historically “normal” ecomomic growth ever return? Slower population growth and higher energy production costs are big components of this dramatic change in the world economy. Both of these components are moving in directions that will impact the Growth economy model. Factor in what will REALLY need to soon be done to combat global-warming and I don’t see any chance that the Growth economy model and all its rules and historic patterns can long survive. Current economic patterns are going to show a lot of anomolies to historic patterns of the last 100 years. The near zero rates are a symptom and a band-aid of this old system. Something has to give!! Physical Reality meets the Dismal Science! We have over-populated the Earth while we work endlessly to eat up the life-support systems it provides. Nothing is more basic than that. Energy drives the economy and all the cheap bubbling crude is gone. If one barrel of crude provides the equivalent amount of man-labor of eleven years then the by-products of our numbers are really greater than just the reported 7 billion humans generating those impacts. We need to add in our “oil slaves” to really grasp our impact on the Earth’s ability to support us and how those increasingly costly oil slaves will impact our economy!
Wolf
HELP!
You say ” That divergence [of NYSE net margin debt and S&P 500] and (red arrow) hasn’t happened for at least the past four decades”.
However the chat shows a much larger divergence (in %age and absolute dollars) for the 12 years from 1995-2007 – am I misreading the chart?
Chip, I’ll try…
“Divergence” in this sense means going into two different directions: one up, the other down.
It’s not the absolute difference between the two lines that is important (they represent very different things – margin debt and stock prices adjusted for inflation – and cannot be compared in an absolute sense). What’s important in order to identify turning points is the direction of the two lines and their peaks (including the magnitude of the current margin-debt peak compared to the prior margin-debt peaks).
Wolf
Got it – you’re referring to the 1st derivative (aka: rate of change) of the trend lines.
Yes
:-]
i disagree.
the divergence is the opposite of what you think it is.
on the other hand, the sky falling does tend to put a damper on things.
The previous two peaks show a lag before stocks followed debt, current lag 3 mos. coyote off the cliff, maybe about to look down.
Money inflow from China eu maybe part of explanation, or maybe lag is normal. I’m in long treasuries plus some tza… We’ll see.
This chart of the S&P500 does not seem right. The 2016 January to mid February selloff went as low as 1810, lower than the August 2015 selloff. However, your chart shows the dip bottoming at around 1950, higher than the August 2015 selloff. If you are saying that margin debt to the S&P has become inversely correlated over the last few months, then why show a 20 year chart? Prove your argument with a one year chart.
The chart is in “current” (today’s) dollars to adjust for inflation. It shows that on this inflation-adjusted basis, the S&P 500 barely set a new high. (In nominal terms, not adjusted for inflation, the current high is of course far higher than its prior high in 2007.)
Also, click on the chart to see a larger version. It will answer your question about the S&P 500 in February.
WR
Thanks for the numerous informative articles & comments &c…
Much appreciated…
The bears have continued to be wrong. As Barry Ritholz has observed, the bull market will go on as long as there’s indifference towards the stock market, and his record has been correct the past 7 8 years.
Which, conveniently, is the entire bullrun thusfar. Barry Ritholtz and his disciples (e.g. Ben Carlson, Josh Brown) do nothing more than talk their low-cost, passive investing book. Don’t worry, just keep investing is what brings in their gains as ironically they’re just as much a layer of management fees.
They’ve nothing to gain with people questioning if what the hell is going on bears even a semblance of rationality or is otherwise sustainable.
Caveat emptor (especially when they seem so sensible).
Full disclosure:
Barry Ritholz is 55 and has been in the business much longer than 7-8 years (BTW anybody who called 2008-2016 correctly all the way along should be uber-rich).
Past performance blah blah blah no indication of future performance blah blah blah.
Don’t get me wrong, the economy is pretty screwed up with (among other things) government interference, but if all these market guys are so smart, why aren’t they filthy rich?
The dollar will be the last currency to collapse, because it’s the current reserve currency and because the Fed has not embraced NIRP yet. Ipso facto the flight to “safety” will uphold the stock market while the other collapsing currencies will club our manufacturing sector like baby seals. We are on that part of the world map that in the days of exploration and sailing ships were marked “here there be Dragons”. Once people around the world realize that the dollar is no safer than the other fiat currencies, the crush to get into traditional safe havens will overwhelm the system, and the losses will be cataclysmic IMHO. Once the world comes out of the ether it’s Katie bar the door. How far away is it? I have no clue, but when it all shakes out a new system will arise Phoenix like out of the ashes.
LOL. I just love your optimism. No Phoenix will be rising for anyone, because another BIGGER global crisis might just be around the corner:
http://www.flassbeck-economics.com/how-climate-change-is-rapidly-taking-the-planet-apart/
A temperature rise of 3.5C should pretty much finish off almost everyone.
Phoenix rising? More that we’ll all turn to ash.
NotSoSure
Don’t know about where you live, but where I am the temperature changes much more than 3.5C; seasonal variation is MUCH MORE THAN 3.5C.
Haven’t noticed anybody turning to ash…yet.
Just saying.
You’re conflating “weather” and “climate.”
Wolf
You are correct; as is NotSoSure…
I have already stated my position, ad nauseum on the global warming hoax. Despite my pessimism on the current state of world economics I am not by nature a doomsayer. It is an exercise in futility, because should it happen most of us will be dead and unable to debate the issue. Order arises naturally from Chaos, and vice-versa. Sometimes an ordered system gets a reprieve, as in the Pax Romana or more recently IBM and Chrysler under Iacocca. Think of it as a dead cat bounce.
The only thing that will finally ‘prick’ the financial bubble around the world odds some sort of significant geo-political event that causes a realignment in key countries.
So what do we have on the menu?
October
Austrian Presidential Election re-run. Unlikely to be that significant although one result is clearly more contrary to the globalist narrative than the other.
Hungarian Refugees Reference Referendum. Again, unlikely to cause any great shocks although it will likely result in a hardening of positions and an increase in anti-refuge rhetoric.
Italian Senate Reforms Referendum. A no vote would likely presage fresh Italian Elections with the likelihood there anti-Euro 5 Star movement could surf to power in 2017. This is clearly the most significant event to look forward to in October, or September, or August, or July.
November
US Election. Can Trump win and potentially cause chaos in world markets? Well yes, he can.
Shop we have plenty to look forward to but it’s unlikely anything major will disrupt world markets in 2016.
2017 though, that’s another matter entirely.
Julian
The TV psychic Ms Cleo died the other day (but she knew that was going to happen.
Bust I digress:
Seeing your analysis of 2016, it’s comforting to know you’re filling in for her.
Previously I was worried about ISIS stuff, or Russia invading a NATO country, or some Chinese officer taking independent action against the US or Japan, or the screwball in North Korea obliterating Seoul (or LA), or Russians & US inadvertently shooting each other down in Syria, or some random hell-hole simply coming undone (Lybia). Not to mention time for the next big quake in SF, Seattle, Tokyo, or the super volcano cutting loose in Yellowstone (or Naples). Or maybe another species-ending comet strike. Good to hear it’s all under control.
You forgot to mention the Carrington event… One of those could really offset the CB plans…
http://news.nationalgeographic.com/news/2011/03/110302-solar-flares-sun-storms-earth-danger-carrington-event-science/