
The Fed can focus on getting its messy inflation-house in order.
By Wolf Richter for WOLF STREET.
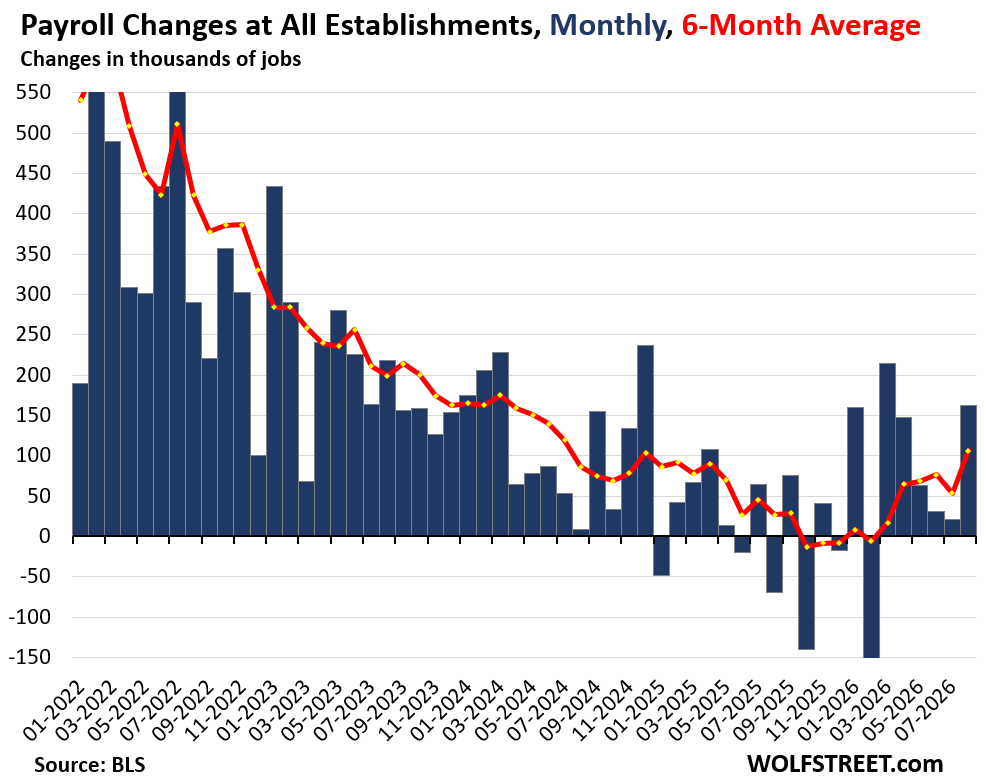
Payrolls at nonfarm employers jumped by 162,000 workers in August from July (blue columns in the chart). The prior two months were revised up substantially: July by 44,000, to a gain (+21,000) from an originally reported drop (-21,000); and June by 11,000. And most of the huge July drop in local government employment (mostly educators) of -62,000, the biggest month-to-month drop in years, largely bounced back in August with a gain of +50,000.
The six-month average job gain, which irons out the month-to-month squiggles and revised quirks, rose to +107,000, the biggest gain since July 2024 (red line). This job growth is occurring despite a declining labor force that resulted from the crackdown on illegal immigration and the wave of boomer retirements.
So this report on nonfarm payrolls, released by the Bureau of Labor Statistics today based on surveys of employers, ironed out some of the quirks in the July report. And for the Fed, as it contemplates whether or not it should hike its policy rates, this data today removed any remaining worries about the labor market. The 12 voting members of the FOMC can now solely focus on getting their messy inflation-house in order.
By category of private sector employers.
Two major private-sector categories shed jobs:
- Financial activities (-11,000)
- Information (-23,000).
All other major private-sector categories gained jobs:
- Leisure and hospitality (+62,000), July revised up to -21,000 from -40,000;
- Healthcare (+28,400); July revised down to +13,100 from +22,000
- Construction (+22,000);
- Manufacturing (+16,000), July revised up to +14,000 from +5,000; year-to-date: +58,000.
- Professional and business services (+10,000);
- Wholesale trade (+7,800);
- Transportation & warehousing (+5,000), July revised up to +13,800 from +10,000;
- Other services (+3,000).
- Retail trade (+1.400); July revised up to +13,200 from -19,000).
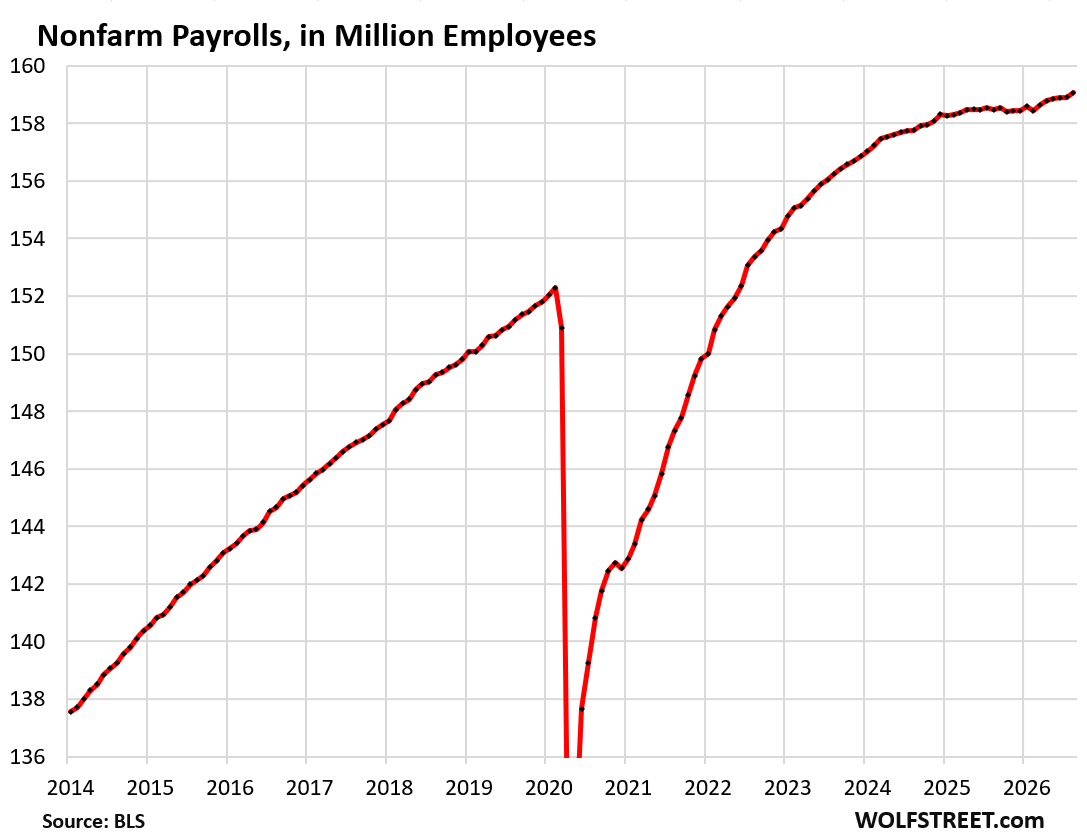
The level of total nonfarm employment rose to 159.1 million in August.
Note the flat spot from April 2025 through February 2026, and the rise since then. That flat spot was in part caused by massive job cuts at the federal government that reduced its payrolls by 11%, or by 336,000 jobs. Those federal job reductions have largely ended now. State governments have cut 55,000 jobs over the same period, mostly in higher education, as many state universities and colleges have come under enrollment pressures. Combined, they have cut nearly 400,000 jobs at a time when private sector job growth was already slow.
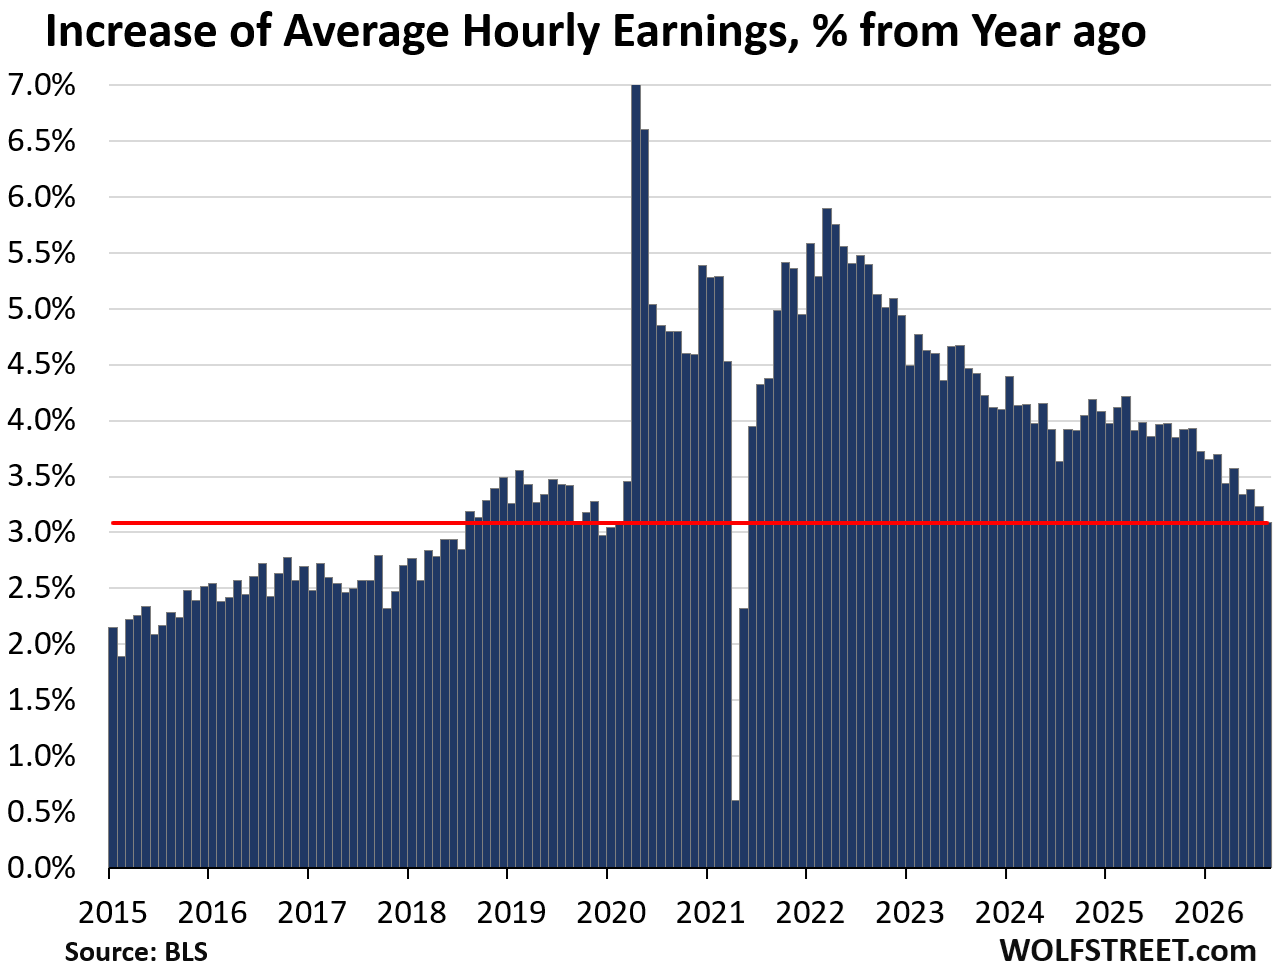
Average hourly earnings rose by 0.27% in August from July, and by 3.1% year-over-year, to $37.75 per hour.
Inflation has been running hot for months, with the most recent CPI rising by 3.4%, and this wage gain of 3.1% is lagging the rate of CPI inflation, after outrunning CPI inflation over the past three years through early 2026.
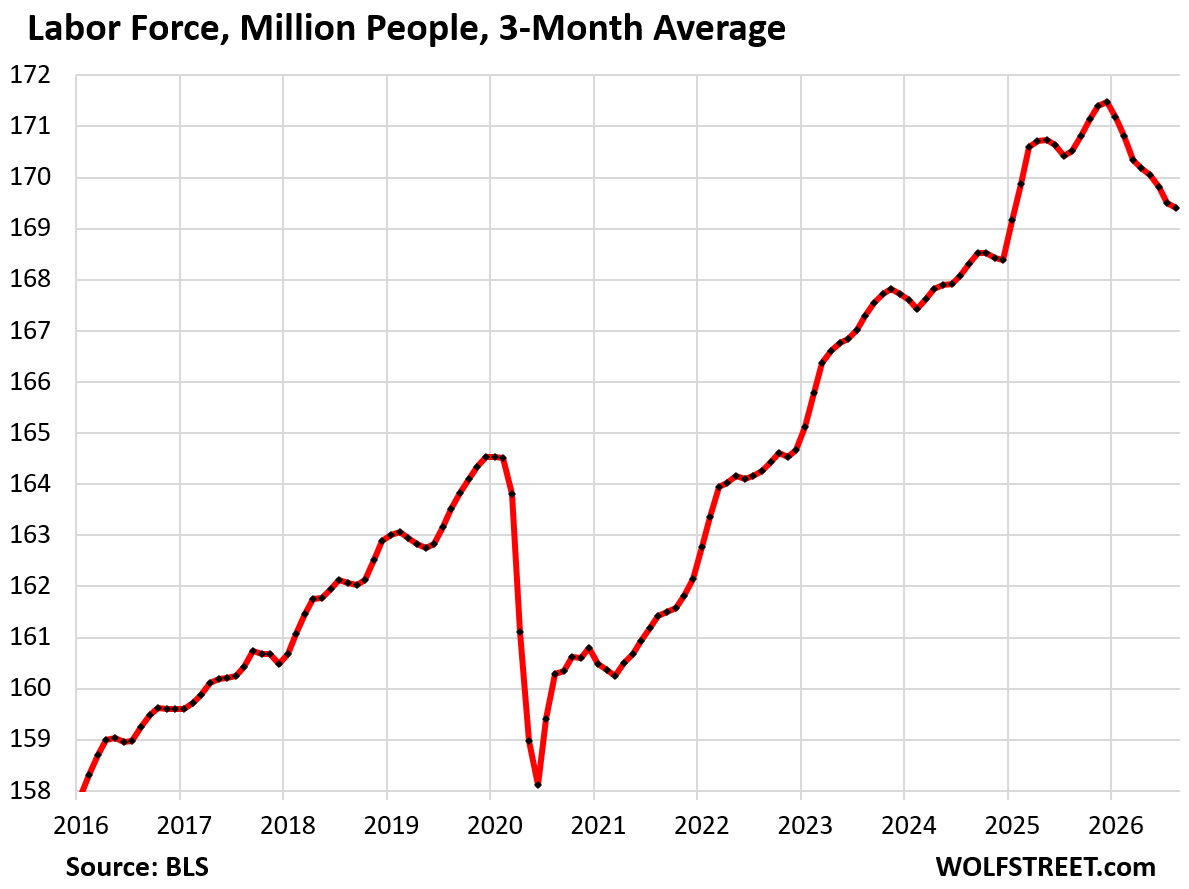
The labor force has been on a downward trend as a result of the crackdown on illegal immigration, the tightening up of legal immigration, and the continuing boomer retirements. The labor force consists of people who are working and people who are not working but are actively looking for work. When a person decides to retire, they exit the labor force. The data is collected via surveys of households.
The labor force rose in August, after two big monthly drops. Given the big month-to-month swings in the labor force data, and the huge adjustments, we look at the three-month average, which irons them out and shows the trend.
The three-month average in August dropped by another 100,000 people in the labor force. Since the peak in December, the three-month average labor force has dropped by 2.07 million.
This continued drop in the labor force – representing a decline in the supply of labor – has changed the dynamics of the labor market, leading among other things to a very low unemployment rate, despite so-so job creation.

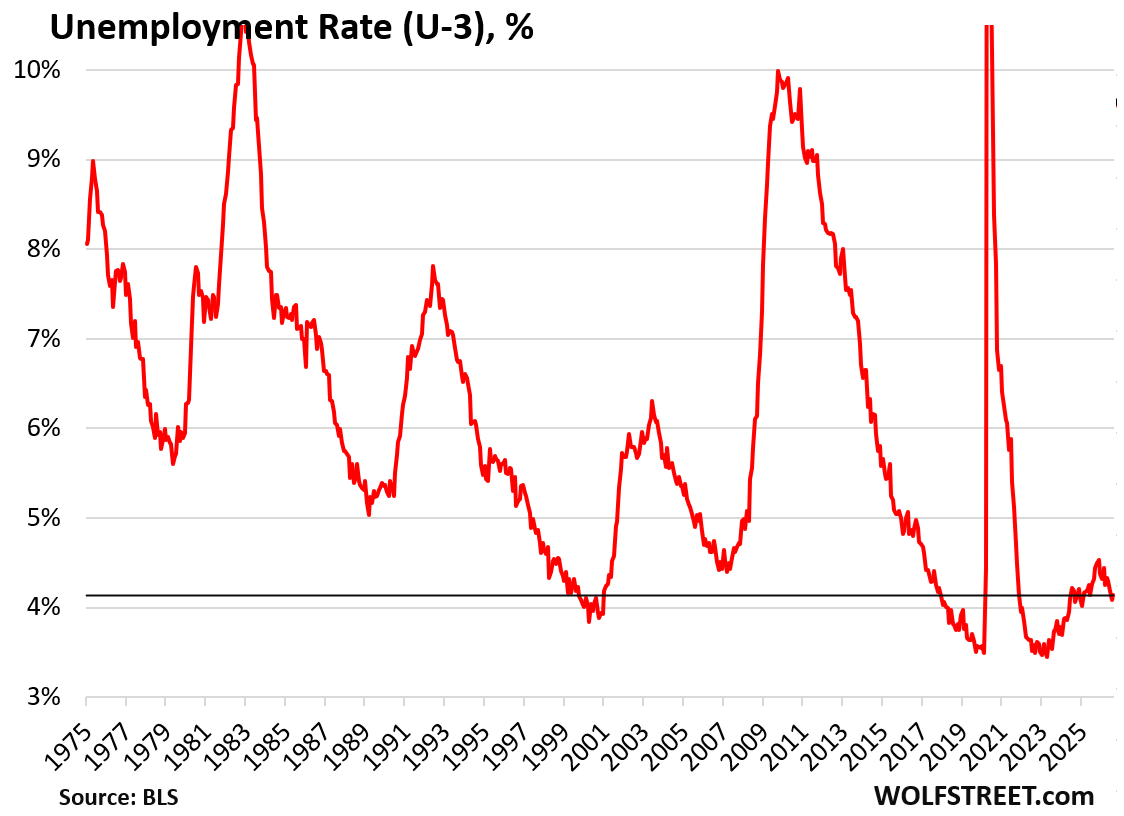
The unemployment rate remained at 4.1%, a historically low rate within a 50-year timeframe, largely because of the shrinking supply of labor.
The unemployment rate reflects the number of unemployed people who are actively looking for a job (7.03 million) divided by the labor force (169.8 million).
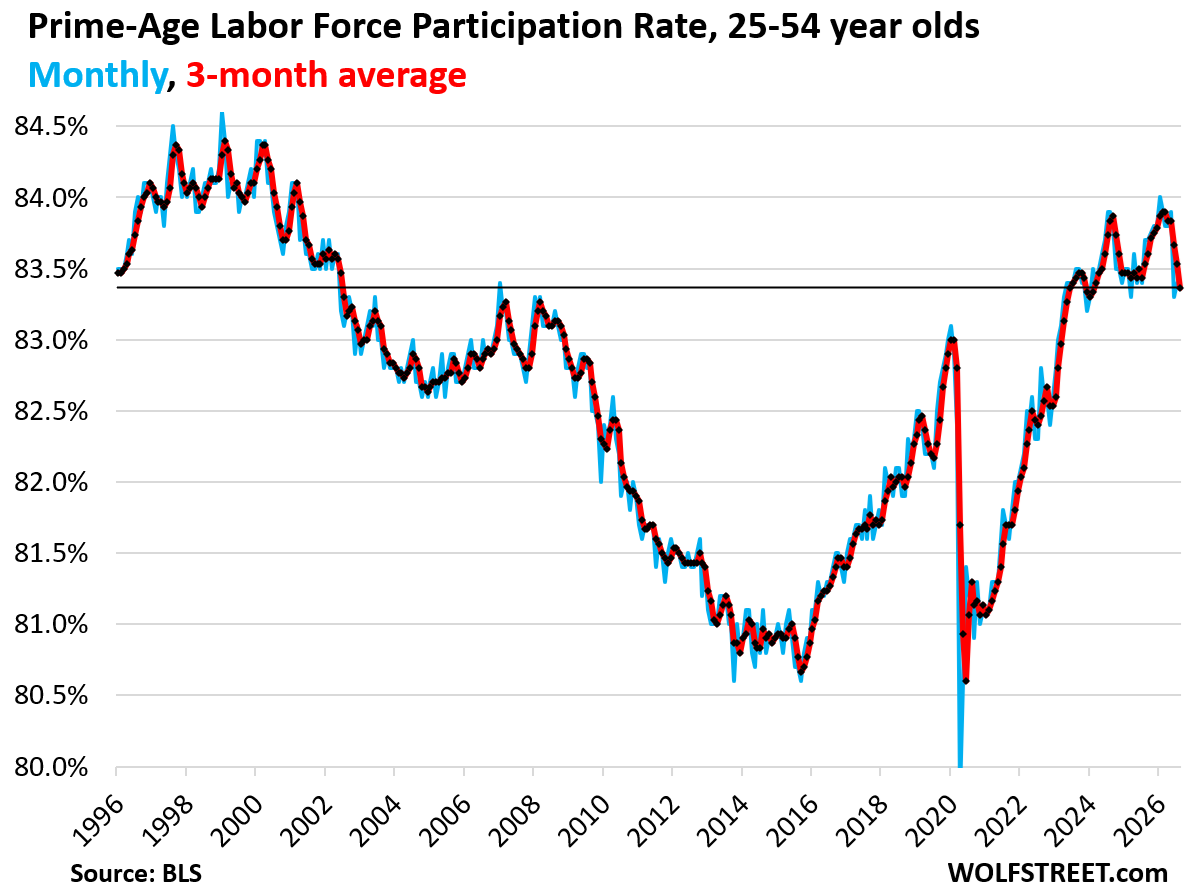
The prime-age labor force participation rate remained at 83.4% in August, same as in July, and both were up from June (blue in the chart below).
The three-month average declined to 83.4% (red). This range that has prevailed since mid-2024 is the highest in over 20 years.
The prime-age labor force consists of people between 25 and 54 years old. It eliminates the issue of the retiring boomers. When people retire and stop looking for a job, they’re no longer “participating” in the labor force but remain in the population until they die. It’s the surge of boomer retirements over the past 15 years that has pushed down the overall labor force participation rate (not shown here), but not the prime-age labor force participation rate.
Enjoy reading WOLF STREET and want to support it? You can donate. I appreciate it immensely. Click on the mug to find out how:


I thought I recalled you writing that construction work ( Non AI DataCenters ) was way down, but now they are hiring a large amount of construction workers?
I don’t think I ever said that since I look at the construction employment chart, and it has been strong, kept down only by labor shortages. Wage increases in the construction industry are far bigger than overall. I’ll post some of this stuff later today. Parts of construction are very strong (data centers, etc.), others not so much (residential).
Maybe you’re thinking about manufacturing. Manufacturing employment is on a long-term decline since human workers are getting replaced by automation. This started many decades ago and continues. Every manufacturer is spending lots of money to automate more and more of production. Yet, this year, manufacturing employment started growing again.
And yet strangely today, both Trump and Vance had public statements saying the good jobs report indicates the economy is fine so interest rates should be slashed by the Fed. I guess that is bizarro world Fed policy world where we raise interest rates to spur the economy. Since it doesn’t need spurring we can chop the rates.
Every President always wanted the lowest possible interest rates. The only good money is free money, in their eyes. They forget that they lose elections because of inflation. Trump came into office in part due to inflation under Biden. Now Trump doesn’t care anymore, all that matters is free money. But other Republicans should care.
Mmm, I wouldn’t necessarily say all presidents wanted low rates, even in inflationary times. Part of the problem with the claim is that it was more of a battle between staying or moving off the gold standard, which happened relatively recently under FDR and Nixon, which was kind of a proxy for the interest rates of today – as debtors (often farmers) favored debasing the currency to get out from under their debt, while creditors (often Wall Street) preferred we all stay on the proverbial Cross of Gold.
Cleveland was a gold standard guy. Carter appointed Volcker, one of the fiercest hawks who continued his campaign under the Reagan administration.
It’s really been modern times that we have what I sarcastically call the “Keynesian Consensus” from Trump’s infamous “we need to prime the pump” attitude to the economy that we have a bipartisan accord that stimulus is good, and the government is here to smooth out the business cycles through aggressive intervention – be it Fed or monetary policy.
But our current Fed chair has apparently decided to let the bond market take the wheel, at least before the midterms. The bond market is not a big believer in Keynesian policy as the only economic policy. They prefer spanking governments that mess up monetary and fiscal policy.
Reagan got really tired of Volcker’s high interest rates, and when it came time to reappoint him, he didn’t, which was the near-equivalent of firing him.
Reagan was good with the high interest rates early on in his term to bring down catastrophic inflation. That inflation was why Carter lost and Reagan won. But that acceptance of high interest rates didn’t last long.
Agreed.
“What I’m saying, very simply, is that we should be paying the lowest interest rate in the world,” Trump said in the Oval Office.
He had been asked about his Truth Social post earlier in the day declaring, “LOWER THE RATE OR I’LL STOP TRADING WITH COUNTRIES WITH WHICH WE HAVE A DEFICIT.”
I can’t be the only one that’s sort of getting tired of this guy.
“I can’t be the only one that’s sort of getting tired of this guy.”
🤣 People never get tired of spreading his BS around. That’s what you did, and that’s why he puts out that BS, because people love spreading BS, from the WSJ on down to commenters here, that’s how he stays in the news, how he stays in front of everything.
If people get tired of him, they should stop reading and spreading his BS, for crying out loud. But then they’d have nothing else to do with their time and they’d get bored and go nuts and harass their spouse, and we’d suddenly get another baby boom or something.
FWIW, I totally agree that DJT should be called on his BS, you are not spreading it because so much of his drivel is in your face every day. People m need to stand up to it.
If you want to spread his BS around and thereby become his accomplice, fine, but don’t do it here.
People have a morbid fascination with BS. The bigger the BS, the more it gets spread around because people absolutely love spreading BS. That’s why the media produce clickbait BS. I see it in the comments every single day. Most of it I delete (trying to keep my little corner of the internet relatively clean).
Best of both worlds right?
You have a lame duck whom you can blame the economy on, now just need a fiscally responsible Republican to blaze in there and take the reins.
Speaking from a purely hypothetical Posistion here that we don’t live in crazy land and that would actually happen, the broken party actually nominate a different and legally sound candidate.
Meanwhile dems prob get Newsom, whom I don’t really have any issues with. But who knows. If AOC gets the nomination, it’s gonna be another Loss in 2028, people just aren’t ready for that YET.
Anywhooooo
Kalshi has Ossoff ahead of Newsom and AOC on the D side.
Marvin it might be sad to say, but I’ve never even heard that name. Haha!
If the EFFR is raised in September, any chance that lowers long term rates by showing a commitment to controlling inflation?
That would make sense to me. Long term rates increased after the Fed cut the FFR prematurely, so I could see the opposite happening.
Agreed.
It’s worth keeping an eye on the dollar index (DXY – see Marketwatch for quotes). It started plummeting after the July FOMC meeting, as investors lost confidence that the FOMC would raise rates to control inflation.
So put yourself in a treasury investor’s shoes: You just bought treasury bonds yielding very close to the rate of inflation, and the FOMC signaled they are in no hurry to address inflation. That one meeting caused the USD to drop 1% against a basket of world currencies over the following few weeks.
So in addition to barely breaking even on interest in real terms, you’re looking at the possibility of holding a currency in long-term decline because it is not offering investors a positive real rate of return, at a time when other currencies are doing so. AND you just got burnt because rates rose and caused your bonds to lose value. Of course you’ll demand a higher interest rate, or else shop for yield in other currencies. Bessent’s desperate currency intervention nonsense further reduces confidence.
Plummeting is a strange way to say dropped 2% and then leveled off. Moves of up to 5% are routine and aren’t really an indicator of any permanent change.
Shock after shock. Transitory. No rate hikes. Powell Jr. will explain the latest reason inflation is transitory, and mum is the word for the dying lower class.
I think it’s safe to admit the economy is running at full capacity, full throttle, and at risk of overheating and producing inflation. Government money-printing certainly helps, but at a risk to the currency.
This narrative limits the range of possibilities that can be expected to occur. The next recession will probably be caused by either (a) rate hikes, or (b) the bursting of an asset bubble. A combo of (a) then (b) seems like the most historically precedented outcome.
For all the complaining since the helicopter money of 2020-2021, it’s been a damn good six years for the economy.
“it’s been a damn good six years for the economy.”
It’s been almost 20 years since the last meaningful recession.
An amazing run.
In the 1970s full employment was 5% unemployment. People switching jobs, idle, etc.
Now 4.1% unemployment and we get hand wringing from the powers that control the narrative. The goal posts get moved to create the “concern” and hesitancy to raise rates.
Then we get Waller’s comments that if inflation stays 3.7% that would be steady and thus “ok”. But that’s nearly double the 2% goal.
The subjectivity is always bent one way it seems….away from the inflation problem.
Waller has bought into the let-it-run-hot theory that I have been talking about here for a couple of years — meaning more nominal economic growth (it was 8.0% in Q2), higher inflation in the 3-5% range, and higher long-term yields — as the only real way to deal with the huge debt. This means rate cuts if inflation drops toward 3% and rate hikes if it rises toward 5%. Not all of the 12 FOMC’s voting members are on board with this. But that’s how they’ve voted so far. I don’t know where Warsh stands on this, but to be honest, I don’t see any other way out of this debt issue either. Reducing the deficit even a little bit would hugely help, but that’s like so not going to happen.
In other words, FED is lying to us about its seriousness on 2% target.
They keep saying 2% is Goal as if they are taking Oath.
In 2025, just for Insurance against deteriorating Labor market, FED did 75 BP cuts. How about same this thought this year. Raise 75 BP just for Insurance against deteriorating Inflation.
Talk is cheap. As Wolf said in another thread, Waller is Warsh’s biggest opponent in terms of Old vs New FED. He is still hoping to get Chair job after 6 years.
Anyone who believes these people is an idiot.
It would be interesting to hear what Waller says about the 2% target.
He goes around shooting his mouth off, yet there is no serious questioning.
“What do you think of the 2% target Mr. Waller”
If he doesnt think it is a “target”, then it becomes clear we are being lied to and he is part of the game.
Let it become “clear” and out for all to see the Fed rhetoric is gaslighting.
They all agree: The “2% target” is etched in stone. But it’s not their actual target, their actual target seems to be 3-5%. But if they move the “2% target” to a “4% target” then they have trouble keeping inflation in the 3-5% range. The target is about anchoring inflation expectations, and they’re anchored near 2% now, which is one factor that keeps inflation from blowing out altogether.
Well they seem to have fooled the bond market. The nominal-TIPS 5 year breakeven spread is just 2.37%.
That means if any of us are holding nominal treasuries, and are not dependent upon them for living expenses, we should probably be trading them in for TIPS.
How are they going to deal with the bond markets response to the realization that the inflation target is actually 3-5%?
That’s why the Fed keeps hammering the concept of returning inflation to the 2% target. They’ve been doing that verbally for five years, and so far, the bond market really wants to believe them. If the bond market (buyers and sellers) finally see that inflation is going to be 3-5% in the future, regardless of what the Fed says, that would be quite a dramatic reaction in terms of the surge of the yields. The Fed could then hike policy rates fast enough and high enough to slow demand and bring inflation back to 2% and below 2% and keep it there, and after a while, the bond market would reset.
There’s always one last report that casts uncertainty before a fed meeting that paralyzes them. Cpi?
PPI and CPI.
Cleveland Fed Inflation Nowcast looks for higher inflation in September.
It seems logical, although perhaps flawed, that an aging/retiring population combined with crackdowns on immigration will make the jobs number look fine on the surface. I could see events that could be bad for investors, such as problems in private equity markets, but that doesn’t suggest employment will take a huge hit.
Not to suggest job numbers aren’t useful but to me not nearly as relevant in the past as to what it is might be signaling. That said, no way a September rate hike is in the cards regardless. If midterms deliver a significant GOP loss than political stakes are much less. Quite amusing to see the threats around trade with regard to interest rates. Complete clown show.
1) Yes, unemployment and initial claims are surface level metrics. Labor force participation and the dependency ratio are the big underlying metrics determining how much the economy produces and the balance of supply and demand. Until recently, labor force participation and dependency have been slow-moving, so we ignored it. Now though, demographic graying is hitting full force. Unemployment is low because the US is running out of young people to do all the work the older people need done.
2) The average American has no concept of why prices rise, or what tariffs, labor statistics, deficits, or interest rates have to do with it. Yet, their #1 political issue is they want the economy to “go up”. So their #1 issue is something they are clueless about. In this void, politicians make bold promises with zero plan and are elected based on rhetoric and salesmanship. Unfortunately, clueless voters can fall for claims that anyone with economics education or experience would never believe. This happened in Turkyie’ when Recep Erdogen convinced voters that cutting interest rates would reduce inflation because blah… blah… alternative theory. Now it looks like it might happen in the US, with Trump pressuring the Fed to lower rates, and people like Stephen Miran advocating alternative theories.
Alternative theories like MMT?
Trump is a real estate guy. Interest rates, to him, are the primary driver of business. He’s not all wrong about that, but he’s also not all right about it. He does understand the optics. People hate high loan rates.
The debt is the real driver of the issues. Trump keeps signing off on bloated budgets, but those budgets were set previously. They are carrying on with those because that’s the only thing that can get passed. That’s a mistake. We all know it is. But there also seems to be no way to change it since some people refuse to cut spending.
Leisure and hospitality are quite volatile.
Up 110,000 since June.
June 2026: -54,000
July 2026: -21,000*
Aug 2026: +62,000*
*provisional and will be revised eventually
Other growth centers for Aug:
Government +35,000
Health care and social assistance +28,400
Construction +22,000
Loss centers:
Information -23,000
Financial activities -11,000
Details right here, 16 charts by industry, plus lots of commentary by yours truly.
https://wolfstreet.com/2026/09/04/where-are-the-jobs-winners-and-losers-by-industry/
162K is the opening bid. I’ll wait for the revisions.
The last two months were revised up substantially. Read the article.
Just curious as the participation rate drops how are job adds figured into the mix?
I understand the unemployment and the total employment picture is healthy. So I too agree the only way out of high deficits is a hot economy which will eventually lead to unknown consequences. What i truly don’t understand is how large aging baby boomer generation and their death rate and spending rates figure into the economic forecasts .
Inflation is eating my retirement funds every year . I am 69
My kids speak about inflation as well and their tight budgets and higher and higher food and utility bills . My utilities have doubled here in Texas in the last 5 years water sewer and electric. Not so much NG
“The Fed can focus on getting its messy inflation-house in order.”
I hope this comment is tongue-in-cheek. I do love visiting your comment sections every month to watch the Titanic’s deck chairs being rearranged yet again. Those in steerage have drowned I think, but we’ll never hear about them. Statistics will take care of that.