From the “Mansion Shortage” in AI-bubble-epicenter San Francisco infecting mid-tier home prices, to Austin and Oakland where prices plunged over 25% since 2022.
By Wolf Richter for WOLF STREET.
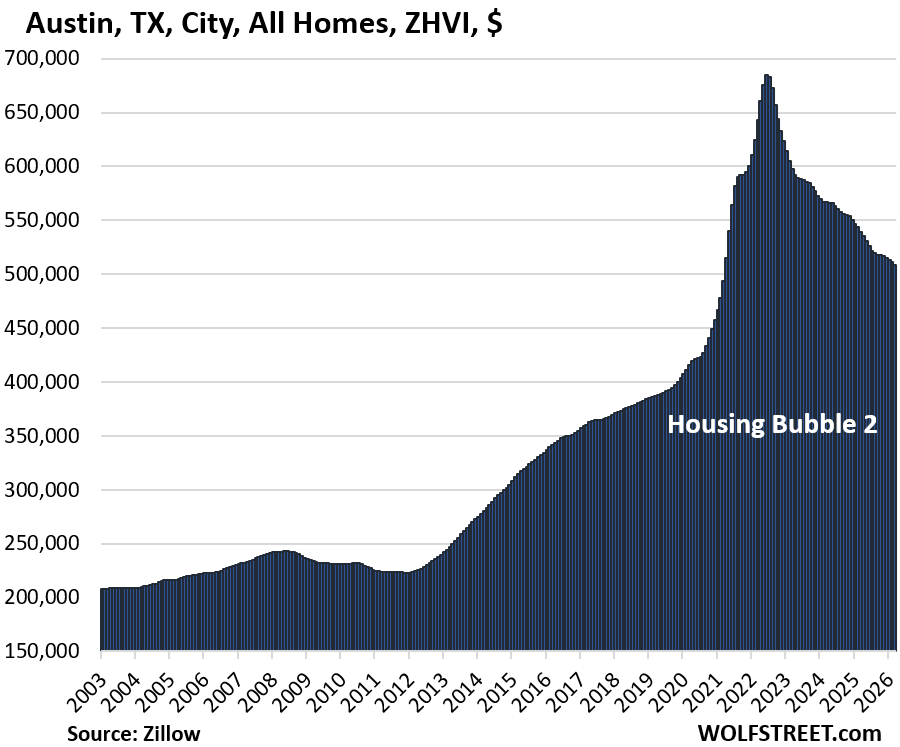
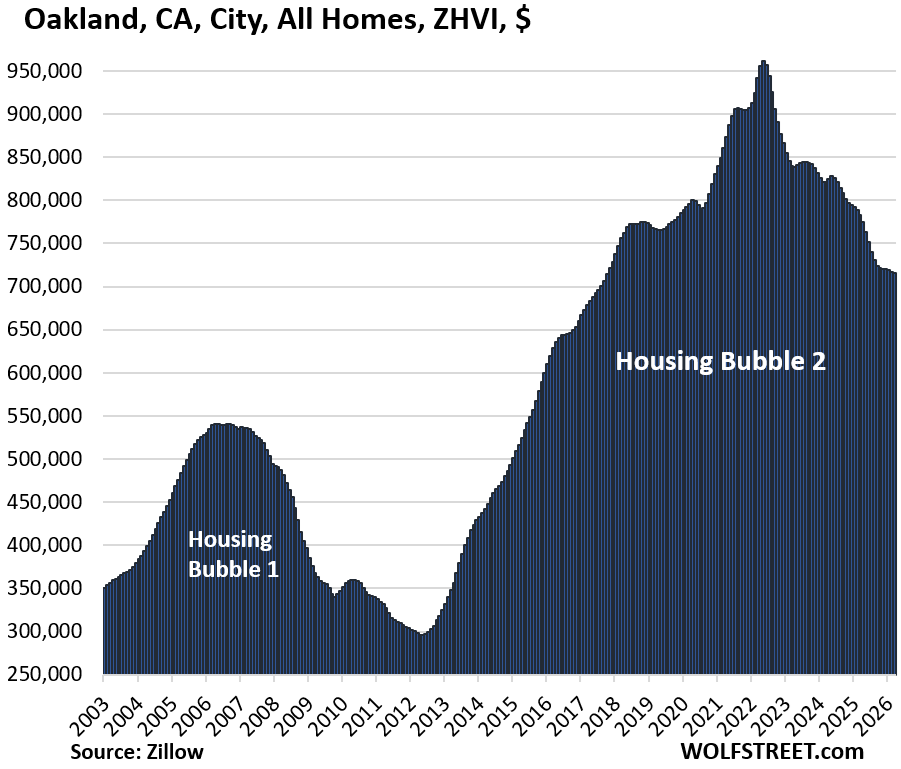
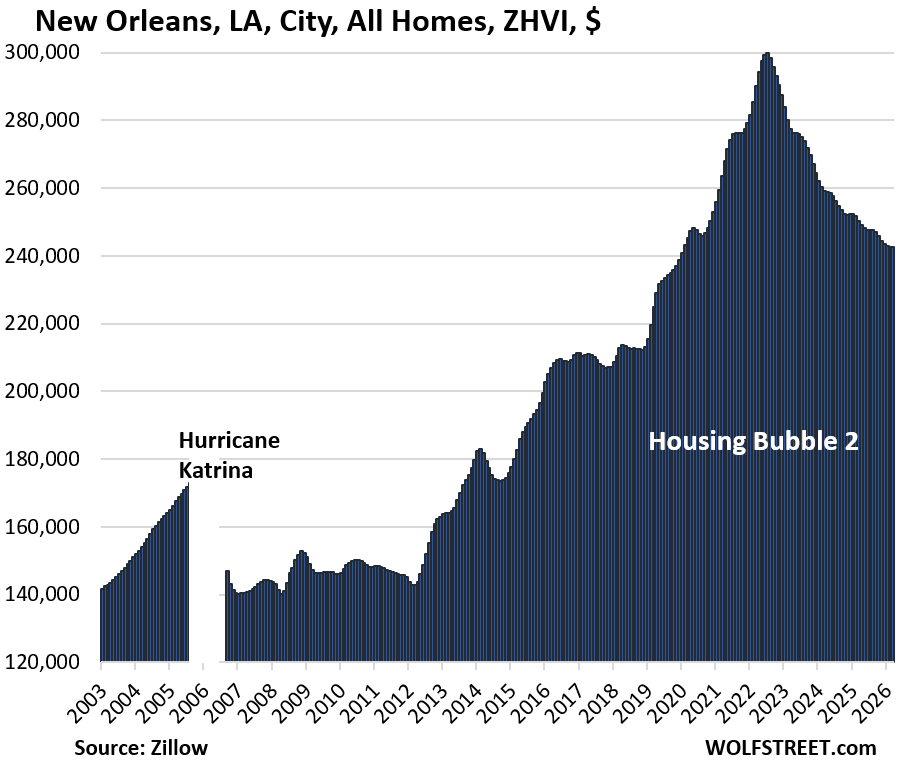
In 27 of the 33 big and expensive cities we track here, mid-tier home prices in March were down from their respective peaks in prior years, led by Austin (-26%), Oakland (-25%), and New Orleans (-19%).
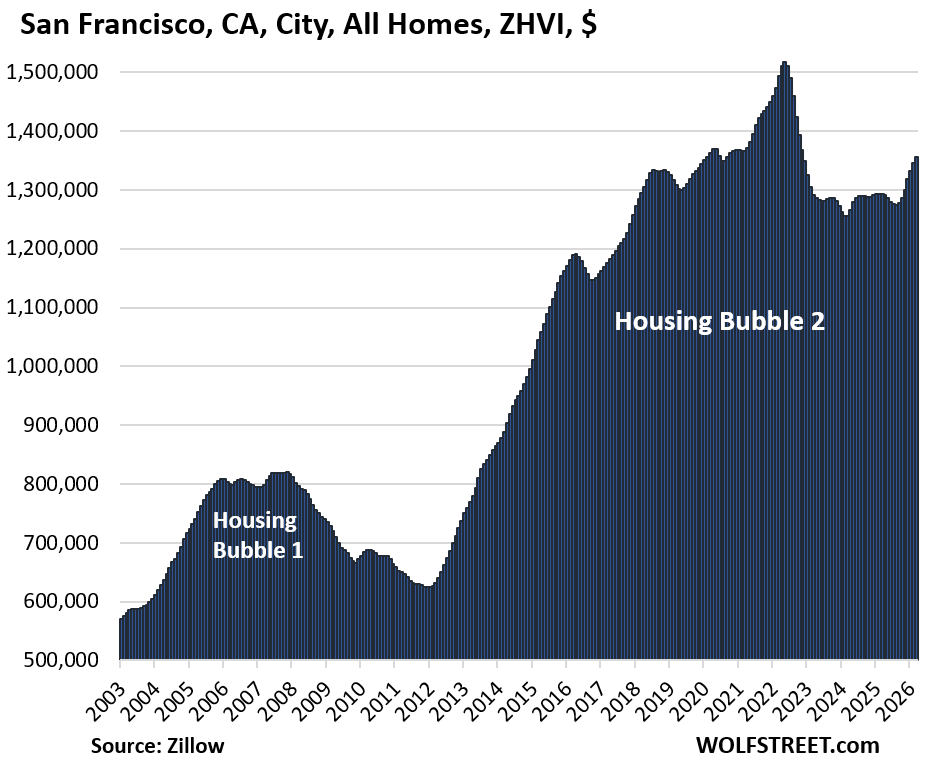
Now also filtering into these mid-tier home prices is the “mansion shortage” in San Francisco, the epicenter of the AI investment bubble. Total employment in the city dropped and the unemployment rate ticked up. But a relatively small number of super-highly paid people get hired by AI companies, and they’re chasing down expensive homes, and there aren’t enough expensive homes for sale, and so they throw easy-come-easy-go money around in the realm of mid-tier homes and drive up their prices. Despite the recent spike in mid-tier home prices, they’re still 11% below the all-time high of 2022. By contrast, prices dipped in San Jose, where mid-tier homes are even more expensive than in San Francisco.
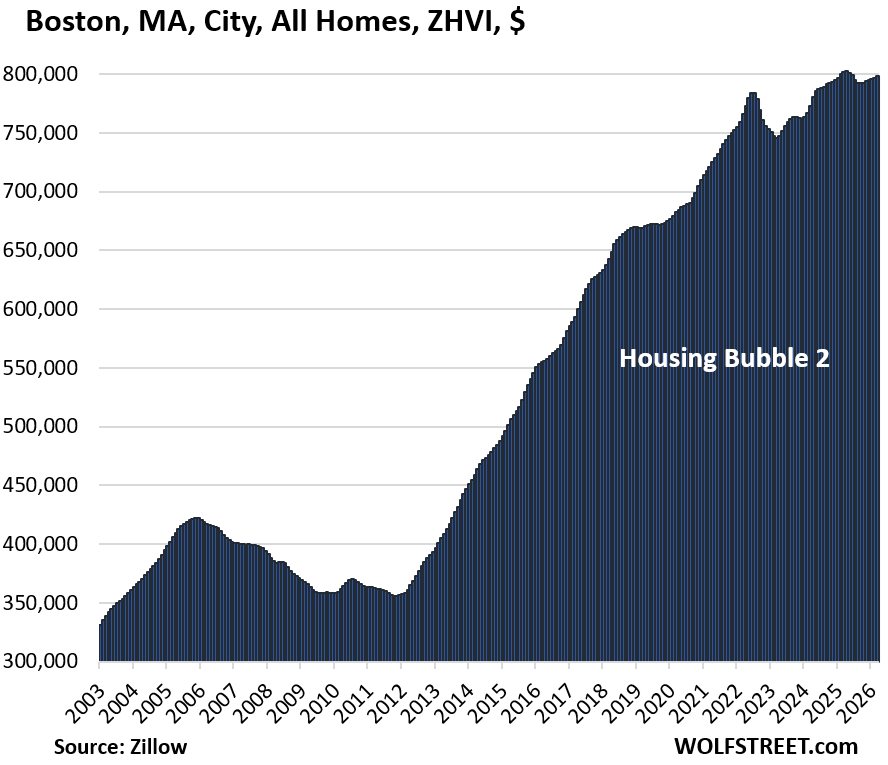
For one of the 33 cities, Boston, the jury was still out for March. April 2025 was the all-time high, and in March 2026, prices were down year-over-year by just a hair, and down by 1% from the high in April, but this is too close to call.
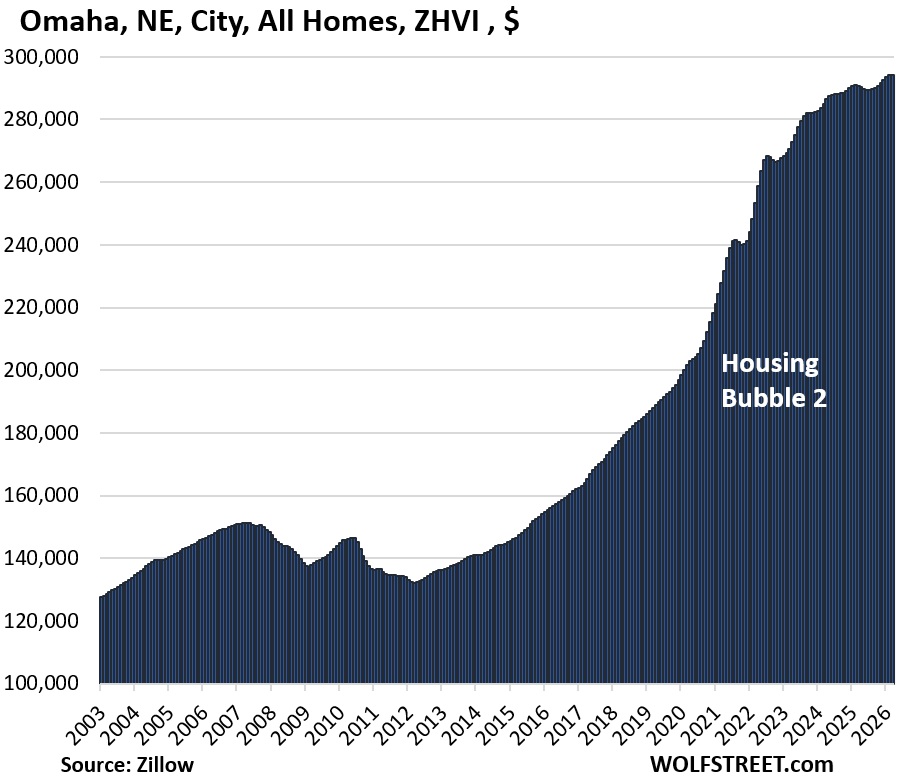
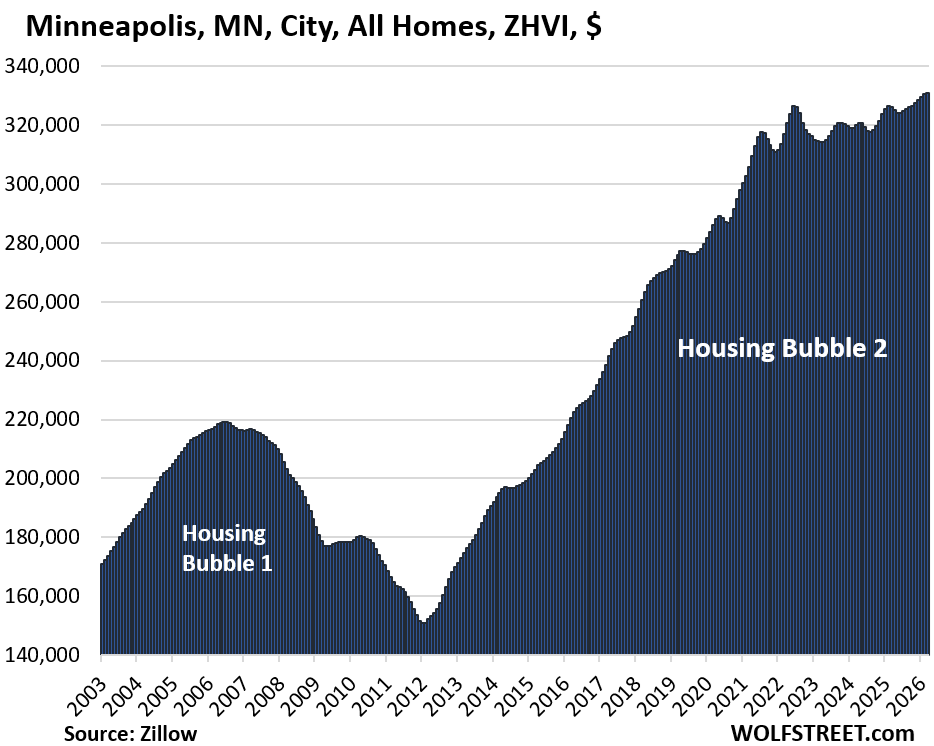
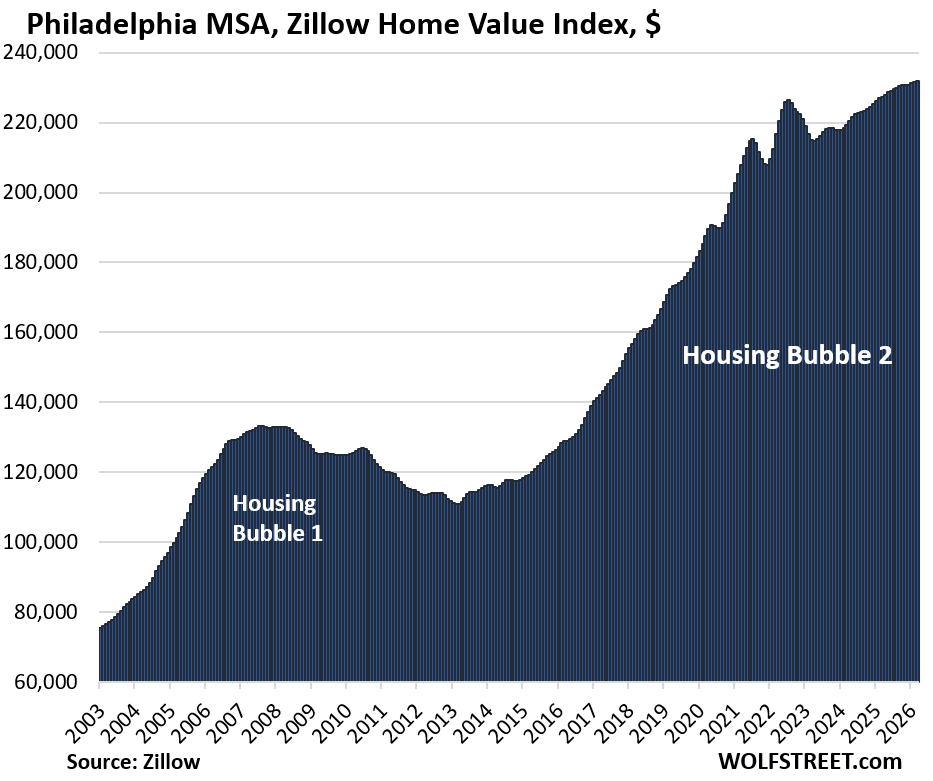
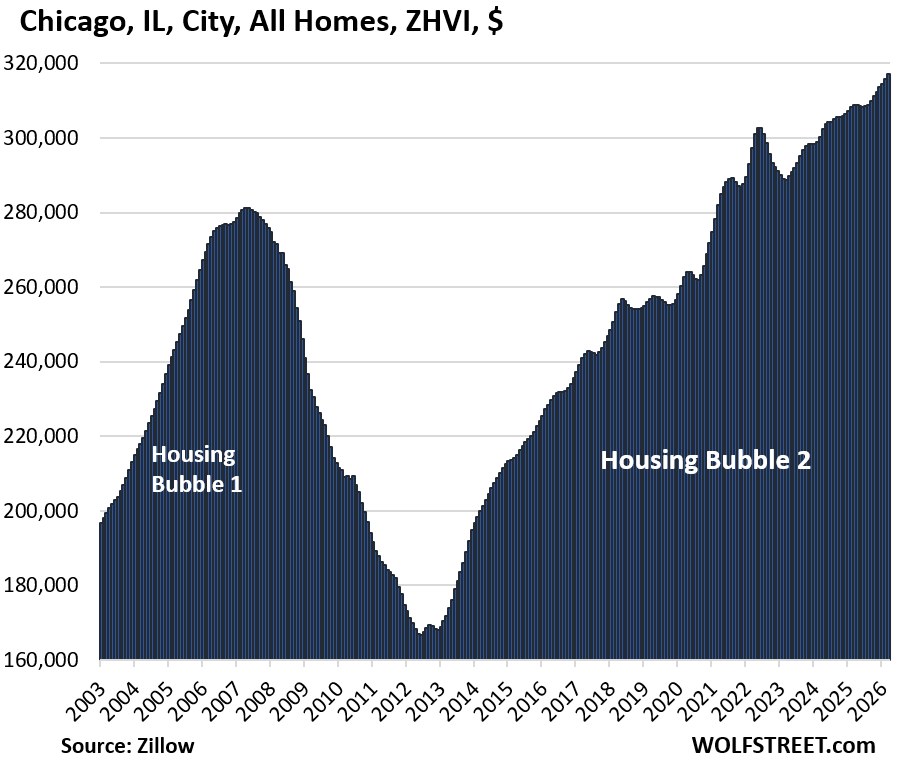
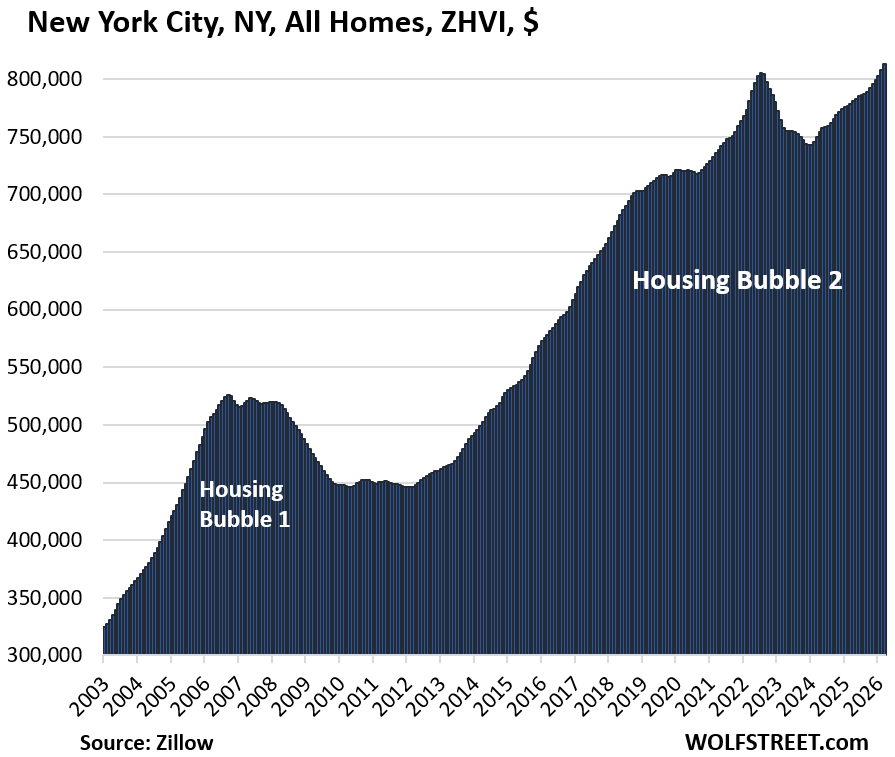
And in five of the 33 cities, prices rose to new highs in March, seasonally adjusted: New York City, Chicago, Philadelphia, Minneapolis, and Omaha. But price increases have been much slower than in the crazed free-money days of 2021 and 2022.
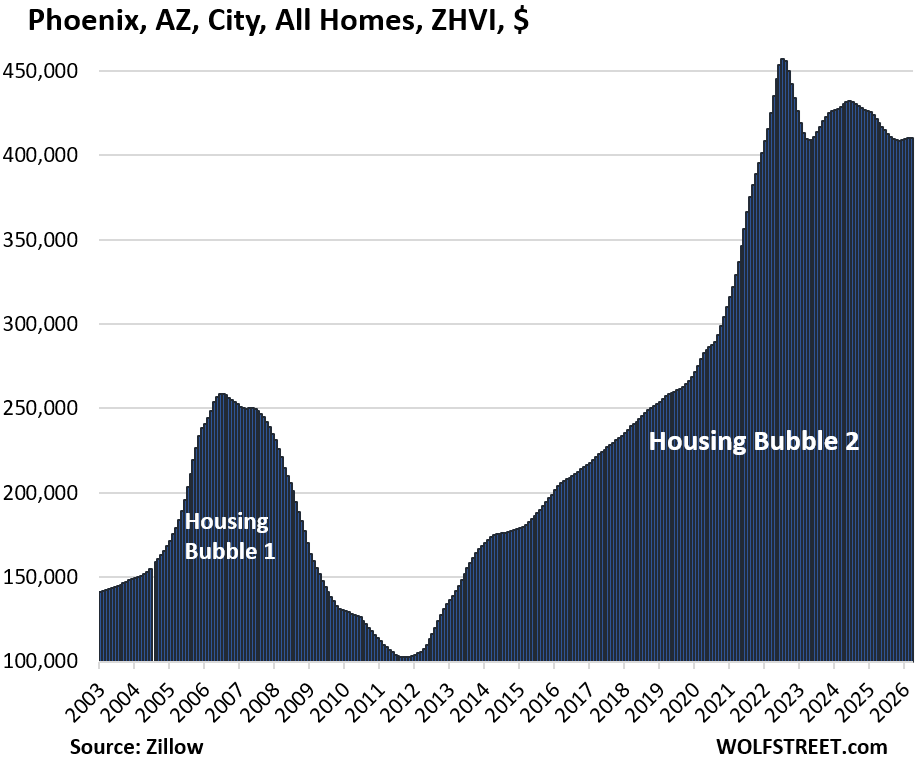
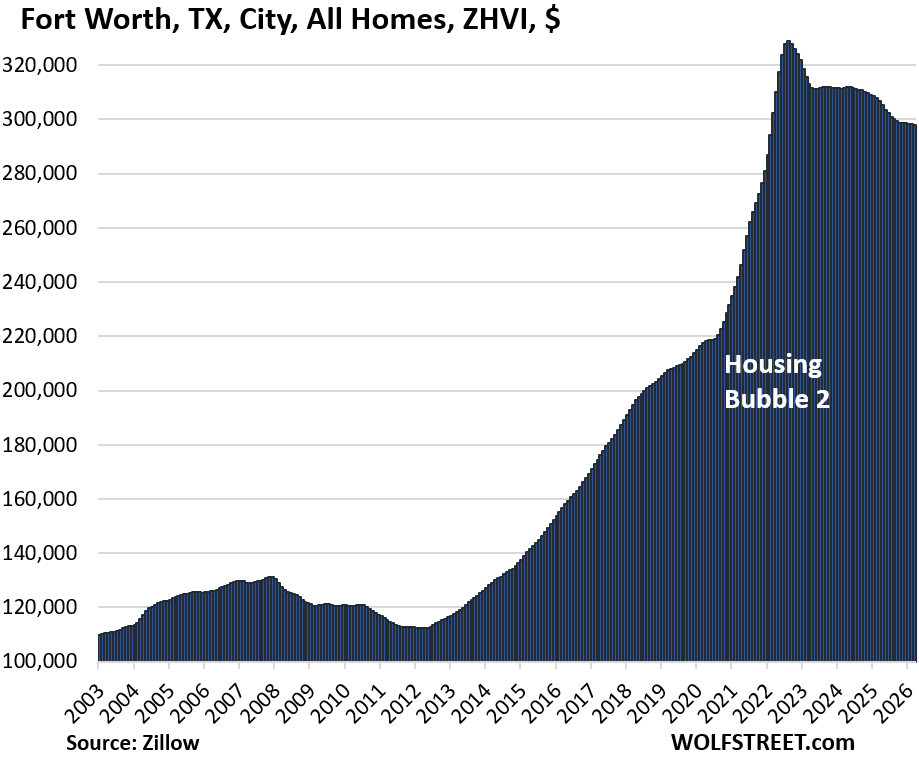
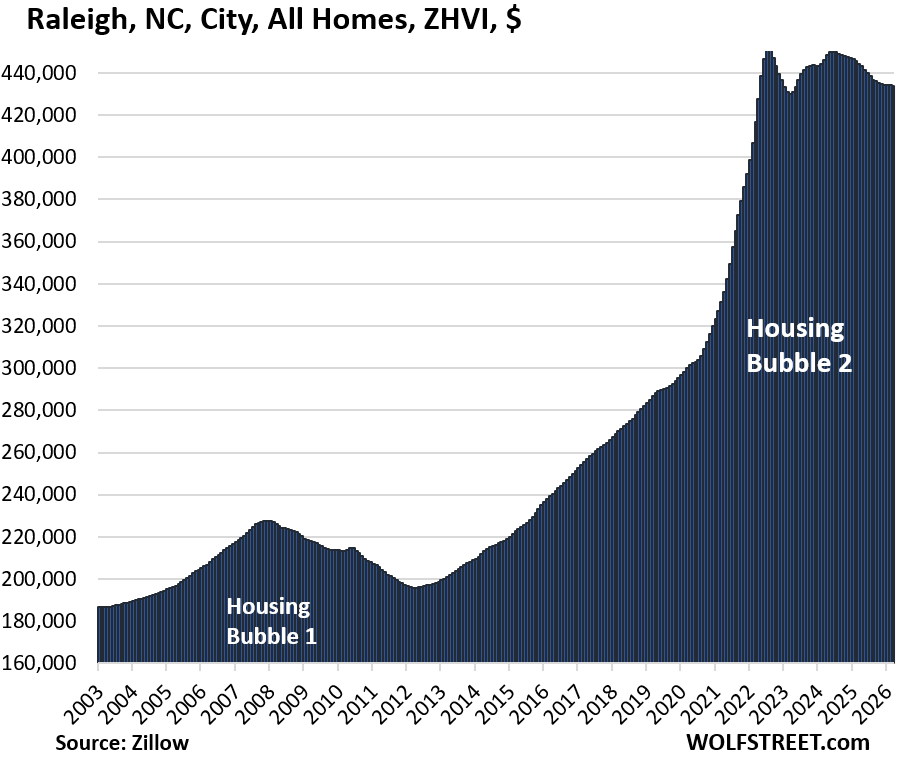
In the two years between mid-2020 and mid-2022, all of these cities had seen huge price spikes, some of which qualify for “price explosions”: Austin +62%, Phoenix +60%, Fort Worth +50%, Raleigh +49%, and Sacramento +39%.
Those price explosions were fueled by the Fed’s reckless free-money policies, which included trillions of dollars of purchases of Treasury securities and mortgage-backed securities, which led to the below-3% mortgage rates, even as inflation was raging at the time toward 9%, which led to crazed FOMO buying behavior at the time. Those price gains came on top of the already outsized price gains in the prior years.
The price measurement here is the seasonally adjusted three-month-average mid-tier Zillow Home Value Index (ZHVI) for single-family homes, condos, and co-ops, released today. Mid-tier means the middle-third by price in each market. The ZHVI is based on millions of data points in Zillow’s “Database of All Homes,” including from public records (tax data), MLS, brokerages, local Realtor Associations, real-estate agents, and households across the US. It includes pricing data for off-market deals and for-sale-by-owner deals.
To qualify for the list of the 33 most splendid housing bubbles, the city must be one of the largest by population and be among the expensive cities where the ZHVI for all mid-tier homes must have been at least $300,000 at some point.
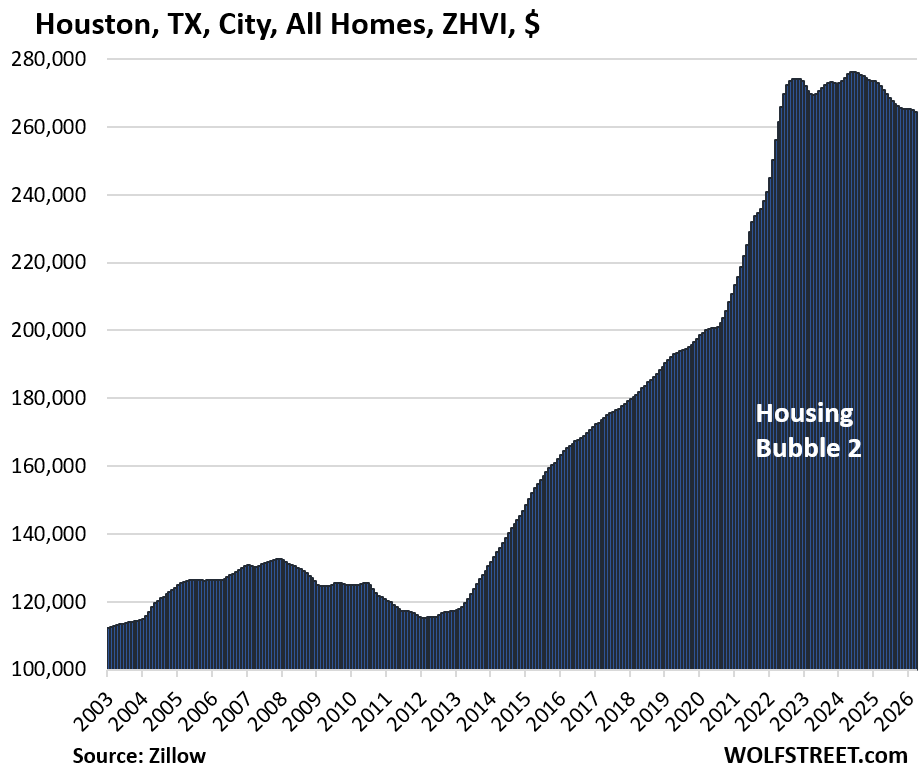
Some cities that are large enough don’t qualify for this list because the ZHVI for all homes never reached $300,000, despite the surge in recent years, such as the cities of New Orleans, Houston, Philadelphia, Memphis, Oklahoma City, Tulsa, Kansas City, Cincinnati, Pittsburgh, etc.
But Houston, Philadelphia, New Orleans, and Omaha are included anyway: Houston and Philadelphia because they’re the fourth-largest and sixth-largest cities in the US; New Orleans because it got within a hair of $300,000 in 2022; and Omaha, because it’s within a hair of $300,000 now, and is thereby the most expensive big city in the center of the US.
The 33 Most Splendid Housing Bubbles.
In the little tables, MoM = month over month; YoY = year-over-year. The column furthest to the right shows the percentage increase “since 2000.” All seasonally adjusted.
| Austin, TX, City, All Homes, Prices | |||
| From Jun 2022 peak | MoM | YoY | Since 2000 |
| -26% | -0.5% | -5.7% | 155% |
Lowest since March 2021.
| Oakland, City, CA, All Homes, Prices | |||
| From May 2022 peak | MoM | YoY | Since 2000 |
| -25% | -0.2% | -8.5% | 246% |
Lowest since October 2017.
| New Orleans, LA, City, All Homes, Prices | |||
| From Jun 2022 peak | MoM | YoY | Since 2007 |
| -19.1% | -0.1% | -3.2% | 106% |
Lowest since February 2020.
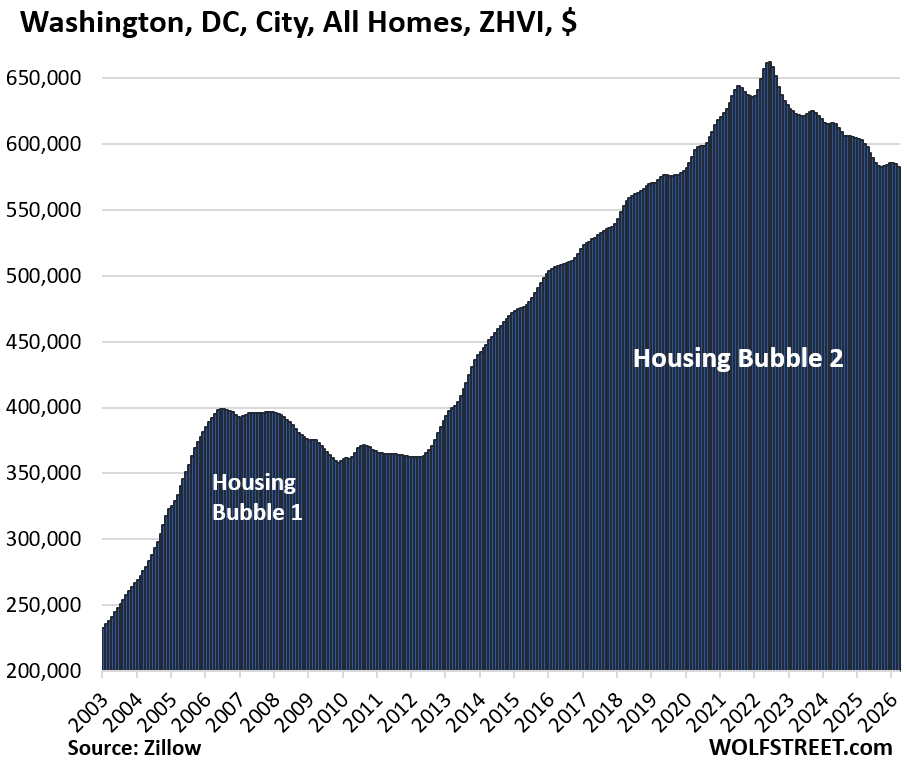
| Washington D.C., All Homes, Prices | |||
| From Jun 2022 peak | MoM | YoY | Since 2000 |
| -12% | -0.3% | -2.9% | 258% |
| San Francisco, CA, City, All Homes, Prices | |||
| From May 2022 peak | MoM | YoY | Since 2000 |
| -11% | 0.8% | 5.0% | 226% |
The “Mansion Shortage” infects mid-tier home prices.
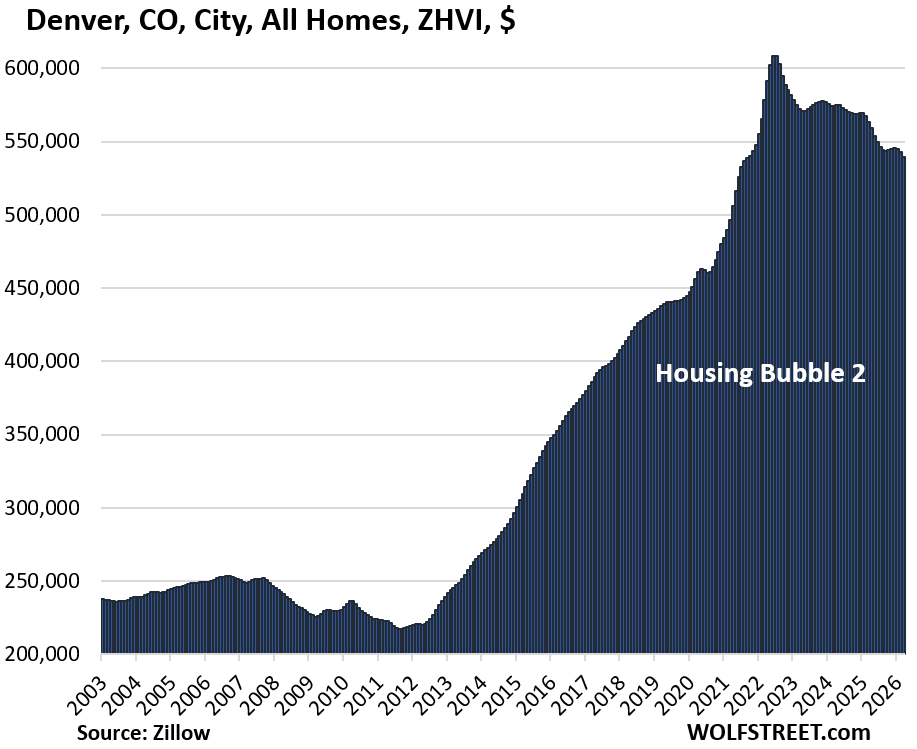
| Denver, CO, City, All Homes, Prices | |||
| From Jun 2022 peak | MoM | YoY | Since 2000 |
| -11% | -0.6% | -4.3% | 200% |
| Phoenix, AZ, City, All Homes, Prices | |||
| From Jul 2022 peak | MoM | YoY | Since 2000 |
| -10% | -0.1% | -2.7% | 250% |
| Fort Worth, TX, City, All Homes, Prices | |||
| From Aug 2022 peak | MoM | YoY | Since 2000 |
| -9% | -0.1% | -2.8% | 189% |
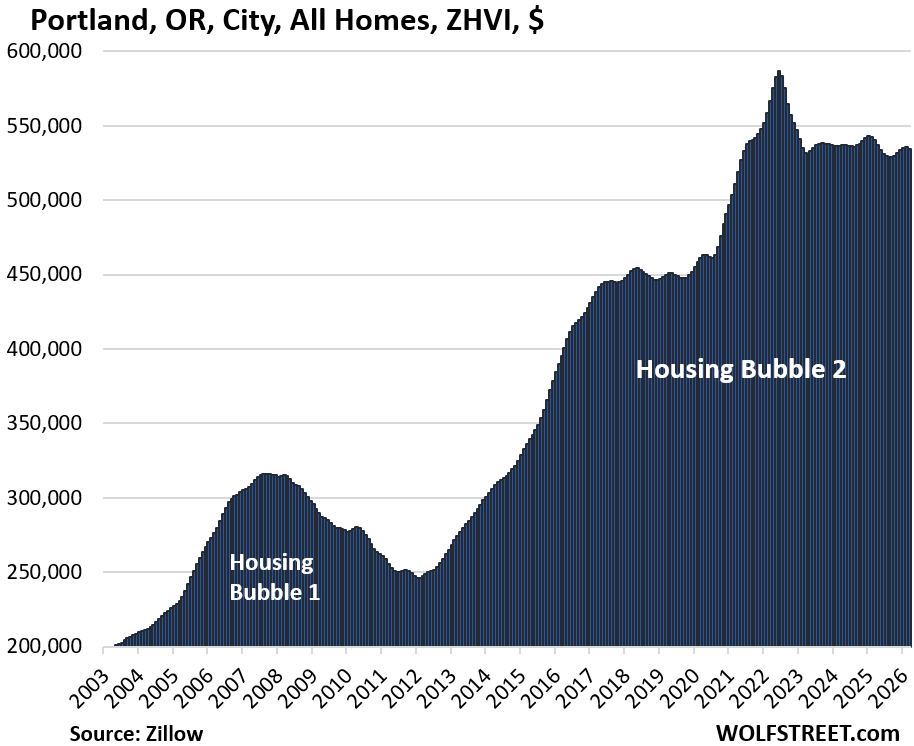
| Portland, OR, City, All Homes, Prices | |||
| From May 2022 peak | MoM | YoY | Since 2000 |
| -9% | -0.2% | -1.1% | 217% |
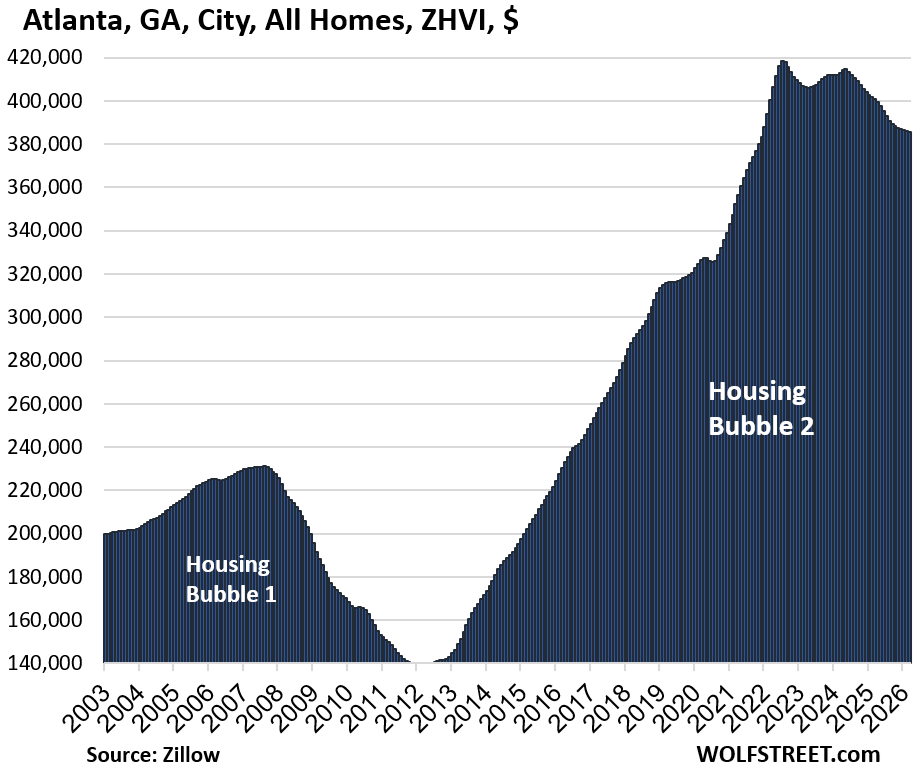
| Atlanta, GA, City, All Homes, Prices | |||
| From Jun 2022 peak | MoM | YoY | Since 2000 |
| -8% | -0.1% | -3.8% | 140% |
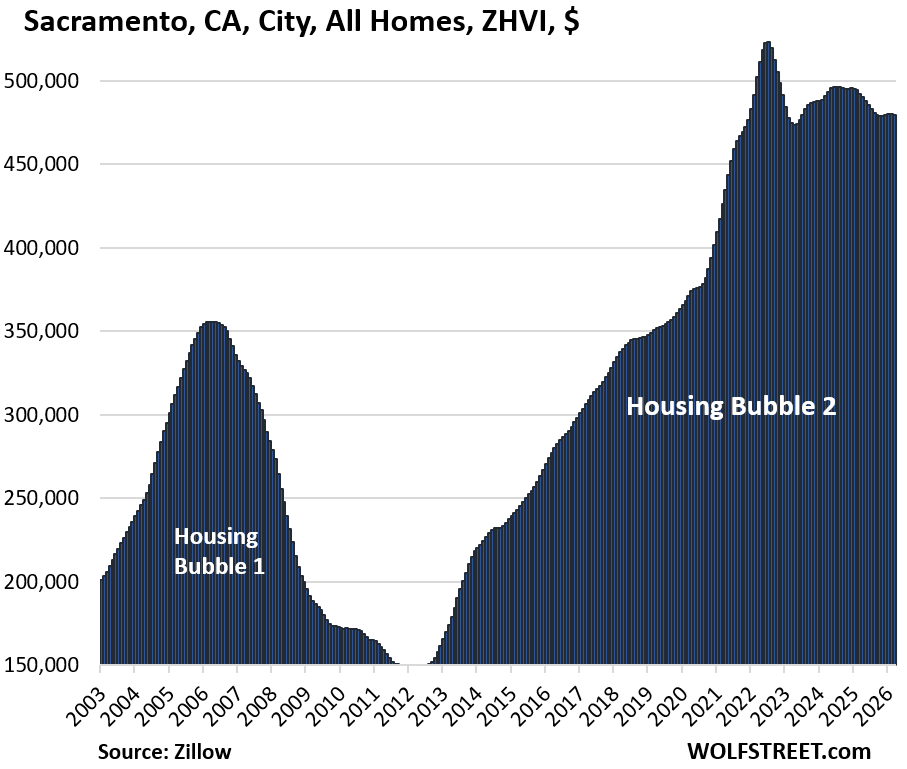
| Sacramento, CA, City, All Homes, Prices | |||
| From July 2022 peak | MoM | YoY | Since 2000 |
| -8% | -0.1% | -2.5% | 286% |
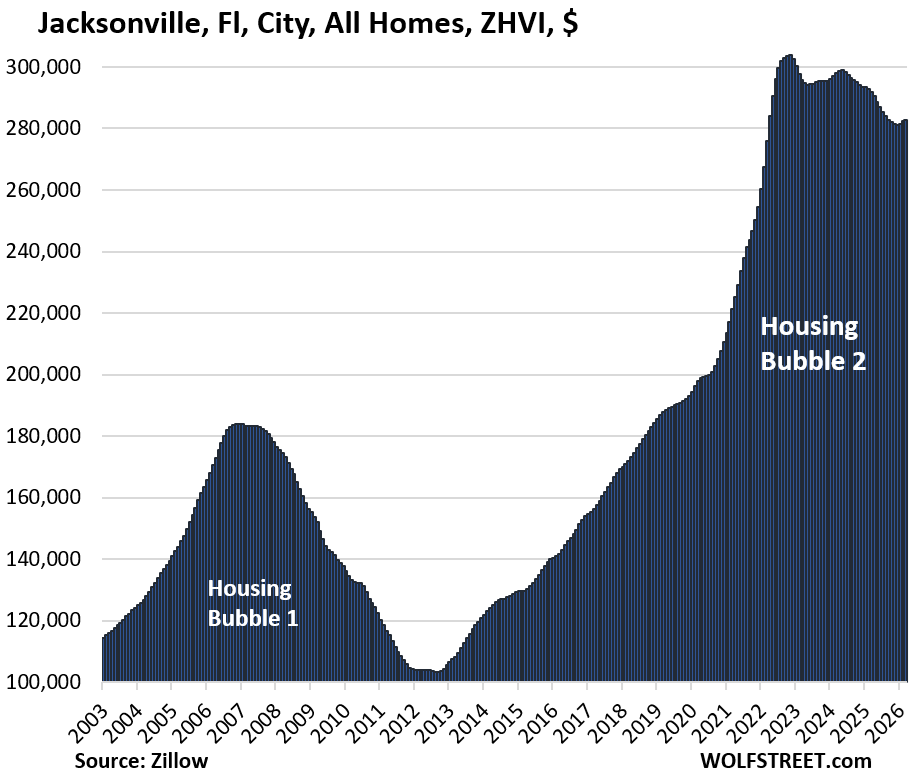
| Jacksonville, FL, City, All Homes, Prices | |||
| From Nov 2022 peak | MoM | YoY | Since 2000 |
| -7% | 0.2% | -3.1% | 204% |
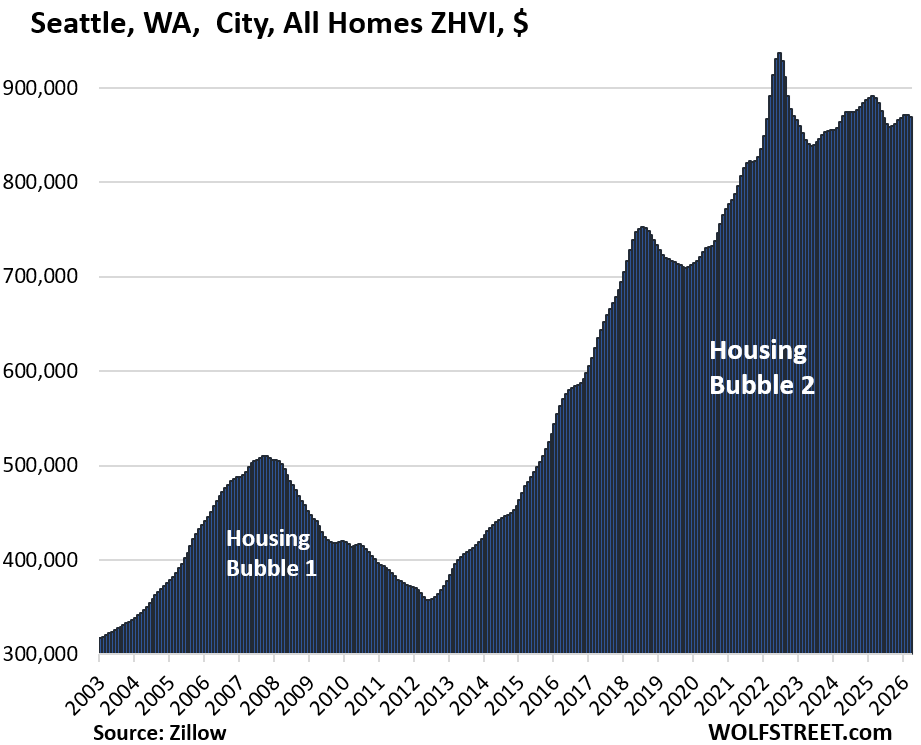
| Seattle, WA, City, All Homes, Prices | |||
| From May 2022 peak | MoM | YoY | Since 2000 |
| -7% | -0.3% | -2.3% | 230% |
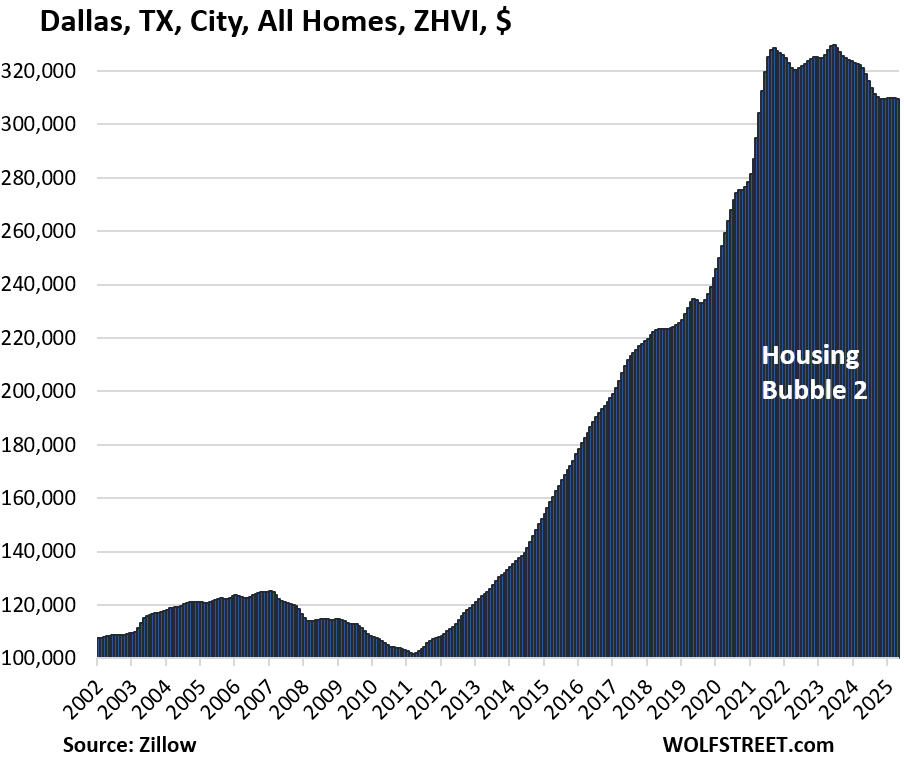
| Dallas, TX, City, All Homes, Prices | |||
| From May 2024 peak | MoM | YoY | Since 2000 |
| -6% | -0.2% | -3.6% | 215% |
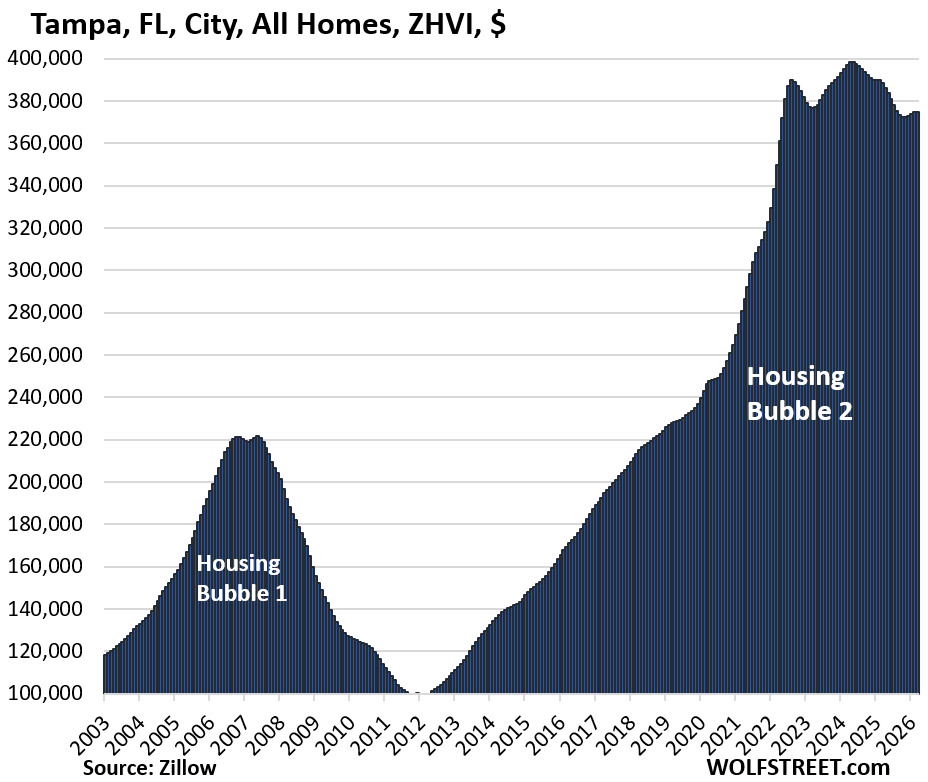
| Tampa, FL, City, All Homes, Prices | |||
| From May 2024 peak | MoM | YoY | Since 2000 |
| -6% | 0.1% | -3.5% | 312% |
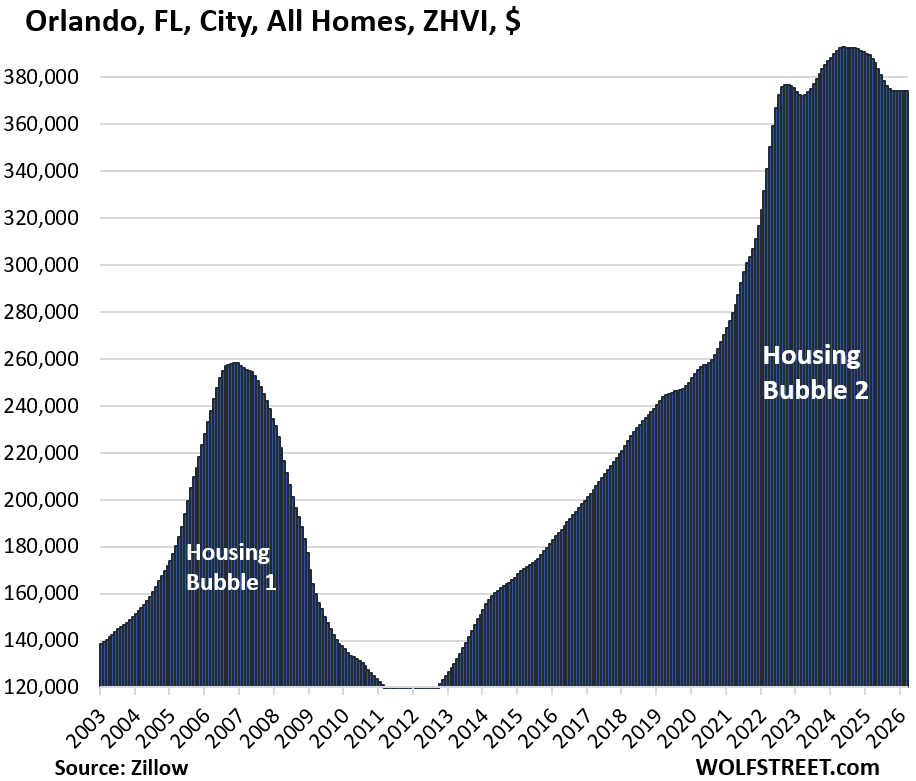
| Orlando, FL, City, All Homes, Prices | |||
| From Jun 2024 peak | MoM | YoY | Since 2000 |
| -5% | -0.1% | -3.5% | 241% |
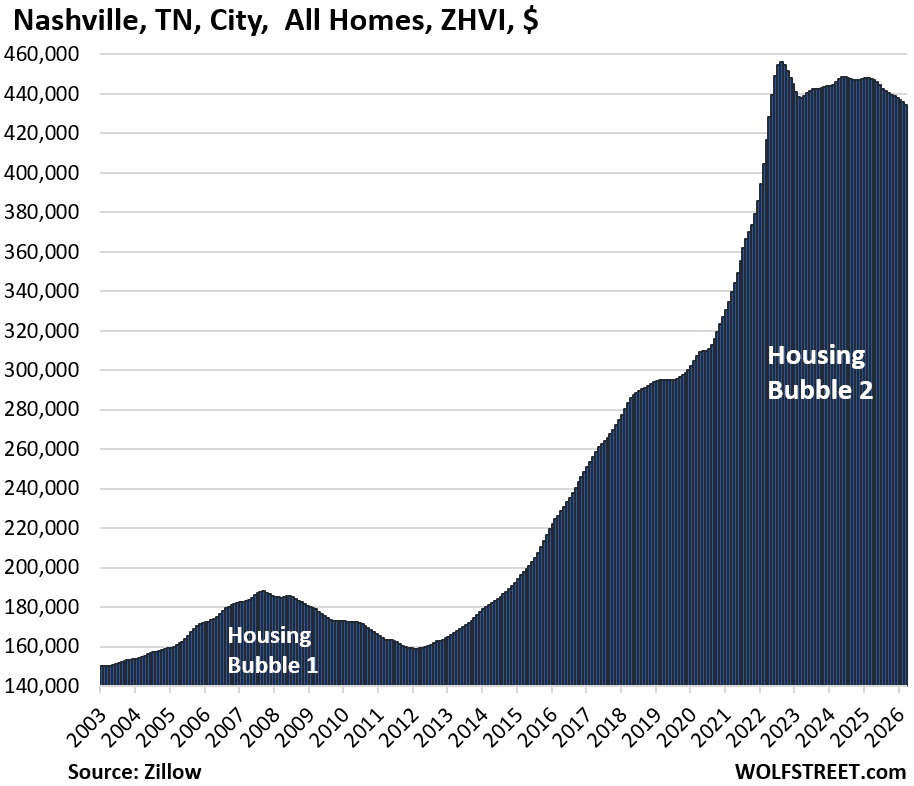
| Nashville, TN, City, All Homes, Prices | |||
| From July 2022 peak | MoM | YoY | Since 2000 |
| -5% | -0.4% | -3.0% | 214% |
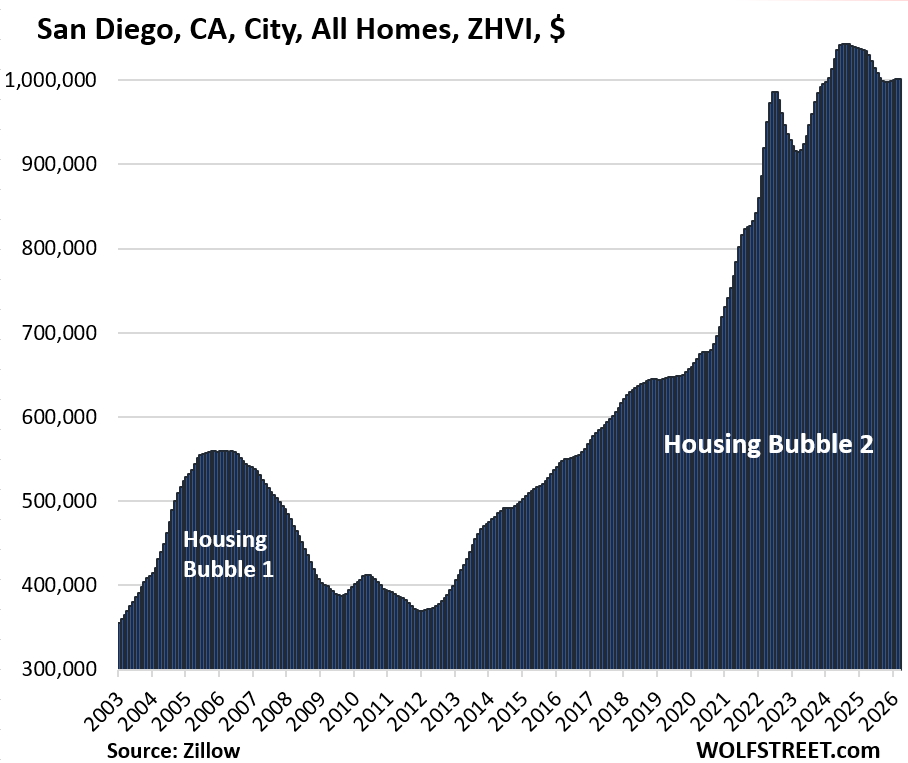
| San Diego, CA, City, All Homes, Prices | |||
| From July 2024 peak | MoM | YoY | Since 2000 |
| -4% | 0.0% | -3.2% | 348% |
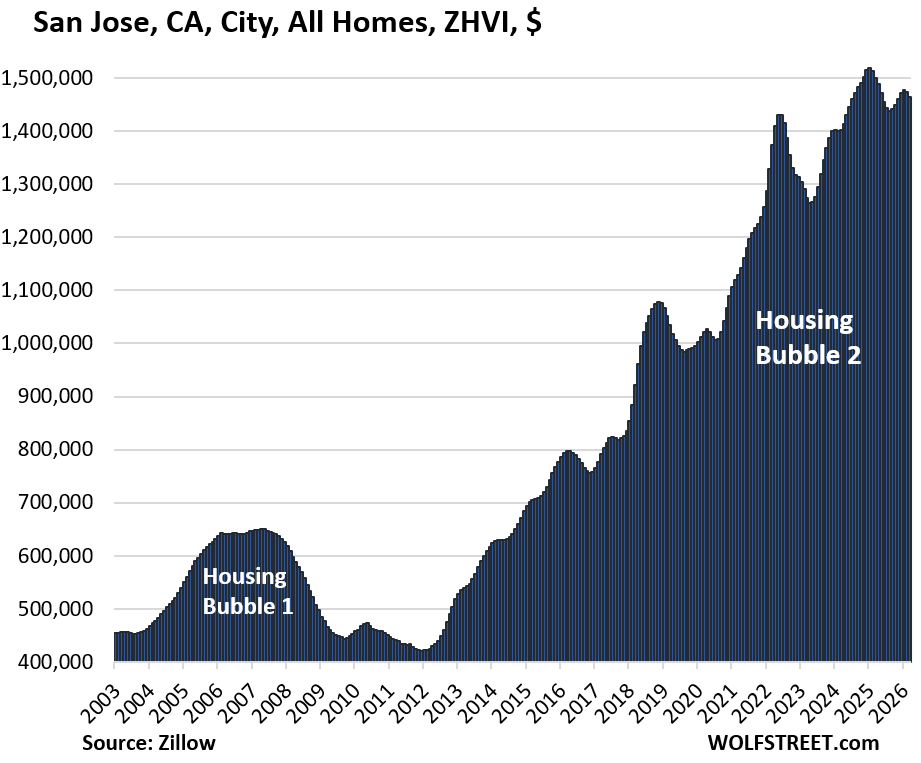
| San Jose, CA, City, All Homes, Prices | |||
| From Jan 2025 peak | MoM | YoY | Since 2000 |
| -4% | -0.6% | -2.5% | 341% |
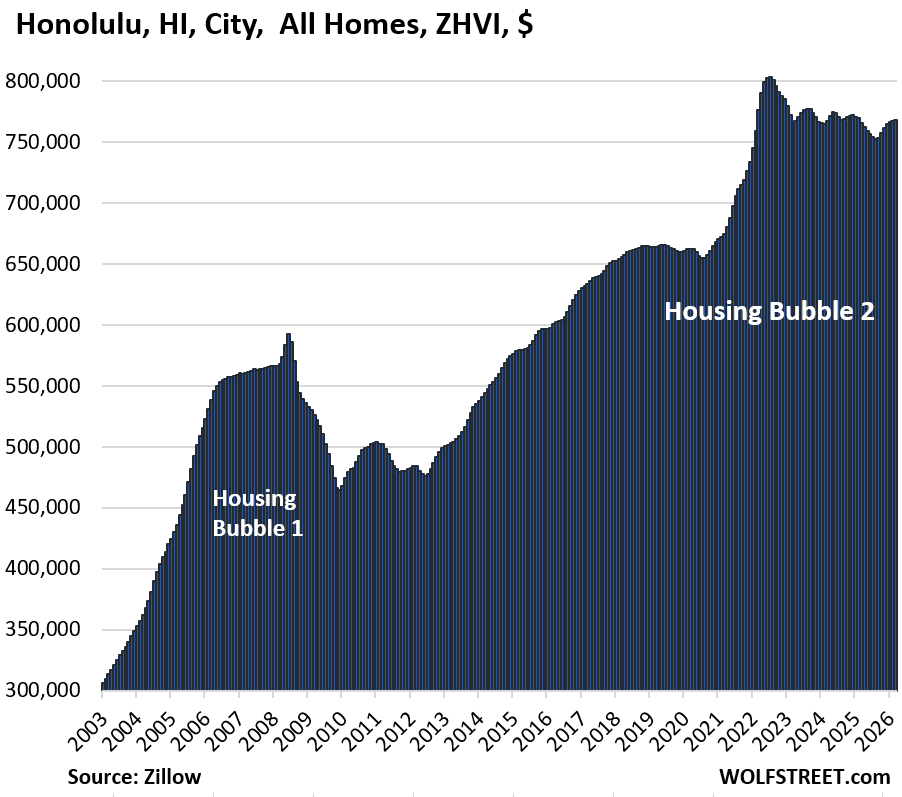
| Honolulu, HI, City, All Homes, Prices | |||
| From Jun 2022 peak | MoM | YoY | Since 2000 |
| -4% | 0.1% | 0.3% | 207% |
| Raleigh, NC, City, All Homes, Prices | |||
| From July 2022 peak | MoM | YoY | Since 2000 |
| -4% | 0.0% | -2.3% | 149% |
| Houston, TX, City, All Homes, Prices | |||
| From Jul 2022 peak | MoM | YoY | Since 2000 |
| -4% | -0.2% | -2.9% | 154% |
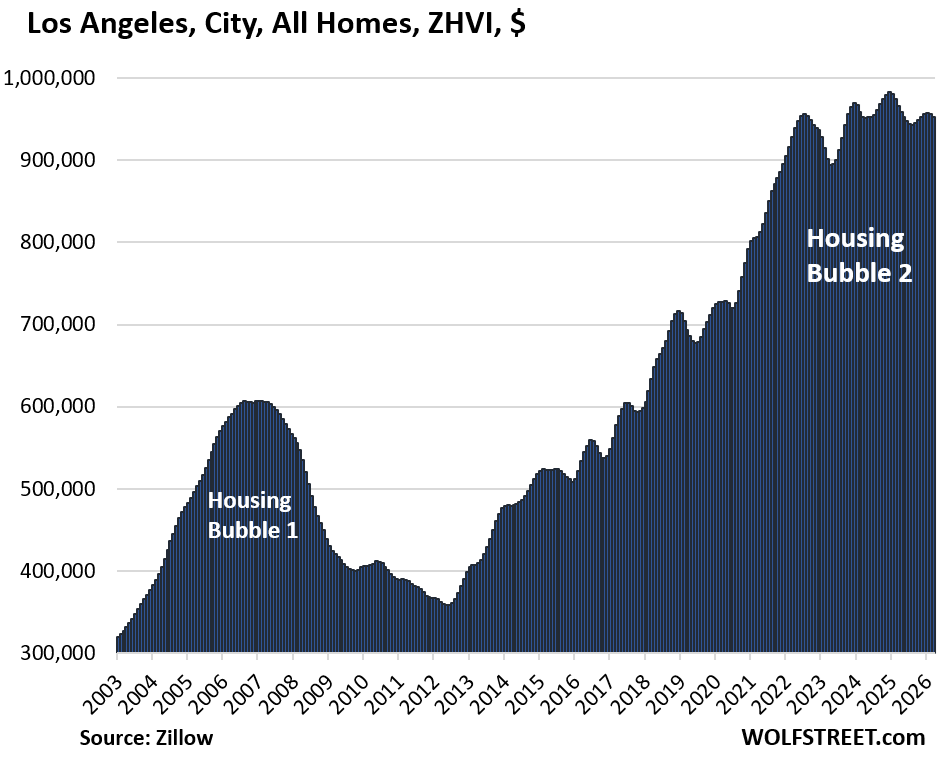
| Los Angeles, CA, City, All Homes, Prices | |||
| From Dec 2024 peak | MoM | YoY | Since 2000 |
| -3% | -0.4% | -1.4% | 327% |
Prices in the city of Los Angeles, despite three years of wobbling up and down, are back where they’d been in March 2022.
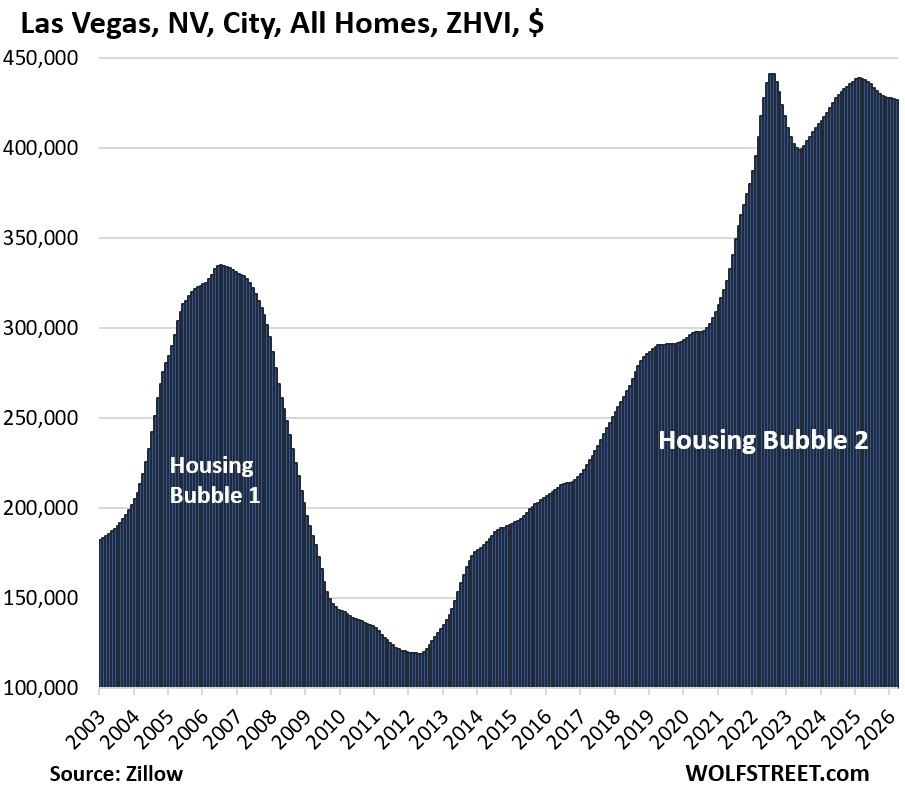
| Las Vegas, NV, City, All Homes, Prices | |||
| From June 2022 peak | MoM | YoY | Since 2000 |
| -3% | -0.2% | -2.7% | 177% |
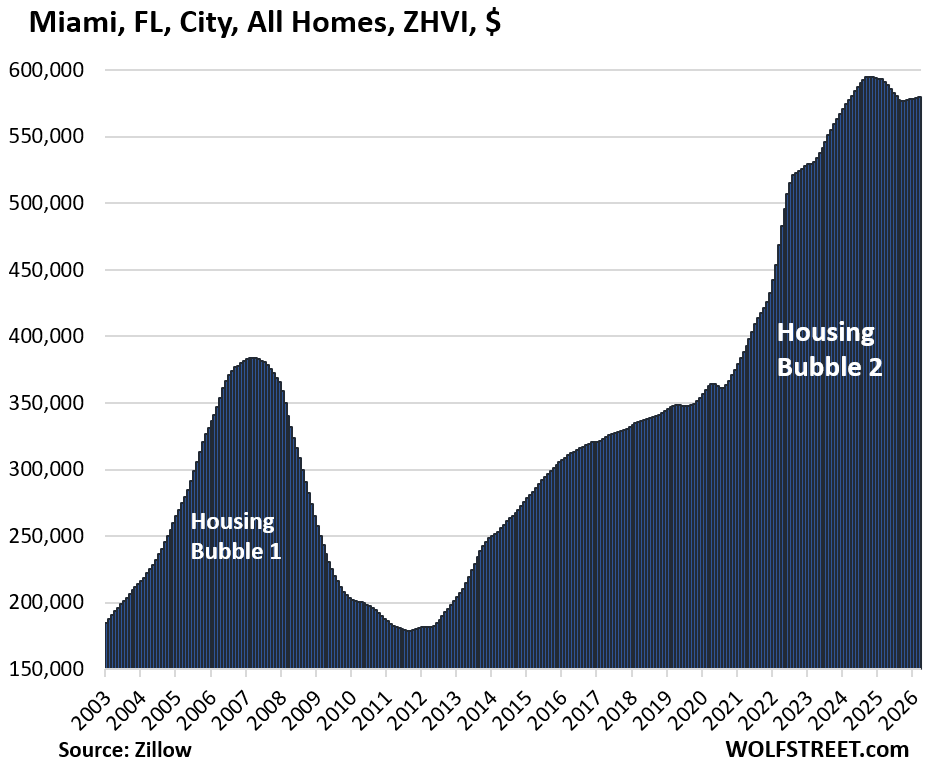
| Miami, FL City, All Homes, Prices | |||
| From Oct 2024 peak | MoM | YoY | Since 2000 |
| -3% | 0.1% | -2.0% | 342% |
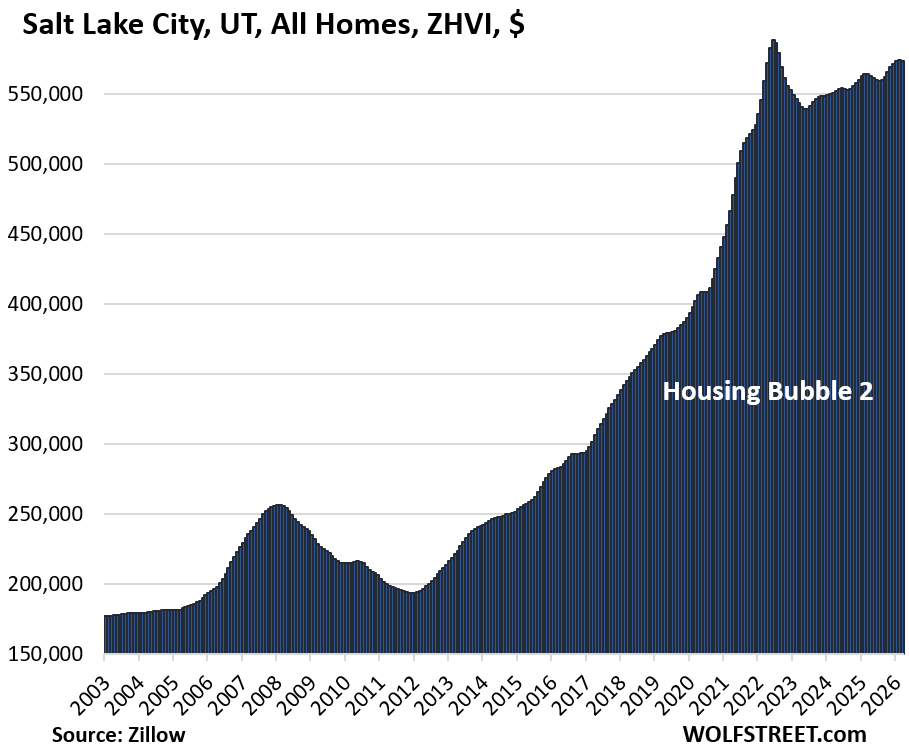
| Salt Lake City, UT, All Homes, Prices | |||
| From July 2022 peak | MoM | YoY | Since 2000 |
| -3% | -0.2% | 1.6% | 241% |
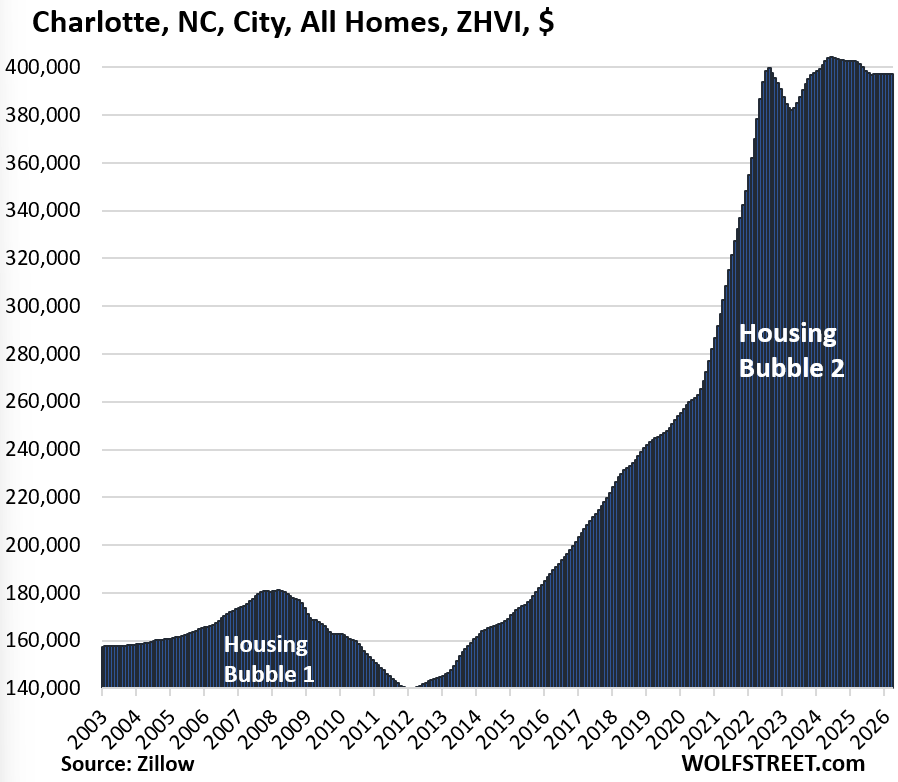
| Charlotte, NC, City, All Homes, Prices | |||
| From May 2024 peak | MoM | YoY | Since 2000 |
| -2% | -0.0% | -1.3% | 168% |
| Boston, MA, City, All Homes, Prices | ||
| MoM | YoY | Since 2000 |
| 0.2% | -0.4% | 266% |
| Omaha, NE, City, All Homes, Prices | ||
| MoM | YoY | Since 2000 |
| 0.0% | 1.2% | 151% |
| Minneapolis, MN, City, All Homes, Prices | |||
| MoM | YoY | Since 2000 | |
| 0.1% | 1.4% | 197% | |
| Philadelphia MSA, All Homes, Prices | ||
| MoM | YoY | Since 2000 |
| 0.0% | 2.0% | 273% |
| Chicago, IL, City, All Homes, Prices | ||
| MoM | YoY | Since 2000 |
| 0.4% | 2.8% | 115.9% |
| New York City, NY, All Homes, Prices | ||
| MoM | YoY | Since 2000 |
| 0.6% | 4.5% | 239% |
In case you missed it: Single-Family Home Sales Drop Further into Deepfreeze, Supply Hits 10-Year High, Condo Sales Plunge to Record Low
Enjoy reading WOLF STREET and want to support it? You can donate. I appreciate it immensely. Click on the mug to find out how:

![]()
As a mid 30’s young professional, what is one supposed to do? Finally at the point where we have stable, well paying jobs and savings to put towards a home. Yet, prices have shot up over the last few years and it appears buying now may result in several years of slowly decreasing prices.
Yet, renting places you at the whim of your landlord and may mean living in a smaller, apartment unit in the years we would like to have more space for potential children.
Rent a house and give yourself the right to renew your lease each year for 3-5 years with a cap on rent increases. Lots of landlords would love to have you as a tenant. You’d get a sizeable rent discount because landlord has 12 most occupancy and a bigger discount if are handy enough to fix small items on your own.
Excellent ideas Bobber,agree Mark is the kind of tenant that landlords want.
I might though say on renewal of lease when one thinks time to buy see if you could change to a tenant at will with say 2 months notice,feel a landlord you have dealt with awhile might be amenable to this and gives you breathing room you feel a time to buy.
In my neighborhood
You can buy a property and pay approximately 10k per month
Or
Rent the same home for 5k per month
The math has never been clearer
I am in socal
The math is clear pretty much everywhere. The difference in my area (Raleigh metro) to buy vs. rent has come down slightly from ~$1,500/mo in favor of renting when we first moved here in 2022, to about $500-$1,000/mo cheaper today for similar class of housing.
… And that’s just the mortgage, insurance and property taxes, let alone taking into account any repairs (which ALL of these existing homes need), so factor in another $1,000/mo for that, at least initially, with possibly being able to drop to $500/mo after you get things under control. So we’re realistically still talking an extra $2,000-$3,000/mo in favor of renting. That’s a lot of lettuce.
We are renter’s of choice after selling our home in 2022 for the move, and I don’t feel like I’m “throwing money away on rent” AT ALL! We’re only here for the public school system, which my kid is out of in 12 years. We can live anywhere in NC assuming my wife is still working by then, or, go wherever we want if not.
It’s going to take a whole lot of fallout for us to ever buy a house again vs. just continuing to invest the equity payout from our original house.
I see many 3 generation rentals now
grandma, mom/dad, kids
our son bought house and then rented out 2 rooms
paid for his mortgage then
Buying a house is a big decision. The fear is that price will go down especially in market like now. I suggest to look for desirable properties; the ones with curb appeal and are easier to sell. And always budget for the unexpected. Repairs can quickly add up. If there’s nothing in your price range, rent and keep adding to the savings for your down payment. Don’t buy a condo unless the HOA budget is flush with reserves. Special assessments can quickly add up draining you of cash. Amenities also cost a lot to maintain and exposes you to service inflation that is stubbornly high as Wolf points out time and time again. You don’t want HOA dues going up 5-10% a year.
My own experience was ok. I lucked out buying at the bottom twice now, but I bought with expectation I would live in the home and possibly lose money. I remember struggling to secure a large down payment and loan in 2009. It was scary back then, but worked out. Having a good stable job helped ease the worry. Best of luck to those taking the plunge.
It’s going to take a big catalyst to make houses affordable.
That catalyst could be any number of things.
The only constant is change, so who knows that will be the change.
Things can change a lot in 5 years.
I think there’s a decent chance of large scale AI related layoffs late 2026 or early 2027. It won’t fully replace humans, but 1 person can now do the job of 3.
For awhile I’ve said the AI layoffs were just hype to cover for over hiring and off shoring. But now it’s developed enough to actually do some serious damage. And not just in tech, lots of non-tech companies adopting it. Likely Anthropic is trying to get user count up for their IPO so I’m sure they’re offering great deals to any CEO who will listen.
Like I said this isn’t just tech, it’s finance and accounting, it’s law, it real estate, its pretty much any office job.
And if that starts to happen, those people stop buying and it flows into blue collar jobs; services like hair stylists, cleaning people, landscaping, remodeling; retail spending; travel and entertainment
Hope I am wrong, but across industries (at large companies) a lot of people I’ve talked to have recently been given the mandate to have Claude do everything.
What will be interesting is in the k shaped economy as white collar employees lose their jobs, companies will become more profitable.
So I have to wonder if the stock market will crash on rising unemployment? Or with rising profits if the stock market will continue to rise just making the top % richer while the upper middle class and middle class burn through their savings?
MM1, the issue is that the big tech companies can lay tons off and increase profits in the short run, but they still need their customers to provide revenue.
The only way I see that working out it is if the government continues to borrow trillions and hand it out. Otherwise, I see even Mag7’s revenue drying up
@TSonder I think you’re likely right.
My thought was just in the past job cuts come to maintain profits in the face of falling revenue/demand. In this case they’ll be made to increase profits. As long as the stock market is going up, the upper class get wealthier and wealthier and then keeps spending. Basically the K shaped economy gets more extreme (until eventual collapse). The rich aren’t working and can’t be laid off so as long as asset prices are going up there is a consumer. So I think premium services and products do fine. I think the stat already is that the top 10% does 40% of the spending. I think we could see that rise to 50-60%, especially since most political policies and interest rate policy really seems aimed at supporting that top 10%.
Then there’s also what Altman says about UBI for the people being replaced. Which would be a terrible idea and would essentially remove upward economic mobility.
Anyways my thought is the K gets more extreme for the time being. Long term outlook could go a lot of different ways though.
Alan advocates for UBI because it a subsidy. It allow the government to essentially pay for his services that are now provided by non-humans, paid for by humans via the government.
It’s self serving and needed to be stopped.
Innovation always replaces jobs. At no time has employment faltered long term. The manhours freed are put to use doing other productive things. UBI will prevent that from happening.
And the human history of things like UBI (government driven income) is horrible that it should be laughed.
@Gaston I got off topic, but my main point is I think we could see some significant ai related layoffs in the next 6-12 months.
Ai wasn’t there before, but it’s gotten really good for most white collar jobs across industries and the last two months, I’ve heard lots of friends across industries be told you’re now a manager if ai – think of it like an employee you’re supervising along with this should be used for everything. It’s significantly faster than human employees and yes it makes mistakes but about as much as the average ‘meets expectations’ employee.
And yes the fed can lower interest rates. In the past that’s led to increased investment and hiring. The risk is this time, the investment might just be in even more ai.
Hope I’m wrong. And yes we’ve always adapted over time. I’m sure we will again. Just may be a bumpy road (and more dramatic K) ahead for a bit.
MM1. I’m not just saying this to protect my job as an Orlando personal injury & car accident lawyer. AI is no where near replacing us. I would highly, highly recommend not trusting AI regarding legal opinions. I get regular absurd AI written intake requests describing supposedly clear winning cases that are actually clear losing cases. I’ve also had a lot of experience trying AI for legal research and analysis. A large percentage of the cases and laws are often totally wrong. AI can give additional ideas or ways of expressing an argument more comprehensively, but that ALWAYS requires checking the cited cases, statutes, and actual case facts. That can help win cases but really doesn’t save any time at all. Possibly increases the time.
Actually I would strongly encourage anyone trying to hire a lawyer not to send an AI written inquiry. Just tell your story in your own words.
Don’t forget to say, Nicholas R, that it’s wise to buy one of the smallest houses in the expensive neighborhood.
a house is more than an investment. had the same train of thought, but in Jan/Feb 2023, there was fear in market and we lowballed, and we’re in a desirable place. If in 5-8 years my home hasn’t appreciated like an AI stonk … who cares, we could die tomorrow. the place is sick and all my family loves connecting at our hub for many reasons and we love it.
we also lived in a trailer for 7 years and saved like no other
I’ve prepared myself to rent until my kids are out of the house, then I’ll likely quit my job and live on a park bench. There is no way I’ll ever be able to afford to buy a home, so I’ve adjusted my expectations. The American dream is dead.
Hopefully your kids will help loo k after you like you have for them. I wish you the best.
If living in a nice house in a nice neighborhood is important to you, then the major metro areas in California are not for you unless you have a very high paying job or very generous parents. In California, income taxes play a larger role in discouraging home sales than they do in most (all?) other states because the state has no reduced long term capital gains rate.
Easy: Buy what you can afford, where you can afford it. Don’t want to live in the place where you can afford to buy? Then don’t live there, but then you can’t afford to buy a house where you want to live.
Do you think you’re the first couple to face this? No, this happens to most people. I bought my first home at 23 by myself. Was it in the best neighborhood? No. Did it need work? Yes. Did it check all my boxes? No. I traded a driveway for a finished basement. Garage? Not even an option since that would double my mortgage. I got my big boy house at 33 with a garage after 10 years of building equity in that first home. I replaced the roof, windows, floors, remodeled two bathrooms and two bedrooms.
Choices my friend. Compromises, trading horses.
Well Wolf said it, ” Now also filtering into these mid-tier home prices is the “mansion shortage” in San Francisco, the epicenter of the AI investment bubble.’
I suggest that as a society that we find a way to express our common values as a way to live a proud life with no regrets.
People need to remember why this bubble has happened so profoundly….Private Equity. They have for decades known how to manipulate markets with leverage to push prices up or down. Once they figured out the tricks to push up the housing markets, they bought held and sold to each other to drive the prices up uncontrollably. There is no reason we should have allowed investors into residential housing markets. No actual values changed, only perceived value by their manipulation. And it incentivises every who owns (or gets taxes) from higher values…so owners dont want the prices to go back down….no manipulation can short this market like they can with stocks. Government needs to shut it down 100% and no partial BS.
Looks like most markets have plataued. I feel it will take a corection of 20% with lower rates before buyers will jump back in the market. Unfortunately with the amount of debt piling up globally and inflation well above target, long term rates don’t appear to be dropping significantly any time soon.
I think sellers are slowly realizing that next year might be worse, not better. Once that mindset shift happens and becomes the public consensus I think we’ll start to see prices move more significantly.
Here in Denver I still hear FOMO, people thinking prices are going up because NARs proganda is so strong. Also focusing on median sales price doesn’t help public opinion either because in a K shaped economy where only the upper tier of the population is buying, that alters the sales mix and makes the median look high. So like duh if course the median sold price is up.
Indeed. I agree that the mystery is why haven’t the prices collapsed. In lite of the report that posited that last month the least number of existing homes were sold in the history of the index.
I also think Airbnb heavy areas may start to take a hit. Most people I’ve talked to publicly brag about owning airbnbs and what not, but privately when I’ve asked about numbers to see if it makes sense they’re losing money. If tourism gets worse, costs continue to rise, or there’s a need to raise case I could see these ending up on the market.
I live in East Tennessee near Knoxville. There was a recent Knoxville Sentinel newspaper article about people who bought expensive homes in Gatlinburg (tourist town – Dollywood, Smoky Mountains, etc) to rent out as airbnb’s. The rental market is crashing and the owner’s are now losing money hand over fist.
I think that the good times last as long as the stock market remains delusional, as the landlords/hosts can subsidize their operations.
The market is now higher than before the Iran War started, but of course the economy is not better. It’s a “vibes” market.
Then maybe these houses can be sold to retirees. They will need 4wd for the occasional snow. Takes some pressure off nearby markets.
The mega houses built for family reunions is another story. Maybe they can be repurposed as a hostel for service workers.
BruceP
Good
Wolf, what do you think about showing these graphs in log-scale (or zero-based) to give a more accurate picture of the relative price changes?
Only card-carrying liars and manipulators put asset prices on a log-scale chart because a log-scale chart is designed to manipulate the brain into thinking that the cumulative price increases were only a small fraction of what they actually were.
There is a special place for log-scale charts in engineering, and they need to stay there.
And there is a special place in hell for people who use log-scale charts for asset prices.
why would anyone want to use log scale for home prices ?
Using log scale would show these price growth as very small.
The purpose of log charts is to show functions/signals different orders of magnitude side by side so you don’t have to squint so much or zoom way out, or where you’re trying to show how behavior changes or that there’s some important relationship between the different regimes you’re trying to exploit for some application.
Example: frequency/spectral analysis, looking at a very weak signal right next to a really strong signal simultaneously, where the two signals have some important relationship. For an experimental scientist or engineer, this is really valuable, so that way you can optimize those signals at the same time. You can also find this in theoretical considerations where a scientist or engineer is trying to demonstrate in their calculations how a particular system should behave at different scales. The scientist or engineer accepts that the shape of the functions involved will be distorted, but with the understanding that the meaning of the signals being pointed outwill be made much more clear.
For finance though, many repeating patterns in those time trends have no well-defined mathematical or engineered hard relationship to each other, only an implication that various market forces may have regenerated a similar event. Even if that hard relationship does exist, it’s one that you have no control over. And without that, there’s no utility in this case except to stretch one’s brain comparing signals that have no correlation except that they may or may not have a similar shape. In layman’s speak, this is comparing apples and oranges, and so it’s not a good use of your time.
Well of course there is always Newton’s calculus that defined and proved the legitimate instances in which the log scale was applicable.
If I understood correctly what some really smart people were attempting to educate me.
The fundamental quantity, e, the natural log is required to solve a number of statistical probabilities like the Black-Scholes model that is used to price options.
Wow, still looking very bubblicious.
The Orlando market graph appears to be at an all time high although text says 5% below peak. Which is correct?
Only 7 out of 33 markets have double digit declines from peak. In many markets that peak, a short lived spike, although accurate, would be reduced by even short term moving average.
The data has yet to reflect the crash or pending crash so many outlets profess. Of course, it could be all come to fruition in the next quarter, along with the tariff induced recession and the end of transitionary inflation. Or not!
In the overwhleming majority of markets price stability seems to be the order of the day. Selective buyers meeting with patient sellers and market driven mortgage/bond rates creating an equilibrium with minor fluctuations in values over the past 4 years. Perhaps 3-5 more years of abyssmal activity levels and flat prices along with rising wages result in a new permanent floor for housing values. Wouldnt be the first time.
That’s the “Omaha” chart that sneaked into the Orlando slot. Thanks for pointing it out. Fixing it right now.
I live in San Diego and this doesn’t tell the whole story.
In 2022 there were total tear downs going for $1.6M. Now you can buy a fully remodeled home in the same neighborhood for $1.5M.
These graphs don’t really capture what is happening at the neighborhood level. The drop in prices doesn’t capture the much large decrease happening right now. Homes are still expensive but you get much more for your money.
@SD Padres Great post, it is always important to dig down and understand the “mix” of the market (anyone that says the market is up from 2022 is either lying or does not know that actual condition of the homes selling).
@Mark I don’t know where you are, but here on the SF Peninsula (where decent homes cost over $2mm) I’m seeing an increasing number of 30 something young professionals get money from parents as the Boomer “grand” parents die and leave them a home and cash to the kids. I’m in my 60’s with kids in their 20’s since I got married late, but most of my peers have kids in their 30’s and every single one that owns a home in the Bay Area got “help” (aka $500K- $1mm cash) from the parents. P.S.
I still don’t have a single friend with a grandkid yet…
Here’s an example.
Home 1 sold for $1.475 at the peak of the market. Never updated kitchen or bathrooms. Right off a main road with lots of road noise.
https://www.zillow.com/homedetails/12488-Pomerado-Pl-San-Diego-CA-92128/16739338_zpid/?msockid=097e6735846669d63afd713885b4682f
Home 2 sold for $1.45 ($25K less than house 1) three years later in 2025. This house is fully remodeled and in a much nicer area of the neighborhood and isn’t right next to a main road.
https://www.zillow.com/homedetails/12645-Pacato-Cir-S-San-Diego-CA-92128/16744472_zpid/
If you bought home 1 and needed to sell than you’d be way underwater
I am reading the links correctly it appears the first house is on an 11600sf lot on a cul de sac and backs up to the golf course. The second house is on a much smaller 8300sf lot which overlooks a rock yard and other house’s roofs.
I suppose some would consider the first one to be in a “less desirable location” but Ill take almost 40% more land and looking at a golf course over an upgraded kitchen and bath if the price is the same any day of the week.
I check your claim. The first house has a lot that is 50% larger with golf course views. The second home does not have that. They are not comparable.
@AndresFrank and @Socaljim
The first house is one house in from a 4 lane wide main road with a 50 MPH speed limit. I checked it out when it was for sale and the backyard/living room has a lot of road noise.
It looks great in pictures, but you wouldn’t willingly choose that house if you saw it in person. But I suppose there will always be RE cheerleaders like you guys that find any excuse to make sure people think the RE party is still going.
Right so just sucks for Gen Zers without rich family. Now you know why so many people hate this economy.
My friend in SD sold his home for 1.8 mill at its peak and now thinking about buying the similar but more updated home for 1.4mill but he is renting similar home for $5.5K/month.
SD is definitely much lower than the peak. And homes are taking a long time to sell. It is nice for some sanity to return to this area.
I know lots of people who are renting by choice because it is so much cheaper than buying.
His rent is the equivalent of his future property taxes- so hard no.
Math folks, mathz is hard.
San Diego seams to be overpriced simply from the obvious discrepancy between the wage rate and the monthly mortgage
Affordability
MMi you are right: if workers are let go and replaced by AI, who is going to buy company products. If the government prints money and hands it out free to displaced workers, inflation and government debt will bankrupt the government.
I challenge the framing that a brutal AI regime is the most likely dystopian future where machines will send chits to the heartless mogols
What they call AI is a programmed model, trained to accomplish a target objective without the exquisite American diplomacy that spawned world wide productivity
Nothing in San Jose SFO is hit by bubble or coming down.
If I could afford it I would move to San Jose
Hey Wolf,
Happy to see regular updates on the housing market insanity being resumed! Any chance you’ll be bringing back the metropolitan area level analysis? I miss the continuity in that dataset and its better representation of housing prices in these areas.
“Any chance you’ll be bringing back the metropolitan area level analysis?”
Close to zero. Because it puts Oakland and San Francisco in the same metro. And that happens in other metros too, such as in the DC metro. Metropolitan areas are just too big and diverse to give a granular picture. The New York City metro is over 20 million people, and some of its different markets have moved in opposite directions. Even New York City is too big. With my articles focused on single-family only or condos only, I show boroughs of New York City, such as the Manhattan condo market.
Semi-related: Charlotte and Raleigh can pretty much grab up “profitable” (from a municipal funding point of view) surrounding non-incorporated areas through forced incorporation. So they have a tendency to be somewhat close to their metro size, without the data muddiness of including multiple municipalities.
But I also wonder if that tends to plateau their prices as they are never run out of land?
So happy we sold in SF right at the tippy top pure luck.
So it looks like in most cities the price declines have stopped. I live in NW ATL / Woodstock, and I’d say the 8% decline is a little much. It’s probably closer to 5%, but we’re a fairly high-income area. I’m hoping my property taxes go down a little this year. A house in my neighborhood went on the market 3 months ago @ $342K, and they just lowered the price by $2K. from what I can tell houses last year were selling in the mid to low $320Ks. It’s amazing how intrigant sellers remain nowadays.
Just to carp a little more, my car insurance with Progressive went up 14%. Apparently, you get a discount for your first six months having signed up online, then poof it goes away.
And I just love how insurance companies won’t tell you what their annual % increase each year. Just more obfuscation. I hate to say it, but I wouldn’t ming a moderate recession just to slow down insurance increases.
It’s downright ridiculous.
“So it looks like in most cities the price declines have stopped.”
I gave you all the data and the charts, and you still manage to misrepresent them in your comment.
19 out of 33 cities had month-to-month declines in March, seasonally adjusted. So A MAJORITY OF CITIES CONTINUED TO DECLINE would be correct.
in only 13 cities, there were no price declines (5 no change, 8 increases).
And several of those cities that are still declining slightly appear to be headed into the bottom of a trough. According to your charts, Austin & Nashville are the only cities that appear to be on a continued steady decline.
I don’t think I’m exaggerating anything. At most, I missed a small additional qualifier. For now, a significant portion of the country doesn’t appear to be looking further big price declines. That’s a little better qualified.
Are you a realtor?
Starting from 2012, most cities look very correlated to the chart of MBS held outright by the Fed.
https://fred.stlouisfed.org/series/WSHOMCB