Their balances ballooned even as prices of stocks, gold, silver, et al. surged to records. Everything surged. Almost.
By Wolf Richter for WOLF STREET.
Households and even institutional investors continued piling into money market funds (MMFs), and their balances ballooned to new records, despite the Fed’s rate cuts since September 2024, and therefore lower yields on MMFs.
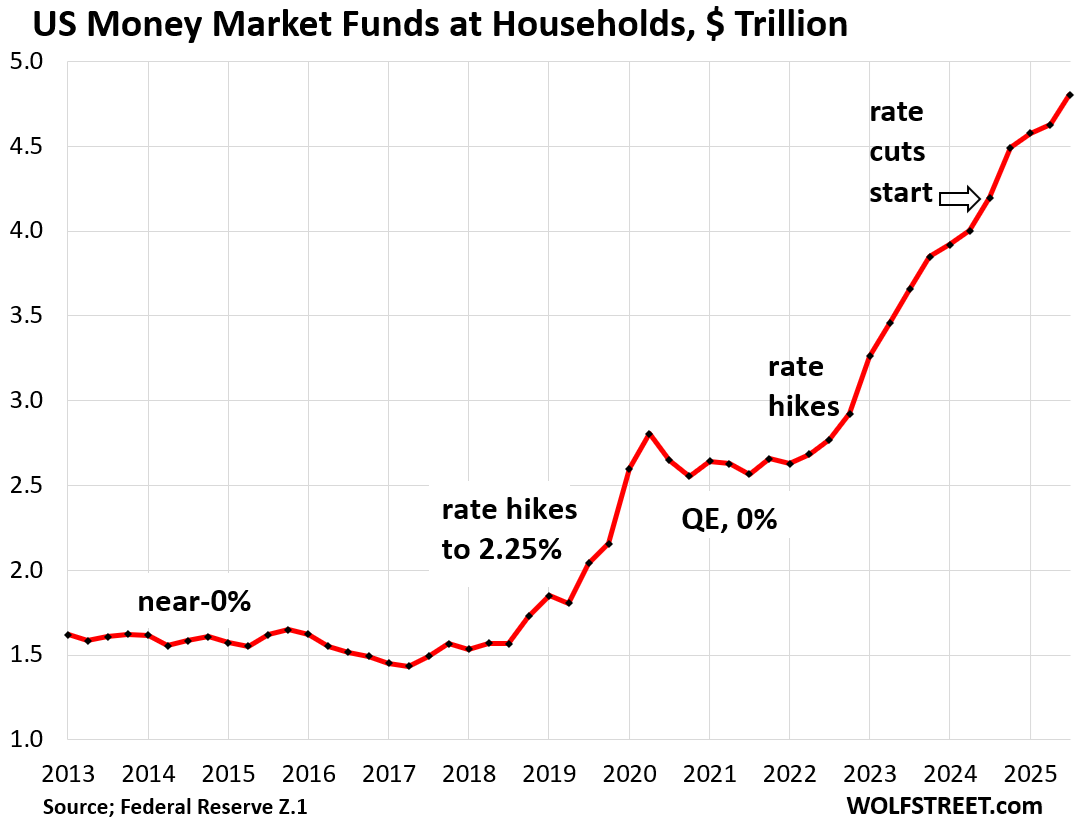
Balances in MMFs held by households jumped by $176 billion in Q3 from Q2, and by $605 billion year-over-year to a record $4.80 trillion, according to the Fed’s quarterly Z1 Financial Accounts on Friday. Since Q1 2022, when the Fed started hiking its policy rates, balances have surged by $2.17 trillion.
These MMF balances include retail MMFs that households have bought directly from their broker or bank, and institutional MMFs that households have bought indirectly through their employers, trustees, and fiduciaries – such as in their 401(k) plans.
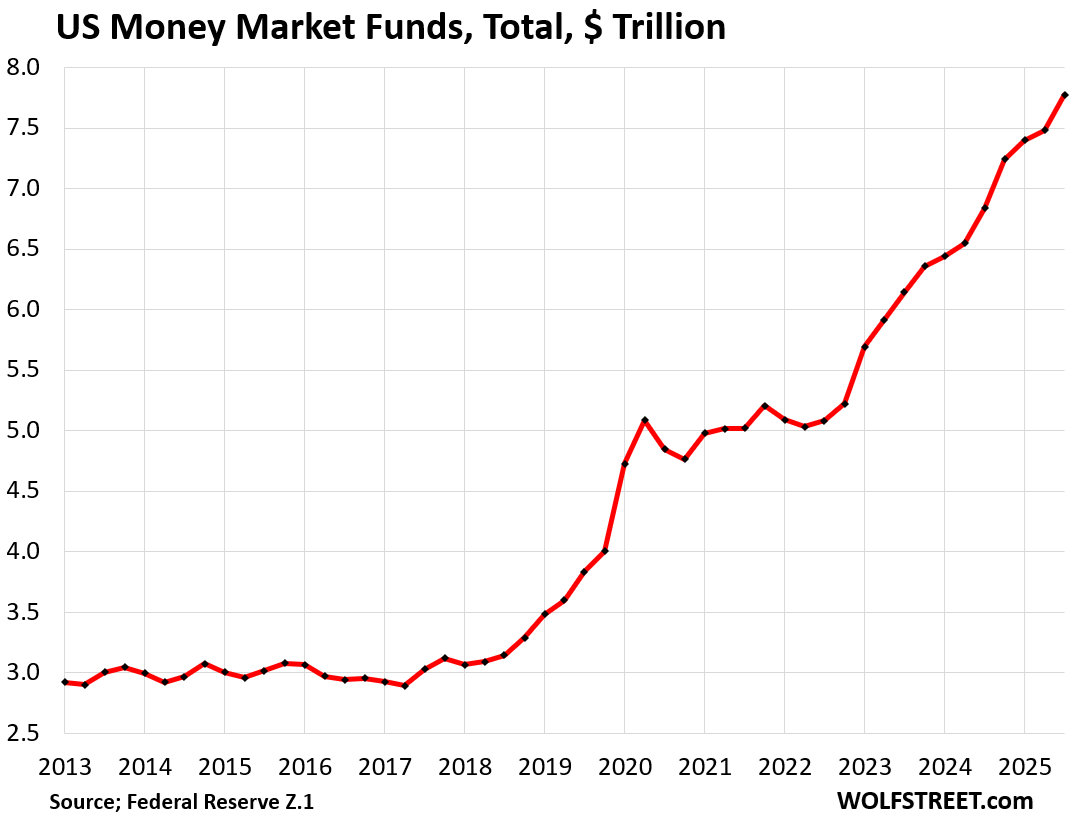
Total MMFs held by households and institutions jumped by $293 billion in Q3 from Q2, and by $935 billion year-over-year, to a record $7.77 trillion. Since Q1 2022, balances have ballooned by $2.68 trillion.
MMF yields roughly track the Fed’s five policy rates which are designed to form a floor and ceiling for short-term market yields, such as the gigantic repo market, to which MMFs are big lenders.
Prime MMF yields, at around 3.5% to 3.7%, are still above the rate of CPI inflation, around 3.0%, so they still have positive “real” yields. Municipal MMFs, though they offer major tax advantages, yield in the range of 1% to 2%.
But it’s not “cash on the sidelines” of the stock market. Buying money market mutual funds is an investment choice. It’s an alternative to buying stock mutual funds, ETFs, stocks themselves, or gold or silver or long-term bonds or real estate or cryptos. Crypto is not “cash on the sidelines” either. They’re all investment choices.
Buying MMFs is an investment in a mix of short-term low-risk securities, such as Treasuries with less than one year to maturity, high-grade corporate short-term commercial paper, and high-grade asset-backed commercial paper, and in repurchase agreements (lending to the repo market against collateral), and overnight reverse repos (ON RRPs) at the Fed – though ON RRP balances are now down to near-zero, as yields are higher elsewhere.
Any investor can sell one category of investments and buy another category of investments, and they do it all the time, and thereby that one investor can take money out of the stock market or put money into the stock market.
But other investors have to be on the other side of the trade with the exact same amounts. If one investor buys stocks, other investors have to sell those stocks dollar for dollar. So one investor can take money out of the stock market, but other investors must by definition put the exact same amount into the stock market.
When investors in MMFs sell their shares back to the fund, the fund will eventually have to unwind that amount in Treasuries, commercial paper, repos, etc., and other investors have to step into the place of the MMFs with the exact same amounts. That cash is not on the sidelines. It just flows from one investor to another as assets change hands.
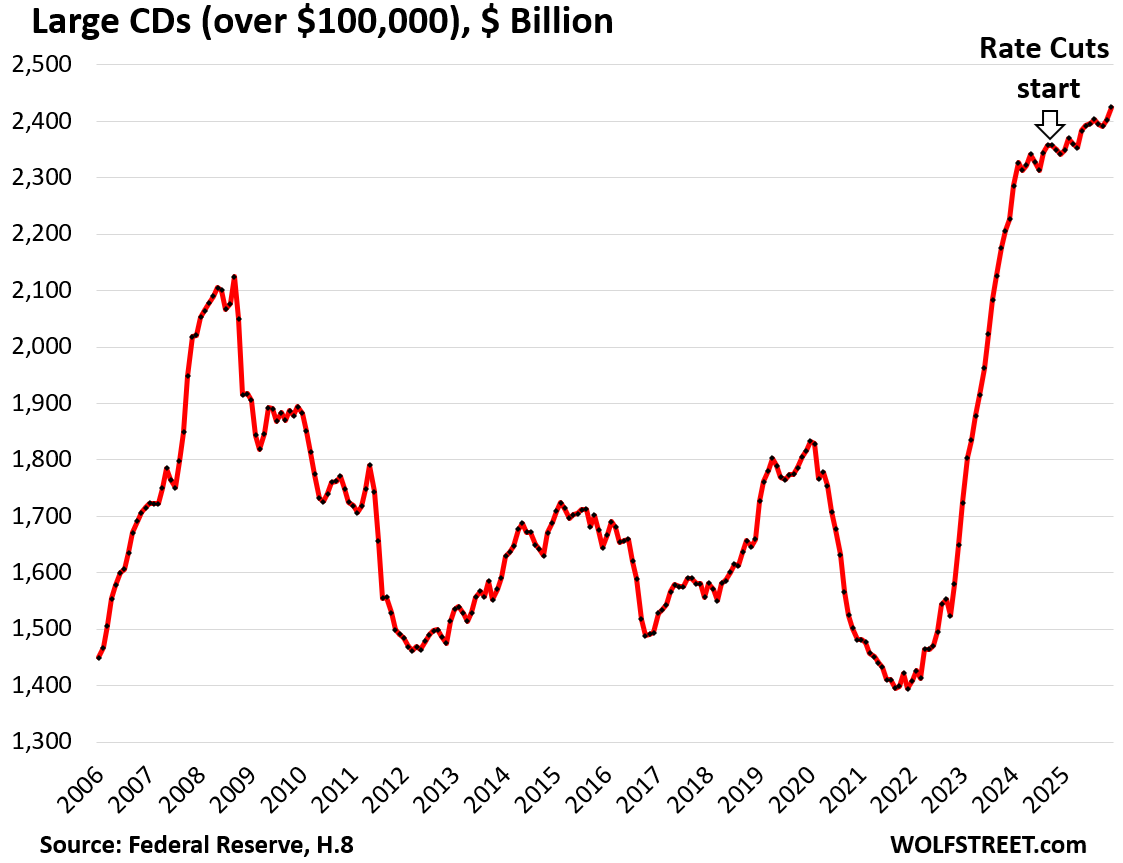
Large Time-Deposits (CDs of $100,000 or more) rose to a record $2.42 trillion in December, up by $83 billion year-over-year, as per the Federal Reserve’s monthly report on bank balance sheets (H.8), also released on Friday.
Since March 2022, when the rate hikes began and then even as the rate cuts began, large time-deposits have surged by $1.01 trillion.
The FDIC insures CDs up to $250,000. And it seems those CDs are still popular, despite their yields having come down.
Not cash on the sidelines either but an investment choice with a maturity date, like bonds, but they’re investments whose principal is guaranteed by the FDIC if within the FDIC limits.
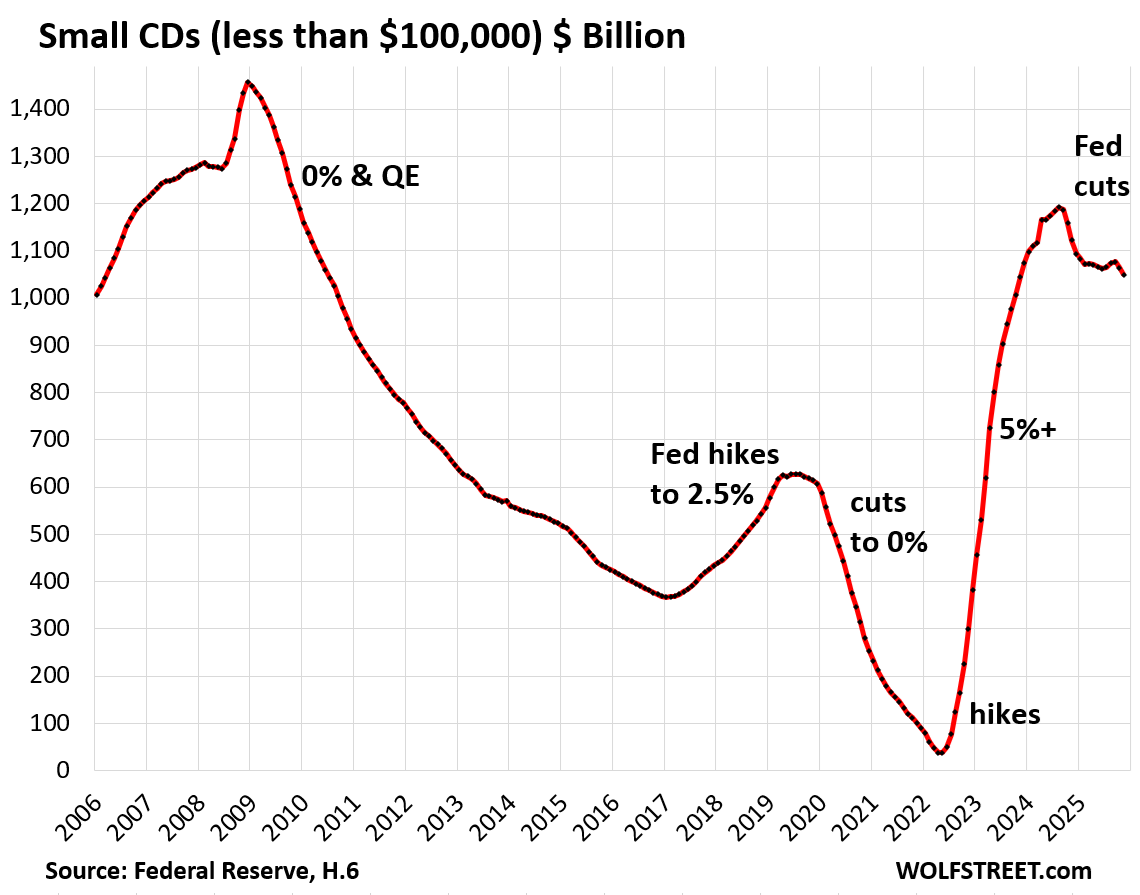
But small Time-Deposits (CDs of less than $100,000) fell to $1.05 trillion in November, down by $73 billion from a year earlier, per the Federal Reserve’s data on money stock (H.6), released in December.
Smalls CDs react fairly quickly and strongly to interest rates offered by banks. They’re not “sticky” at all. Investors shift into them and out of them depending on yields that banks offer.
All asset classes ballooned during the everything bubble. Money market funds are not the only ones that reached all-time highs. Stock market indices, gold, and silver rose to new all-time highs today. Bitcoin and other cryptos had risen to all-time highs in October 2025 and have sagged since then. Home prices had soared to all-time highs across the US until mid-2022, when the market began to split, with prices falling in many markets, but still rising in others. None of these movements had anything to do with “cash on the sidelines,” but with the general mania of the Everything Bubble.
Enjoy reading WOLF STREET and want to support it? You can donate. I appreciate it immensely. Click on the mug to find out how:

![]()
Thanx for the update Wolf.
Yes, thanks.
I think these sort of charts (MM and CD accounts) are pretty useful because,
1) They tend to provide some insight into the risk mindset (risk on/off) of the mass of investors – since MM/CD accounts tend to be the places where money goes when it is more worried (although only gvt-backed MM/CD accts are truly “risk-free).
2) They also reflect the real-world implications of the Fed’s money-printing operations – if the Fed has created trillions out of thin air, some of those trillions are going to end up in things like MM/CDs. Since valuation complexities tend to be somewhat less fraught with MM/CDs, the linkage is more straightforward.
CDs: Lending/investing by the Reserve and commercial banks is inflationary (increases the volume and turnover of new money). MMs: Whereas lending/investing by the nonbanks is noninflationary (results in the turnover of existing money).
Good additional point.
re MM/CD role in asset valuation process…
1) These charts show what happened to MM/CD balances due to a) pandemic panic and b) the Fed allowing rates to go from 0-1% to 4-6% after 10-12 years of ZIRP.
2) It would be *very interesting* to see the other end of the process (MM/CD balances) from say 1998 to 2012 (the CD charts do go back to 2006 already). Basically, those charts would show just how much money got herded *out of* MM/CD accounts due to various epochs of ZIRP.
3) The complicating factor is of course all the Fed money printing (used to *create* ZIRP) from 2000-2022. As said in my earlier post, as the Fed creates trillions out of thin air, *some* of those trillions are just naturally going to end up in MM/CD balances…beyond even the incentive effects of interest rate changes.
The way the banking system works is that it only creates new money when it makes loans to or buys securities from the nonbank public. People ignore the corollary. This can be demonstrated by conducting double-entry bookkeeping on a national scale. I.e., the inputs and outputs of the system zero out.
Today that exercise is more difficult because some of the definitions are wrong. Like Dr. William Barnett said: “the Fed should establish a “Bureau of Financial Statistics”.
“The way the banking system works is that it only creates new money when it makes loans to or buys securities from the nonbank public.”
Sure – this is basically a restatement of the point you made above.
I’m unclear on the broader point you are trying to make re “some of the definitions are wrong” and Dr. William Barnett quote.
Ok, makes sense NOT to view MMF amounts as “cash on the sidelines”, but why should we care at all what MMF trends are doing? Is it as a measure of liquidity for the economy?
Also, when looking at the trends over anything more than a few months, is it useful to look at them adjusted for inflation?
Thanks
1. Do you only care about stocks and gold and zero-nada-else matters to you? This site is full of mostly other stuff.
2. The S&P 500, gold, silver, etc., reported every minute of every day, are not adjusted for inflation either because NO ONE pays inflation adjusted prices. They’re figment of your imagination. Thanks.
And there was me thinking that it was the nominal price that was other-worldly and the inflation-adjusted price that was real.
Everything is nominal. Silver would have to be $300 to be “adjusted for inflation. ” So is BRK and any other equity
Some, much smarter than I, are saying $300 an ounce is in the cards by 2027
MMMFs are important financial intermediaries serving to join savers and borrowers. To the extent that they can outbid the banks, the better were off.
Well written and thought through.
E.g. My youngest chose to put $40K in a Credit Union GIC at something like 3%.
He knows I invest but wants the security of the basically sure bet (certainly an asteroid could take out Canada or some unforeseen event which bankrupt all of our insurances and the Central Bank but…..).
The Credit Union will not be putting that money in the equities markets (they lend it out at a higher rate for mortgages or small business loans).
For some of your readers for whom 3% is just a good day trading this might seem crazy but for many people – especially those without large amounts of capital – they prefer it.
Obviously the risk differences between a bank owned CD and equities are so far flung on the poles of risk that why are you even talking about them in the same sentence?
Why is anyone talking about them in the same sentence?
Because people are dumb and dumb people don’t know the risk profiles. That’s why people group all investments together.
Stop that.
I think the point Wolf was making was that the “everything bubble” has inflated everything, even MM funds / CDs.
I do wish he’d connected it to the massive increase in the monetary base over the last several years, and continuing today. That’s where the money is ultimately coming from that is pouring into every asset class.
MMFs are part of measures such as M-2 money supply. Small CDs are also part of it. Large CDs (over $100K) are not though.
Because we understand risk tolerance and you don’t. How stupid do you have to be to not understand they are both investment strategies appropriate for different risk profiles? Very very stupid. So of course they’d be mentioned in the context of the spectrum of investment choices across risk profiles.
He was making a comparison of how different investments are appropriate for different people with different risk profiles. Sorry you have zero reading comprehension.
Make sure in your reply you double down on how stupid your are by failing to admit your mistake.
As someone who keeps a decent chunk in savings myself, CDs are mostly a non-starter for me. The advantage of savings is as an emergency fund, and short term CD rates are abysmal with the change in savings account rate competition over the past 20 years.
You used to be lucky to get anything rate wise from a free savings account, now most savings accounts are like a quarter percent from a 6 month of 1 year CD. The value just isn’t there.
If one opened $30K+ savings account with Citibank in the last 3 weeks you would get $750 bonus (for keeping money in savings for 90 days) + 3.5% interest. Using OP’s $40K example that is “11% 3-months CD”. That promo ended on the 12th. I did just that after entire 2 minutes of internet searching.
Mr. Wolf writes: “But other investors have to be on the other side of the trade with the exact same amounts. If one investor buys stocks, other investors have to sell those stocks dollar for dollar.”
“Market Makers” do this. Interestingly their trade is always against the investor by definition.
No, market makers are only a transit point. They have to buy and sell, and make a spread.
This is very noteworthy: The options of the Silver ETF (SLV) are skewed exactly opposite those of the major stocks index ETFs (SPY and QQQ.)
It is strong evidence that it is being driven by very strong speculative activity and nothing more. I think the sh*t could hit the fan at any time and it could easily fall 40-50%.
Options of silver huh?
Whoa Nelly. That’s suicide.
You could um just burn your money? Maybe?
The very fact that paper/digital commodities are “traded”, is stupid. Betting on those “trades” is insane. This is NOT investing, it’s gambling.
Burn your money ???
That is what crypto is for.
I can’t believe anyone (much less Wolfie) would see crypto as an “investment”. To me it is just like taking your money to the roulette table and betting on red or black.
Crypto is a ticket into a room everyone is in. The ticket is 90k atm, when someone is willing to pay 91k , then that ticket is 91k to get into the room.
Yeah crypto is crap. Just like ALL the “reworks” going on right now.
Beef Tallow? Like WTH. More like make america have more heart attacks.
Anyway.
The cryptos KAU AND KAG are physically backed by gold and silver. The vaults are independently audited by reputable firms. I made a small investment two years ago. That investment is about to triple and I earn 3% which come from a fee pool. Like a credit card, there is a small fee when people us the crypto to purchase things. I hate to say it, but we have had digital currencies for a very long time. What is changing is a push to return to a monetary system that is backed by physical assets.
Ace,
Agree it will hit the fan, and a 50% drop is not out of the question. The problem is that it could double first, wiping out any short position.
Been there, done that, with the scars to show for it.
Ace, do you mean to say puts for SLV are more expensive than calls an equal distance away from the current price, and that calls for SPY/QQQ are more expensive than puts an equal distance away from the current price?
Does that relationship change depending on the timeframe?
What about MMF breaking the buck
It happened in the last downturn and this time the concept of high quality short term assets is as speculative as crypto. I moved out of several MM when i was finally able to uncover where my ‘safe’ money was invested
Yes, that MMF lost something like 1%, went to 99 cents a share from $1.00? That’s what breaking the buck means. It’s only a problem because it caused lots of people to get out of the MMF at the same time by selling their shares back to the MMF (run on the fund), and the MMF had to sell all those assets in a very short time, sucking up lots of liquidity in the repo market and the Treasury market and sent them into turmoil. Forced selling of a major fund will do that. It wasn’t much a problem for investors in the MMF but for the rest of the markets.
How does the surges in MMF balances during these rate-decline periods compare to MMF flows in other such periods?
See charts?
Yeah I hate the “cash on the sidelines” meme.
I consider my MMF to be “how I am going to pay my bills for next 12 to 24 months with a little extra for unexpected expenses “. It might be “sitting on the sidelines “ to finance bros who want me to hand to them to “invest “, but even though it’s a small fraction of my portfolio, it is probably the most important.
Off topic question — how did the Mortgage News Daily 30yr fixed interest rate fall a quarter point overnight, with no actual plans in place for lower rates? Doesn’t the money have to actually become available before, specifically, mortgage rates can fall? Are the lenders just going to lend at this new, lower rate, based on a wing and a prayer that the money will come through? I just don’t get how the cart can be placed before the horse here.
Because mortgages are commercial products. Mortgage lenders have wiggle room (margins & cash) to cut with small amounts, trying to get you in on a ‘sweet deal’ that the competitor doesn’t offer (yet).
Where is the securitization money coming from? “Dumb money” pension funds? Because, as I understand it, it certainly isn’t coming from the GSEs, yet.
New stock issues take cash from the sidelines into the stock market
Stock repurchases add cash to the sidelines.
Since the year 2000, repurchases have slightly exceeded new issues.
No, that’s incorrect.
New stock issues take “cash from the sidelines” and put it into the bank accounts of the issuing company. But those are ALSO “cash on the sidelines”.
Stock repurchases take “cash from the sidelines” (the company’s accounts) and put it into the accounts of shareholders, which are ALSO “cash on the sidelines”.
No cash is created or destroyed in either transaction. All cash ends up on the sidelines, no matter what.
In these transactions, shares are being created or destroyed, but not cash. The same would be true of bond purchases.
To convince yourself of this, just ask what would happen if the buyers brought a suitcase of $100 bills to the transaction. The $100 bills would NOT be destroyed in either case, they would just go to the sellers … and they would remain “cash on the sidelines”, just in different hands.
If you receive cash from a stock buyback and don’t reinvest it, that specific cash effectively leaves the stock market (or at least that particular company’s stock) and becomes available for other uses. Whether that money stays “in the market” depends entirely on the investor’s decision to reinvest it elsewhere or exit.
If you decide to invest next week’s paycheck in a new issue of stock, that is adding cash to the stock market. Of course, the company receiving the cash will use it for other things.
The difference between new stock offerings and buybacks tells you the amount of cash that has entered or left stock market investments. In the past 20 years, cash leaving from buybacks has slightly exceeded cash entering from public offerings.
I’m sorry you objected to my phrase “on the sidelines”, meaning not invested in the stock market, but my concepts are correct. In the past 20 years, the total amount of money invested in the stock market has declined slightly from buybacks. That means the total amount of money invested in everything else but the stock market has increased slightly.
New deposits into MMFs from 401k contributions and other saving of income does qualify as “dry powder”, and is a major factor driving up stock prices. Distributions to retirees needing cash to live, and other withdrawals for cash, have the opposite effect, and if and when they exceed deposits the stock market will begin an inexorable decline, because the more share prices decline, the more shares must be sold to get the same amount of cash. Especially because dividend yields are pathetic.
I have several retired friends who need >$30k/year just to pay their RE taxes.
Not a discretionary expense they can cut back on if the market declines.
It would be interesting to see a chart of new 401k deposits vs withdrawals over time.
All money managers must balance the chase for yield with protection of a large portfolio. That last chart shows just how hungry for a “safe” return these folks were/are.
Regardless, savings are key to real growth and production.
” so they still have positive “real” yields.”
But not so much after tax “real” yields.
Is this the rise in MMs the result of cash still sloshing around from QE? Finding its way into individual accounts as a result of stock and real estate sales?
More pertinent question: trying to evaluate MM vs CD in the event of a meltdown? Are both insured through FDIC equally? Of course no one wants to be stuck in line due to a bank failure. Is a complete FDIC failure a possibility?
Comment about yields. In comparison to stocks one can consider CDs won’t go down in value. Possibly with inflation but that’s slower than a stock crash. It’s a way to diversify.
Howdy JJ. Learn ” A Squirrels Life ” for a new/old perspective…
For me, MMF IS cash on the sidelines. I realize it is an investment in and of itself, but I use it as a slush fund in my investment account. When I have money sitting around between other investments, that’s where it’s held.
Interesting. Why not use T-bills?
You can’t buy or sell T-Bills as quickly and easily as a T-Bill ETF. Plus, when you directly buy/sell T-Bills you can get shafted on the bid-ask spread if you aren’t careful.
Maybe, but I don’t consider a month much of a wait. The interest rate is better as well.
Somebody has to hold every dollar, every equity, every treasury at all times and someone is on the other side of every transaction. Individually you might change your investment balance, but on a systemic level someone always has to take the other side of the trade and move the other way including from equities to cash or cash to equities. The value of an asset is always and everywhere an opinion or there wouldn’t be a market in the first place.
Where is cash that is off the sidelines held?
This is indicative of plenty of cash in the economy, as liquidity has been growing in accelerating fashion in the last few quarters (and last few years). That liquidity is spilling into the price of assets and driving them to record levels as noted in the post.
See https://centerforfinancialstability.org/amfm/Divisia_Nov25.pdf
I wonder how many households have a share of that $605 billion yoy.
Howdy Folks. YEP, everyone at our Squirrels Anonymous Meetings are very very happy. Saving and spending more than before.
Life is good
We need a complete and total meltdown in the stock and crypto markets. A 90% wipeout.
All the FED needs to do is to continue to follow a tight money policy. RMPs are forecasted to increase by 220b in 2026. That’s way in excess of currency withdrawals.
Ultimately, the problem with a wipeout is the inevitable bailouts which follow and the taxpayers who weren’t investing and reaping the benefits pay for it all. Watch what happens when the AI bubble bursts and who is “too big to fail”.
Sandy,
I think AI is too big to bail out. Just a handful of only semiconductors stocks are $12 Trillion. They will need Hank Paulsons “shock and awe” times 100 to bail out AI. Gonna need Korean style currency with many zeros. Could happen.
Just stick with gold, land, home, garden and venison, beef cattle. The rest is sooner or later bogus.
Wolf,
1) I broadly understand your “investment choice-not on sidelines” point but (at the risk of getting yelled at to RTFA) wouldn’t a drawdown of MMA/CDs have to go *somewhere* and potentially drive up that asset sectors pricing/valuation?
If 1 trillion were shifted from MMAs/CDs to say housing, absent a huge equivalent increase in the supply of housing, wouldn’t housing prices be pushed upward?
Doesn’t the shift in asset allocation imply a high probability of relative asset valuation changes?
2) And (worse yet), while a decline in MMA/CD balances are dollar-for-dollar (given their profoundly liquid nature) wouldn’t an “asset shift” into housing maybe make housing *even more* overvalued (due to “wealth effect” baloney of having 4 million sales transactions “imply” the value of the other 76 million SFH).
#1 is the question I really am curious about the most – please address that if nothing else.
“wouldn’t a drawdown of MMA/CDs have to go *somewhere* and potentially drive up that asset sectors pricing/valuation?”
No. I explained this in the article:
“Any investor can sell one category of investments and buy another category of investments, and they do it all the time, and thereby that one investor can take money out of the stock market or put money into the stock market.
“But other investors have to be on the other side of the trade with the exact same amounts. If one investor buys stocks, other investors have to sell those stocks dollar for dollar. So one investor can take money out of the stock market, but other investors must by definition put the exact same amount into the stock market.
“When investors in MMFs sell their shares back to the fund, the fund will eventually have to unwind that amount in Treasuries, commercial paper, repos, etc., and other investors have to step into the place of the MMFs with the exact same amounts. That cash is not on the sidelines. It just flows from one investor to another as assets change hands.“
Wolf, Your site is awesome. Thanks for teaching. I’m struggling with this one.
I get that individual trades are a zero sum game. You sell me stock at agreed price. You get my cash, I get your shares. No change in value of stock between us. No change in cash between us…
But…
What if a lot of people imitate our move at the same time. Say shareholders of the tech giants all sell 5% of holdings in one day instead of typical less than 1%. All those individual stock transactions zero out. Ie. No change in total cash or number of shares held by those buyers and sellers….
But what about the rest of the market? Surely the paper value of the untraded 95% of shares will decline. Maybe a lot. Meanwhile the rest of the “cash” in money markets etc will not change. At the macro level, it’s not always a zero sum game. Is it? In this scenario, seems like the cash is “on the sidelines”.
What am I missing?
Re: price of silver hitting all time high. I sold my only silver, a 50 oz bar about 3 (?) months ago. Sold it to ‘The Gold Silver Guy’, same place I bought it year and half ago for 2200 Canadian. When I asked how much they’d offer, the young employee took about 7 seconds to reply. He punched in the Chicago price of silver, 57 US $ oz, a record. Times 50 divided by .72 (to get C$) and replied 3600 C$. I said sure and walked out with a check, feeling pretty smart. (These numbers are not exact but close)
Today I’d about $C 6000.
I only bought it to say to folks ‘look at my cool silver bar’. But it was males who were far more impressed. so…??
One advantage of the 50 oz silver bar over the equal value gold wafer…if a guy is trying to rob you, the bar is quite a weapon.