Standing Repo Facility (SRF) at zero, after doing its job calming the repo market at month-end.
By Wolf Richter for WOLF STREET.
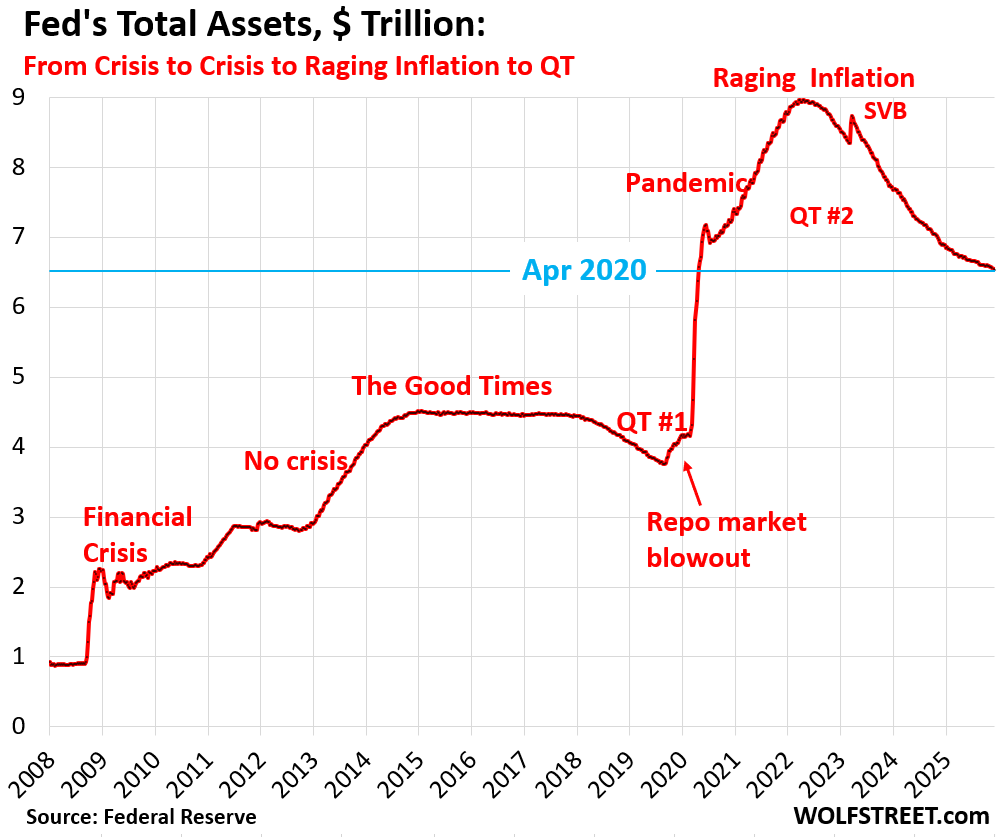
QT ended on December 1, as per the Fed’s announcement at its FOMC meeting. But in November, QT continued, and the Fed’s total balance sheet declined by $37 billion in November, to $6.53 trillion, according to the Fed’s weekly balance sheet today.
Over the three years and five months of QT, the Fed shed $2.43 trillion in assets, or 27% of its total assets, and over 50% of the $4.81 trillion it had piled on during mega-QE from March 2020 through April 2022.
QT assets.
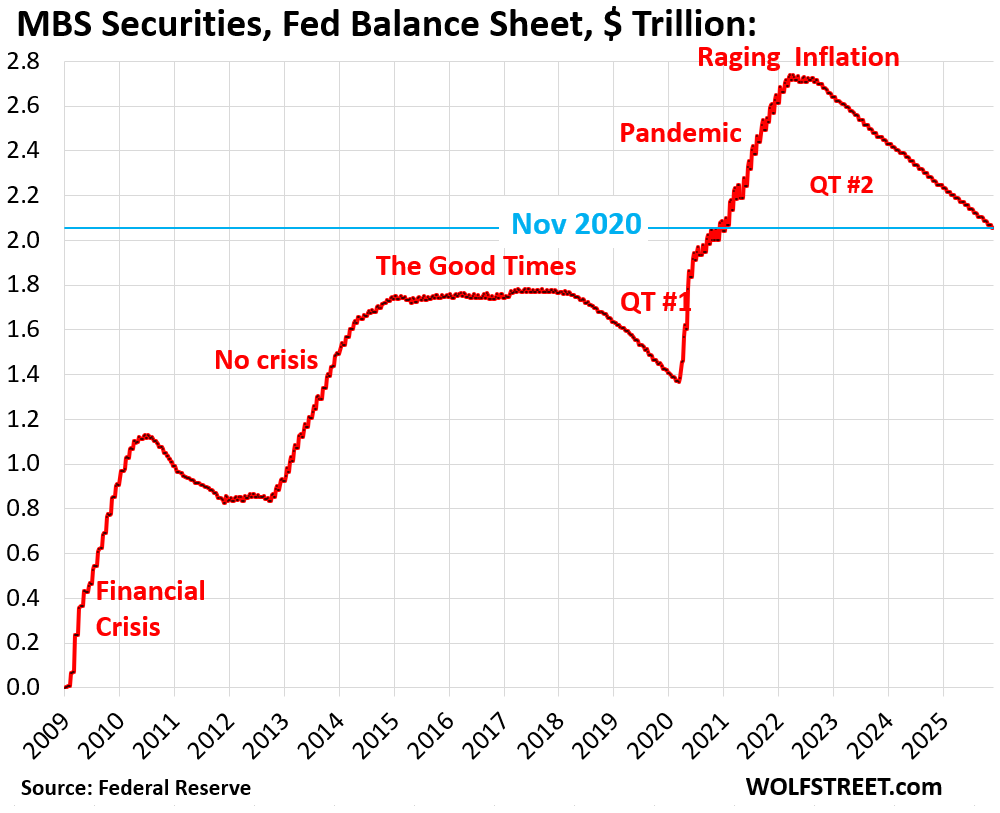
Mortgage-Backed Securities (MBS): -$16 billion in November, -$687 billion (-25%) from the peak, to $2.05 trillion, where they’d first been in November 2020.
According to the Fed’s new plan going forward, MBS will continue to come off the balance sheet until they’re gone, and will be replaced by Treasury bills (T-bills, they mature in one year or less).
The Fed holds only “agency” MBS that are guaranteed by the government (issued by Fannie Mae, Freddie Mac, Ginnie Mae), where the taxpayer would eat the losses when borrowers default on mortgages.
MBS come off the balance sheet primarily via pass-through principal payments that holders receive when mortgages are paid off (mortgaged homes are sold, mortgages are refinanced) and as mortgage payments are made. But sales of existing homes and mortgage refis have plunged, and far fewer mortgages got paid off, and passthrough principal payments to MBS holders have slowed to about $15-19 billion a month.
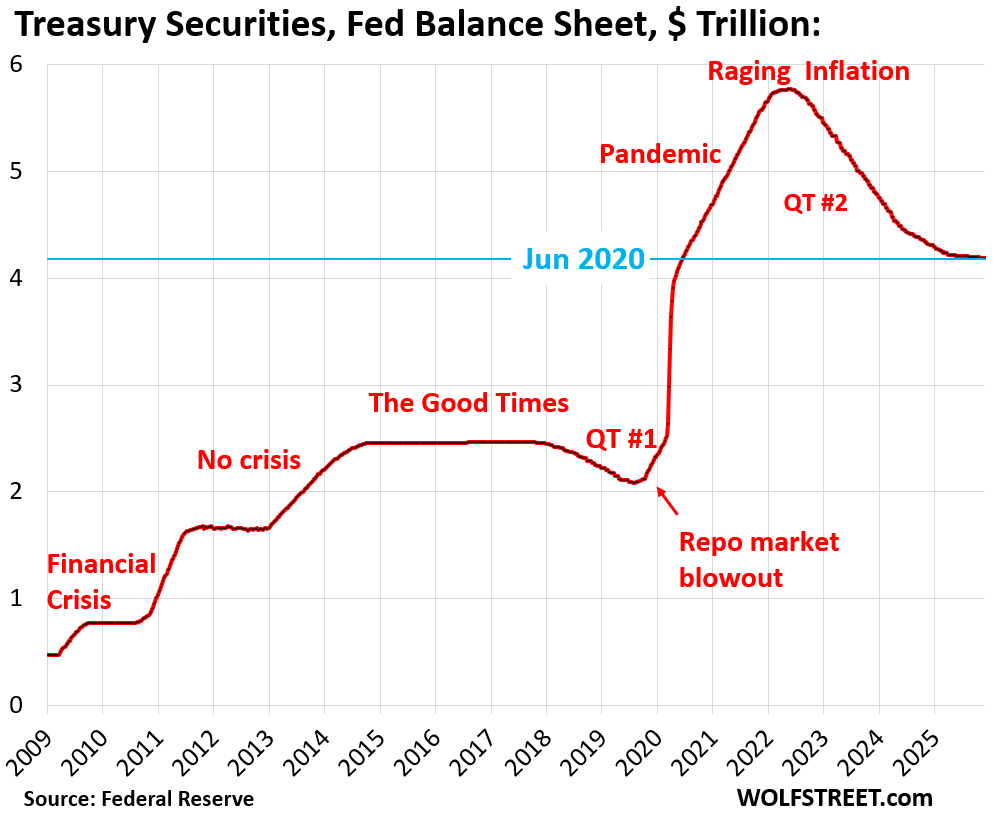
Treasury securities: -$4 billion in November, -$1.58 trillion (-27.4%) from the peak in June 2022, to $4.19 trillion.
Under the Fed’s new plan, as the balance sheet remains flat going forward, but MBS decline, while T-bills increase to replace MBS, overall Treasury securities will increase with the increase in T-bills. This will gradually shift the composition of the balance sheet from MBS to Treasury securities, with T-bills (now just $195 billion) becoming a larger part.
Bank liquidity facilities:
- Standing Repo Facility (SRF) had a zero balance again, see below.
- Central Bank Liquidity Swaps ($0.0 billion)
- Discount Window: balance ticked up by $700 million to $7.8 billion.
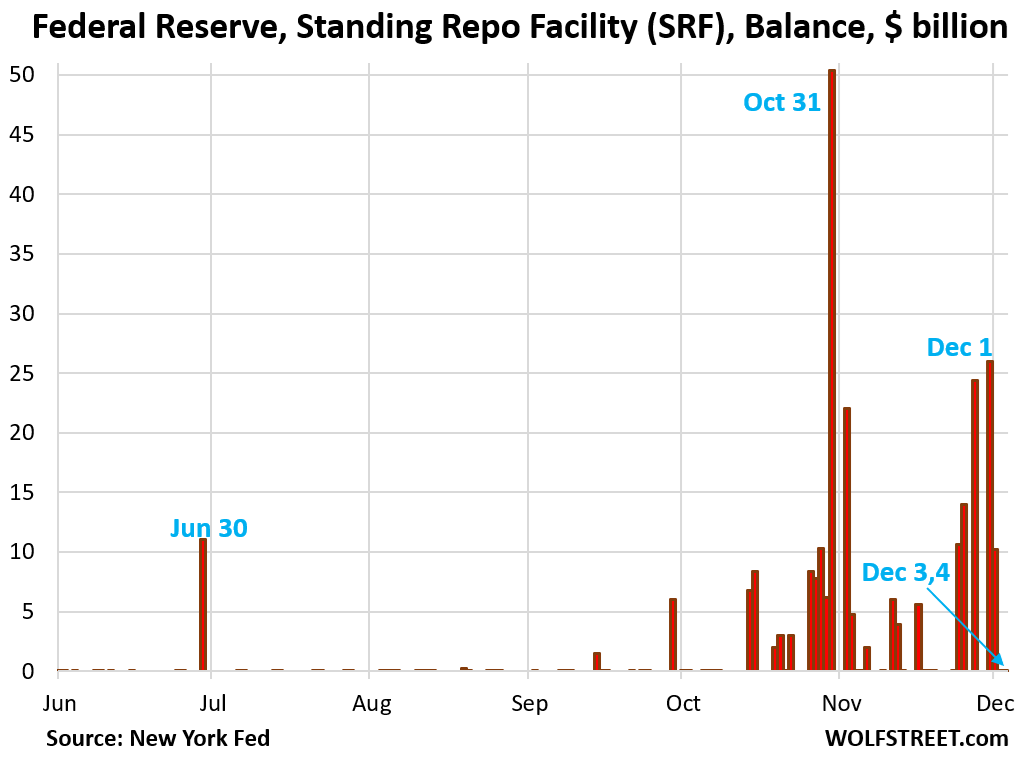
The SRF: The Fed has been exhorting its approved 40 or so counterparties, all of them big banks or broker-dealers, to use its new SRF, implemented in July 2021, to borrow overnight at it via repos and lend to the repo market overnight when yields in the repo market rise above the rate at the SRF (4.0% currently).
At the end of October, there was turmoil in the repo market as month-end liquidity pressures met with the government shutdown, which had caused the government’s checking account at the Fed, the TGA, to absorb $200 billion in cash that wasn’t getting disbursed, and repo market yields spiked.
Banks stepped in and borrowed at the SRF and lent to the repo market to profit from the spread. On October 31, the SRF balance hit $50 billion.
These are overnight repos that unwind the next business day, when the Fed gets its money back and the banks get their collateral back.
The month-end pressures abated in early November, and the SRF balance dropped back to zero. The SRF had done its job (my discussion of this episode is here).
But the Fed expressed its disappointment with the banks that they had used the SRF too little and too late, which had allowed repo market rates to surge too far above the upper end of the Fed’s policy rates, currently 4.0%.
At the end of November, the month-end liquidity pressures pushed up repo rates again, but not that much, and banks used the SRF, but not that much, with the balance peaking at $26 billion on December 1. Those overnight repos matured, and over the past two days, the SRF balance has been back to zero.
Without SRF, the repo market blew out in 2019.
Back in September 2019, after two years of QT, liquidity had become tighter in the repo market, and several things came together, including quarter-end liquidity pressures and corporate estimated tax payments, and repo market rates rose and then spiked, but banks didn’t step in and lend to the repo market to profit from it because they were tight on liquidity themselves as reserve balances had dropped during QT, and there was no SRF for them to borrow from because the Fed had scuttled its classic SRF in 2009 because it wasn’t needed during QE.
So repo market rates blew out and hit the double digits – in this $5 trillion-a-day funding market that many financial entities depend on. The odor of contagion was in the air.
The Fed then stepped in and engaged with the repo market directly, offering overnight and term repos. The amounts were big, maxing out at $257 billion at year-end 2019. At the same time, it started buying T-bills to flood the banking system with reserves.
This episode of the repo market blowing out and essentially forcing the Fed to undo a big part of two years’ worth of QT in a few months taught the Fed a lesson: In July 2021, while it was still doing QE, the Fed reestablished the SRF. And this fall, the SRF did its job and prevented another repo market blowout.
What else…
“Unamortized premiums”: –$2 billion in November, to $227 billion.
With these regular accounting entries, the Fed writes off the premium over face value it had to pay for bonds during QE that had been issued earlier with higher coupon interest rates and that had gained value as yields dropped before the Fed bought them. Like all institutional bondholders, the Fed “amortizes” that premium over the life of the bond.
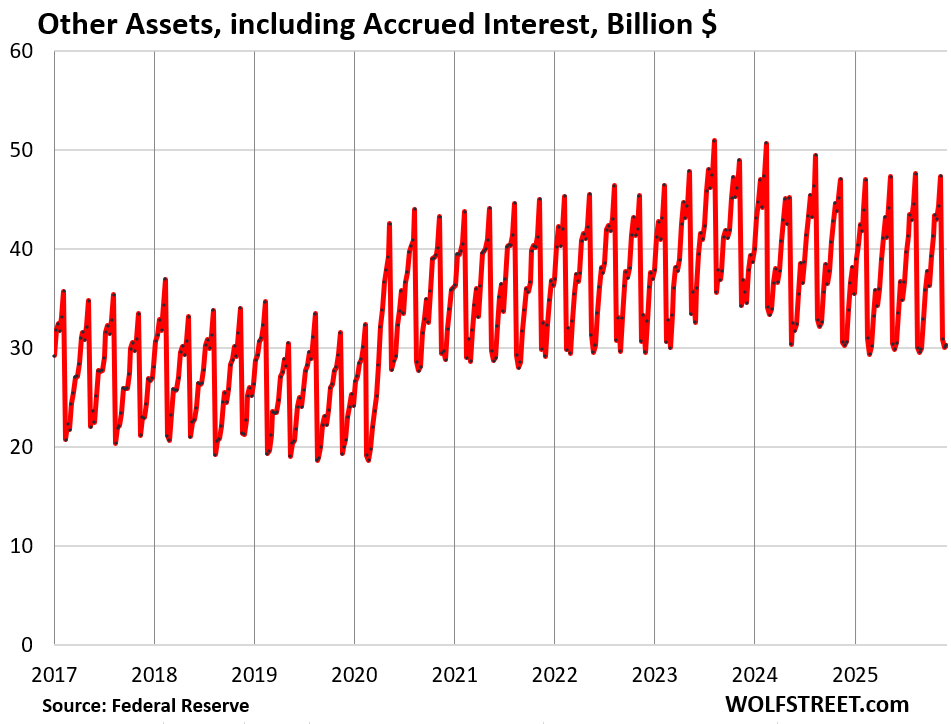
“Other assets”: -$14 billion to $30 billion. This $14 billion drop consisted mostly of accrued interest the Fed was paid on its bond holdings.
The Fed doesn’t have a “cash” account, like companies do; it creates money when it pays for something and destroys money when it gets paid, and so when it gets paid the interest that it had accrued, it destroys that money, and the balance sheet drops by that amount. When it accrues the interest before it gets paid, the interest amount to be paid is added to the balance sheet.
This account fluctuates up and down on a quarterly cycle, on these interest accruals and interest receipts, but has stayed in the same range for five years.
This account also includes “bank premises” and other accounts receivables and will always have a balance.
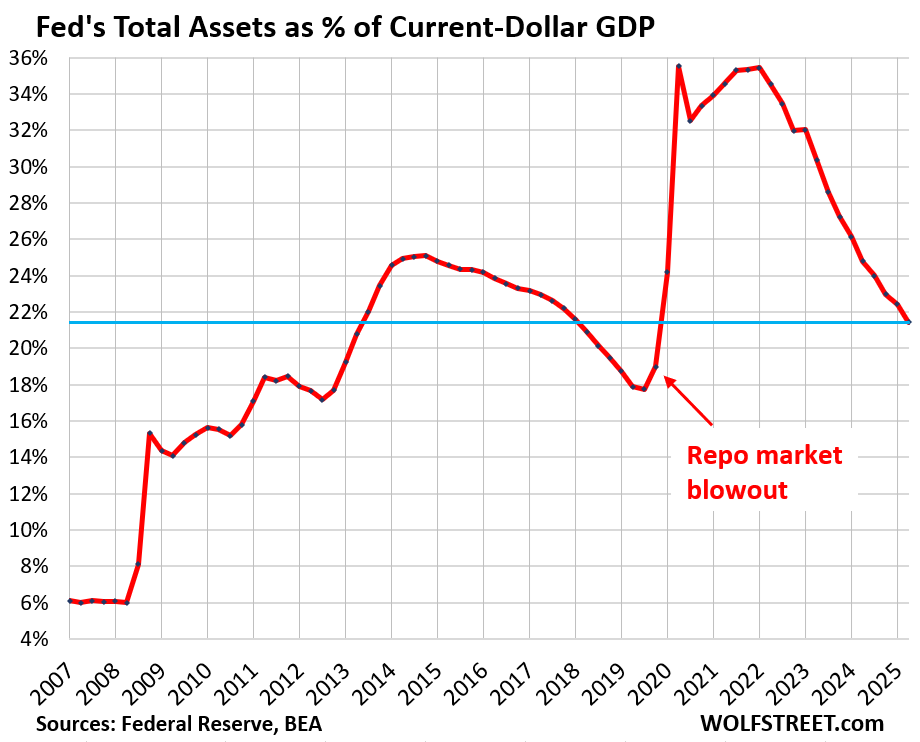
Fed’s assets as % of GDP.
Before 2008, the Fed’s balance sheet grew as a function of currency in circulation and more broadly as a function of the size of the economy and the banking system.
Powell said during the press conference after the October FOMC meeting that the size of the balance sheet as a percent of GDP was one of the indications that it was time to end QT.
But the structure of the balance sheet changed during the Financial Crisis because the Treasury Department’s checking account was moved from private-sector banks to the Federal Reserve Bank of New York. This Treasury General Account (TGA) is a liability on the Fed’s balance sheet. As a balance sheet always balances, this means that assets had to grow with that liability over the years. There are currently $908 billion in the TGA. The addition of the TGA during the Financial Crisis has permanently increased the size of the balance sheet.
The Fed-assets-to-GDP ratio dropped to 21.4% in November, as per Q2 GDP, since Q3 GDP has gotten tangled up in the government shutdown. Q3 GDP will be larger than Q2 GDP, and the actual ratio is therefore even lower.
If the Fed holds the balance sheet flat for some time after QT ends as the economy grows, this Fed-assets-to-GDP ratio will drop further. This also occurred in 2015 through 2017, when the balance sheet remained essentially flat, but the assets-to-GDP ratio declined because the economy grew.
And in case you missed it, the balance sheets of other major central banks as % of GDP: Amazing How Central Bank Money-Printing Reversed around the World after the Inflation Shock
Enjoy reading WOLF STREET and want to support it? You can donate. I appreciate it immensely. Click on the mug to find out how:

![]()
The Fed should be restricted to only running the discount window. The games they play to help wall Street are always in the dark until a month later. Its time they were returned to their original function, that is to provide liquidity to SOLVENT banks thru the discount window and doing bank audits.
They cannot control price levels or employment. All they do is exacerbate the downside of each.
Professional experience goes back to 1972 in financial management positions. Let the markets clear themselves. Get rid of the Greenspan puts, Bernanke asset inflation, Yellen who knows what and then Powell’s mess.
They have evolved into the get out of jail free card for Wall Street and bad bank management.
“always in the dark until a month later”
No, the balance sheet here is published weekly, and most data on it, including balances of Treasury securities by type, balances of MBS, and detailed SRF activity, are published DAILY. Just because you don’t look at it doesn’t mean they don’t do it.
Wolf:
What would life, the business world, certainly the financial industry, transactions and trade, safety, business sentiment, risk on and risk off, retained balance sheet liquidity in the private sector, etc. etc. BE, WITH NO FED whatsoever?
Hypotheticals like this can be amusing, like what would the US look like if the world were flat?
Amuse us. Signed Ron and Rand Paul. Two real jokers.
Yes, they are. Not sure they know it though.
Well that is the typical straw man argument trying to justify the worst performance as better than a hypothetical alternative.
Most of the issues that you sight have become tired symbols of a certain kind of exploitation that the American people are gradually becoming aware of.
Because, love is the only continuously positive force known to man.
I wonder how the fed will roll off MBS when the housing market looks the way it does.
No problem. It’s has been doing it for 3.5 years.
You know that past results do not portray future actions. If it’s so easy to do, as you are implying, then why stop at all? You have stated previously that the Fed never should have purchased this trash in the first place.
The Fed is NOT stopping the MBS run-off. It continues as before until they’re gone.
The SRF having done it’s job in Nov, and then again in Dec (and because the banks didn’t “use it enough”, and now 2 days the SRF is back down to zero. But why so much activity outside of the quarter end? TGA build up? If that’s primarily what it was, then you’ll be right saying “having done it’s job” :)
The job of the SRF is to keep repo market rates not too far above the top end of the Fed’s policy rates. But banks have to use it to make that work. If banks sit on their hands and don’t use the SRF, it doesn’t work.
The current activity levels at the SRF are small compared to when the repo market blew out in 2019, when the Fed’s repos peaked at $256 billion, and in March 2020, when the Fed’s repos hit $450 billion, compared to $50 billion for the SRF at the end of October. Here is an older chart of what that looked like.
If this is as good as it gets lets hope we don’t have a need to go crazy wild too soon. I had high hopes for getting it down to a “mere” $4T and 18% or so of GDP. Oh well….
Why don’t you love me like you used to do,
When I gave ya a dollar an’ you gave me back two.
My business plan’s still as sleazy as can be,
Why don’t you bring back the old Que Eee!
Effective March 26, 2020, the Board of Governors reduced reserve requirement ratios on all net transaction accounts to zero percent.
Before that date, net transaction account balances above the reserve requirement exemption amount and up to a specified amount were subject to a reserve requirement ratio of 3 percent. Net transaction account balances above the low reserve tranche were subject to a reserve requirement ratio of 10 percent.
So now that the “Covid emergency” is over, and the SRF is there to stabilize and protect the financial system, when is the Fed going to reinstate “business as usual” requirements? If the answer is “never”, then how is the Fed justifying that? Shouldn’t banks have at least a tiny bit of “skin in the game” to promote “safe” lending? Why were the requirements there in the first place, if not for “good cause”?
The Fed officially switched from a “scarce reserves regime” (as practiced before 2009 QE) to an “ample reserves regime” (as practiced after 2009 QE) in early 2021. Meaning that reserve balances are much larger than before due to QE, and it pays interest on them, and no longer needs to force banks via “minimum reserve requirements” to keep at least some reserves at the Fed. There are still $2.8 trillion in reserves at the Fed. If the Fed reverts to a “scarce reserves regime” and minimum reserve requirements of 10%, as it did before – which would require additional $1.5 trillion or so of QT – reserve balances would be a lot smaller than today. See before 2009. I favor a return to a “scarce reserves regime” and minimum reserve requirements (they go together). But that’s not happening under the current Fed leadership.
Honest answer. If only emergency, short term, measures had been used rather than relentless QE , would we be in a better place today?
Yes.
Definitely. Ultimately, the bad debt will be cleared. Thrown bad actors in prison would have also discouraged more bad behavior.
Ben “we will never monetize the debt” Bernanke should be tried for treason and publicly executed if found guilty along with Hank Paulson. Otherwise, the looting of the treasury and destruction of the middle class wil continue.
” Bernanke should be tried for treason and publicly executed if found guilty along with Hank Paulson.”
and Ben got the Nobel
Ben Bernanke was a man out of his element that implemented a theoretical conjecture as policy. Perhaps in response to the European monetary authorities that had already initiated the monetarists solution to an incipient recession.
“in response to the European monetary authorities that had already initiated the monetarists solution”
The ECB didn’t do QE until way after the US started. The ECB used to be pretty hawkish, until whatever-it-takes Draghi came along in 2011.
According to some people, the QE bailout saved us from losing our jobs, our wealth…everything we had, and everything we were going to have. Jobs would not have returned. People would have refused to invest. Workers would have been forever idled. The financial system would have vanished, and we’d have eaten sticks and ants until the end of our miserable lives.
Yeah, well it is hard to choose where to start in delivering a rebuttal to your claim that “the QE bailout saved us from losing our jobs, our wealth …. etc”
Wolf correctly labeled them the most reckless Fed in history in his recent article on the subject of the effects of an extremely reckless policy.
There is an alternative narrative of the wisdom of what went on.
Love is ….
6.5 trillion is still disgustingly offensive, especially the 2.0 trillion in MBS. The Fed has been the greatest enabler of bad behavior that the world has ever seen. A truly independent Fed would hold congress’ feet to the fire. It’s disgusting and the primary reason why risk(trust) is being repriced globally.
Frankly, I have been thinking along a parallel line in the sense that the engorged Fed balance sheet is not for the benefit of us plane old Americans.
We just made it possible.
Wolf…
With the coming regime change at the Fed coming…
Any insight into Kevin Hassett? ( assuming he’s the choice)
and….
Does the Fed Chairman have final say over policy or do the Fed Governors control policy? Can the Chairman overrule the guidance of the majority of Governors?
Thanks
Hassett is smart and ambitious. His latest gig is his loyalty to Trump, likely motivated by his desire to become Fed chairman. And it may be paying off. What he will do once he is chairman (if…) will be interesting to watch. Trump’s prior stooge at the Fed, Powell, caught hell from Trump even back in 2018, when he wasn’t enough of a stooge.
The chairman has 1 vote out of 12. The chairman has no “final say” over anything. All the chairman can do is to persuade and cajole the others to come to his point of view. Theoretically, it could be that we get 7-5 decisions, with five dissenting voters, the chairman being either on the winning or losing side.
It will be interesting to see how far Trump will go to seize control of the FOMC. At present, it still seems like there’s many (mostly?) adults in the room. Will Trump attempt a purge of anyone not toeing the line?
And as you say, Hassett is certainly talking like a stooge at this point, but it might be just to get the job. Is being a puppet really his career ambition? or might he have a backbone once in place?
I don’t think the Fed is powerless institution that is easily rolled, but that assumption will be tested in the coming years.
Hassett couldn’t be any worse than the current defective Fed policy. Just like a silly question is Trump worse than Biden. I would say yes simply because Trump is the current pretender is running the table.
I have a controversial hypothesis that posits that the primitive source of inflation is asset price inflation created by a profligate Fed forced to fund the obese military budget. When you think about it the best way to get the liquid to flow is to tip the pitcher, lowering the interest rate would cover for the Federal deficit that the tax cuts for the wealthy would require for their less fortunate brothers and sisters to pay for.
“But the Fed expressed its disappointment with the banks that they had used the SRF too little and too late, which had allowed repo market rates to surge too far above the upper end of the Fed’s policy rates, currently 4.0%.”
One can use the “Triparty-Fed Spread” aka TGCR-SRFR to measure how irrational dealers are when borrowing in repo on month end.
So what if short-term borrowing costs rise above the Fed’s interest on reserves. QT needed to continue. Prices are too high. The FED needs to control the velocity of circulation, not the volume of money.
The fed is like psychiatrist trying to get therapeutic value dialed in with its medicine. Like medicine tolerance build up in liquidity. The new Fed chairman will be tested on day 1 at crisis time, like few have and the tools in the toolbox could be ineffective or detrimental to the patient. Pips should be rising in the long bond after todays PCE, income growth creates inflation without productivity gains, I made mistake by calling pips basis points in a past comment. I am surprised no one corrected me. It’s been slow motion train wreck at the roll over bubble bursting , I guess it will cause the most pain for the buy the dippers. Seems like more people are talking about lack of profits in AI and the real debt loads. meta claims its AI has increased ad revenue by 60B, but zero new verticals of revenue generating machines. It’s the missing of new verticals of revenue from AI that is missing for the providers I get the infrastructure providers make money while people have liquidity to pay the bills, but where is the profit from AI? That’s the bubble breaking answer.
Arvind Krishna, CEO for IBM said what many of us have been saying;” even a simple calculation reveals there is no way tech companies’ massive data center investments make sense.”
In addition, the construction of a data center in North Georgia dropped the water table so low that all the local wells ran dry (New York Times reported on this). How’s that going to turn out for the local political class?
LOL!
They want to build data centers in Michigan, because of the water. It’s BS. Gets me angry!
Morgan Stanley recommended to buy CDS on oracles bonds, this is the danger. People buy 100x CDS on a 10b tranche of bonds. If the 10b bonds default someone is on the hook for paying 1trillion in this hypothetical situation. since it happen before it’s likely to happen again. Right? People don’t learn with moral hazard. They repeat the same mistakes all for greed. Delta neural is in vogue, it’s an illusion when the $vix gets high enough and when people can’t make margin calls. Perfect storm!
Regarding banks and CDs
Janet Yellen set the precedent by covering all deposits in the SVB debacle.
The 250K FDIC limit was cast aside.
This to me was a monumental decision, and I suspect it will be referred to in the next crisis.
I still dont understand where she had the power to do such a thing. Understood that other things were dispersed to other banks, but it still stands as a remarkable move by one person. IMO
hey Just asking~ you can thank stablecoin and latent fragility in the whole system for the reason of the bailout. Great article in NYT times about stablecoins today. IMO the treasury and the fed tolerates the systematic risk from stablecoins and the basis trade because they need buyers for T-bills and UST and are willing to tolerate the risk.
In regards to SVB this all happen~ (8% of collateral to a player can bring down the house.) “Circle, the issuer of the second-largest stablecoin USDC, disclosed it had $3.3 billion (about 8% of its total reserves at the time 40B) held as uninsured deposits at Silicon Valley Bank. This news triggered a bank run within the crypto world, causing USDC’s value to drop from its intended $1.00 peg to a low of approximately $0.87.
Contagion Effect: The instability in USDC led to a contagion effect, where other stablecoins like DAI and FRAX, which used USDC as partial collateral, also briefly lost their pegs. This forced investors to flee to stablecoins perceived as safer, such as Tether (USDT), or to cryptocurrencies like Bitcoin (BTC), which acted as a relative safe haven during the shock.” not so stable :)
Crypto selling will keep accelerating, it will catch the eyes of the remaining risk buyers. Equity reversal is now. When Googl goes red everything will follow! Down day coming, down week in equities by close. It’s getting exciting, it’s like a roller coaster ride the drop is coming.
One wonders to what extent BTC was used as collateral or margin….and its loss of value might have some big ripples through the markets.
You can think of all cryptos globally combined as 1 Nvidia. Cryptos now have a combined market cap of $3 trillion, after the plunge. At the peak they were over $4 trillion, which is where NVDA is. So all cryptos plunging by 30% had about the same effect as NVDA plunging 30% and all other stocks combined remaining the same. So overall, not a lot of impact. But those in leveraged crypto positions could face major damage or wipeout, and Strategy ETFs, betting in a leveraged manner on Strategy’s leveraged Bitcoin position have already gotten wiped out. But the numbers are small. Couple of Lambos that were ordered but not picked up?
Warren Buffett is famously associated with the phrase “financial weapons of mass destruction,” which he used to describe complex financial instruments called derivatives. The total notional value (open interest) of the global crypto derivatives market is estimated to be around $20 trillion to $28 trillion as of late 2024, not sure what it is now. it’s all contracts with faith people will deliver, counterparty risk, insurance funds for defaults, auto de levering when insurance is low, eventually the risk becomes the clearing house. When I’ve been commenting here that clearinghouses will fail if counterparties go bankrupt, this is what am referring OCC is at risk in equity land too they only have a couple of banks and so much risk, this is what warren buffet was referring to.
The FED is loosing control of the money supply because of ‘”coins”, particularly Bitcoins, but gold and silver and perhaps copper and foreign monies should be added to the money supply along with their velocities of circulation. Money supply calculations should be a world number. A chart of the gold price vs the world’s money supply would be a very interesting one.
“Money supply” is strictly defined by what bank accounts and money market accounts are included. None of the things you mention affect money supply. Neither gold nor cryptos are used in everyday commerce — but that’s the function of money supply, it’s supply of money to participate in everyday commerce.
The MMMFs have kept interest rates down. To count their balances in the money stock figures is to double count.
Mises has it right:
“The definition of M2 includes money market securities, mutual funds, and other time deposits. However, an investment in a mutual fund is in fact an investment in various money market instruments. The quantity of money is not altered as a result of this investment; the ownership of money has only changed temporarily. Hence, including mutual funds as part of M2 results in the double counting of money.”
Same thing with MSBs from 1913 to 1980
That’s nonsense. Today’s MM funds invest in Treasury securities with less than 1 year to run (not included in money stock); in repos (not included in money stock); in commercial and agency paper (not included in money stock); in the Fed’s ON RRPs (now near zero, not included in money stock)… and they have small amounts of cash at banks, and only that part is included in money stock.
If a nonbank invests in securities nothing changes except the velocity of circulation.
Isn’t that what you said?
If you could define money, then you could apply double-entry bookkeeping on a national scale. Loans/investments equal deposits.
BTCs and the others, with their jump in perceived value greased the wheels for “rolling the dice” and aggressive speculations in other arenas.
The perceived wealth these cryptos created seemed to add to the “Wealth Supply” rather than the money supply….but I agree, the crypto loss of value could have giant ramifications. Add in the new questions about “AI”.
It would be nice to see more QT but as long as the BS to GDP keeps shrinking that’s good.
Coincidentally, with the US GDP around $31 trillion annually, it’s more or less a million dollars a second now.
Wolf, this question has come up many times, but maybe you can explain it again: why can’t the Fed’s balance sheet fall much below $6 trillion? You recently shared a chart in a comment showing cash in circulation versus the Fed’s balance sheet between 2004 and 2008. Back then, the Fed’s balance sheet was ONLY about $40–50 billion above cash in circulation. Today, with cash in circulation at roughly $2.4 trillion, the balance sheet still needs to be around $6 trillion?
This is from nearly 2 years ago… so we’re nearly two years further down the road, and the economy has grown since then. But the math still holds — all this assumes that the Fed will stick with its “ample reserves regime.” If it reverts to its pre-2009 “scares reserves regime,” the balance sheet could drop a lot lower, but there would have to be other big changes.
https://wolfstreet.com/2024/03/23/the-feds-liabilities-how-far-can-qt-go-whats-the-lowest-possible-level-of-the-balance-sheet-without-blowing-stuff-up/
Is it appropriate for the Fed’s balance sheet to rise in proportion to GDP if GDP has been artificially inflated through unusual levels of deficit spending?
It seems the balance sheet should rise in proportion to some idea of “sustainable” GDP.
Also, shouldn’t they right size the balance sheet before embarking on a policy to increase it?
Granted, it’s hard to pinpoint the best balance sheet level, but surely it should not support unusual levels of speculation and inflation, which we see today. Isn’t that a setup for continued high asset and price inflation?
“Is it appropriate for the Fed’s balance sheet to rise in proportion to GDP if GDP has been artificially inflated through unusual levels of deficit spending”
EXACTLY.
But the balance sheet only expands with the deficit spending when the Fed decides to “cushion” the blow by buying govt debt.
It used to be the Fed would expand in RESPONSE to the growing economy, the free market economy.
THEN, the Fed decided to pump the economy, cart before the horse. Of course this idea was not the Fed’s but an idea from those who run the Fed, behind the curtain.
So the GDP goes up with the deficit spending goosing all that it touches, the Fed then responds with expansionary monetary policy, in response to that which they created. The cost? The demise of the dollar’s purchasing power. Inflation.
All I want for Christmas is a Rate Cut and a resumption of QT.
Wolf,
On FRED, I looked at the Fed Total Assets chart from 1/1/2008 to now and then added a trend line. Where we are today is almost exactly on the trend. I think it’s interesting that’s the case, but probably doesn’t mean anything.
In my view it is a good decision to reinvest the MBS roll offs in T-Bills, this move was long overdue. Personally i had two questions: 1.) Wolf, do you think the Fed will restart “Reserve management purchases” additional to their T-Bills reinvestment in January as several bank analysts predict?
And 2.) It is possible that the Fed abolish their ample reserve system after introducing the SRF in the future and what will then happen with the balance sheet? Many thanks.
1. I have no opinion on when the Fed will restart “Reserve management purchases.”
2. The SRF showed during the Sep-Nov turmoil this year that it works in keeping the repo market from blowing out. It wasn’t perfect, and the Fed got a little frustrated with the banks for not using it earlier and more, thereby letting rates rise more than they should have. But we’re quibbling here. In 2019, the same situation, but without SRF, led to a major meltdown of the repo market that then triggered dramatic Fed action. So this was a huge improvement, and it has been tested successfully.
With the SRF in place, over time, the Fed could back off its “ample reserves” regime. The Fed’s Logan has pointed out that banks have not had to manage their liquidity on a daily basis for many years since they had so much liquidity (reserves), and forgot how to do it, and maybe no longer had the staff to do it, and it would take some time for banks to relearn how to manage their liquidity in an environment where liquidity is tighter.
We’ll see maybe where this is going sometime after the reserve management purchases start.
Also, the “ample reserves regime” is Powell’s baby. He did it. If the Fed ever considers moving away from it, it will not even discuss moving away from it until after Powell’s term as chair expires in May 2026.
I think the figure to watch is the one on the H.4.1 release entitled “reserve balances held at the federal reserve banks”. This excludes the old “applied vault cash” figure used in legal reserve management. And applied vault cash should never have been counted since 1959.
Yes (aka) “reserves” are what we’re looking at. But during the shutdown, some liquidity migrated from reserves to the TGA because the government was issuing securities but not spending the cash. So this introduces some variations into reserve balances unrelated to the Fed’s balance sheet action, but related to government action. The Fed warned about this issue before the end of the debt ceiling, when the TGA was low, pointing out that after the end of the debt ceiling, the government would refill the TGA, which would shift cash from reserves to the TGA, and fairly quickly, and it did that, about $600 billion. So reserves alone don’t tell the story.
I feel like the govt has forgotten that the game of musical chairs has to end sometime. Qt should continue to tighten. There’s far too many irresponsible players in the market, including colleges. At the time balance sheets still need to shrink. Some significant pain would be ahead, but we would all be better off for it.