Far outdistancing inflation and blowing by food & beverage stores.
By Wolf Richter for WOLF STREET.
Most spending at restaurants and bars – “food services and drinking places,” as they’re called – is discretionary. Americans could eat and drink at home, they could bring lunch to work, etc., but they choose to eat out. And despite Americans’ sour mood, sales at these establishments continue to soar, they shot way past sales at grocery & beverage stores, and the distance between them keeps growing. Sales at restaurants & bars now account for 14% of total retail sales, behind only motor-vehicle & parts dealers (#1) and ecommerce (#2).
Sales at these food services and drinking places jumped by 0.74% in September from August and by 6.7% year-over-year, to a record $101 billion, seasonally adjusted, bringing the 12-month total to $1.16 trillion, according to the delayed data from the Census Bureau on Tuesday (blue line in the chart).
The three-month average, which irons out the month-to-month squiggles, jumped by 0.61% in September from August, and also by 6.7% year-over-year (red line).
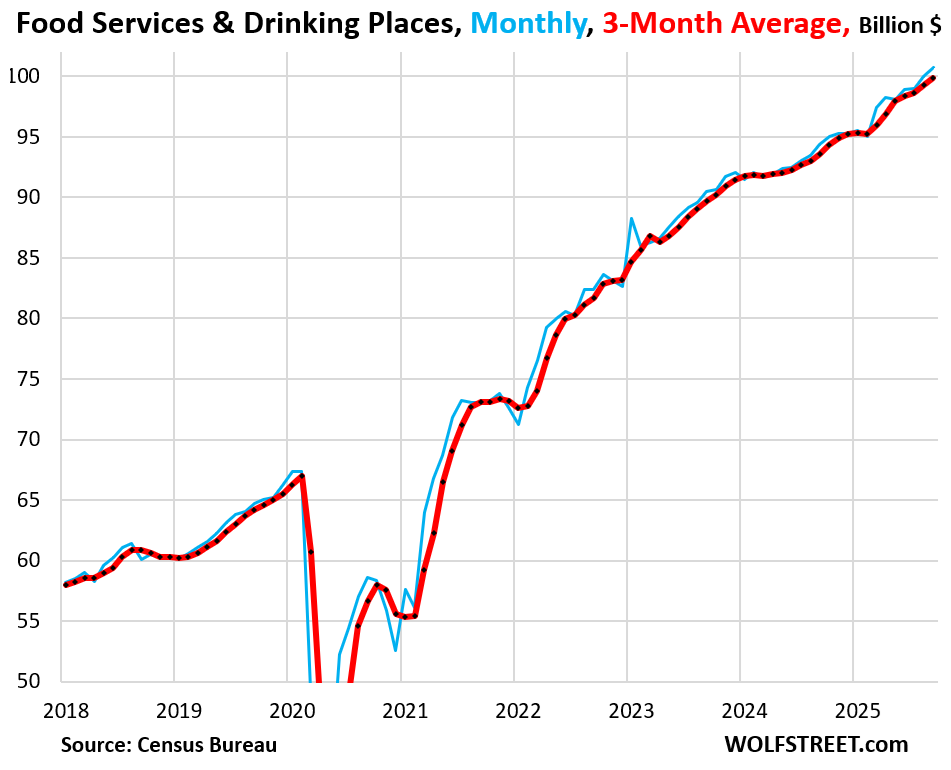
Americans love the experience and convenience of eating out, they love having fun, they’re willing and able to pay for it despite some moaning and groaning about rising prices and tipflation, and there is no sign that they’re letting up.
Outrunning inflation by a wide margin: The rate of CPI for “Food away from home” rose by 3.7% year-over-year in August, the last month available, while sales at food services and drinking places rose by 6.7%.
Cumulative inflation since January 2020 for “Food away from home” amounted to 33%.
But sales at “Food services and drinking places” since January 2020 jumped by 50%, despite the collapse from March 2020 through early 2021.
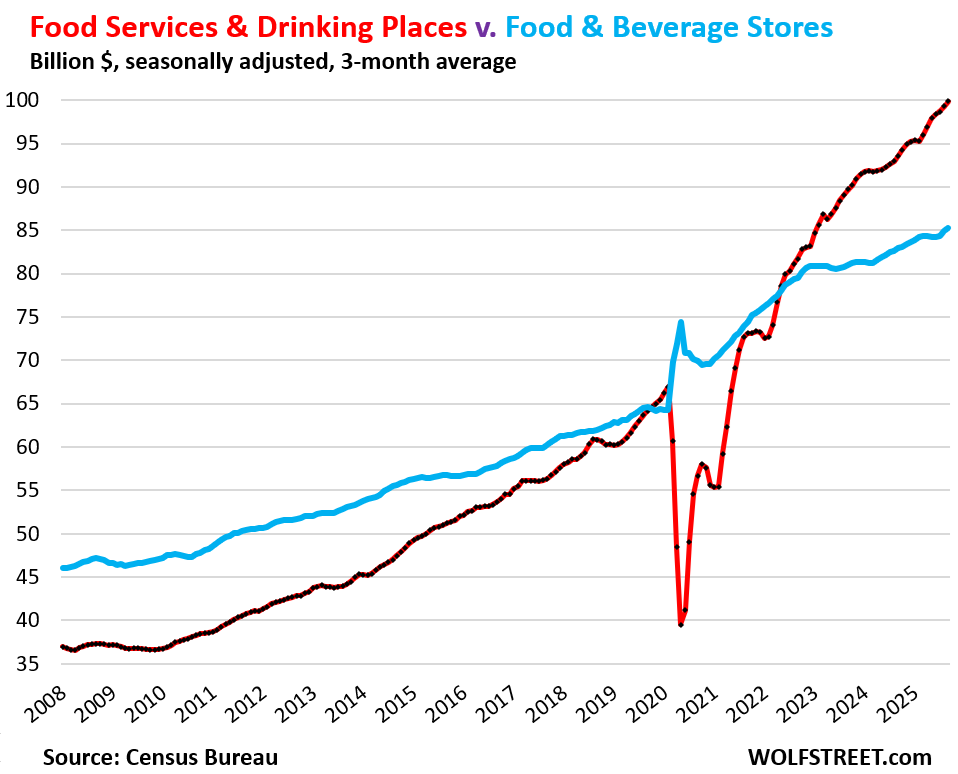
Sales at food and beverage stores have also risen, but only 0.21% for the month and by 2.7% year-over-year, just rising with inflation this year: The CPI for “Food at home” rose by 2.7% year-over-year through August. Grocery store sales typically rise with inflation and population growth, but the US population may now be rising only slowly as a result of the crackdown on illegal immigration.
Since January 2020, sales at food and beverage stores have risen by 34%. Over the same period, inflation for “food at home” amounted to 30%.
Ecommerce food sales are not included here. The sales here took place at brick-and-mortar stores. But online food sales are making inroads. Supermarket chains offer them. Walmart, the largest grocery store in the US, pushes them. Specialty online-only food retailers have sprung up and are doing brisk business. Amazon is all over online grocery sales. But these online grocery sales are not included here, they’re included in ecommerce sales.
The shift to ecommerce of grocery sales is now making a dent into brick-and-mortar grocery sales and explains in part why these brick-and-mortar grocery sales have grown so slowly.
The big shift of food sales to restaurants. After the Great Recession, sales at restaurants and bars started rising faster than sales at food & beverage stores and surpassed them in late 2019.
During the pandemic, sales at grocery stores spiked while sales at restaurants and bars collapsed, as much of the spending on food and drinks shifted to grocery stores.
But that didn’t last long. By mid-2022, sales at restaurants and bars once again blew by sales at food & beverage stores, and the gap has dramatically widened since then.
In September, Americans spent a record 17% more – or $15 billion more – at restaurants & bars than at food and beverage stores on this three-month average basis:
Eating and drinking out are booming because Americans want the experience and are willing to pay for it. Maybe that’s how they’re dealing with their sour mood.
There is no sign of consumers letting up either. These are our Drunken Sailors at work, as we’ve come to call them lovingly and facetiously. But not literally drunken: Alcohol sales have plunged for years, as younger people are enjoying dinner with mocktails, nonalcoholic beers, or just water, and get stoned instead; and older people finally heeded medical advice and cut back on alcohol consumption.
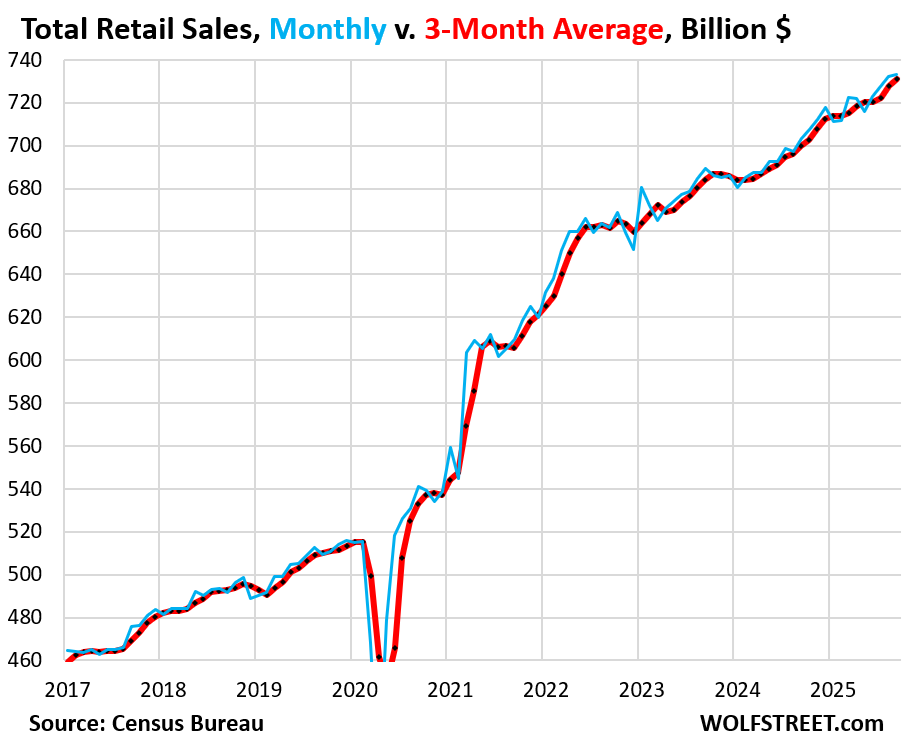
Total retail sales jump up and down on a month-to-month basis despite being seasonally adjusted, not because consumers suddenly open or shut their wallets, but because the data is notoriously noisy. The three-month average irons out those month-to-month squiggles and shows the trend.
So in September, retail sales rose only 0.16%, but there had been big month-to-month jumps in August (+0.60%) and July (+0.65%), and the three-month average rose by a very solid 0.47%, or 5.8% annualized.
Year-over-year, retail sales rose by 4.5%, at the upper portion of the year-over-year increases over the past 12 months, when year-over-year growth rates ranged from 3.1% to 5.0%.
Note how the three-month average irons out the monthly squiggles of the blue line:
In case you missed it – consumers are in pretty good shape financially:
Credit Card Delinquencies, Balances, Burden, Credit Limits, and Collections in Q3 2025
Enjoy reading WOLF STREET and want to support it? You can donate. I appreciate it immensely. Click on the mug to find out how:

![]()
“I ordered, consumed, then when the bill came, I was shocked.”
Sums up the behavior in this economy.
YouTube, Tiktok, and X are filled to the brim with videos of consumers complaining about the $100 they dropped on a pizza supper for 2. Somehow they forget to read the prices on the menu before ordering…every time.
Angry at prices, refuse to learn simple arithmetic to prevent repeat sticker shock scenarios, keep paying anyway. Then wonder why broke.
“Beni, Bidi, Bici”…I went to the beanery, I asked for the beans, I complained about the beans billed.
Look up the pricing at “Emma’s Tasty Cuisine” in the movie “Support Your Local Sheriff.” Prices would go up mid-bite.
In addition to dining out as mood lightener, the more people working overtime, or taking second and third jobs to make ends meet, the less time they have for meal prep. When I retire, I’ll be cooking at home much more than I do when working 50+ hours a week plus commute time.
us boomers love our grandkiddies
we go every other weekend to see our son with 2 grandkiddies
guess what my wife tells me
we’re taking them out to eat
$200 later we go home
ain’t retirement great, until we’re broke that is
Repub,as a carpenter working at times long hours a slow cooker is your friend!
You set it and forget it and can with a large one cook great meals for a few days while slaving to the grind!
Was a great,reasonably priced investment I made years back.
so I was reviewing bill last week at one of our better restaurants
they already raised the meal we like from $26 to $35
now they add in 4% surcharge to help pay employees
we left $1 tip on $125 bill – said go collect from surcharge
and
WE NO LONGER WILL be using their establishment
btw it’s Guadalajara grill in Tucson
Why stiff the server? The server and business are different economic concerns.
@ joedidee
“now they add in 4% surcharge to help pay employees
we left $1 tip on $125 bill – said go collect from surcharge”
You only leave 4% tips?
The minimum wage for servers in Washington state is now $22 an hour…. I’m not paying 20% tip on top of that. You get what you ask for. One of the highest min wages in the country, yes, including servers.
server was lousy – didn’t see him at all for periods of 10+ minutes
had to ask for everything, like we didn’t exist
restaurant was 1/2 full
and TIPS ought to be for superior service – not mandatory
pay the people or go out of business
so tired of these taker businesses
Best for everyone that you don’t return there.
darn straight – we don’t want to be seen as conservative or something
now go to your blue corner
$200? You got off cheap? Where did you take them? Pizza Hut? LOL! s/
A surcharge???
That’s straight out of an “Impractical Jokers” skit. Too funny.
This country is becoming (has become) an Idiocracy!
Holy Snikees Joe, at least hand the server a $10 bill you cheapskate!
Lol
if he had served us, then we wouldn’t have 10 minute discussion(he was absent for entire time) about service and tip
Ok Joe!
Well his loss
Based on the data you’ve provided, I’ve come to the conclusion that you’re a cheap jerk. If you don’t like the 4% surcharge, then deduct it from a 15% tip for good service. You should still be tipping 11% then. And you tipped $1?? Eat at home, jerk!
Are you quoting someone in particular?
I have eaten out twice this year. The food was awful both times. The first time was our wedding anniversary, the restaurant was beautiful, the food was uneatable, and it cost $300. The second time was a quick take out lunch at a Mexican restaurant, again the food was awful and $16, ate the rice threw out the rest. Afraid to eat out now.
That’s too bad that you had this experience. We go out once a week (date night). We don’t spend $300 for our dinners; that’s a lot of money to spend in a restaurant (we economize the booze). And it puts you in a really sour mood if the experience is bad. I totally get that. And it’s a shame that it happened to you.
There are over 7,000 restaurants in San Francisco, many of them within walking distance from the Wolf Street Media Mogul Empire Headquarters. We have a long list of favorite restaurants; but we also try to find new ones to add to the list. Some restaurants on our list close, such as when the lease expires after 10 years and the landlord decides to double the rent, and the restaurateur walks out to start something new in another location; new ones open all the time. It’s a very dynamic and fun market to check out.
You live in the best place for eating out in the entire country. My experiences are more like Petunia’s. The food is absolutely AWFUL most of the time I eat out, which is becoming much less frequent. And the prices…..
For once, I have to disagree with DC’s comment that SF Bay area is ”the best” place for eating out in USA, though I will certainly agree it WAS ”back in the day” when Ernie’s and the Blue Fox led while there were many others of lesser repute with equally delicious food but not quite the same level of charm.
IMVHO, the ”greater TPA bay area” in general, and the saintly part thereof in particular has become equal in all respects, and possibly even more diverse, with new delicioso offerings popping up every day at every price point, and all at better prices than SF.
I pine to eat at the best three course steak dinner Italian place in the town I grew up in.
A family of four prob could go out 2-3 times on $300.
At the restaurants I frequent. $15-25 entrees.
“ Wolf Street Media Mogul Empire Headquarters”. That’s quite the exquisite name! Do you have 500 employees that you’re not telling us about, or is it a ‘one-man show’ with a fancy name? Does WSMME occupy a 30 story building?
“…with a fancy name?”
It’s my fancy joke. I’ve using it for many years.
With today’s grocery frozen food section, any restaurant menu choice is available for “home cooking.” “Cocktails” are available at the liquor store in any strip mall. Neither place has “tipping.”
That’s kinda true gary.
At my Kroger owned chain (they own almost the whole world. But with diff names you love to love)… they sell spring rolls a 10 pack for $6
You can get the same spring rolls at Costco for $8, you just get 40 of them.
Have a Chinese food night! Mmmm
I am unfamiliar with San Francisco (went once long ago and wanted to move there) when you go out at night are the streets near empire headquarters safe? Do you walk around without reservation?
Bob,
1. In terms of no reservations: Yes, on weekends, some restaurants are impossible to get into without reservation, even at the bar.
But SF neighborhoods have commercial strips where for maybe 5-10 blocks, sidewalks are lined with restaurants, shops, and old movie theaters. Most of the movie theaters have been converted into something else, like a gym. Some still are movie theaters (the original two on the 8-block strip on Chestnut in the Marina). Most of the shops have been converted to restaurants and cafes. These neighborhood commercial strips at street level are the old design of a city when people walked to shop and do stuff. So if you decide to eat on Chestnut or its side-streets without reservation, you can go there and check which of your favorite restaurants has seats at the bar (where we usually eat). We might not get into the first two we try, but we’ve always gotten in somewhere, and you might try something new and get out of a rut. We call it “browsing,” and it’s a lot of fun.
If you go to a restaurant without reservation, you need to have a plan B and C.
It helps to make reservations at some hard-to-get-into restaurants, if you can. But often you can’t because spots are booked out weeks in advance.
2. crime: San Francisco is one of the safest cities in the US. Its homicide rate is among the very lowest. Last year, the number of homicides dropped to just 34, for a city of 840,000 people. That 34 homicides was the lowest since the 1960s when SF was a lot smaller. We go out on foot and walk all over the place at night… except for the few easily avoidable blocks in the Tenderloin and a few blocks in the South of Market area (and a few blocks out on Mission, which is too far for us to reach on foot).
The clickbait bullshit that you see out there on YouTube and the internet in general about SF is just clickbait bullshit by morons to titillate other morons so that they spread it around.
Click on the link below. I update this annually, so that people can see. It has charts of the number of crimes by crime category in San Francisco. Here is the chart for homicides:
https://wolfstreet.com/san-francisco-homicides-rapes-robberies-aggravated-assaults-burglaries-larceny-thefts-auto-thefts-and-arson/
I’ve lived in the much-maligned Tenderloin (TL) for 25 years and have not encountered one safety issue. I’ve had physical altercations 3 times in SF: North Beach, Lower Haight, and Western Addition. Crime in TL is almost all nuisance crime. I’m way more scared of the drivers than the people.
Want to call out some good cheap eats places in TL: Tadu (ethiopian), Ararat (kabobs), Cantoo (Latin asian fusion), Pakwan (greasy spoon Indian). If you want upscale I recommend the TL-adjacent Meskis. For this you’d want a reservation.
So, don’t be afraid to come to the Tenderloin. Watch out for the dog crap on the streets, though. That is my biggest complaint for the area.
Restaurant reviews are your friend.
Yelp, OpenTable, Trip Advisor. There’s others.
We routinely look up restaurants when traveling and are rarely disappointed. With online menus even the kids find stuff they like.
The increase in spend is not primarily driven by on-premise diners. Think about it–most places don’t have incremental seating capacity to allow such a run-up.
What’s changed is that restaurants are doing MUCH more take-out/delivery. Traffic at restaurants from off-premise customers (pick-up) had increased from 19% in 2019 to 30% now. Over 50% of adults say that food delivery is an “essentially” part of their lives and I personally know people who won’t move to places outside door dash delivery territory–it’s becoming like broadband. Part of this is continuation of pandemic habits and part is simply demographic change.
https://restaurant.org/education-and-resources/resource-library/report-takeout-drive-thru-delivery-are-more-popular-than-ever/
Are Americans actually in a “ultra-sour mood”? You wouldn’t believe it by looking at the charts in the article. Does the Census Bureau carry data for moodiness as well? ;)
Consumer sentiment surveys say that, such as the University of Michigan survey. I ridicule that survey. It’s meaningless.
But houses are too expensive nobody has any money!
People use credit cards when they go out to eat….pay later stuff and only the minimum!
I saw a person ask the grocery store gas station for some program to pay.
They asked for their address?
I’m not really sure how that works but I think it’s some credit program to buy gas.
Hey whatever works! 🤷🏻♂️ Life is hard
exactly. If we dissect that apparent conundrum we will find that the market structure has malfunctioned. The discrepancy between the sales price and the ability of the darling people too afford the asset is heart breaking,
I’m sure that the next generation will remember that the USA has always been a social Democracy.
Forged by the sacrifice of 15 generations or so.
In Japan 30 years ago they called it consumption of despair for the young people.
No hope in buying a home or raising a family so buy the fancy look and fancy wheels and party like you’re rich.
That HBO show about the journalist working for the paper and last samurai guy is the detective.
Really good show.
I wish we could see granular data, like by city, age, etc. It’s obviously a very urban phenomenon, maybe skewing coastal blue state, I live at ground zero for TDS, so I am biased, but I do see a lot of people who live for dining and travel, despite their “the end is near” mentality. Or maybe because of it? Anyway, I suspect the massive declines in home equity might finally sink in eventually.
As Wolf wrote in the article: “Eating and drinking out are booming because Americans want the experience and are willing to pay for it. Maybe that’s how they’re dealing with their sour mood”
Perhaps.
But another potentially significant factor is “time starvation” – if both parents are working (perhaps multiple jobs to pay eye-watering rents) then there may be no one at home who can safely/reliably cook.
Result – semi-automatic fast food dinners (also at eye watering prices for 4 meals).
Just a theory – I agree that the “food service restaurant” vs “food store” spending crossover is fairly mind blowing (less so considering inflation but still).
Even 20 years ago, grocery spending was well above restaurant spending.
Ditto 40 years ago.
And 60 years ago (pre fast food conquest) it wasn’t even remotely close. Fast food has made all the difference in terms of restaurant spend.
I guess “tying one on” helps lighten the mood until the credit card bill comes due.
Yes, one cannot void a contract based on intoxication that happens AFTER the contract was formed. I already tried that.
It reminds me of a cataclysmic period 100 years ago. The boom turned into a bust and the economy contracted, violently.
The Gilded age?
Was caused by lots of factors.
Doubt it repeats but it might rhyme!
Could it be because younger people are getting married and having children much later (or not at all) so instead they have free time and money for eating out and drinking?
I’ve wondered that too- more fun to go out with friends and have some eats and a few drinks than it is eating Spam and Noodles all alone.
Actually the blessed Mexican people are still having sufficient Americans to make the social security viable.
The 3-month graphs show that this likely to continue. TSonder’s comment reminds me of an article from years back titled something like “Restaurant Madness in New York.” The point was that younger people had little hope of buying expensive things like homes, so instead of saving, splurged. Where I live in suburban Detroit it appears that patrons are older, but not old and I guess enjoy the $30 pastas. Since covid, I prefer to take out rather than eat out. I patronize for the food not the experience. I do leave a tip. Fast food is an oxymoron, and I would rather not eat than pay the prices at these places. When I was younger, I balked at restaurant drinks prices an abstained which reassured me that I was not an alcoholic.
Yes, the bottom 50% could be spending less while the top 10% is spending a lot more. You could probably get a feel for this by looking at same store sales of mainstream restaurants like Chipotle, Wendys, etc. vs Ruth’s Chris and other high end.
What’s also forgotten is many young adults quite literally can’t cook even simple meals these days. Even their grocery purchases are pre-made meals, frozen food, snacks, target than components they will cook and assemble themselves. Inevitable March of culture I guess.
Even many of those that can cook find ways to justify door dash through some “time is money” fantasy while they go play another hour of whatever video game they are into.
Lots and lots of VC money is currently deployed in “disruptive” startups trying to get some of this food and beverage spend.
The noted increase in restaurant
and bar spending certainly explains
why the stock prices of these five
eateries have dropped. (/s)
Chipotle: 65 to 30
Starbucks: 115 to 85
Cheese Cake Factory: 70 to 45
Sweetgreen: 44 to 6
Texas Roadhouse: 206 to 175.
Chain restaurants deteriorate after the meteoric rise. See TGI Friday’s. That was a hot place in the 1980s. It’s dead meat now. The landscape is full of weakening and dying chain restaurants. But new chains come up. And then there are the millions of non-chain restaurants that people love to go to. It’s a very competitive business.
Starbucks has become a nightmare, going from my favorite café where you could have a double espresso and hang out with friends or with a laptop, to a take-out chaos situation for people who hate coffee, who buy sweet colorful drinks and leave. The Starbucks I know have redesigned their stores for takeout and sales of merchandise. There is hardly any place to sit; the atmosphere is cold and unfriendly, the opposite of the café atmosphere Starbucks used to have in its stores. Starbucks relentlessly destroyed itself over the past 20 years.
That’s a company-specific issue — a massive screwup.
Chains eventually do that. And stockholders get screwed over the long term. There is the hype bubble when they keep opening new restaurants, and then there is the long decline.
If you judge restaurant spending by stocks of old chain restaurants, you have no idea what you’re doing.
Not a criticism, just an observation – maybe StarLucks didn’t like so many people coming in and using their stores as study halls and social-hour hubs. Maybe they felt this wasn’t bringing in enough cash. Personally, I don’t spend a penny there anymore. I’d be happy if they all closed. $6.00 coffee drinks?
No thanks! What planet do they think this is?
I’m sure they had their reasons for this change in strategy. So now shares are back where they’d been six years ago despite the craziest bull market ever.
Investing heavily in any one thing is celebrated in two ways.
If you win, luck sometimes smiles on all of us. I think that love will win out, the chance is less than the likelihood of being struck by lightening.
If you lose, which at this time is the most likely outcome.
There is no commercial gambling corporation that makes payroll paying winners.
The meager income you may have is collected as a down payment on ones losses
I have seen a million dollar loss, transpire.
When was Starbucks your favorite?
I haven’t wanted to stay inside one longer than 5 seconds after getting my drink since maybe 2015.
1990s – 2001.
Fun topic. I went to the Seattle’s original Starbuck’s in the 80’s and really liked it. I won’t go to a Starbuck’s store. There are Starbuck’s kiosks seemingly everywhere here, in hospitals and my local Krogers. Their branded coffee is not special.
RE: (Quick aside) Chain Restaurant Stock Values
One opaque factor that some may not be tracking related to stock value is that such value is in part predicated on the net number of stores in operation, and new store openings for the coming fiscal year.
The Lease with any of these groups is akin to a commercial junk bond, augmented by the Property. Non performing sites get shuttered so as to obtain new capital for new sites for the benefit of the brand. Infill development is generally less risky than new territory (this can also skew sales data about who the customer is).
Irrespective of customer demand for the Sysco style slop that (many entities) just reheat, such stock values have seen plenty of headwinds from the Wealth Effect. Site costs, permitting costs, construction costs – blown out. Couple this with State min wage law disparity (over FED). Consequently, the pace of Retail development has slowed. SBUX in particular is under pressure related to employee unionization.
That feels like an AI bot spewing nonsense. The only thing AI is good at.
Can mathematics save us, Yes. If they, the mathematicians step up
I can’t imagine buying the stock of ANY individual chain restaurant (other than in some broad market ETF). The sector is way too volatile for my risk profile.
To be clear, this consuption counts towards Services CPI, does it not?
This is complex question.
In the NAICS system, restaurants are part of NAICS code 72 “Accommodation and food services.” Specifically, “food services and drinking places” have NAICS 722 (which is further narrowed down, for example, “restaurants and other eating places” = NAICS code 72251). These are service businesses, and the BLS, which goes by NAICS codes, considers them service businesses as far as its employment data is concerned.
But for CPI purposes, the BLS puts restaurant inflation under food: the CPI for food at home; and the CPI for food away from home.
So in terms of the “core services CPI,” (services minus food and energy), it seems the BLS does not include food services because they’re part of “food” and “food” is excluded from “core” measures.
But food at home should be part of the overall services CPI, so including food and energy services. In my CPI reports, I list the CPI for food away from home under the services CPI categories, not the goods categories.
Sports betting has gone up the Wazoo here in the Swamp. Everyone is betting the NFL, College FB, hockey, etc. They are doing this to get away from the divisive and toxic political and social environment here. They go to sports bars instead of watching TV or going to crappy movies. I’m joining in.
Wow. I’d like to see the numbers for this. Gambling and alcohol compliment each other so well, as does overspending to compensate your mood for losses or celebrate wins. Perhaps the few drinkers left are going strong.
Gambling also has a huge correlation with sexism and domestic violence, and losing is ugly, just what the country needs. The online aspect has been terrible since it started.
Liver failure in young people is prob increasing.
Young people drink liquor like an engine drinks gasoline, little do they know they are killing their liver.
Some die by mid 40s
Just a casual observation of info I hear…
Grain of 🧂
Actually, alcohol consumption by young people is dropping, significantly.
My late 40s nephew died of MASH (Metabolic Syndrome Associated Steatotic Hepatitis. aka Fatty Liver Disease). This and its complications are increasing in younger people and is recognized as an increasing major cause of cirrhosis. This is rapidly increasing in frequency due to obesity. Late clinical trials are ongoing so look for specific new drug treatments as investment opportunities.
A lifestyle economic question is if there are statistics in Gym memberships?
Hey Earl sorry man.
I’m a member of one.
Try to get my 150 minutes a week, but life is really busy.
Newest gym in Raleigh just opened up $379 a month for 2 people! People have crazy money or they spend like they do.
Lol
I see the surge in gambling as completely symptomatic and integral to the current “toxic political and social environment.” Maybe it’s a regional thing. I don’t do anything that calls itself gambling, or spectating at sports. I buy my “tickets” or chips as stocks in the platforms that provide that.
Gotta make up for those falling alcohol sales somewhere!
Maybe it’s that I’m a bad restaurateur or that I’m in Chicago, but I’ve found that upper income diners and corporate expense accounts are where the sales growth is. I’m my more casual and family driven establishments, despite being geared a bit more towards upper income families, sales have still not recovered (not even close) to their pre pandemic sales.
I had always thought that food accounted for 10-11% of people’s spending… does the increase reflect inflation and where are they spending a smaller percentage of their income than in the old days?
Maybe you should open a restaurant in San Francisco? Popular restaurants are full of young people having a good time.
in terms of the food budget… “retail sales,” which is what we’re talking about here, is only a small-ish part of consumer spending. The majority of consumer spending goes to services (housing, insurance, healthcare, streaming, utilities, etc.) So the percentage here of food services and drinking places = 14% of RETAIL SALES, not of consumer spending. Sales at food and beverage stores is another 12% of RETAIL SALES, not total consumer spending.
SF home of the tech industry and successfull wolf world wide economic content ! Glad to see the money is recirculating. Otherwise people would not be having fun!
This is one part of current economics that I maintain you can see with your eyes every time you go out. Both eating and drinking spots are absolutely packed now. On weekends, if you want to eat out, you’d better go early.
This goes for everything from fast food all the way up to expensive and classy places.
Yes, that’s our experience too.
I went recently on a Saturday , got to the place later than usual. I like to go about 5-5:30 just get in before the crowd.
Surprisingly got a table at about 7:30-8 pm, not many crowds at all.
The restaurant had one of those “how long is the wait” web links, and it reflected correctly that there was no wait.
Broad note – from $85B combined food spend in 2008…to $185B combined food spend in 2025.
Says something (not 100% sure what) about Fed forced inflation, the failure of technology to disseminate productive efficiency and cost competition, and the dangerous spiraling of the American macro economy.
I wonder what combined food spend was in 1991…Idk that it was 38B…kinda puts all those 2002 “deflation is the absolute devil” articles into their proper perspective…
No, the food spend you list is PER MONTH, not per year. As I pointed out in paragraph #2: over the past 12 months, spending at food services and drinking places = $1.16 TRILLION. And spending in food and beverage stores over the past 12 months was $1.00 Trillion (not mentioned). For a combined $2.16 trillion in the 12-month period.
Wolf, is ordering takeout for delivery (DoorDash, Uber Eats, etc.) counted in the “restaurants and bars” category? Or is that under “e-commerce”?
If you order online, it’s ecommerce.
Food services means that the food is prepared for immediate consumption, such as on premise or in the car on the way home.
The distinctions can get tricky for a small number of purchases, and so they don’t matter because they don’t move the needle.
So just happened my son called while I was reading this article. He eats out all the time. Said $100 bill for family, wife and 2 young kids. Easily 3 x a week. Then there is his lunches out probably every day.
But he said that is his enjoyment and entertainment.
He quickly turned the conversation to his health insurance. He has the Christian one, $450 a month premium. $17000 deductible.
Much better than the $8000 premium he was paying and the $15000 premium he was paying before the current plan. I told him to check Obamacare and get back to me.
Oh geez what a moron.
In what world does someone see a 17,000$ deductible as better?
If he has a bad medical year, that’s going to be an extra 10k out of his pocket.
Edit:
Nevermind, misread your post. 17,000 does seem high though.
Does he think it is actually good insurance?
Sounds suspect
He will rant about the cost of insurance for an hour. His healthcare insurance he says is better than he can get on Obamacare.
He said his workman comp company just sent him a 14,000 increase for the last quarter. His homeowners has doubled and his car insurance is through the roof, since he has 6 or 7 vehicles. Tens of thousands of dollars for a small family business owner.
He owns 2 successful businesses and can handle the deductible in an emergency. If he gets by with a couple of years less the high premiums of other insurance, he’s ahead.
Well it’s when you get in a car wreck…
Let’s see the trauma team costs $50k
Ortho surgeon 25k
Drugs while hospitalized 10k
Later surgeries 50k
ICU? Crazy money
Neuro surgeon: just sell your house
Cardio thoracic: buy him a ski lodge.
Good insurance covers all that over like say $8,000. Medicare would pay those docs ALL day.
Waitresses can earn more money than truck drivers. They and their family can eat at restaurants expenses. 18%/ 20% tips are for free. They offer a second drink when the first one is still half full. Options and cakes cost more. During lunchtime office workers herd together, completing with each others. Waiters click between 4 and 20 c/c in each table. Boomers on walkers are depress. Lunch and dinner sap their energy. It’s either energy to process junk food or energy for depression. Junk food cure their depression. But the cost is too high, service is bad, and their cash flow is drying. Restaurants and are squeezed by the cost of food, labor, interest, rates, utility, insurance, penalties and and capex.
My baby boomer friend eats out 15 meals or more a week. Widower. I have seen others similar in my ear Texas town . They enjoy the food and the experience though they pay about 15 a meal including tips. I’m thrilled to see this type of economic expansion ! Very healthy and valuable
Well I agree that a young healthy person ( robot) can perform physical tasks quicker than the ancient human that had become obsolete, naturally.
We were stuck in Minneapolis overnight, due to whatever issues are still plaguing air travel.
We were given $12 food vouchers, and our meal at the hotel was over $100 for 2 of us. Burgers everywhere seem to regularly be over $20. There is no way to eat out without splurging. It’s just really expensive. We used to eat out twice a week, but now eat out about once every two months.
In the Minneapolis metro, they’re generally below $20 at the places I frequent, but they have gotten a good deal pricier in recent years. I had burger and fries tonight for $17 but the restaurant ones are generally good for 2 meals. Portion size seems to be generally huge around here.
I love when they cancel your plane at the end of the day for no good reason.
Oh great now I’m on a shuttle bus twice and have to do security again to wind up right back in this very spot I’m in right now.
We haven’t had bad economic times in the US for almost 20 years.
Solution, sit on a Walmart bench for a while It is free. Talk to the first person who sits down next to you. Laugh s lot, great fun
The problem is that the food is bad. Too much salt too begin with.
The last thing I think would be worth it is to go out to dinner. Yuck !
Some of the increase is probably related to restaurant food delivery to the home, which sky rocketed in 2020 and continues.
So, are they going out to have fun or watching screens at home?
Ordering and have it delivered to the home is under ecommerce, not under “food services and drinking places.” These are “places” where you go to eat and drink.
You can see that because during the pandemic, sales at “food services and drinking places” collapsed, while ecommerce sales spiked.
I think what this data suggests is that the correlation between consumer confidence and *some* metrics of discretionary spending are weaker than you’d otherwise suspect. Americans love to complain – but can’t seem to break spending habits unless absolutely necessary. This likely underscores the importance of the unemployment rate – until scores of people begin losing jobs, expect Americans to continue spending every last dollar.
Absolutely. This country needs a crippling depression with at least 25% unemployment to bring people to their senses.
Well, at least in a micro sense, excessive spending tends to self correct – to paraphrase the old political saying “Sooner or later you run out of other people’s money”, “Sooner or later you run out of your *own* money.”
We would just wind up right back here again.
Sometimes spikes like we are in or say the dot com heights of depravity, they are just showing you the future.
Maybe 5,7,10 years? We will be right back here again.
“NEED” is a strong word.
Just like people who say we need another Revolutionary or Civil War.
Super easy to say…far, far less easy to live.
Most of the big talkers, saying big stuff on the internet, while lounging on the sofa in their house, would most likely be very sad in a “crippling” situation such as that.
Be careful what you wish for…
You just might get it…
and regret it….
No do overs.
Americans love to complain – DJT’s MAGA fighting against their own interests for the benefit of a wanna be despot.
Getting their information from FOX news, sometimes referred to as the misinformation channel owned by the billionaire, Australian, tabloid king,
A distasteful, poisonous wad to be immediately spat upon the ground.
It’s getting expensive to go out to dinner. Luckily for the restaurant industry we like to eat out and i I am lazy. Thanksgiving family dinner in American may result in behavioral economics shift from the want to be crypto millionaire to selling after their family shares their opinions on falling crypto that really doesn’t offer anything functional except money laundering for criminals and a vehicle to trade value. Crypto carnage Friday? To make Googl close red for the week? JP Morgan came out with SP 500 7500 26 call, Tom Lee is calling 200k BTC by year end. new Fed chairman announcement before Christmas? flooded the zone with bullish news to feed the buy algorithm during a historic low volume holiday week. Bulls appear to be charging and in control. Will there be cliff ahead of them?
Happy Thanksgiving! I am unplugging for the holiday. May we know gratitude and love!!
Well there seems that there is an abundance of former crypto millionaires,
There is no way to explain the current price of the stock market other than the greater fool theorem.
“ Hyperliquid has activated its cross-margin auto-deleveraging (ADL) system for the first time, introducing a new mechanism to maintain market stability”~ this happened after Thanksgiving dinner! Essentially insolvent put crypto sellers are at risk of bankruptcy if selling continues and the clearinghouse hyperliquid doesn’t want to be on the hook for paying out after their insurance policy is gone . So they cancel the contracts if needed. You imagine if sellers of CDS on Oracle bonds get let off the hook because the clearinghouse can’t cover the payout for the defaulting counterparty? We may find out! Weapons of mass financial destruction! Warren buffet retired at the right time. He can watch it all from his laptop sitting in his lazy boy, no one will call this time for help.
I love going out to eat a couple times a week. But, you have to be smart and find good restaurants with good specials/happy hour. Otherwise you will get slammed with a triple digit bill every time.
Affordable mom-and-pop restaurants are the new staycation. Cheap to get to. Easy to keep spending under control.
Wolf, You rejected my comment. I am one of your monthly donors
Social justice warrior stuff. I get this at every article now, lots of it. Didn’t used to. This clickbait garbage is circulating around the internet, and everyone is throwing it around everywhere. I have wasted way too many hours shooting it down. I’m done with it. People never read my replies, then the same nonsense shows up over and over and over again because this clickbait is circulating virally round the internet and people just love spreading it. Life is too short.
1. IT DOES NOT MATTER FOR THE ECONOMY WHO DOES THE SPENDING.
2. Restaurants span the spectrum, from low end to very expensive. There is something for everyone.
Well said, Wolf…bravo!!
Economics aggregates hide problems across the income and wealth distributions — they’re “externalities” to economists but they are real social problems which have real costs in human terms. It’s all fun and games until they spill over into your political landscape. Ignoring them is not a solution.
Mark Blyth’s “Angrynomics” is a useful examination of the problem.
That’s Social Justice Warrior stuff. You need to go to a Social Justice Warrior website to post this stuff. Like war-mongers need to a war-mongering website to post their stuff. But you can post anything on X.
Wolf, there’s a reason that the field was originally called “political economics” before the marginalists got their way in the academy. All around the western world we are increasingly getting object lessons in why it remains political economy (both in geopolitical fracture and in domestic political polarization).
But I respect your point about purpose of your website and despite my concerns about what economic aggregates miss, I value the data you provide us — too much economic discourse in the press fails in this regard.
There’s something for everyone: Try fast food kingpin McDonalds on the low end. Order from a Kiosk.
McDonald’s Price Increases from 2019 to 2024:
Medium French Fry $1.79 -> $4.19
McChicken $1.29 -> $3.89
Big Mac $3.99 -> $7.49
10 McNuggets $4.49 -> $7.58
Cheeseburger $1.00 -> $3.15
For a family of 4 expect to pay over $70
Well, what do you expect? A soup kitchen?
What about that Campbell’s Soup executive this week, “we sell slop to poor people.”
Just so you know Wolf, I scroll to your comments and skip the rest. That’s where the all the good learning is…. Thanks for what you do.
Keep your comments focused on stiffing waiters and you’ll be fine.
As number of kids per couple come down, the couples spend more and save less for inheritance and education.
a byproduct of low birth rates and less education and daycare costs?
Anecdotally, my friends with kids tell me daycare costs are insane right now.
Younger generations seem to value spending on experiences more than older generations. I have also heard the “I’ll never afford a house so might as well go out” rationale, again anecdotally.
I rarely eat out but when I do go to places I like/know(Medway Cafe/Lotus House)both have great food and the portions are large,even with a big appetite always have a doggie bag!
I with (decent)tip for two usually drop 50-60 bucks,do not buy booze there/drink strictly at home excepting concerts/parties.
I have always been this way as even with higher prices can usually eat for meself on 50-60 bucks a week,do buy in bulk/1/4 cow ect.
Shift from things to experiences for quality of life value has been a trend for a while, this could reflect (and be made possible by) that shift in spending.
Also agree with Wolf: the competition and churn has left Friday’s in the dust, now more fast casual format, quality food, appealing places to hang options. And easier/better pick up take out options.
As a European, it’s always fascinating to read those comments which refer to tipping in the US. It is generally inconceivable to Europeans that someone paying dinner for two would leave a tip of between “50-60 bucks” (see James 1911 above). We can eat out very nicely for that amount of tip!! It seems tipping is not a disincentive to eat out in the US.
John,the tip was part of the whole money amount/total with tip.
Thank you for clarifying. My misunderstanding completely.
John,I will add also,have not gone out to eat in about 6 months,considering the rise in general and especially beef costs feel I am in for a new price awakening,that said,as a treat occasionally will still do it.
That said,feel I may be in for a rude awakening,but,even so as a treat will still do it.
On a side note ,the onion rings at Cafe are so killer that will draw me in,have tried multiple times and still cannot make anything taste/quality close…..yet!
John,
“…would leave a tip of between “50-60 bucks” (see James 1911 above)”
You misread James 1911’s comment. This is what he said:
“I with (decent)tip for two usually drop 50-60 bucks,”
He is saying that the total dinner, including tip, costs him 50-60 bucks. So if food and drink = $45 + 20% tip ($9) = $54 plus sales tax (depending on where he is). About the same as you pay.
Darden market cap: $21B. Cheesecake factory: $2.7B. Brinker: $6B.
Chipotle: $45B. Sweet green: $0.8B and Texas Roadhouse: $12B. Restaurants are small caps. Their junk food kill us big tine. IWM – the regional banks and restaurants – popped up above Oct 31(c). The weekly BU flips up. IWM triple shots, early in 2026, before rising in Nov 2026, after a correction. Thereafter a plunge, before popping up for the Nov 2028 election, lifted by infantile robots and AI, financed by regional banks.
Red Lobster = $0
Dead Lobster
Miami restaurant with $1,000 steak reopens with bang…
Just in time for the holiday season, Papi Steak is back to popping bottles once again.
The popular South Beach clubstaurant owned by buddies David Grutman and David Einhorn shut temporarily in September, and just re-opened its doors after an extensive glow-up.
Still on the menu are the fabulous entrees, including the famed $1,000 Australian wagyu 55-ounce Tomahawk served in a lit-up briefcase (”beefcase”) by sparkler-waving, white-gloved servers.
Not all of your followers can afford to eat at those places.
A Federal Reserve stat is that about 40 % of Americans would have difficulty covering an unexpected $ 400 bill. Depending on methodology other surveys have it at 37%.
This is a lie. This is why I normally delete these idiocy clickbait bullshit comments, because people don’t like it when I say that these lies are spread by morons that cannot read anything but stupid-ass headlines.
The Federal Reserve doesn’t say that at all. Here is what the Federal Reserve actually says. READ IT:
My Title: “Americans’ Ability to Pay for Emergency Expenses or Three-Month Job Loss with Cash/Cash Equivalent, by Selling Assets, by Borrowing, or Not at All:
My subtitle: “54% have three months of expenses set aside in their account. But 13% can’t pay for a $400 emergency expense.”
https://wolfstreet.com/2023/05/27/americans-ability-to-pay-for-emergency-expenses-or-three-month-job-loss-with-cash-or-cash-equivalent-by-selling-assets-by-borrowing-or-not-at-all/
Happy Thanksgiving Wolf and all the community. Great wrap up article on retail sales. Nice perspective into the holiday.
A fellow retiree I know makes $2500-3000 a month selling covered call options on his stock holdings. About 2‰/mo on his portfolio. 25%/yr. The profits come from the pockets of the gamblers trying to win by buying the calls, which expire worthless 70% of the time. And even when they don’t, he still usually sells the shares at a profit. And then buys them back on the next dip, and repeats.
As decades of Fed holding interest rates negative post-inflation has created an economy in which financial system and employment will collapse without low rates, we see that despite inflation being well above the supposed 2‰ target rate, we’re headed for yet another rate cut in a few weeks, merely because unemployment looks to rise a little above its current historically low level.
So selling covered calls is effectively a sure thing.
As 2022 showed us, stock market declines can only be transitory, prices are certain to soon recover to new nosebleed highs. So that fellow feels quite comfortable eating out and traveling, and paying high RE taxes on multiple homes.
And he’s not the only person like this I know.
Thanks to decades of Fed ZIRP and NIRP, many boomers have stock portfolios over $1 million, and expect 20+%/yr returns to continue forever.
“has created an economy in which financial system and employment will collapse without low rates”
This.
“Thanks to decades of Fed ZIRP and NIRP, many boomers have stock portfolios over $1 million, and expect 20+%/yr returns to continue forever.”
1) At 40 PE ratios, a 60% collapse would take Indexers down to…the pre- ZIRP historical average. Tap dancing on ever thinner ice.
2) ZIRP destroys a currency in the long run, because it destroys it as a store of value in the long run. In the modern world, it is too easy to hold interests in real assets (that can’t be printed/diluted) or Yuan (backed by a macro economy that has been growing 2-4 times the US rate for 20-25 years) or any number of other assets that cannot be diluted at will by a government that hasn’t balanced a budget in over 50 years. There is a lot of ruin in a country…but not an infinite amount.
Hahaha the options market a sure thing?
Right.
They call the options market a betting market for a reason.
It’s amazing, but also amazingly risky.
Did you know when it was invented, no one except the founding members even understood it? They had to come to Wall Street and explain it over and over again.
Read the history of it by Peter Bernstein, fascinating stuff.
There’s a very big difference between selling covered calls and selling naked calls or buying calls. The former is more conservative than just owning the stock. It’s the latter two that are risky, and money-losing on average. The former wins the money lost by the latter two strategies. It even provides _some_ protection against decline in the stock — at the same time it forgoes some of the profit if the stock goes up a lot.
I made 80K last year in my IRA doing this very strategy along with selling cash covered puts on a little over one milllion in assets (fidelity allows option trading in IRAs). After taxes, that and our SS pays most of our expenses.
The odds are better than Las Vegas.
Too risky for the vast majority of older folks to be swimming with wall street sharks with potential high care costs not far down the road.
There are some covered call funds out there paying 10+% annual dividends. Just buy and hold (and possibly reinvest).
NB; not investment advice.
Diner for two: 2 x salads, filet Mignon, Salmon, 2 x Pinot, Creme Brulee, a chocolate cake, taxes, plus $40 tips = $225.
I would think Pholove in Milpitas has a lot of empty tables. Lol
Viral meat throwing video: Milpitas restaurant passes inspection and can reopen
The reason people are in a sour mood is the inflation in basic living costs.
Example
McDonald’s Price Increases from 2019 to 2024:
Medium French Fry $1.79 -> $4.19
McChicken $1.29 -> $3.89
Big Mac $3.99 -> $7.49
10 McNuggets $4.49 -> $7.58
Cheeseburger $1.00 -> $3.15
Some of this is over a 200% increase in price. This isn’t inflation — it’s legalized robbery.
But we only have 2% inflation according to the BS from the government
The US government said yesterday that affordability is simply a figment of people’s imagination.
“This isn’t inflation — it’s legalized robbery.”
No one is forcing you to eat at McDonalds.
It’s the inflation that’s killing us. If the fed would simply stop roaching me dollar, prices may come in for a bit, and 3 tacos wouldn’t cost 11 bucks give or take. But nope. Never. My papi always said; ‘son pay attention to what they do, not what they say’. For actions speak louder than words!
if ifs and buts were candy and nuts, we’d all always all be having a merry Christmas. Better tighten your belts my mindless sheeple minions. Warp speed inflation approaches. Got gold?
Gold is the epitome of nonsensical inflation due to manic speculation.
Happy thanksgiving everyone! Thank you Wolf for your wonderful work.
Went to a Mexican place recently in California – nothing fancy at all. One of those places that has a drive-up window to take food with you (you can also eat inside, if you wish). A “super” burrito was $17, and it was nothing out of the ordinary. I almost fainted when I saw the price. (My friend bought that). Crazy times.
I’m pretty surprised by how much people spend eating out. To me, buying basic groceries to prepare at home is a good way to partially counter pricey rents, and save a little more for a house down payment. I was thinking the discretionary sectors like restaurants, auto makers, pro sports, would be not so happy with the real estate industry and the govt for pushing down rates making people spend a lot on housing, but so far doesnt seem to be the case. But maybe if deficit spending was reduced, or inflation went higher people might have less discretionary money? Was wondering how discretionary businesses did in countries with persistent high inflation.
Two senior coffees cost between: $1.89 and $2.53 in my area. The boomers peaked between 1958 and 1961. The 1961/62 recession slowed their birth rate down. Add 65Y to 1958/61: between 2023 and 2026 most boomers are out of the labor force. Doctors, dentists, healthcare, pharma and millions of pushy waitresses feast on them, depleting them. Boomers feed the labor force. Continued claims are up from 1.8M in Oct 2023 to 1.9M in Oct 2025. Chronically unemployed, unemployed 27+ weeks, are up from 1.6M to 1.8M Y/Y. Both are rising moderately. During recessions both spike, creating a huge bubble. They might, but they didn’t. Cont claims can be in a trading range for years. JP may cut rates twice in Dec and Jan to prevent recession and to ease gov debt payments. In order to rise SPX needs a backbone (BB). SPX last BB was Sept 16/17: 6,627/6,551. Nov 10 red bar breached it. On Nov 20 wall street gangs used NVDA as a lever to drop below it, a lower low, a huge red bar on about the same vol, for a spring. SPX might a jump ==> either for an UT before distribution, or BU before moving higher. [1D] RSI in a bearish territory.
Happy Thanksgiving all!
Hope you are with family /friends(if you want to be!).
Happy Thanksgiving!
“Despite their Ultra-Sour Mood, Americans Splurge at Restaurants & Bars like There’s No Tomorrow”
In fact, so many of them arrive at the age of 63 realizing it’s impossible to retire comfortably. Very sad and … too late.
I am curious how the actual bulk of food consumed (say perhaps by caloric volume) at home vs in restaurants maps onto the chart of spending at grocery stores vs restaurants over time above. Controlled for population it would reveal at least the extent to which this is a price artefact as opposed to a behavioural one.
Nonsense. Restaurant meals are BY DEFINITION more expensive than home-cooked meals. People go to restaurants because they WANT to. They’re buying a SERVICE, not calories.
In terms of price changes at restaurants and grocery stores, I gave you those in the article. RTGDFA
Well, yes, I understand that there’s a delta between the two. What I was wondering was whether or not there is any evidence that the volumes consumed also changed in accordance with the price changes. I didn’t see that in TGDFA.
Why does the volume matter at all? What insight does that give us? It’s a service, as Wolf pointed out. Some people will choose high calorie, high volume meals, but in the end if you only care about using calories efficiently, you’re shopping and eating at home.