Home prices fell YoY in 20 of our 33 metros: Tampa, Austin, Miami, San Diego, San Jose, San Francisco, San Antonio, Dallas, Phoenix, Orlando, Atlanta, Denver, Raleigh, Houston, Seattle… Some still up YoY: Boston, Chicago, New York, Philadelphia…
By Wolf Richter for WOLF STREET.
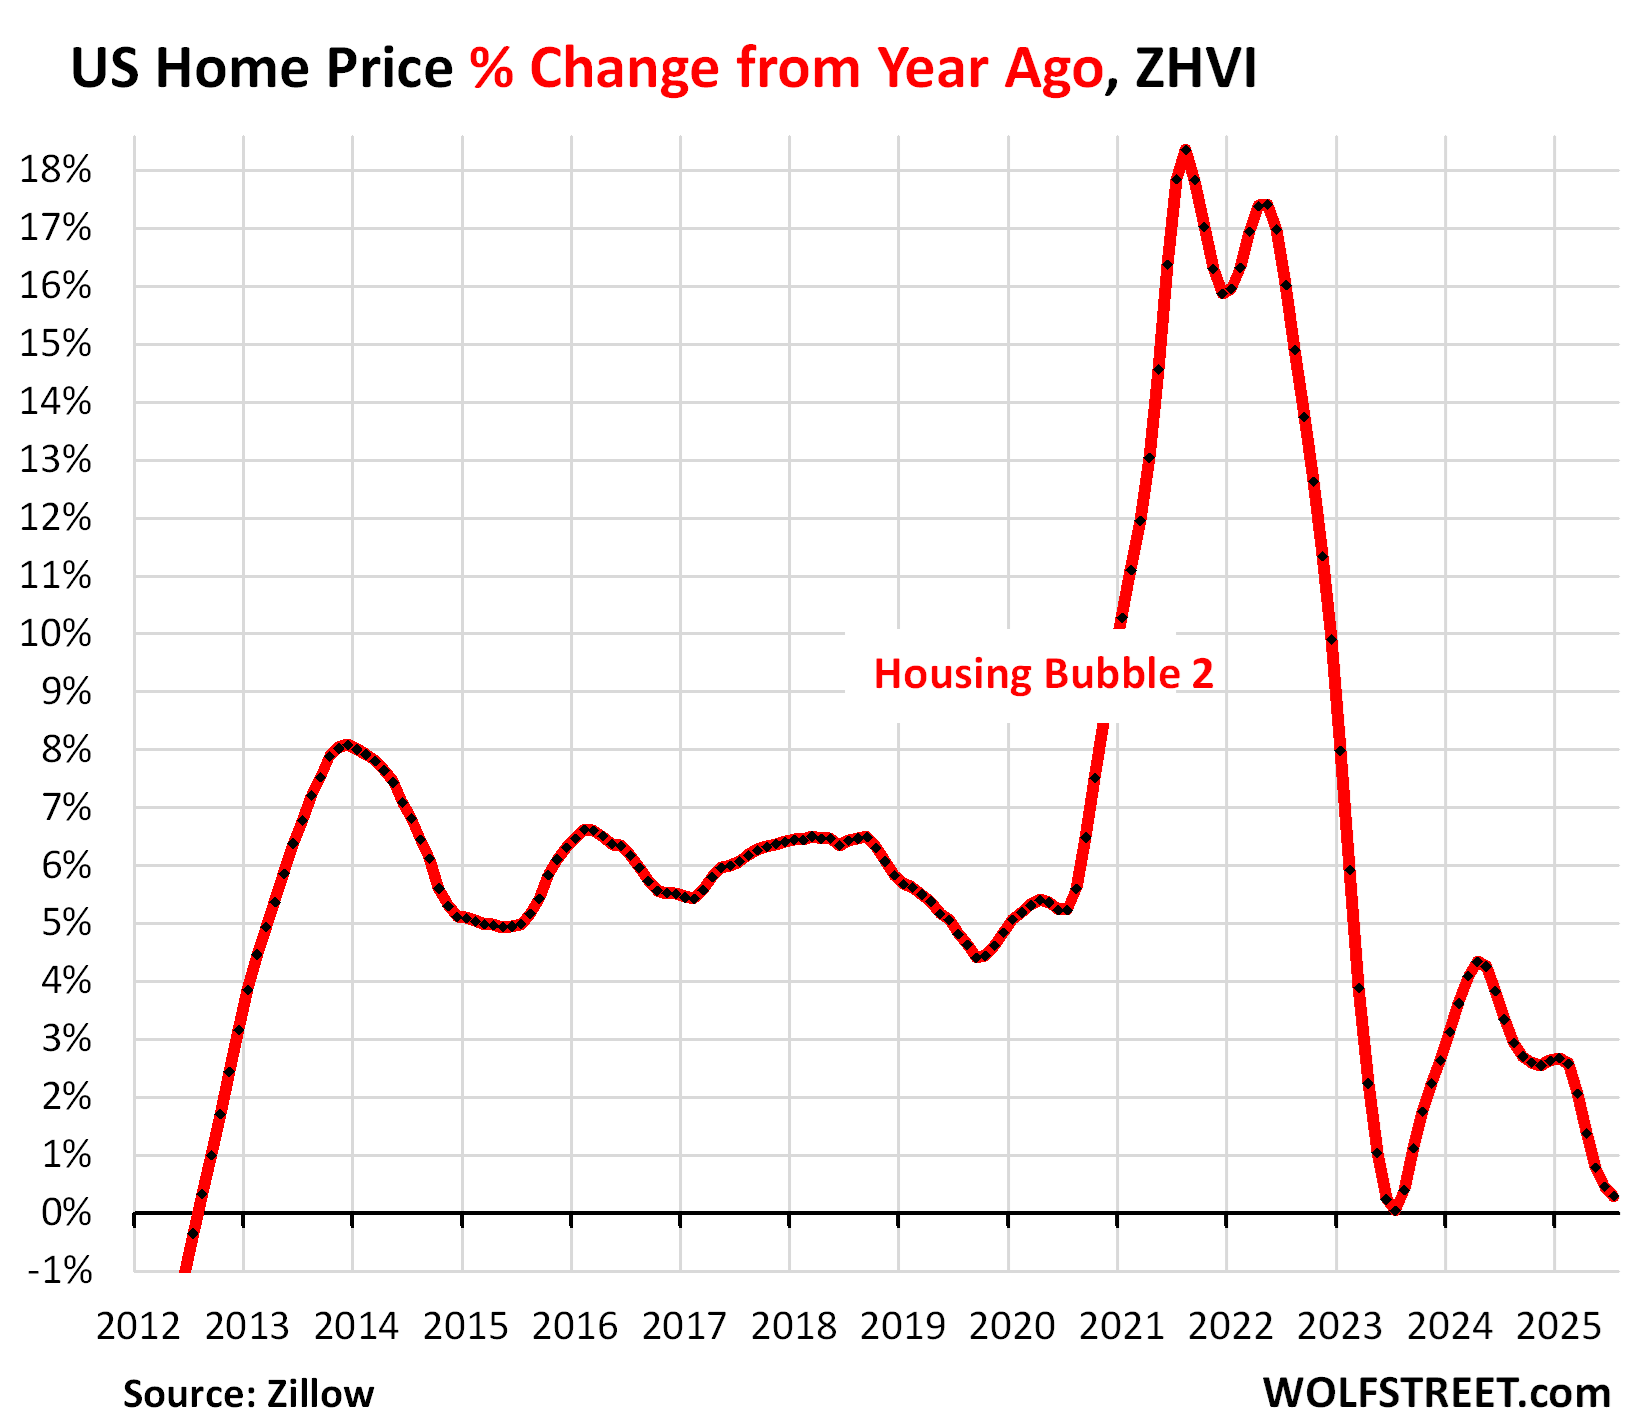
Prices of mid-tier single-family homes, condos, and co-ops in the US inched up 0.29% year-over-year in July, the smallest year-over-year growth since June 2023, and the second-smallest since the Housing Bust.
The year-over-year price gains started losing steam in April 2024, after the spurt in 2023 through early 2024:
But prices moved in different directions among the 33 largest and most expensive metropolitan statistical areas (MSAs) that we track here: 20 had year-over-year declines in July, up from 6 at the end of 2024. And in 19 of our 33 metros, prices were down from their peak in 2022.
The 20 of 33 metros with year-over-year price declines:
As before, metros in Florida and Texas occupied the top 5 spots on the list of the year-over-year drops among our 33 metros.
Year-over-year declines in July:
- Tampa: -5.7%
- Austin: -5.7%
- Miami: -3.7%
- Orlando: -3.6%
- Dallas: -3.6%
- Phoenix: -3.5%
- San Francisco: -3.3%
- San Antonio: -3.3%
- Atlanta: -2.8%
- San Diego: -2.2%
- Denver: -2.2%
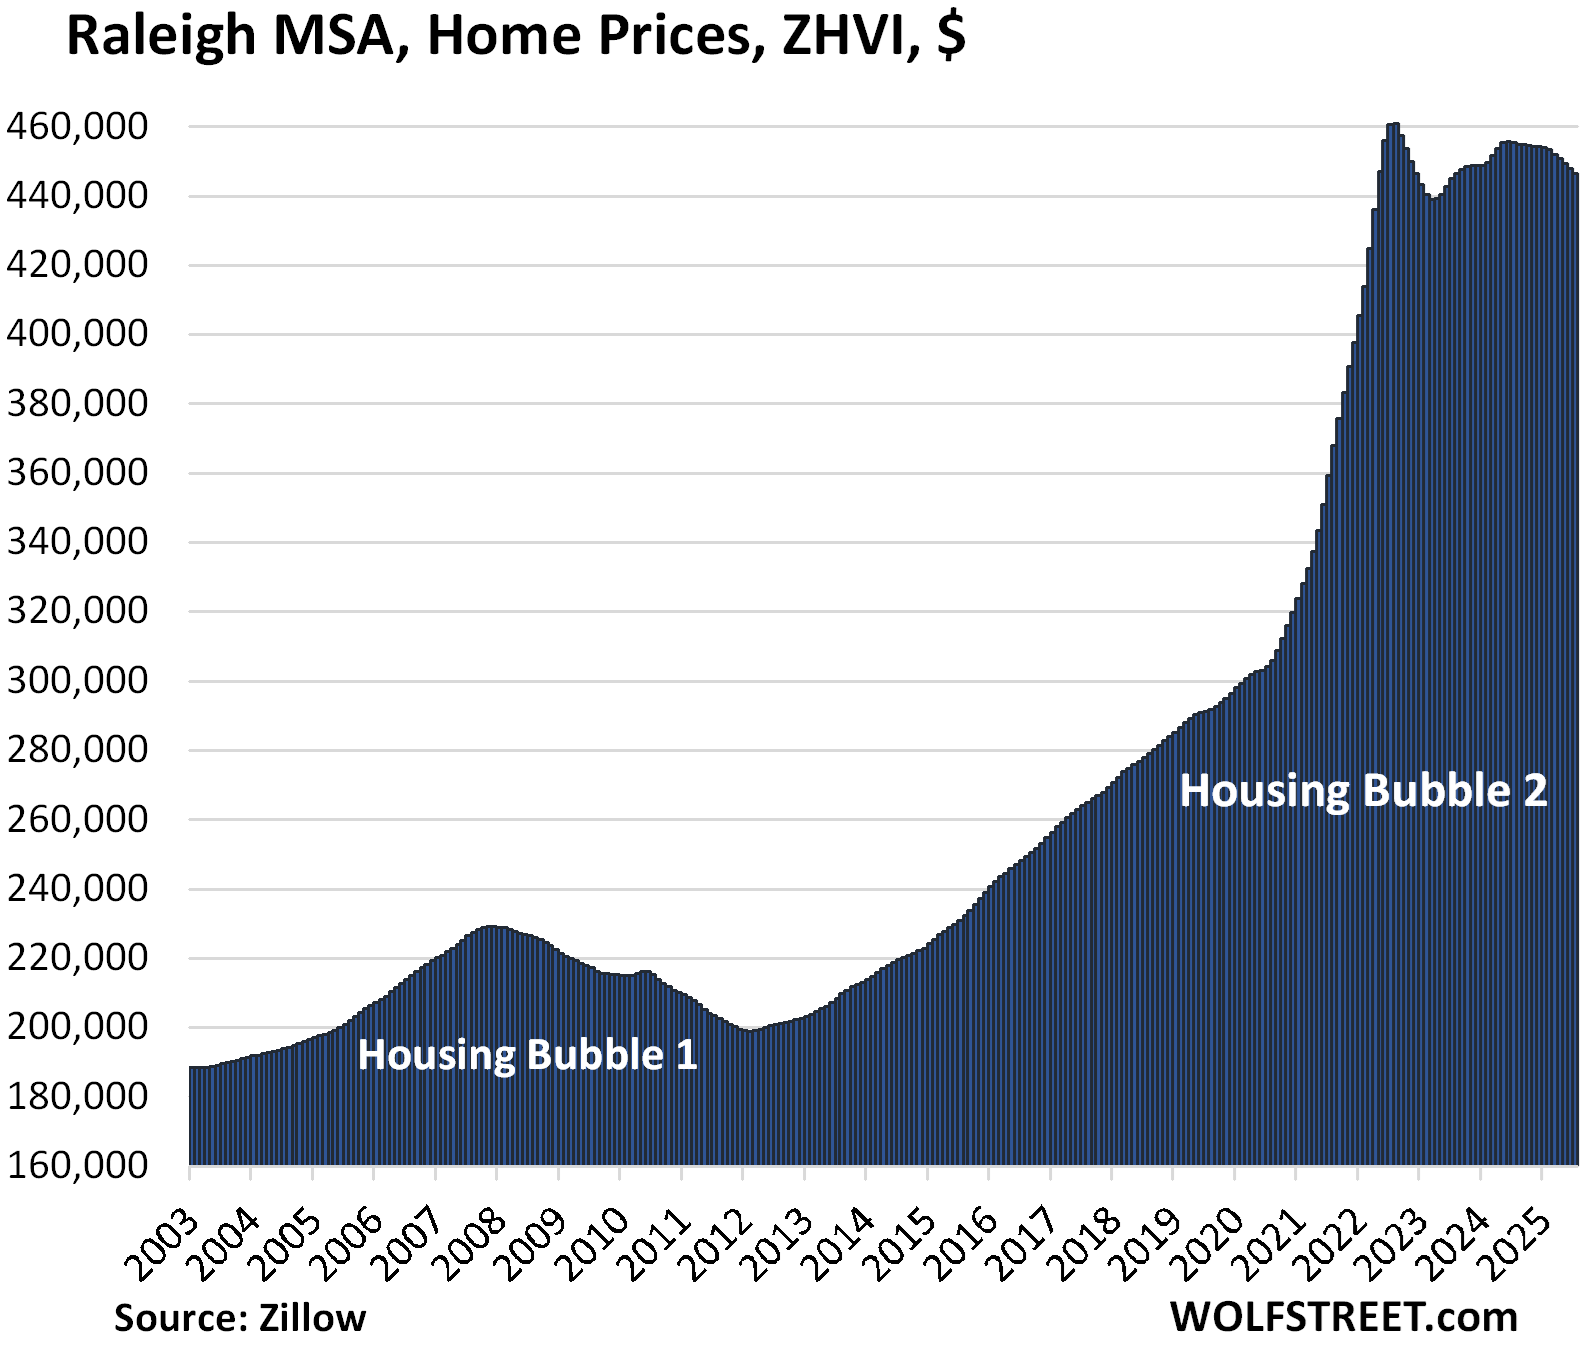
- Raleigh: -2.0%
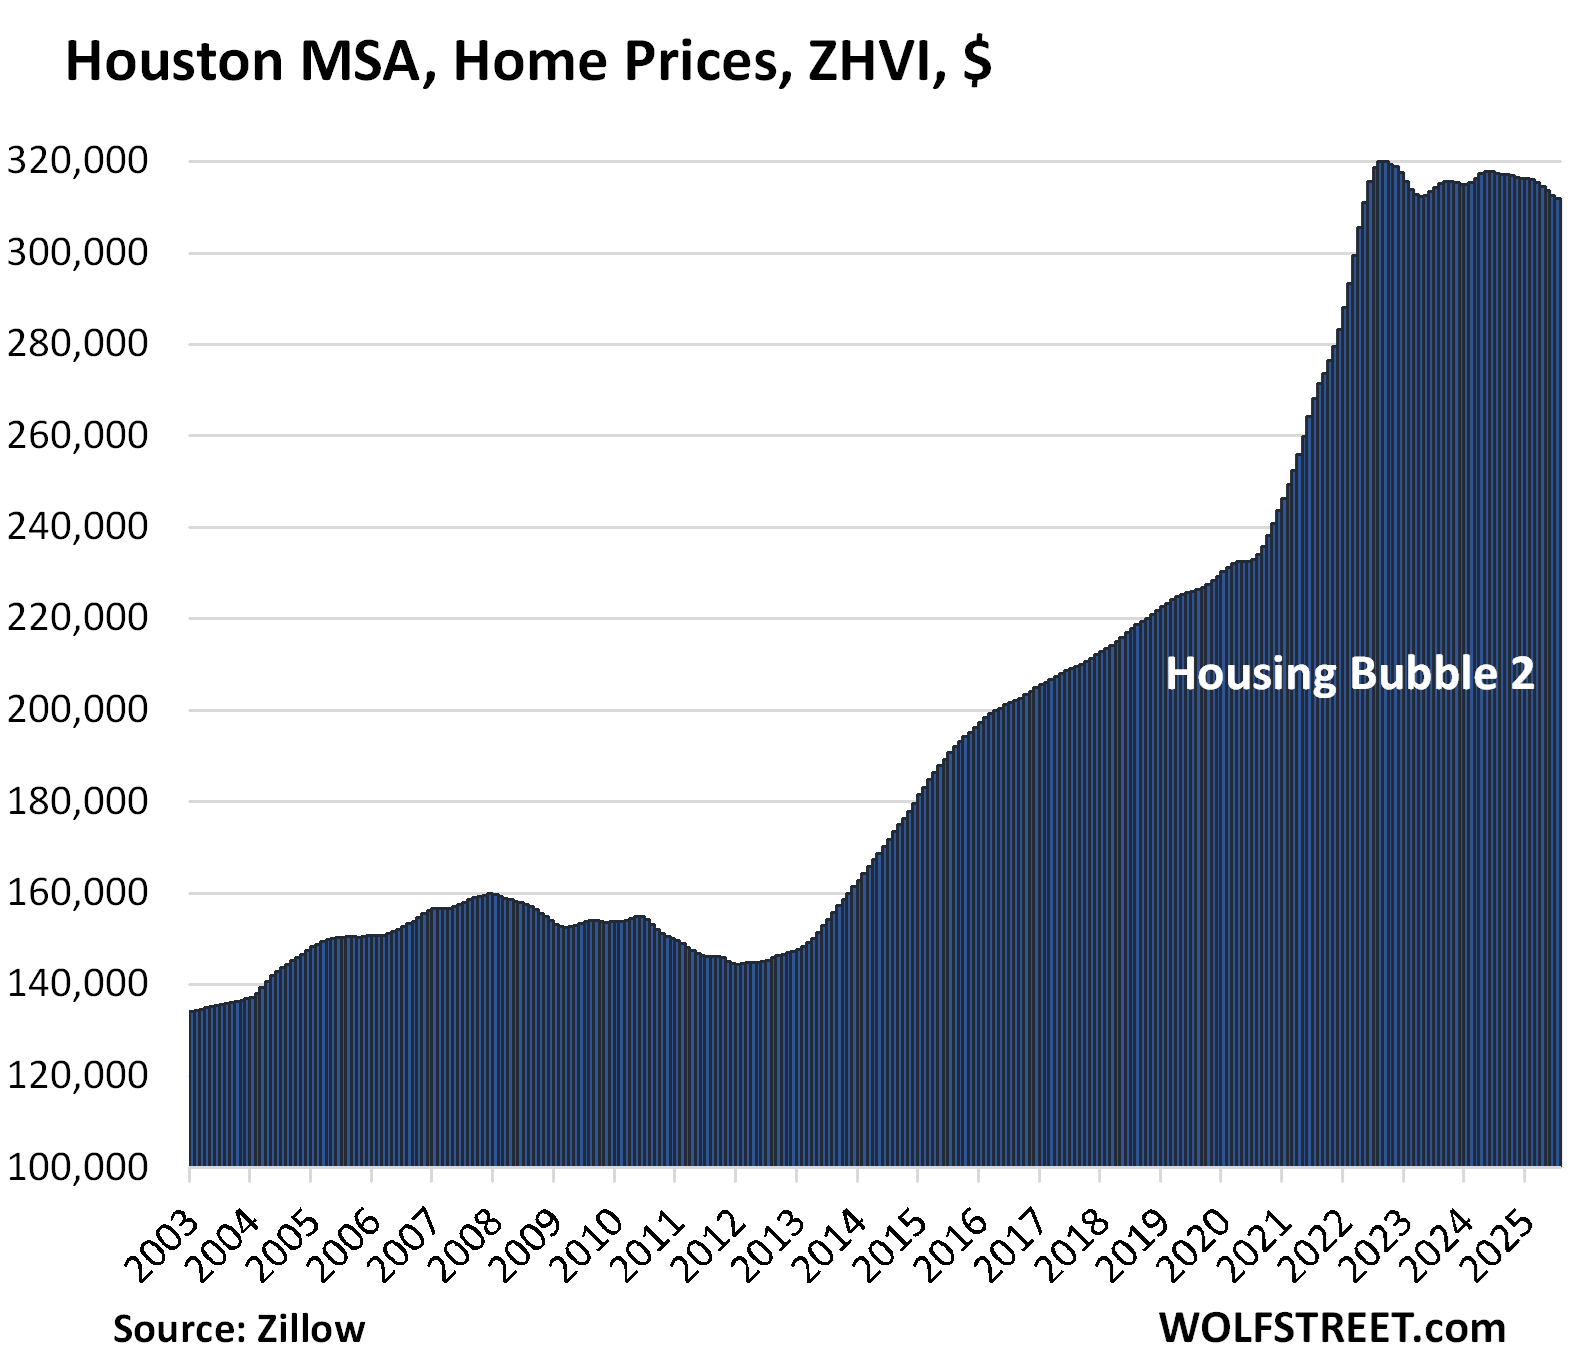
- Houston: -1.8%
- Sacramento: -1.7%
- Honolulu: -1.7%
- Charlotte: -0.9%
- San Jose: -0.6%
- Portland: -0.6%
- Seattle: -0.3%
- Nashville: -0.1%
Prices are declining in many markets because demand has plunged while supply has surged across the US. Here is the US as a whole: Single-Family Home Sales Drop Below 1995, Supply Highest since 2016. Condo Sales at Low in the Data, Supply at Housing Bust Level. Below, we’re looking at 33 large and expensive metros.
The 19 metros whose prices are down from their 2022 highs.
Led by these metros with percentage declines from their highs in 2022:
- Austin: -22.8%
- San Francisco: -10.1%
- Phoenix: -9.0%
- San Antonio: -8.0%
- Denver: -7.0%
- Sacramento: -6.7%
- Tampa: -5.3%
- Honolulu: -5.2%
- Dallas: -5.0%
- Portland: -4.7%
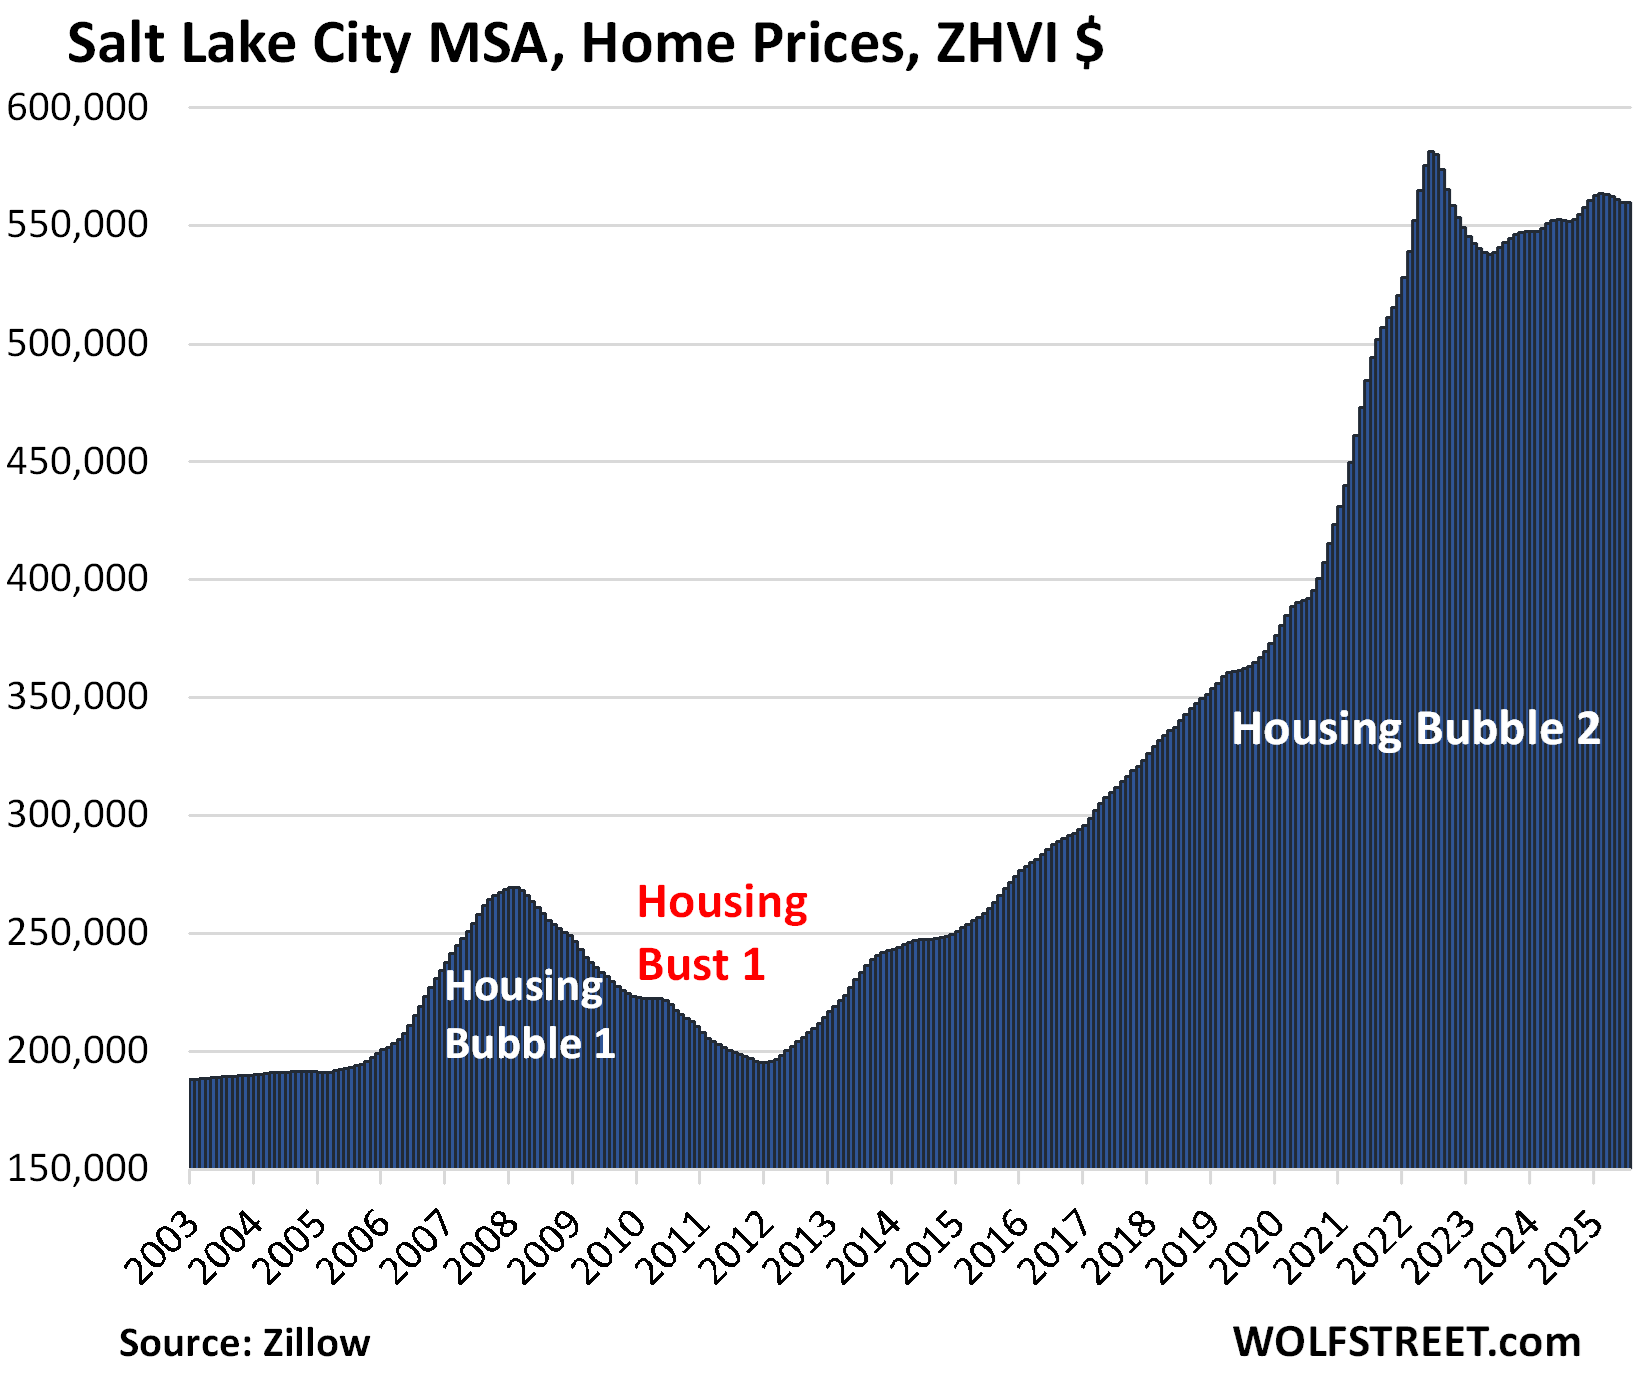
- Salt Lake City: -3.7%
- Seattle: -3.3%
- Raleigh: -2.1%
Methodology: All data here is from the seasonally adjusted three-month-average mid-tier Zillow Home Value Index (ZHVI), released today. The ZHVI is based on millions of data points in Zillow’s “Database of All Homes,” including from public records (tax data), MLS, brokerages, local Realtor Associations, real-estate agents, and households across the US. It includes pricing data for off-market deals and for-sale-by-owner deals. Zillow’s Database of All Homes also has sales-pairs data.
To qualify for this list, the MSA must be one of the largest by population and must have had a ZHVI of at least $300,000 at some point. Some metros that are large enough don’t qualify for this list because their ZHVI has never reached $300,000, despite the blistering surge of home prices in recent years, such as the metros of New Orleans, Memphis, Oklahoma City, Tulsa, Cincinnati, and Pittsburgh.
In the little tables, MoM = month over month; YoY = year-over-year. Also note in the two columns furthest to the right, the percentage increase “since 2000” and the percentage increase over the 2.5 years from “Jan 2020 to Jun 2022”.
| Austin MSA, Home Prices | ||||
| From Jun 2022 peak | MoM | YoY | Since 2000 | Jan 2020 – Jun 2022 |
| -22.8% | -0.8% | -5.7% | 150% | 73% |
From January 2020 through June 2022, in those 2.5 years, prices exploded by 73%. This price explosion and charts like these document the absurdity that the housing markets had become under the Fed’s reckless monetary policy until 2022, that have been getting unwound since mid-2022.
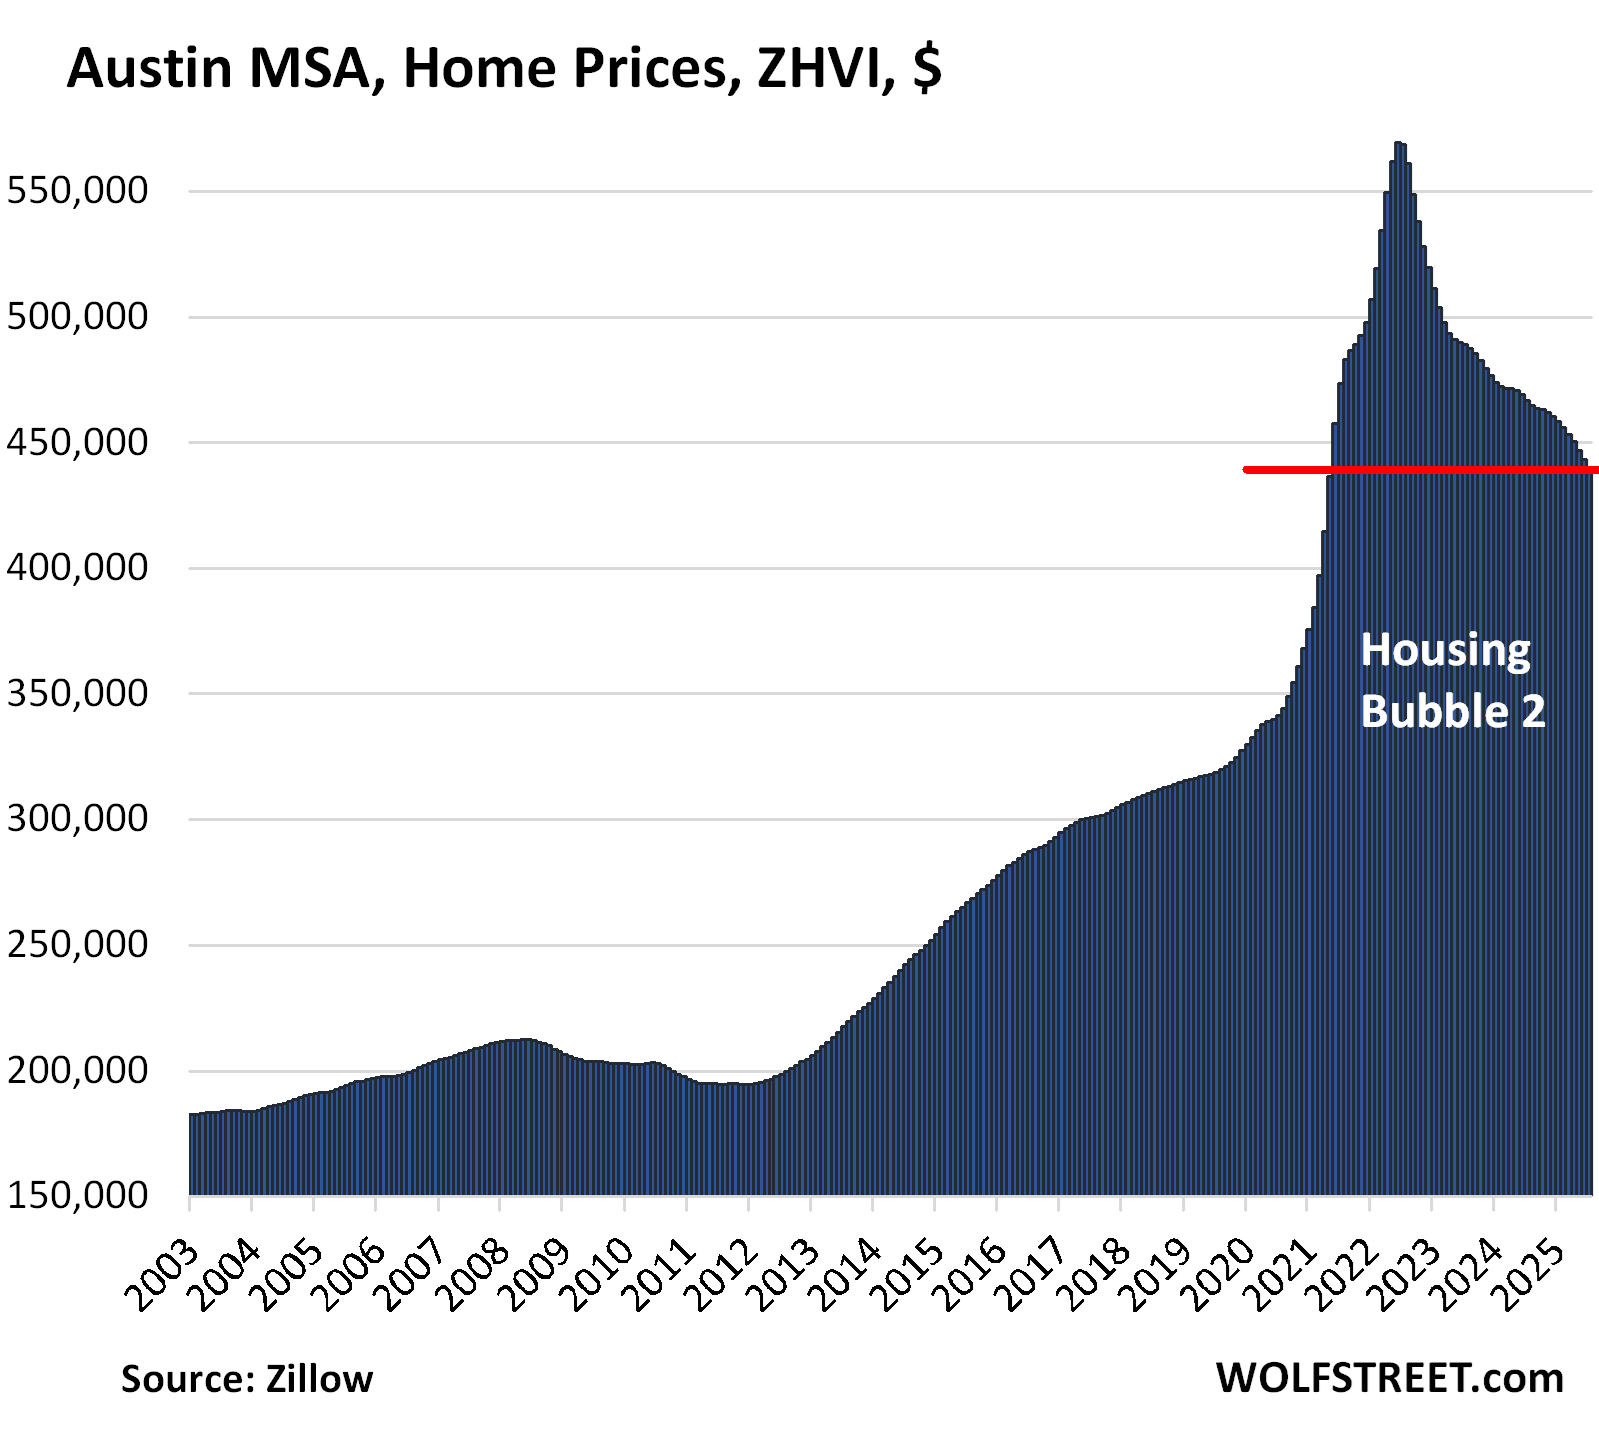
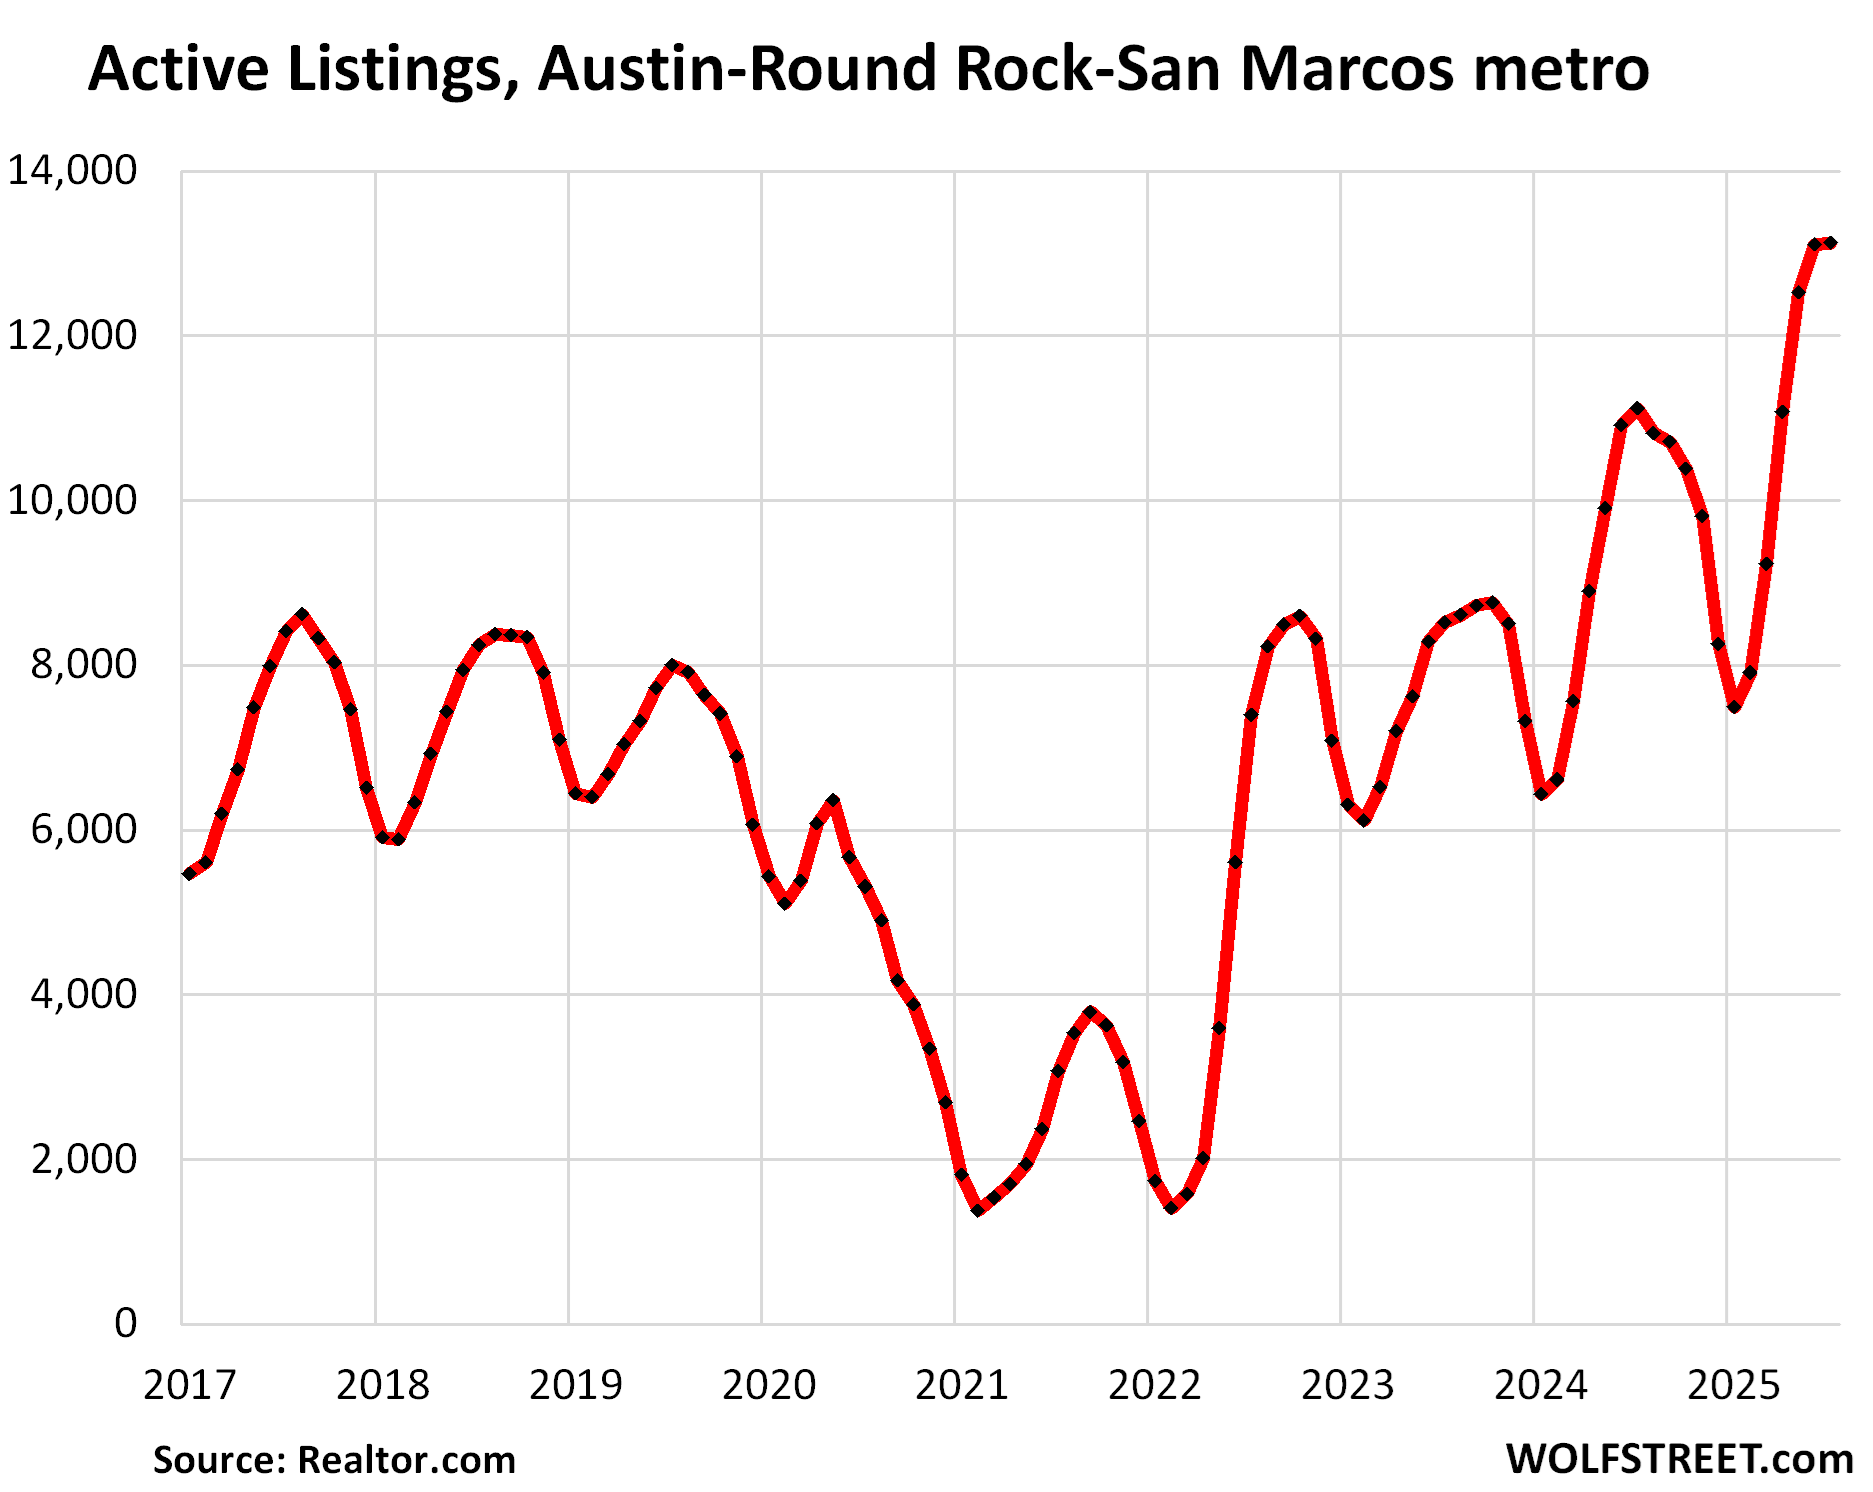
Here is what home inventories in Austin-Round Rock-San Marcos metro look like. All inventory data below is from Realtor.com.
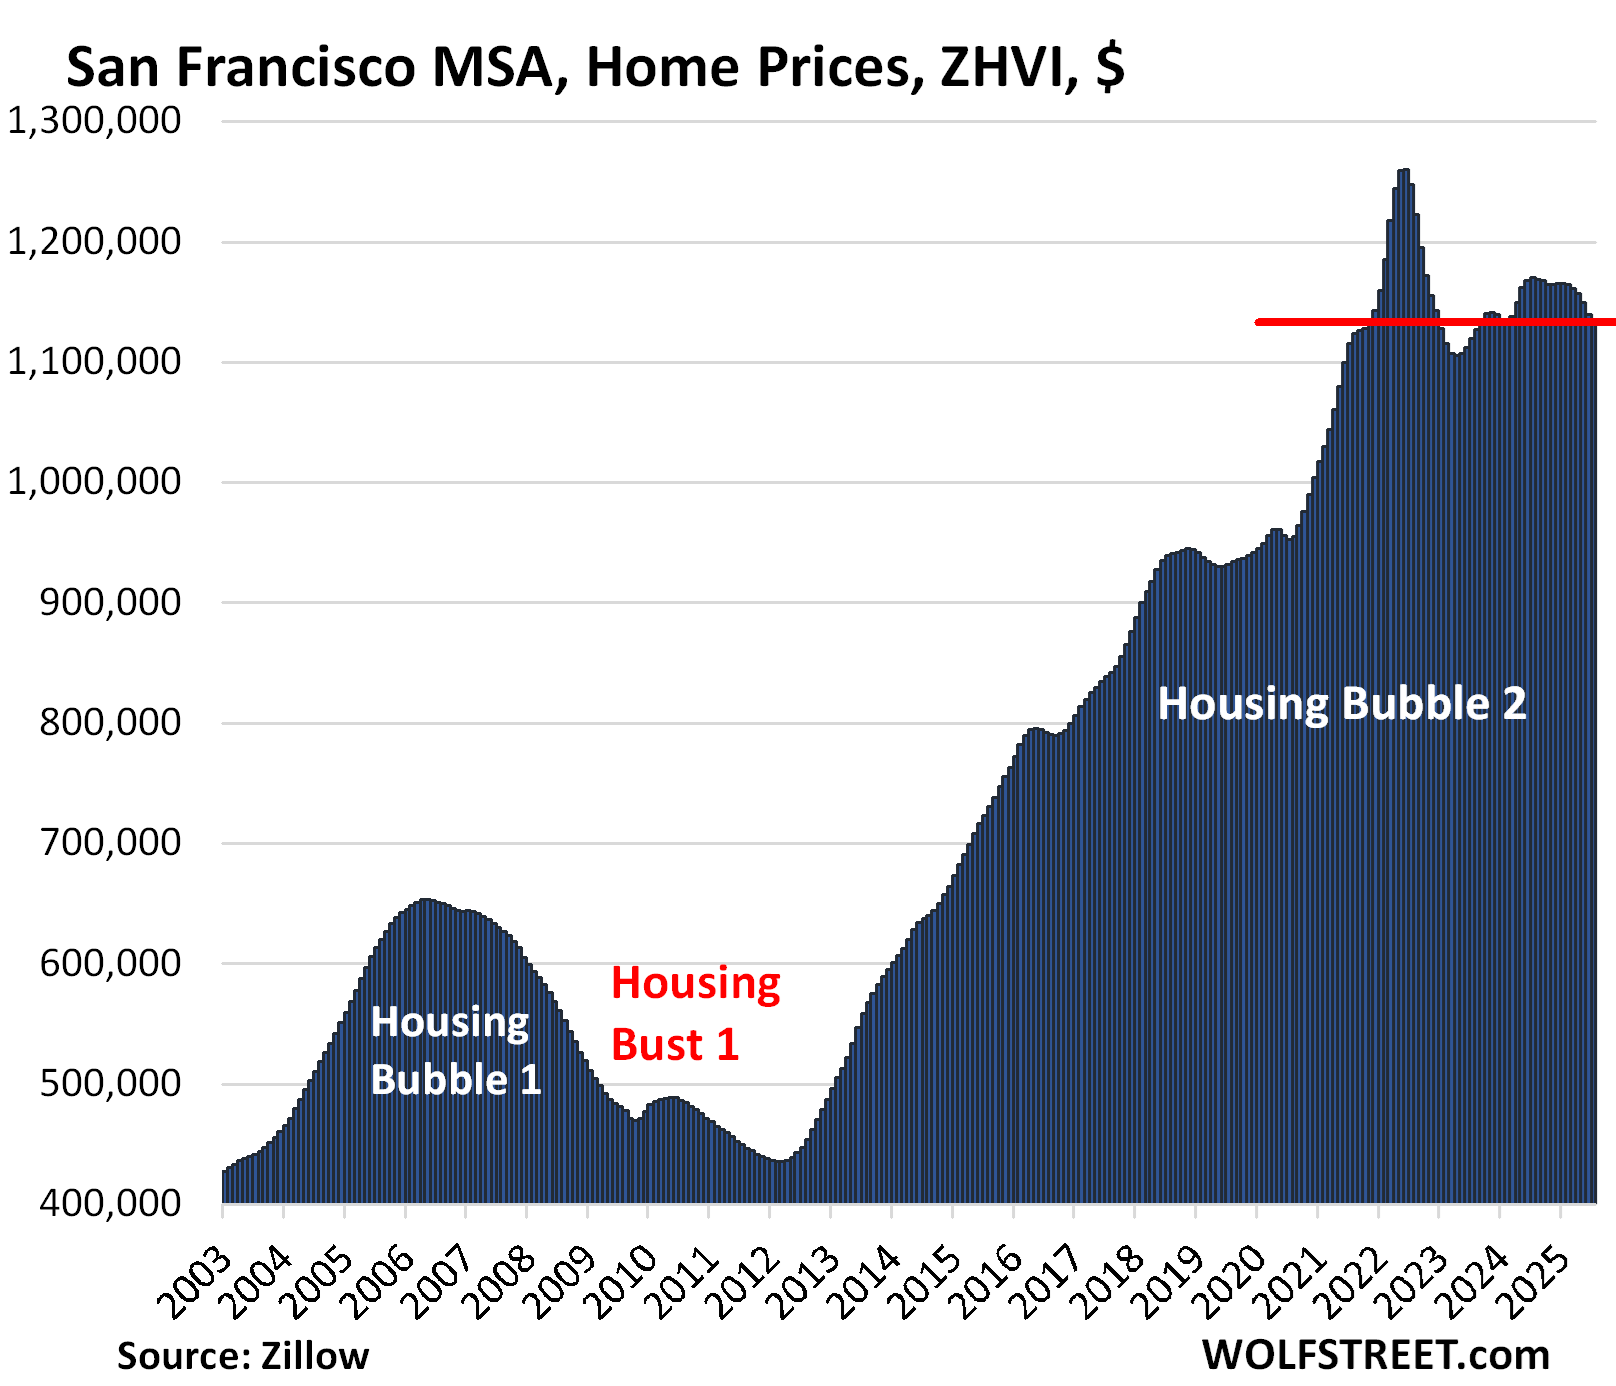
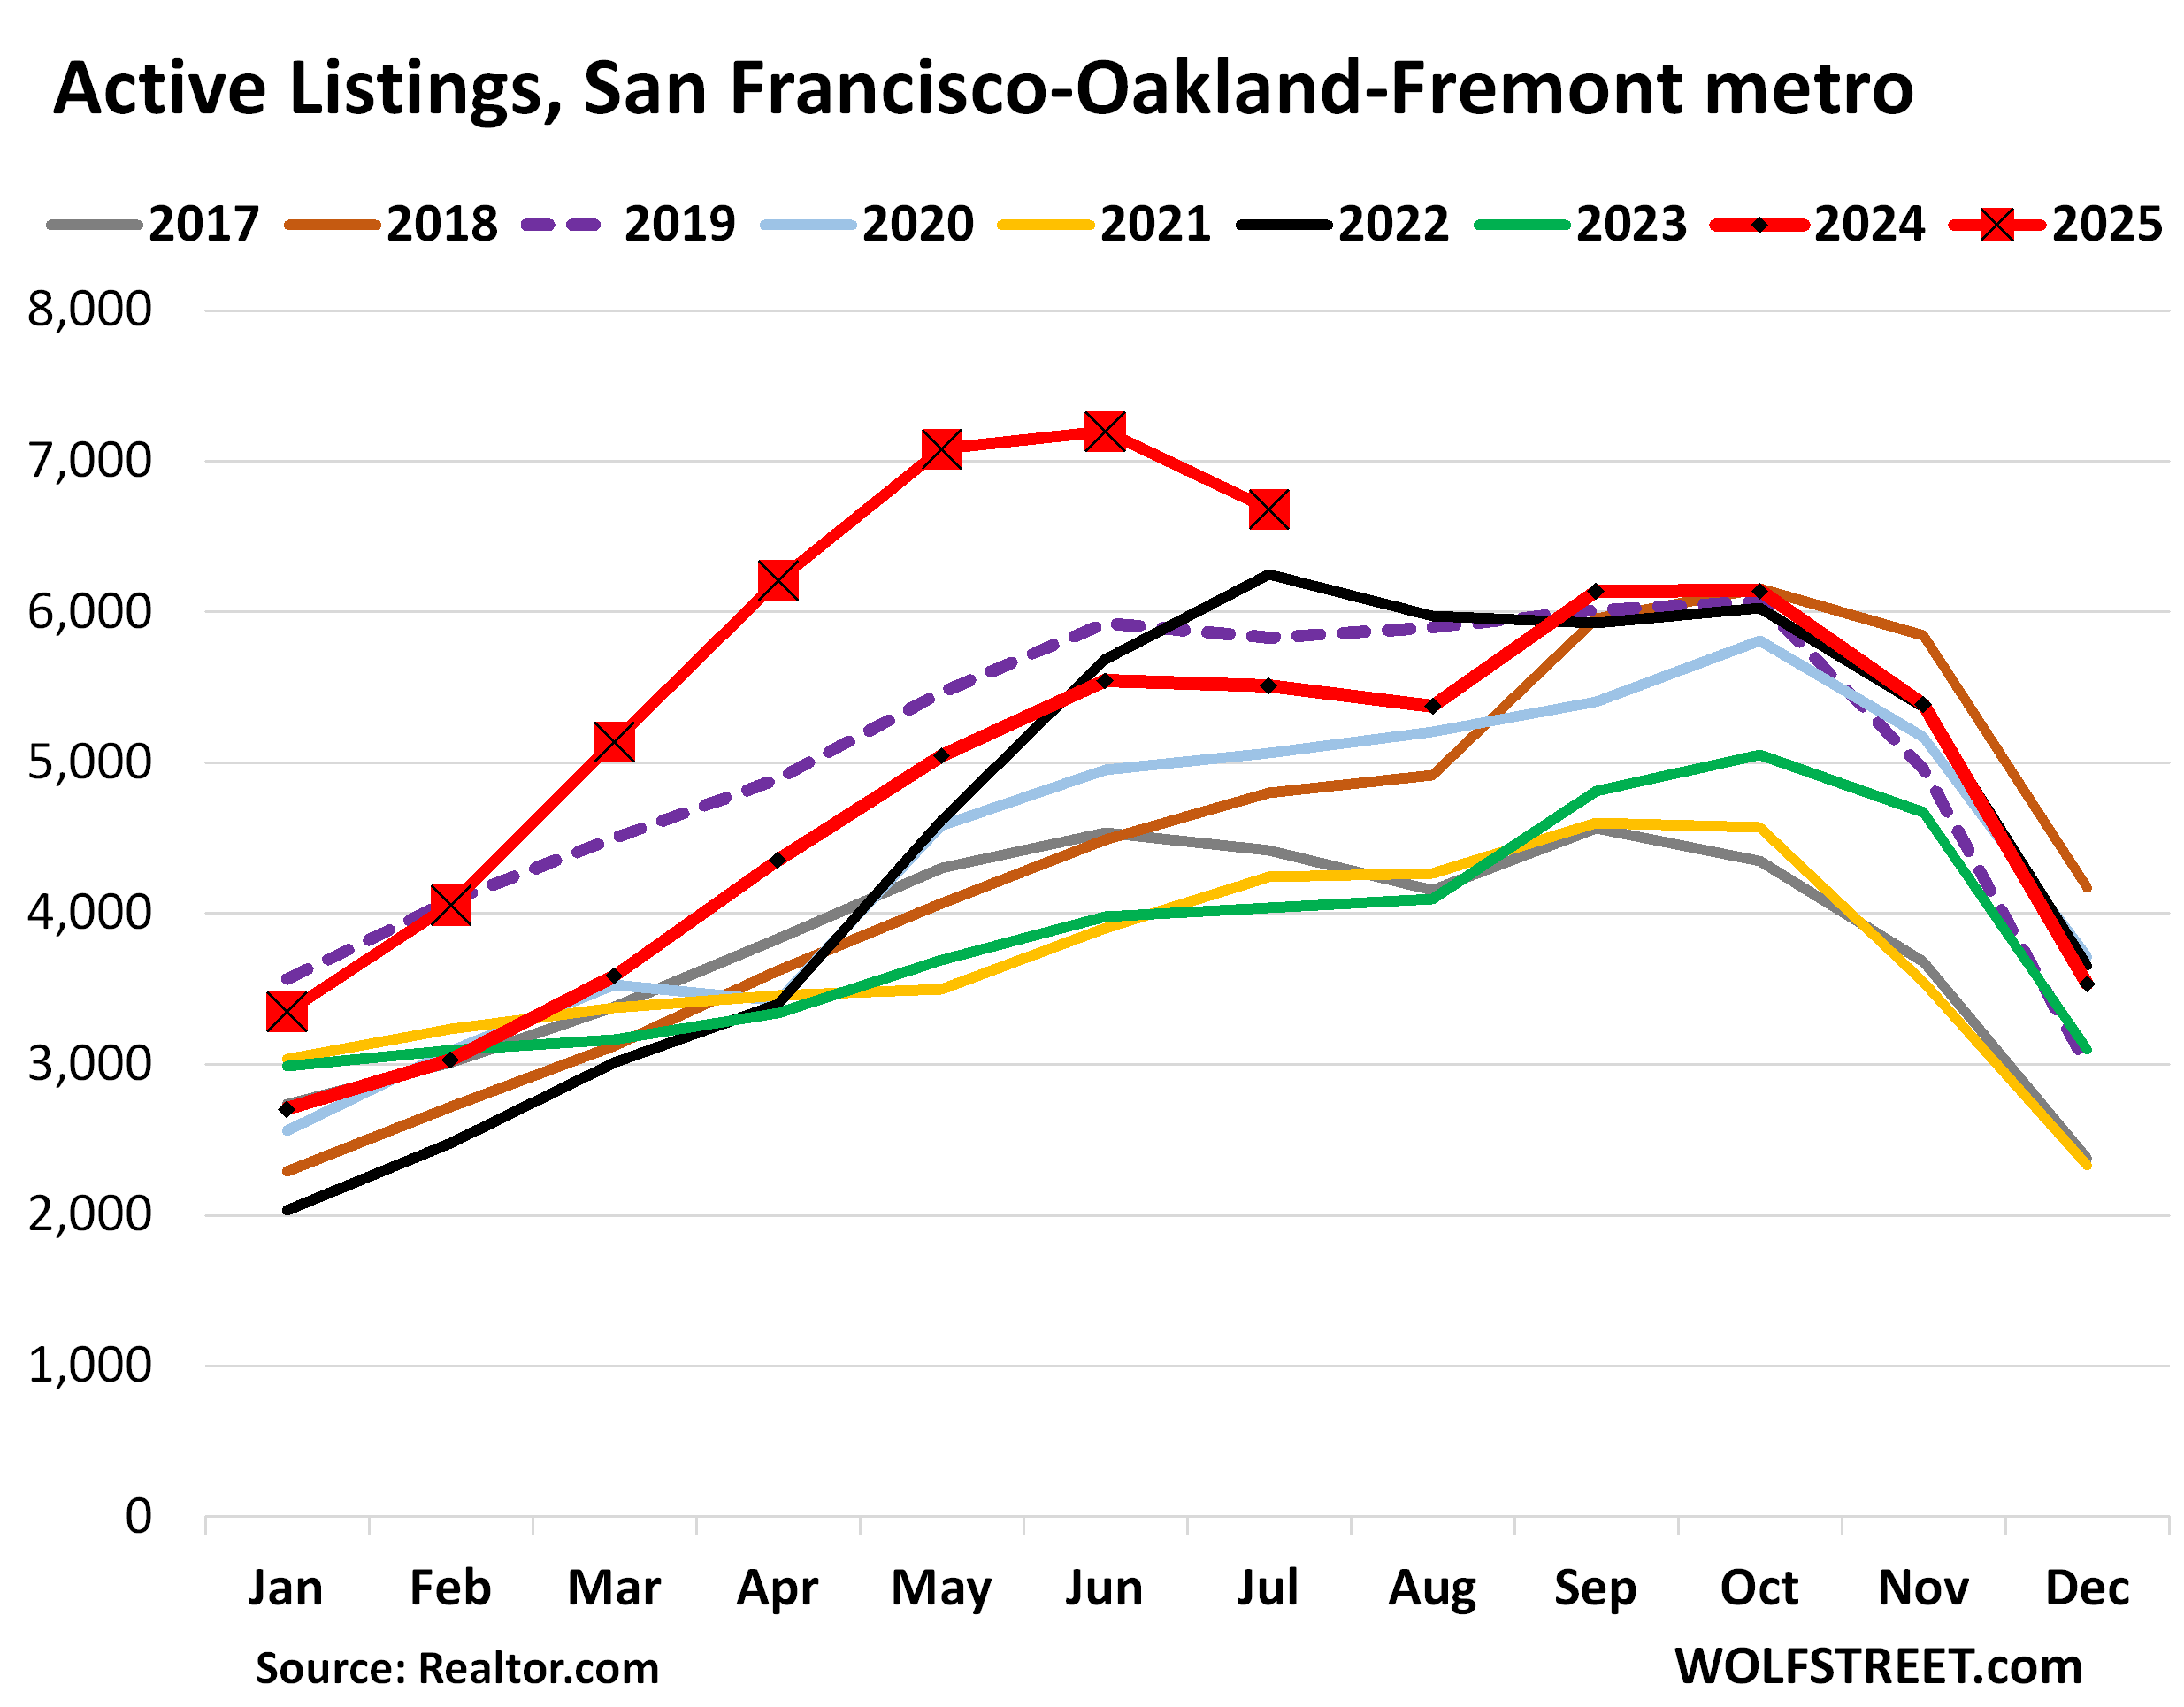
| San Francisco MSA, Home Prices | ||||
| From May 2022 peak | MoM | YoY | Since 2000 | Jan 2020 – Jun 2022 |
| -10.1% | -0.7% | -3.3% | 285% | 33% |
From January 2020 through June 2022, in those 2.5 years, prices exploded by 33%.
The MSA includes San Francisco, much of the East Bay (such as Oakland), much of the North Bay, and goes south on the Peninsula into Silicon Valley through San Mateo County. It does not include the San Jose metro, which covers the southern portion of the Bay Area (see below).
And the home inventories in the San Francisco-Oakland-Fremont MSA:
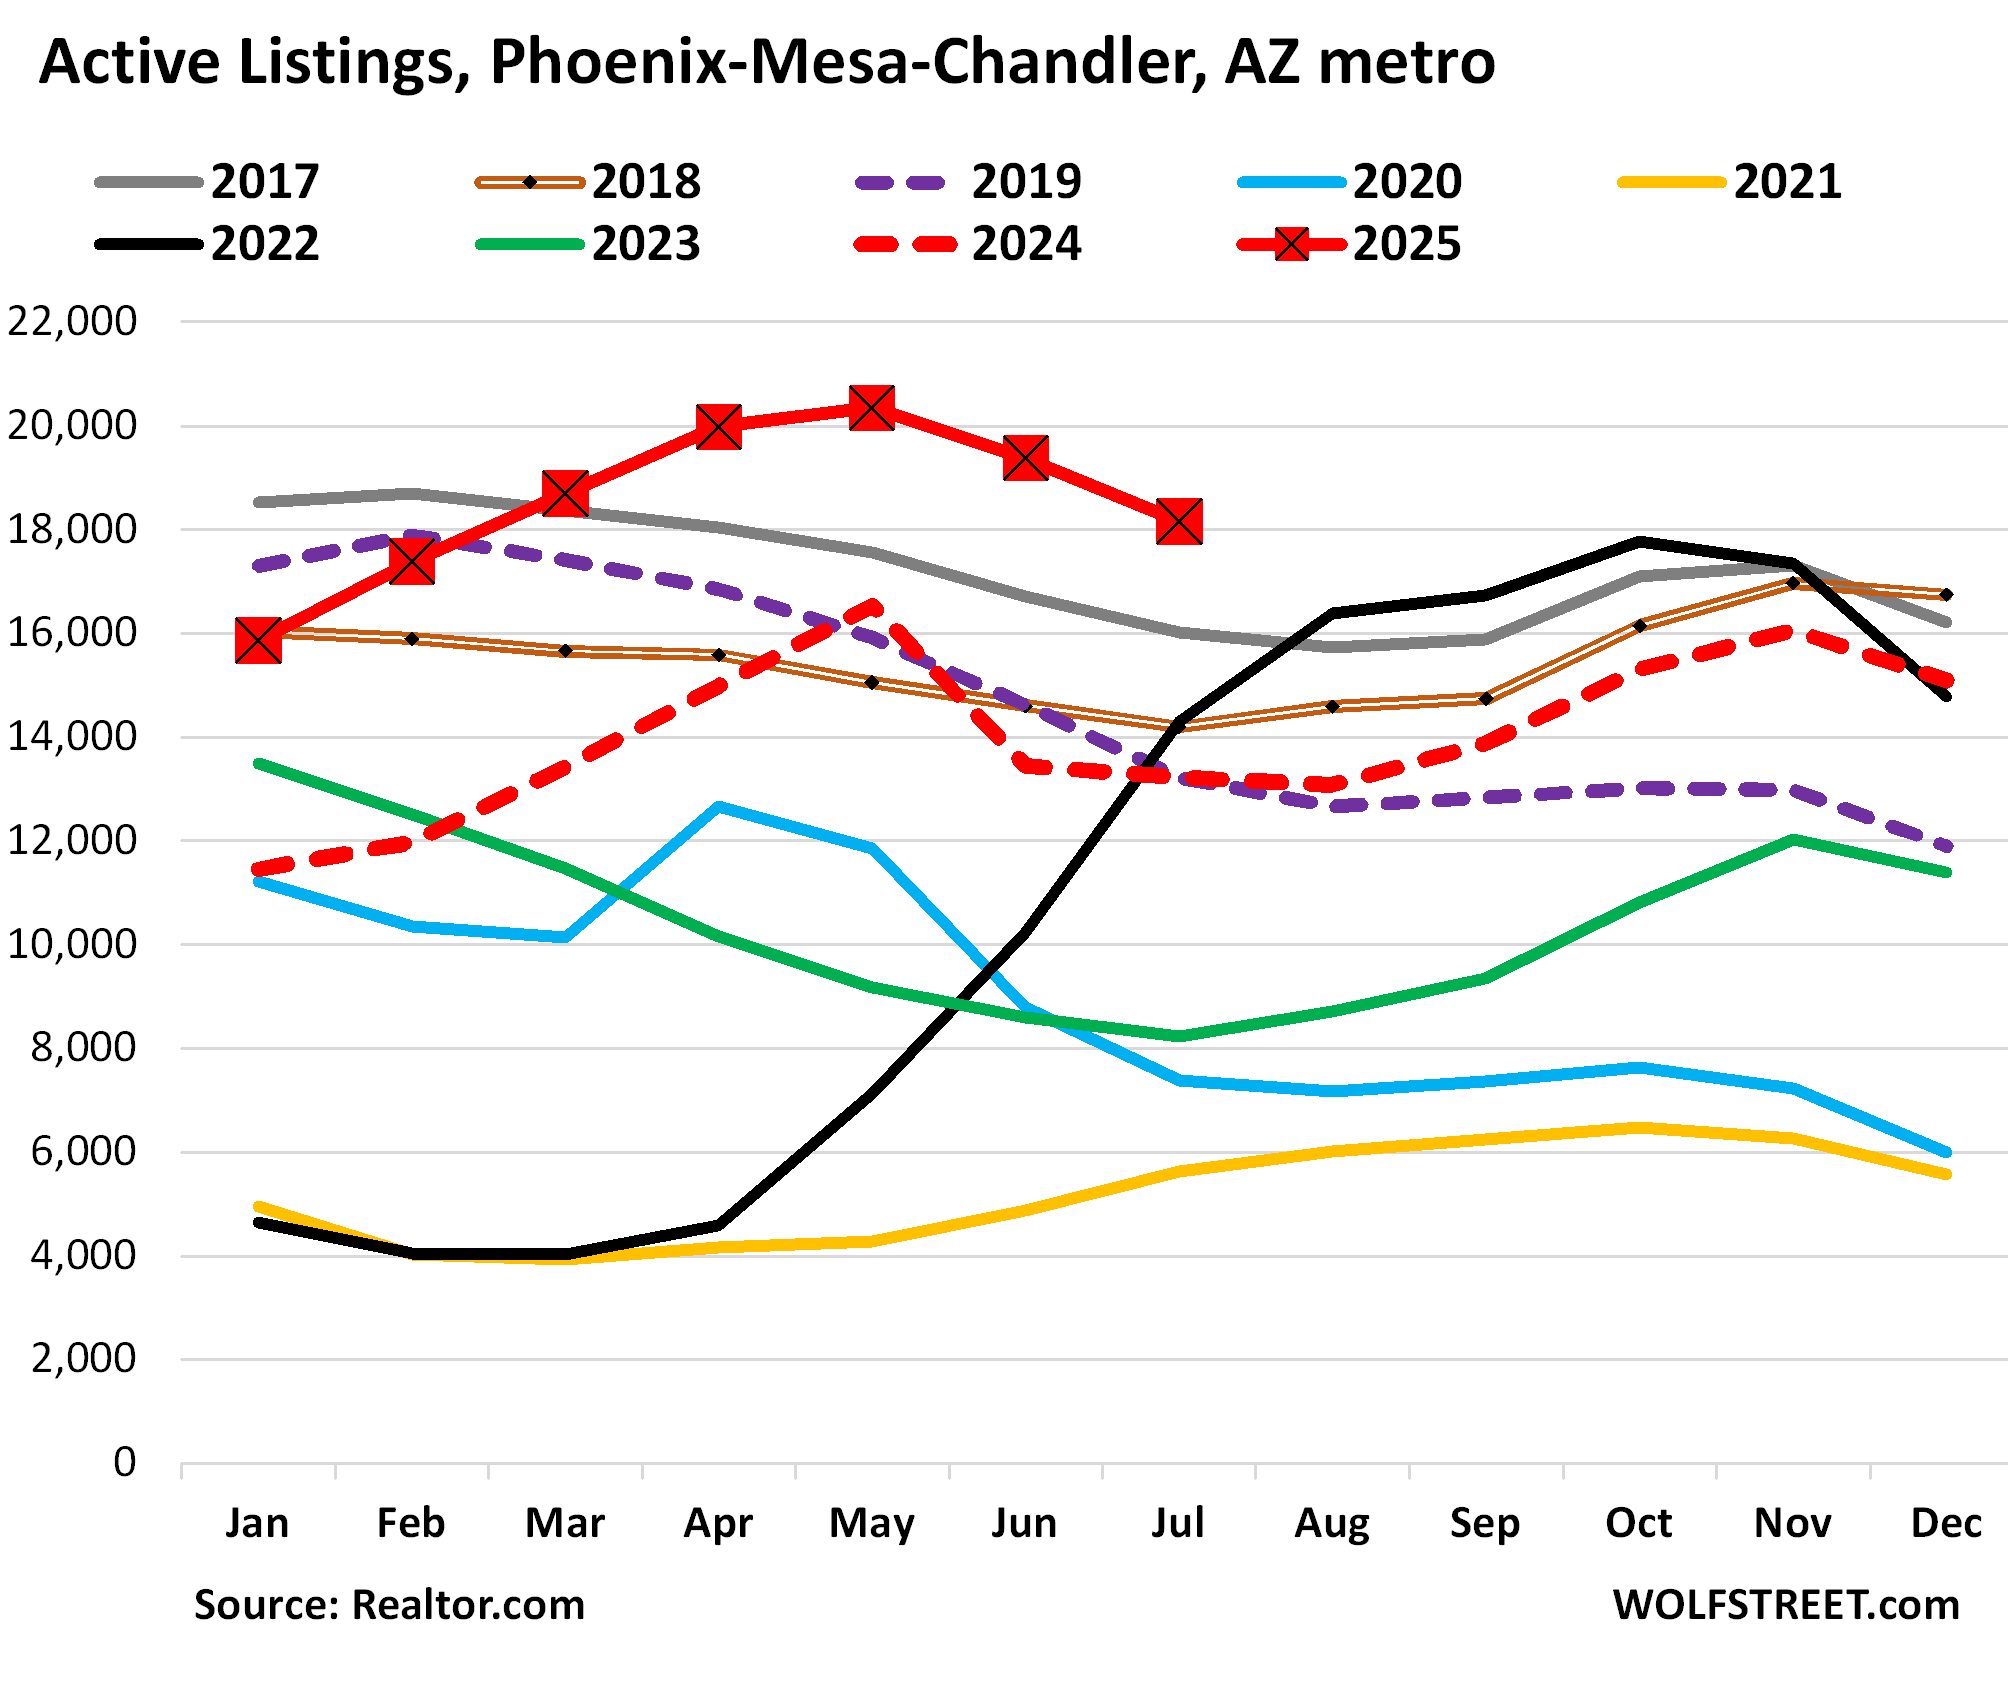
| Phoenix MSA, Home Prices | ||||
| From Jun 2022 peak | MoM | YoY | Since 2000 | Jan 2020 – Jun 2022 |
| -9.0% | -0.4% | -3.5% | 213% | 65% |
Prices exploded by 65% from January 2020 through June 2022.
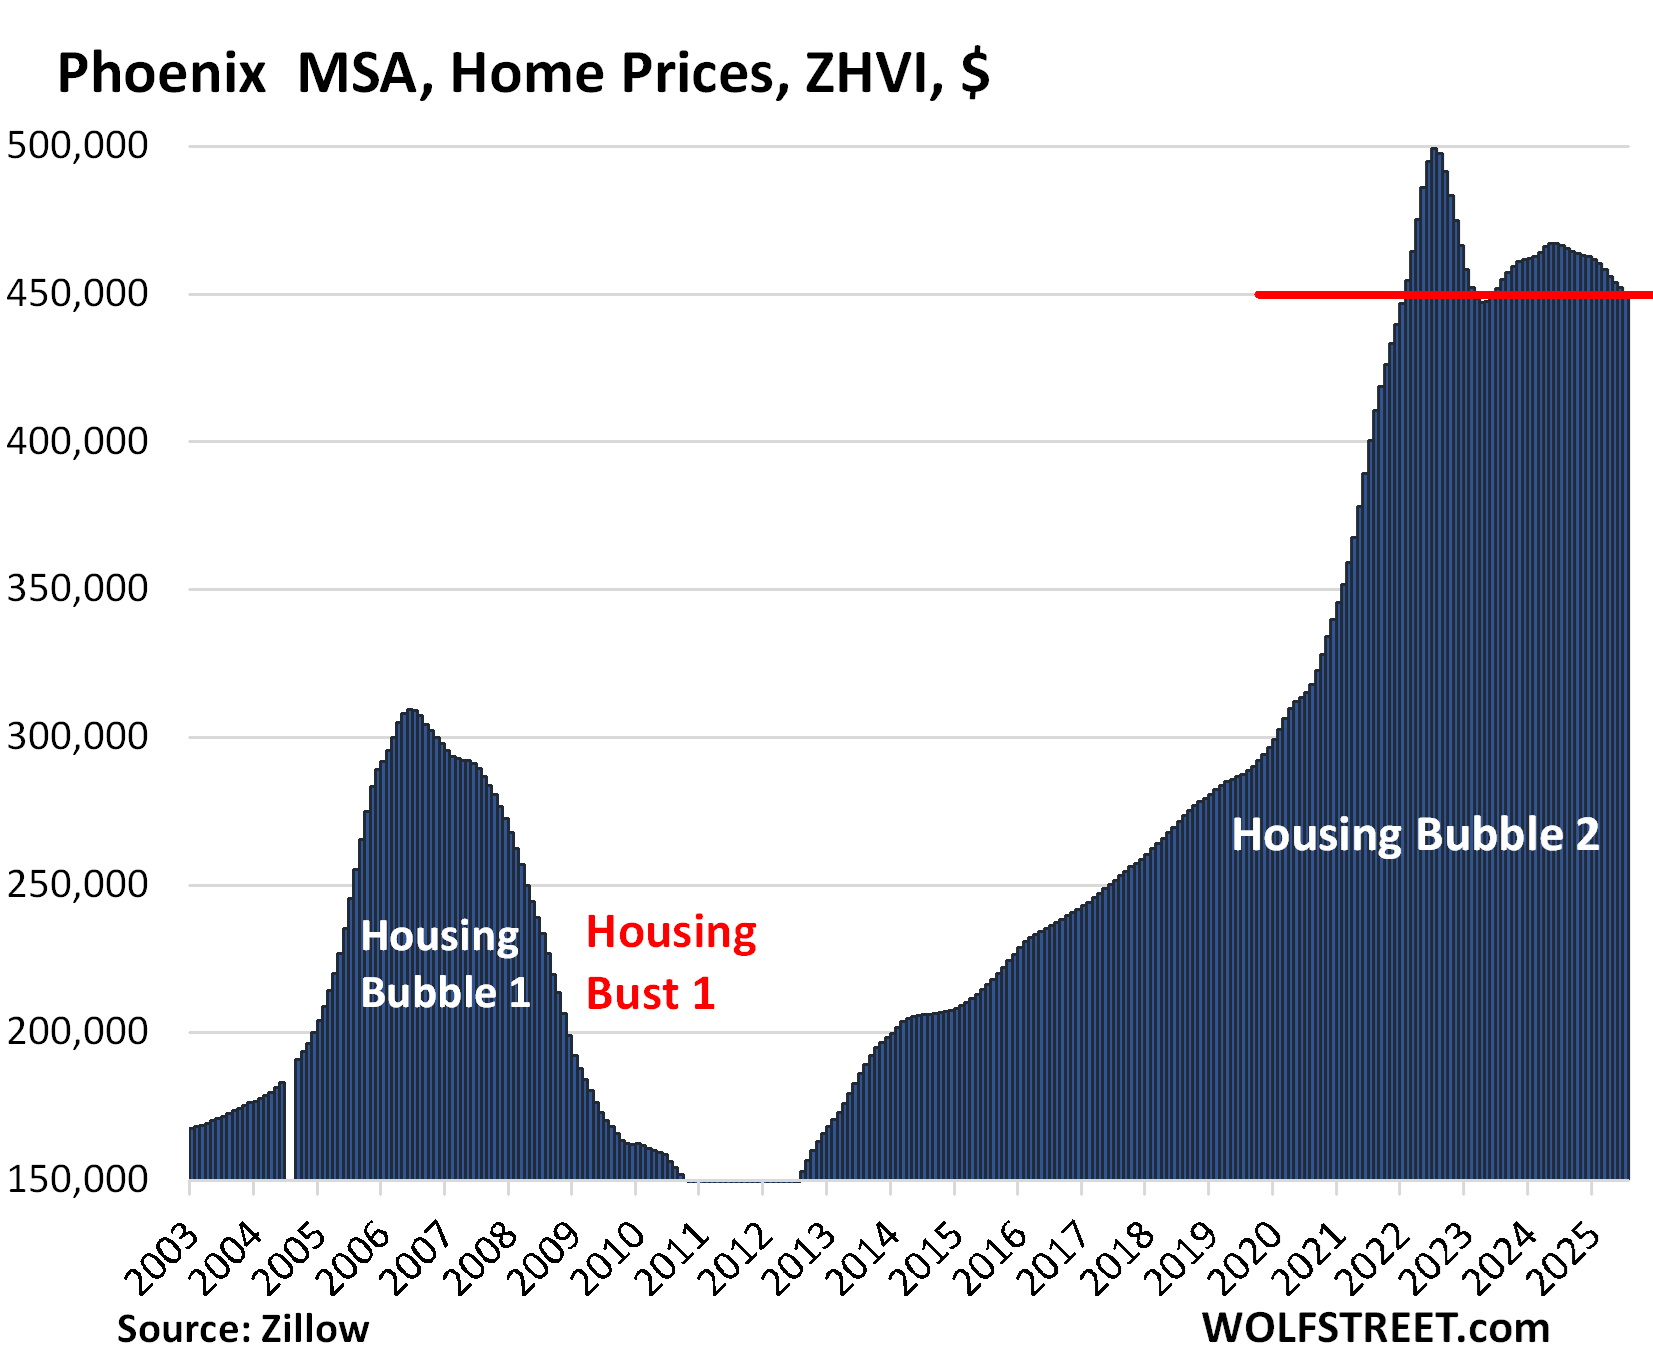
And inventories in the Phoenix-Mesa-Chandler MSA:
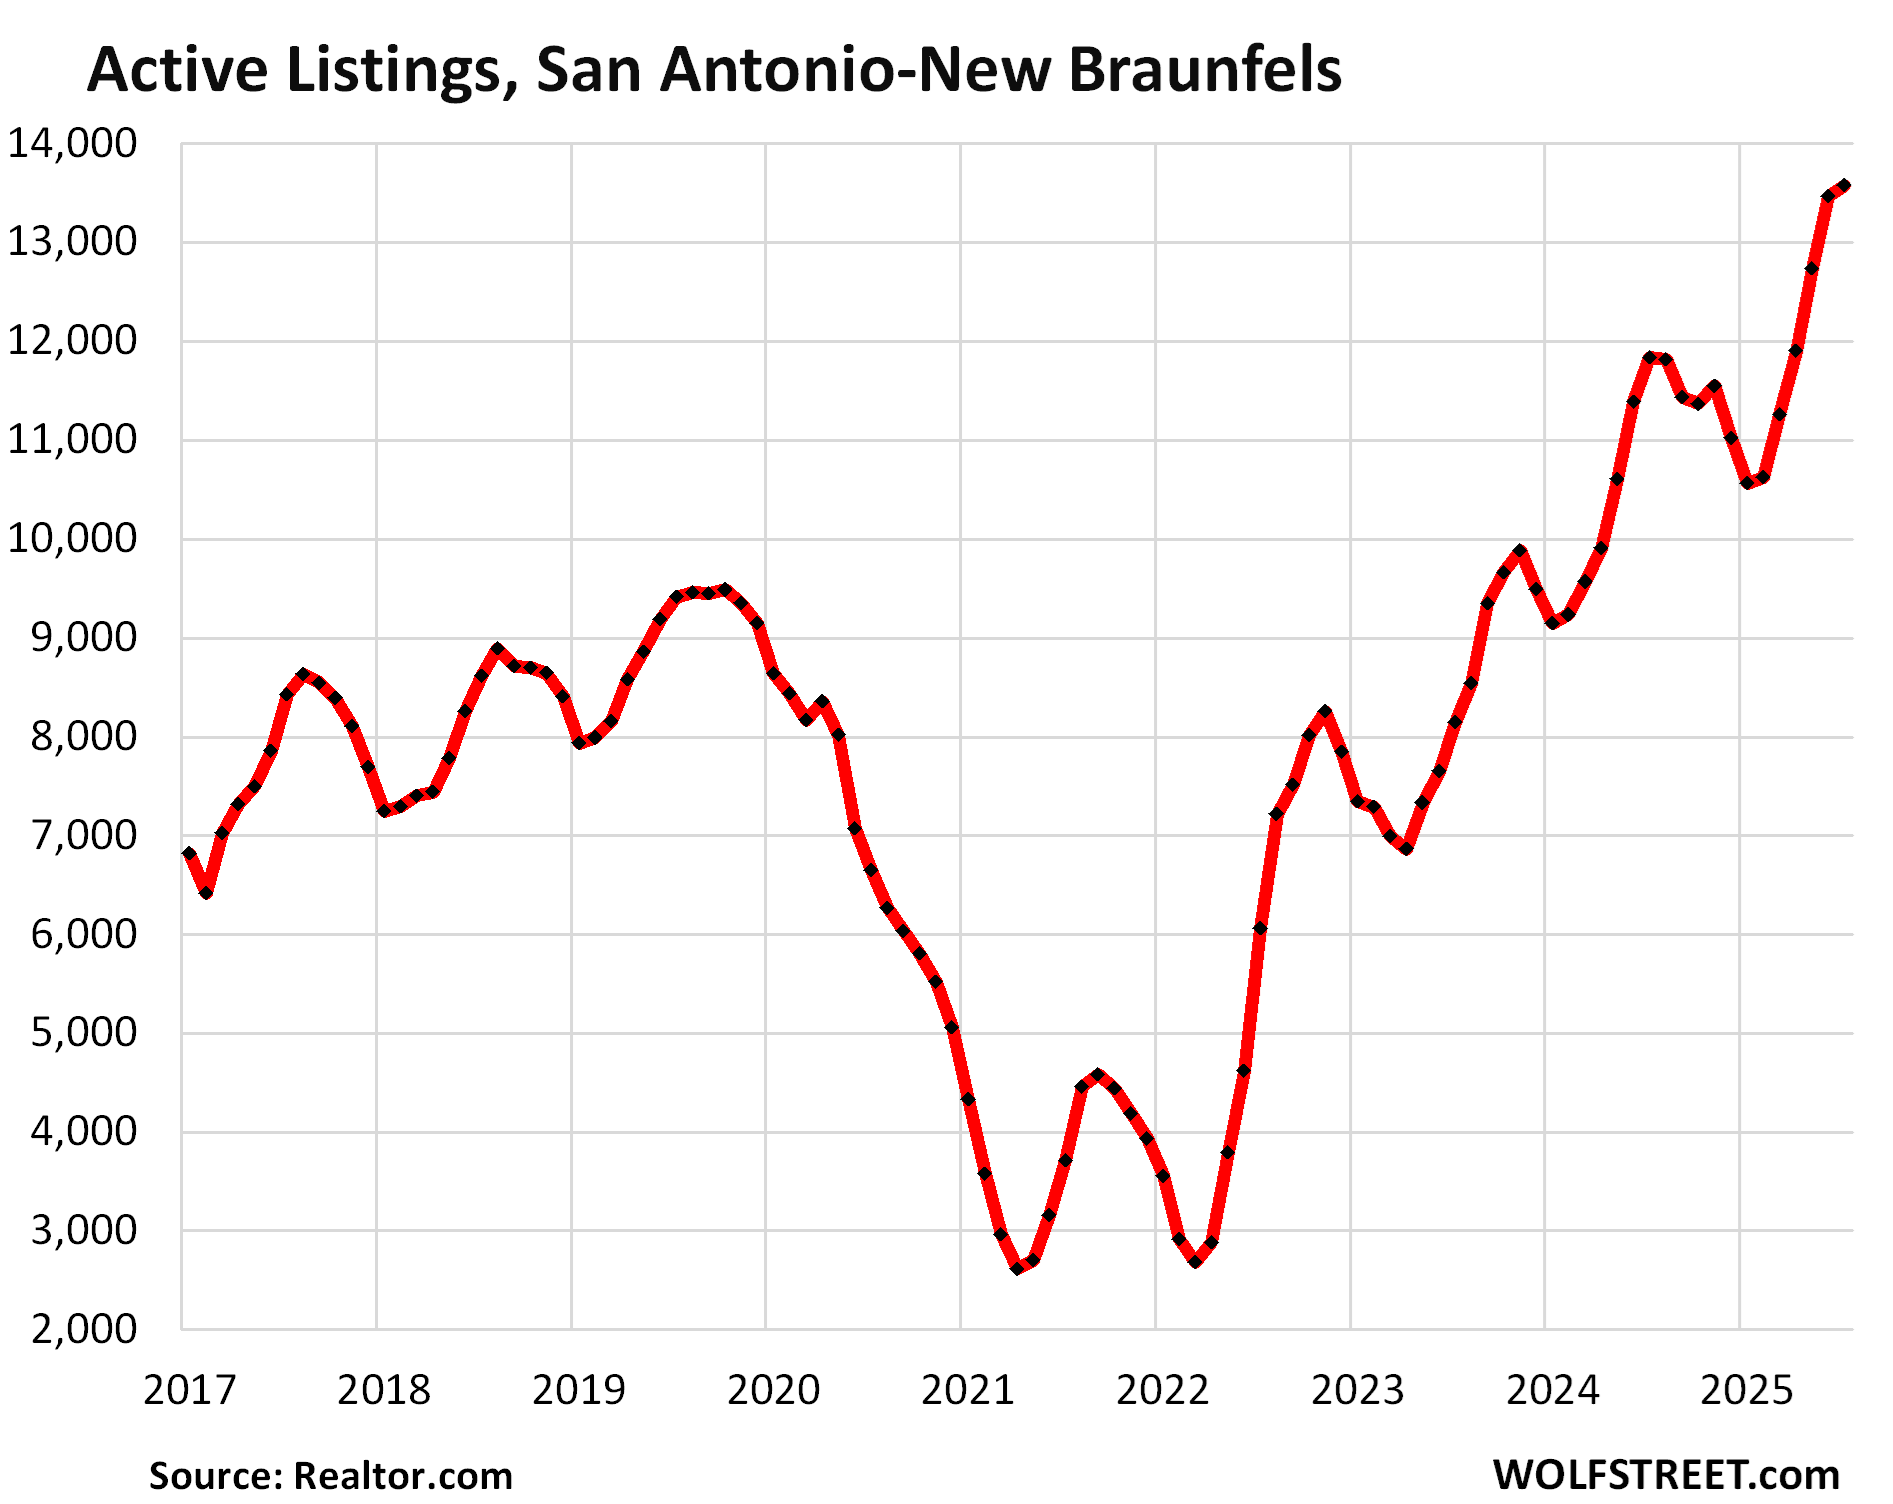
| San Antonio MSA, Home Prices | ||||
| From Jul 2022 peak | MoM | YoY | Since 2000 | Jan 2020 – Jun 2022 |
| -8.0% | -0.3% | -3.3% | 144% | 40% |
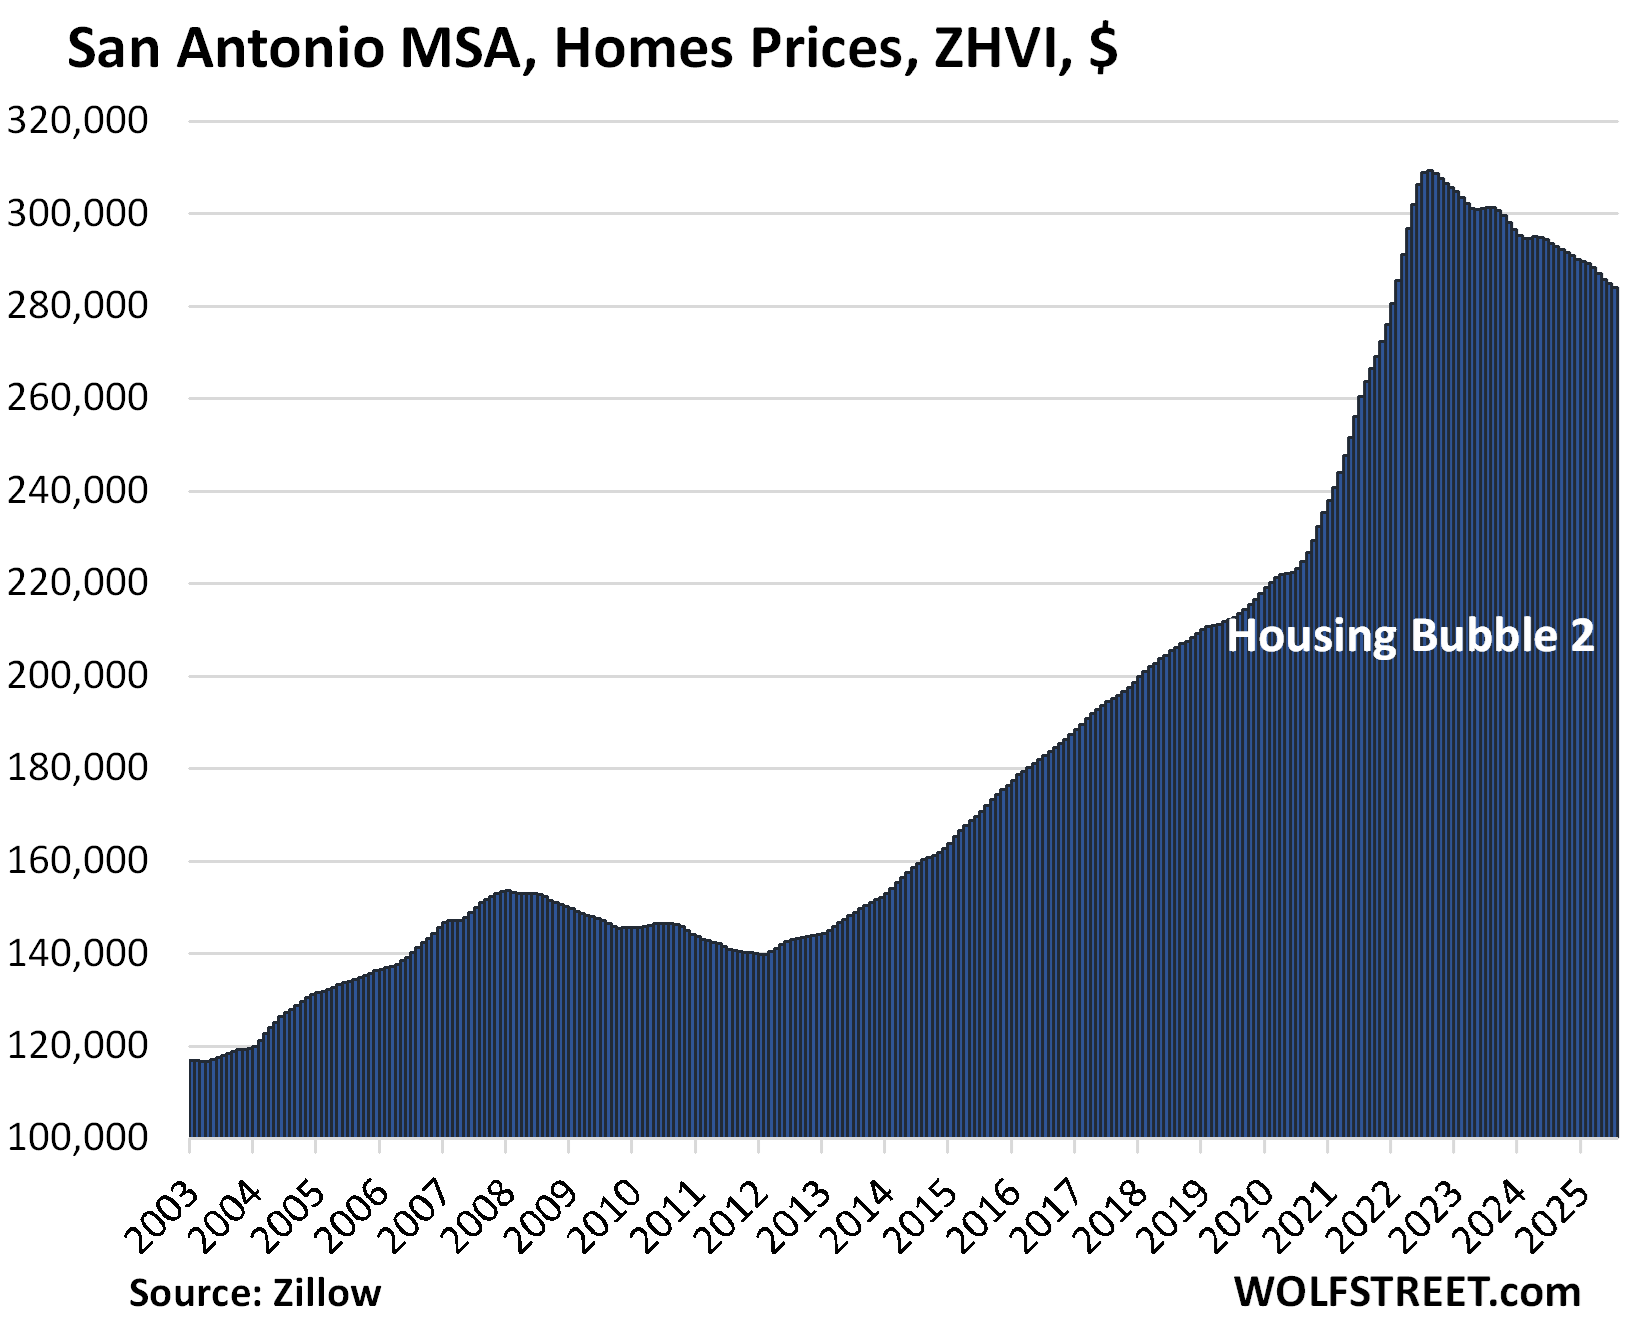
And the inventory situation in the San Antonio-New Braunfels metro:
| Denver MSA, Home Prices | ||||
| From Jun 2022 peak | MoM | YoY | Since 2000 | Jan 2020 – Jun 2022 |
| -7.0% | -0.4% | -2.6% | 203% | 41% |
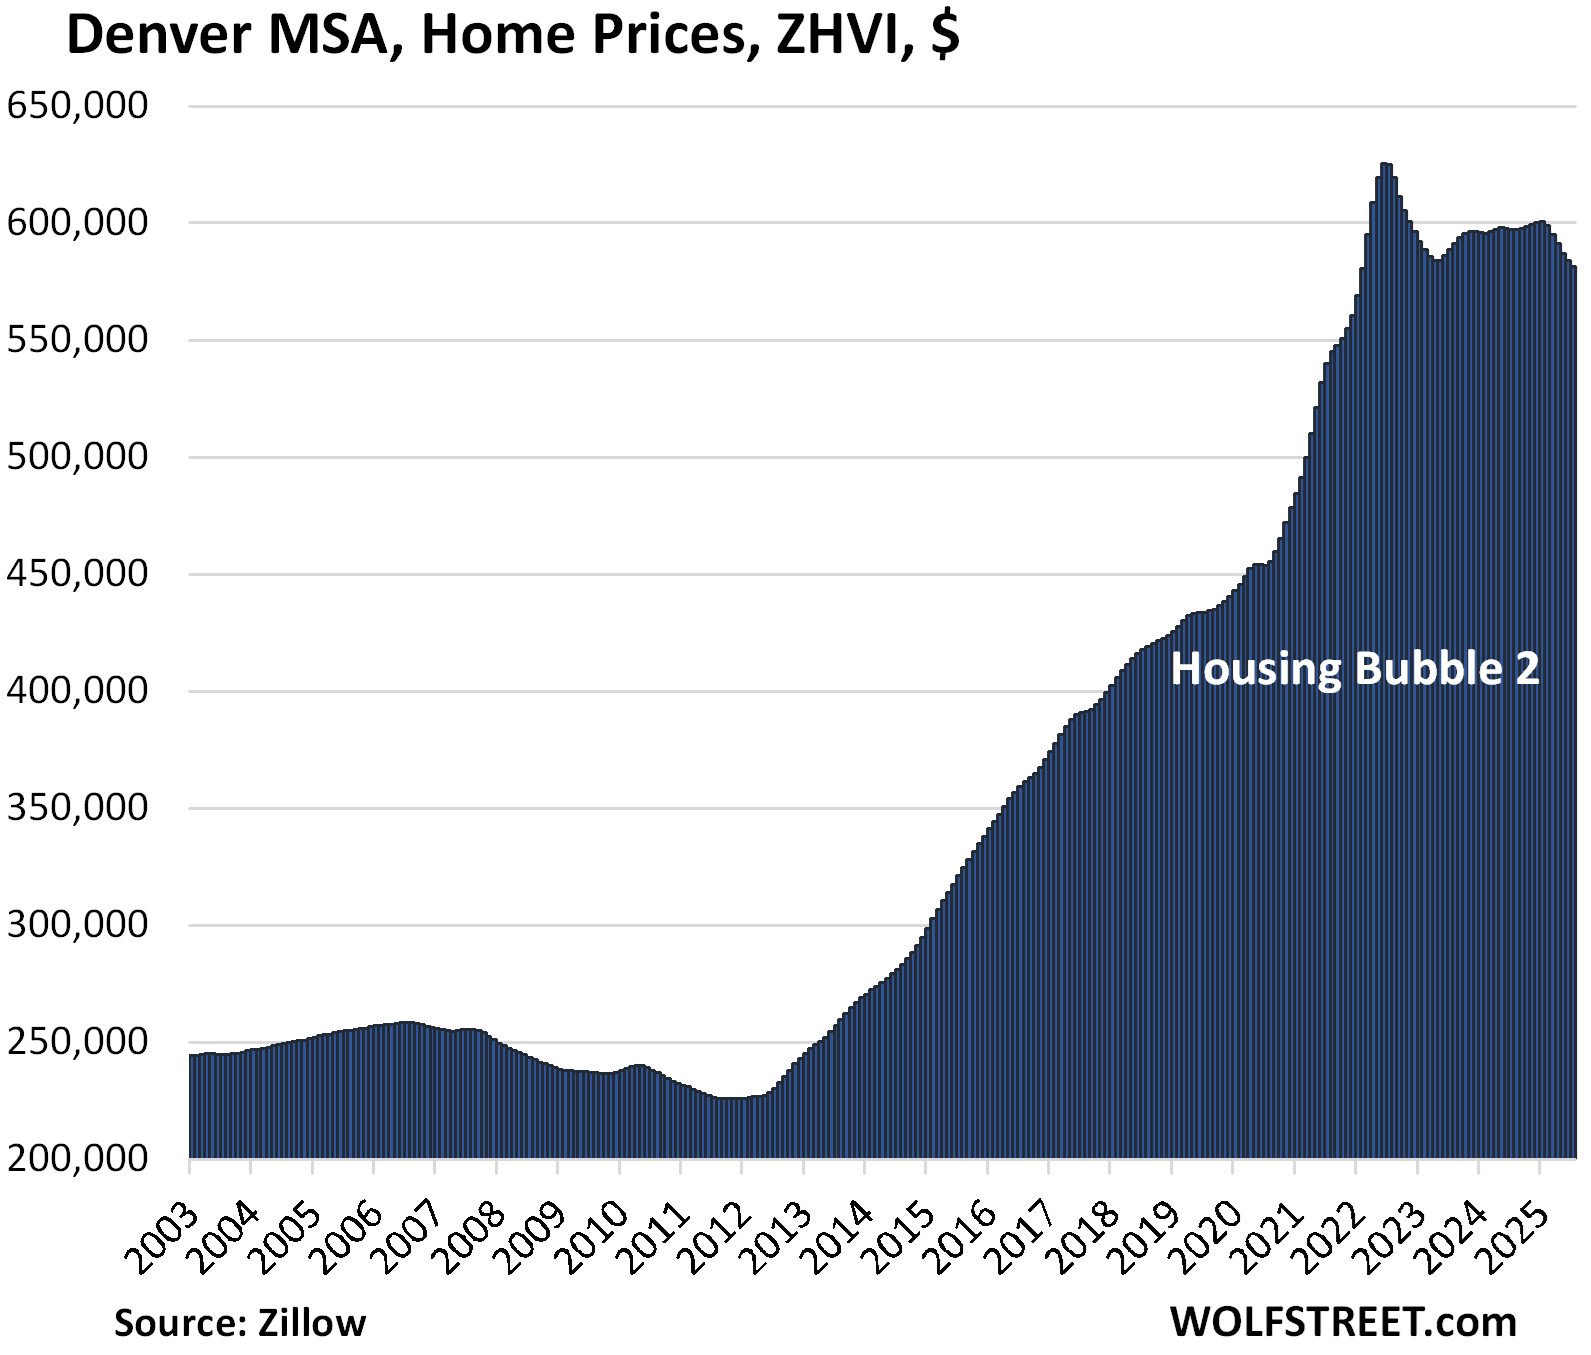
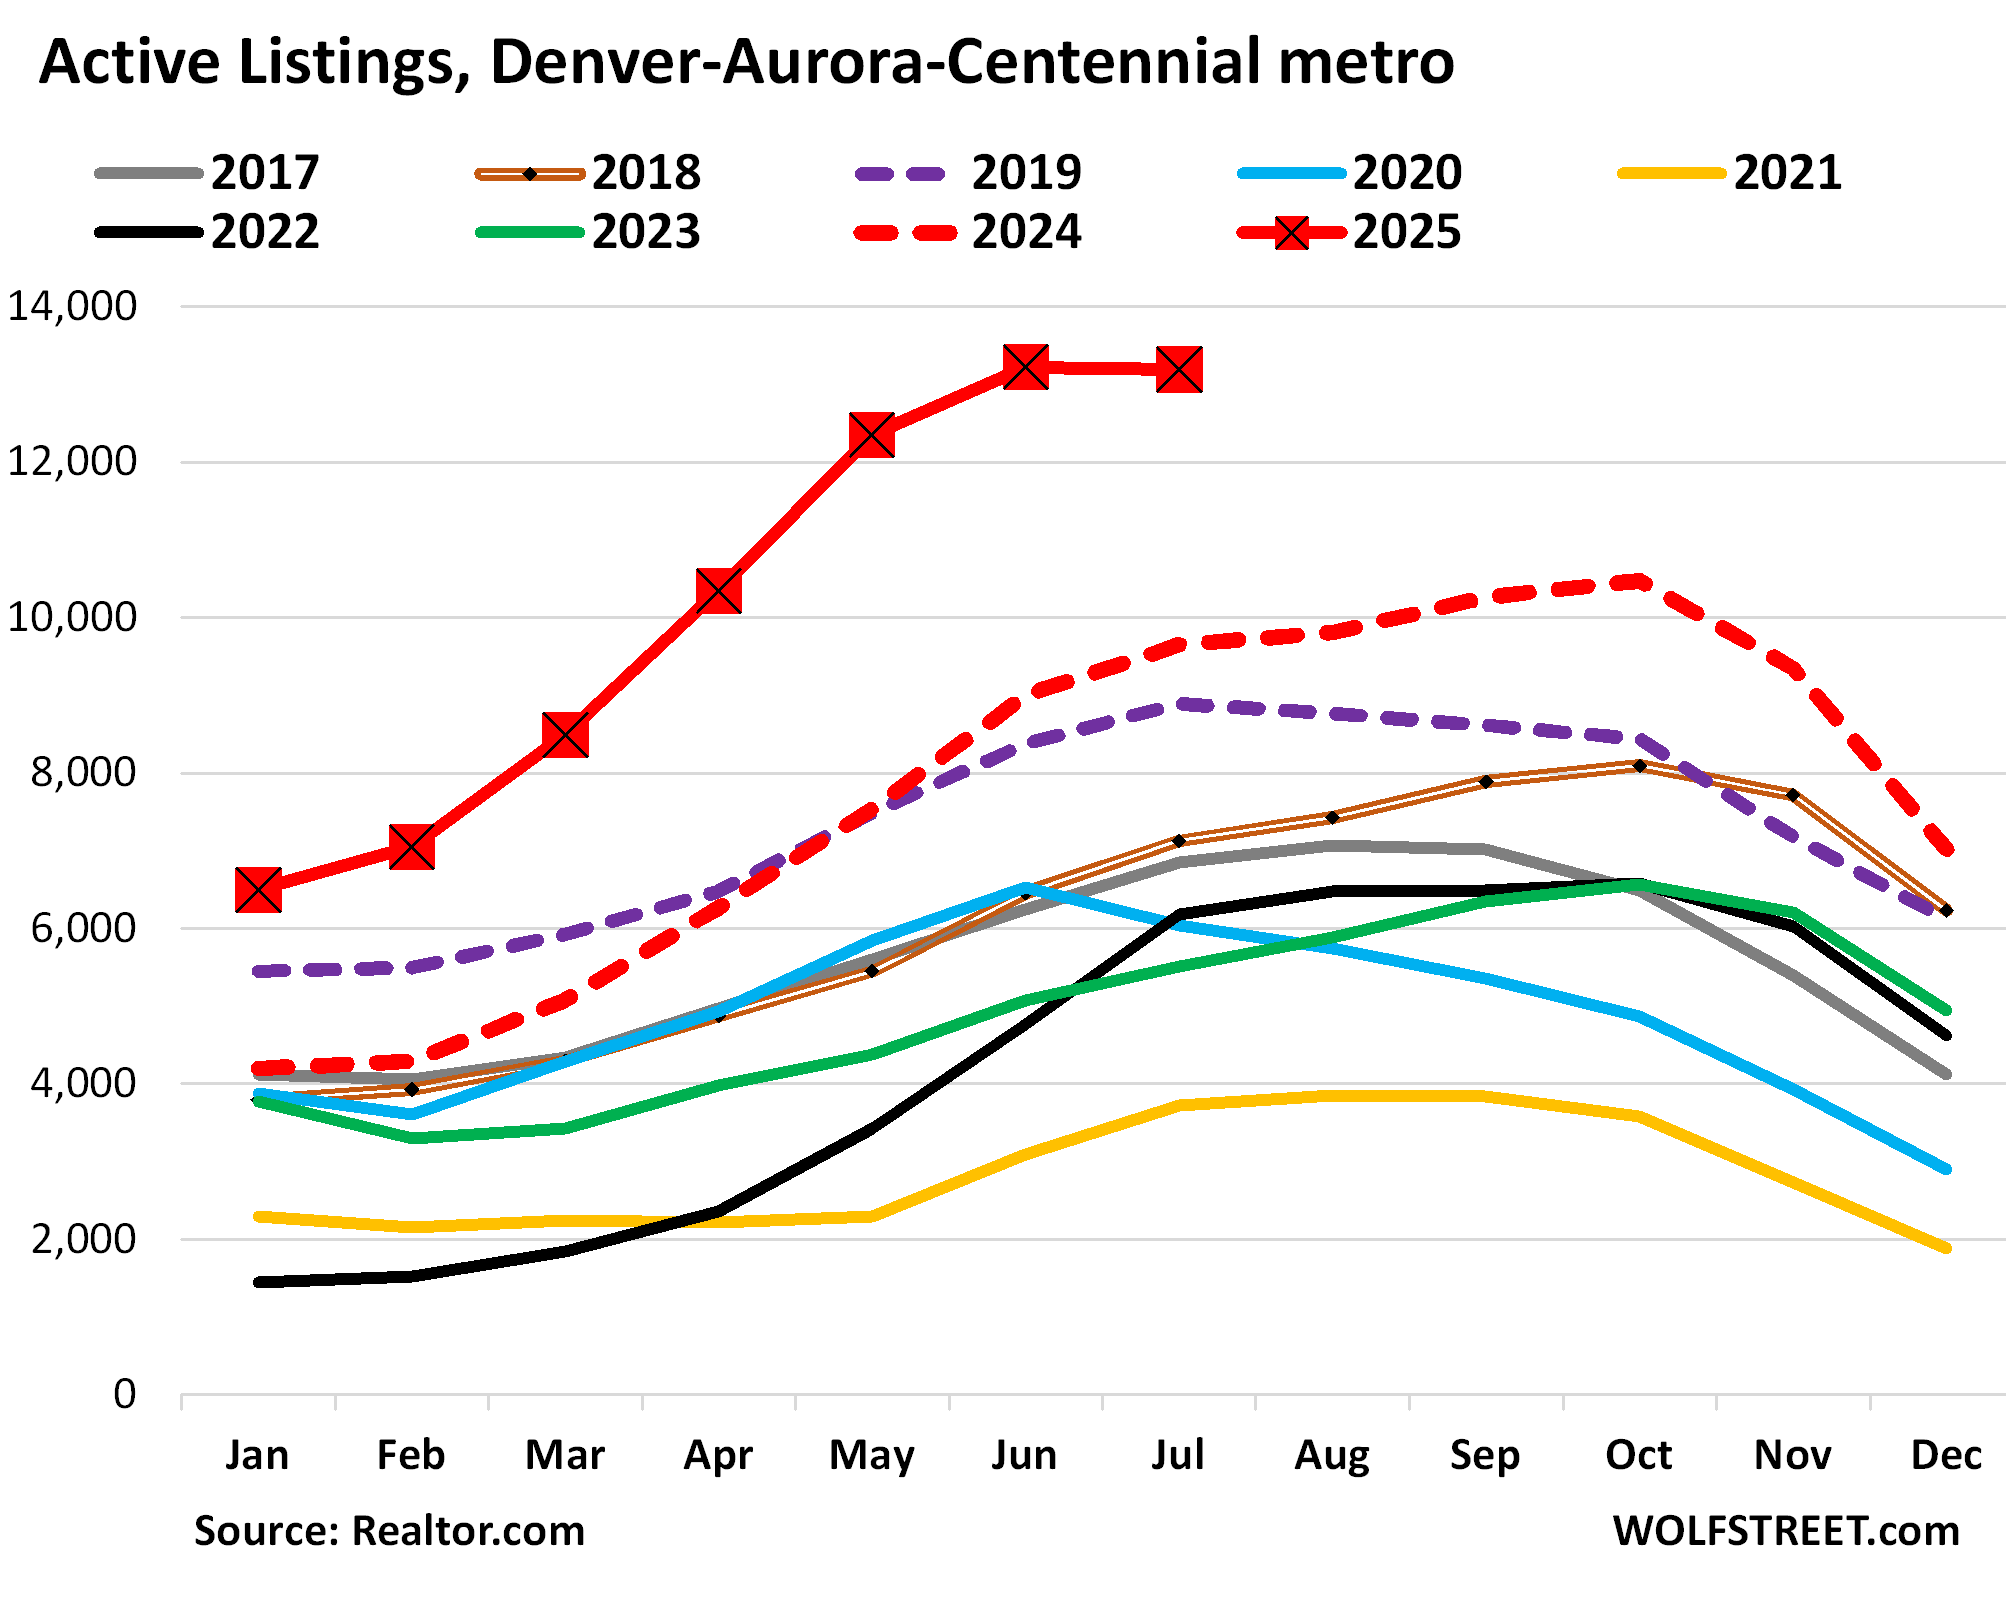
And inventories in the Denver-Aurora-Centennial MSA (detailed discussion of inventories in the big metros in the West):
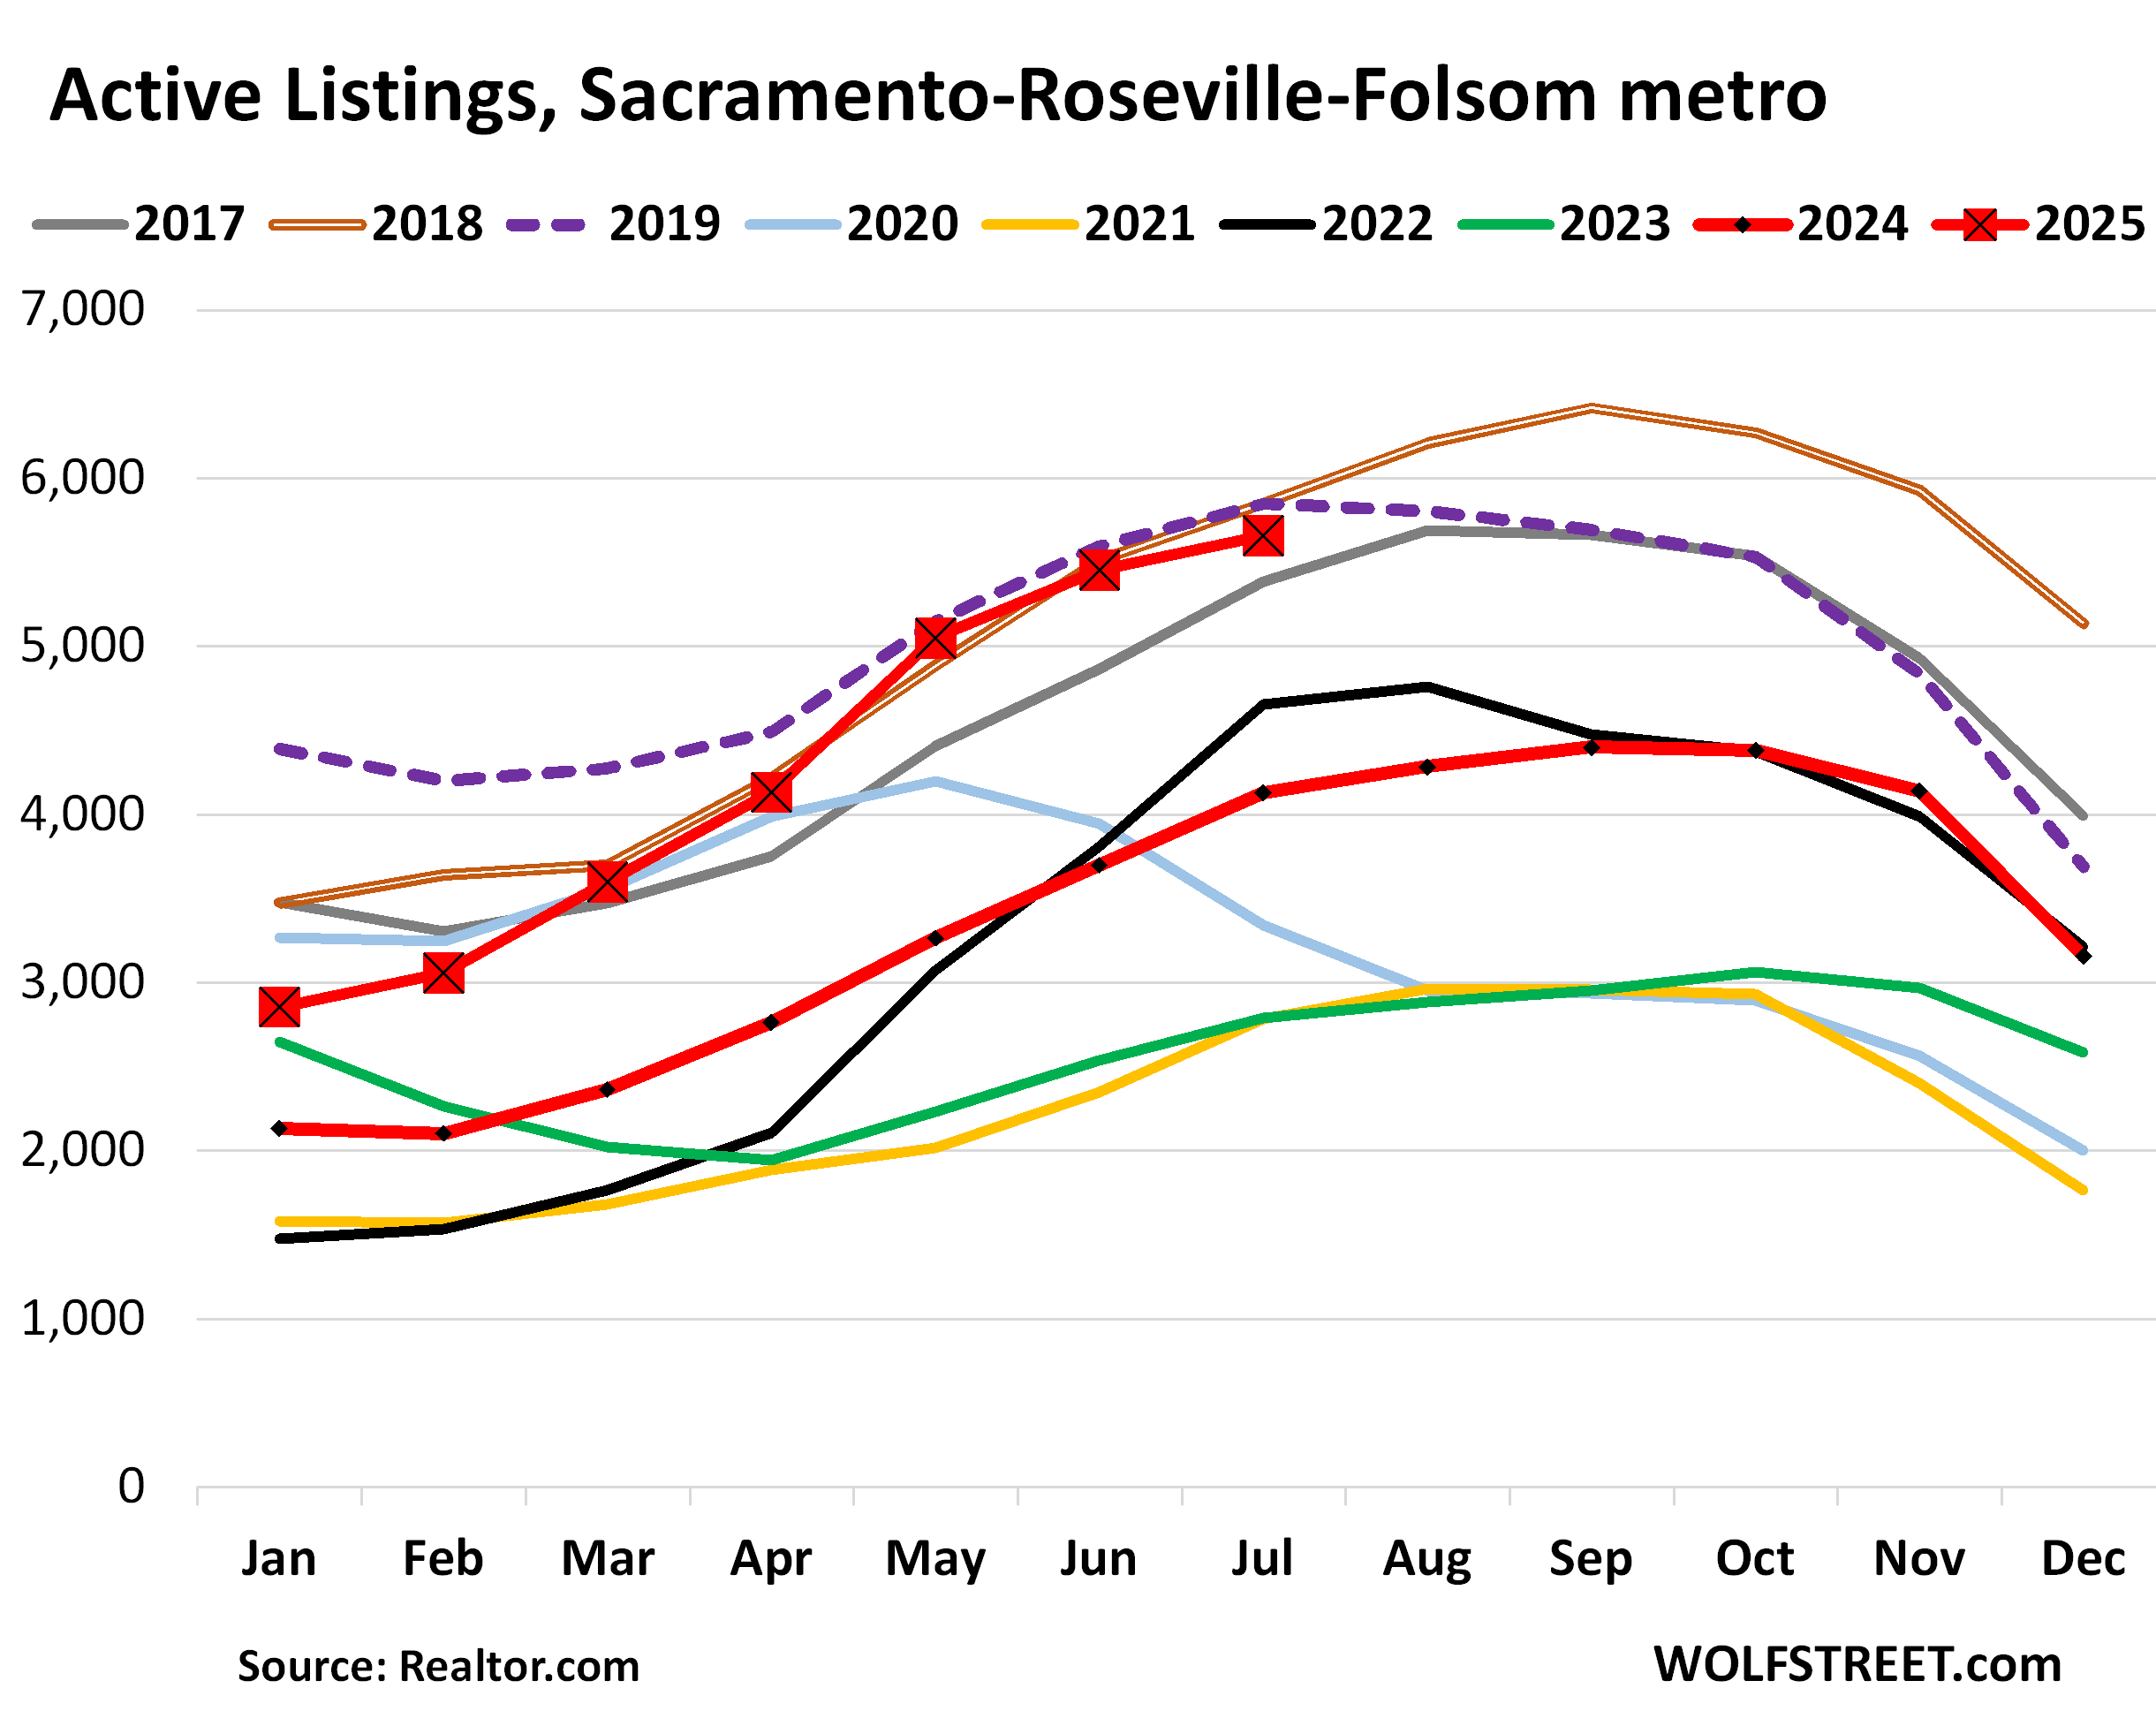
| Sacramento MSA, Home Prices | ||||
| From July 2022 peak | MoM | YoY | Since 2000 | Jan 2020 – Jun 2022 |
| -6.7% | -0.5% | -1.7% | 241% | 41% |
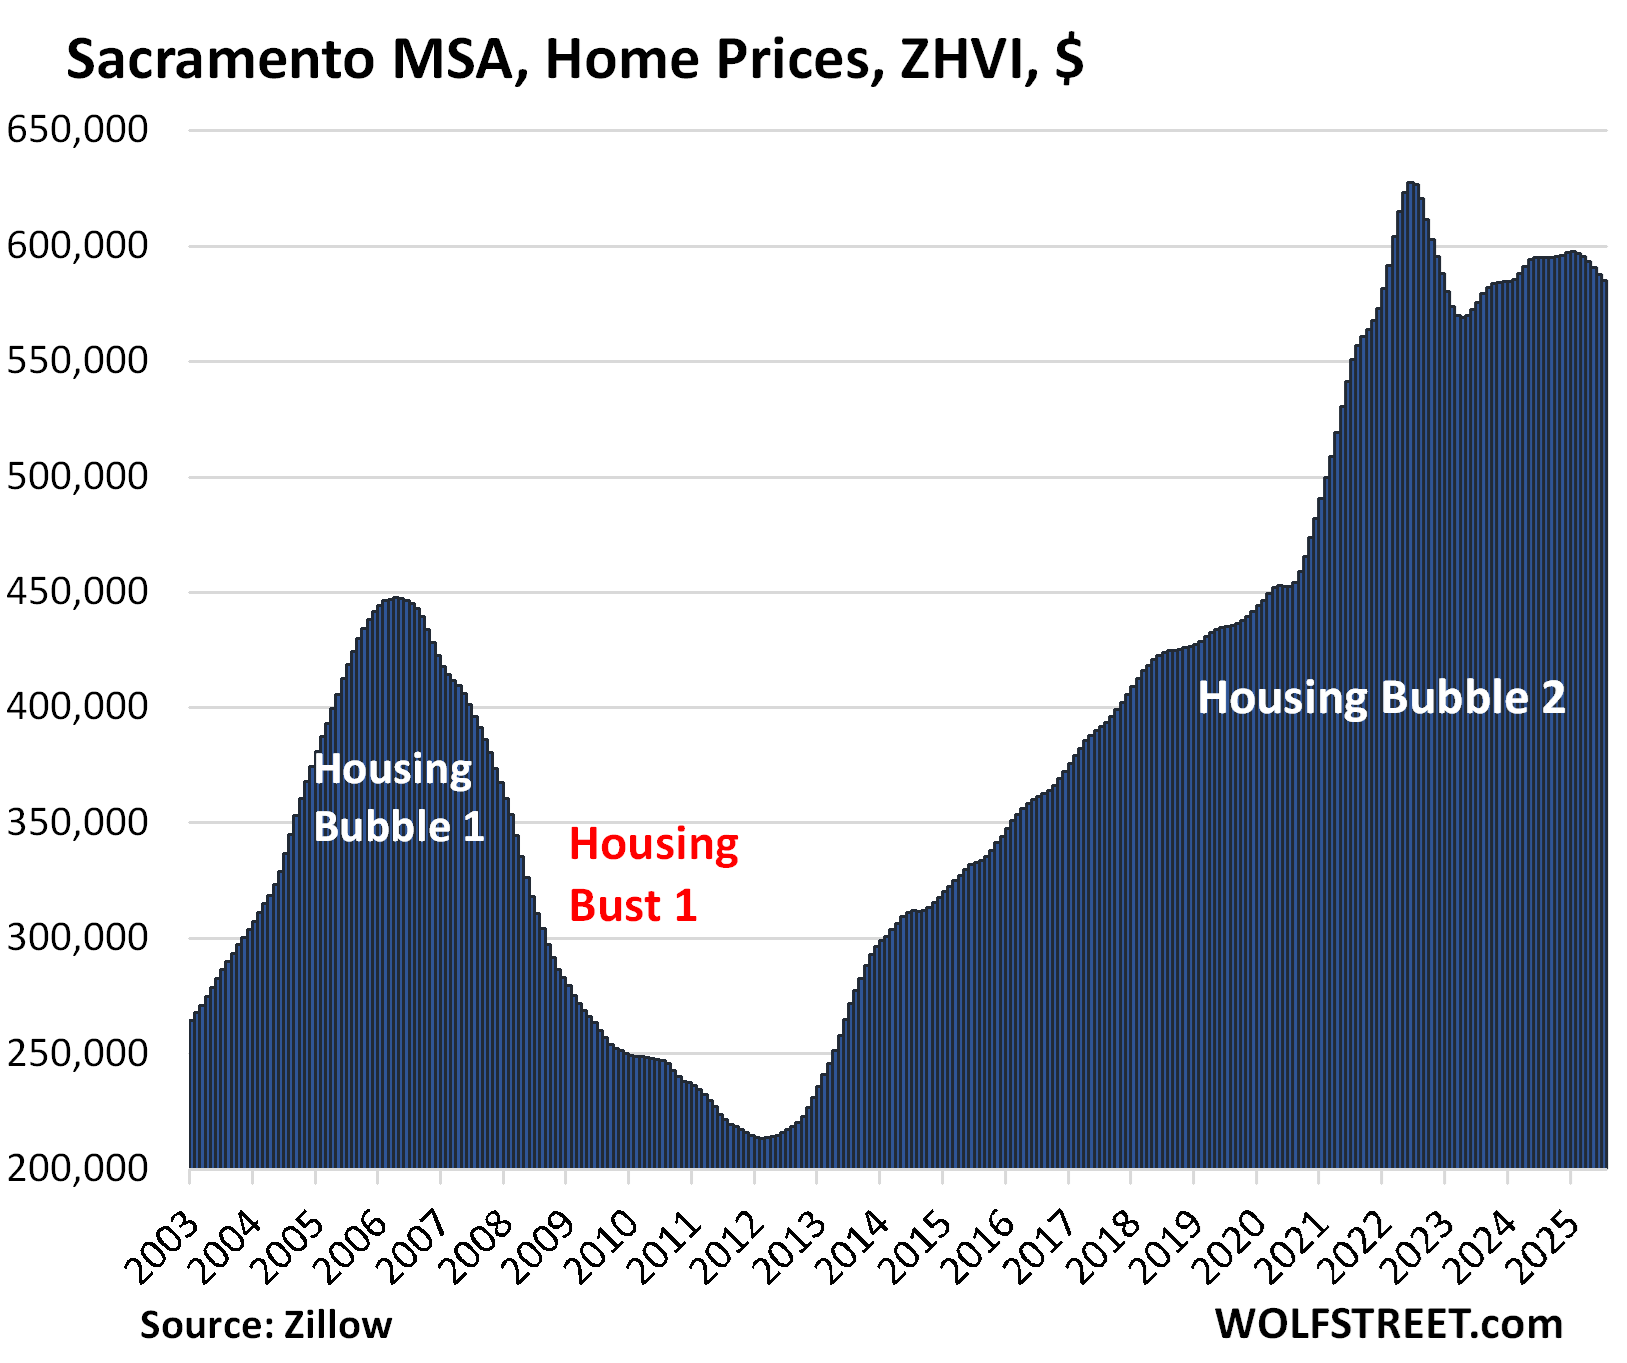
And inventory in the Sacramento-Roseville-Folsom MSA:
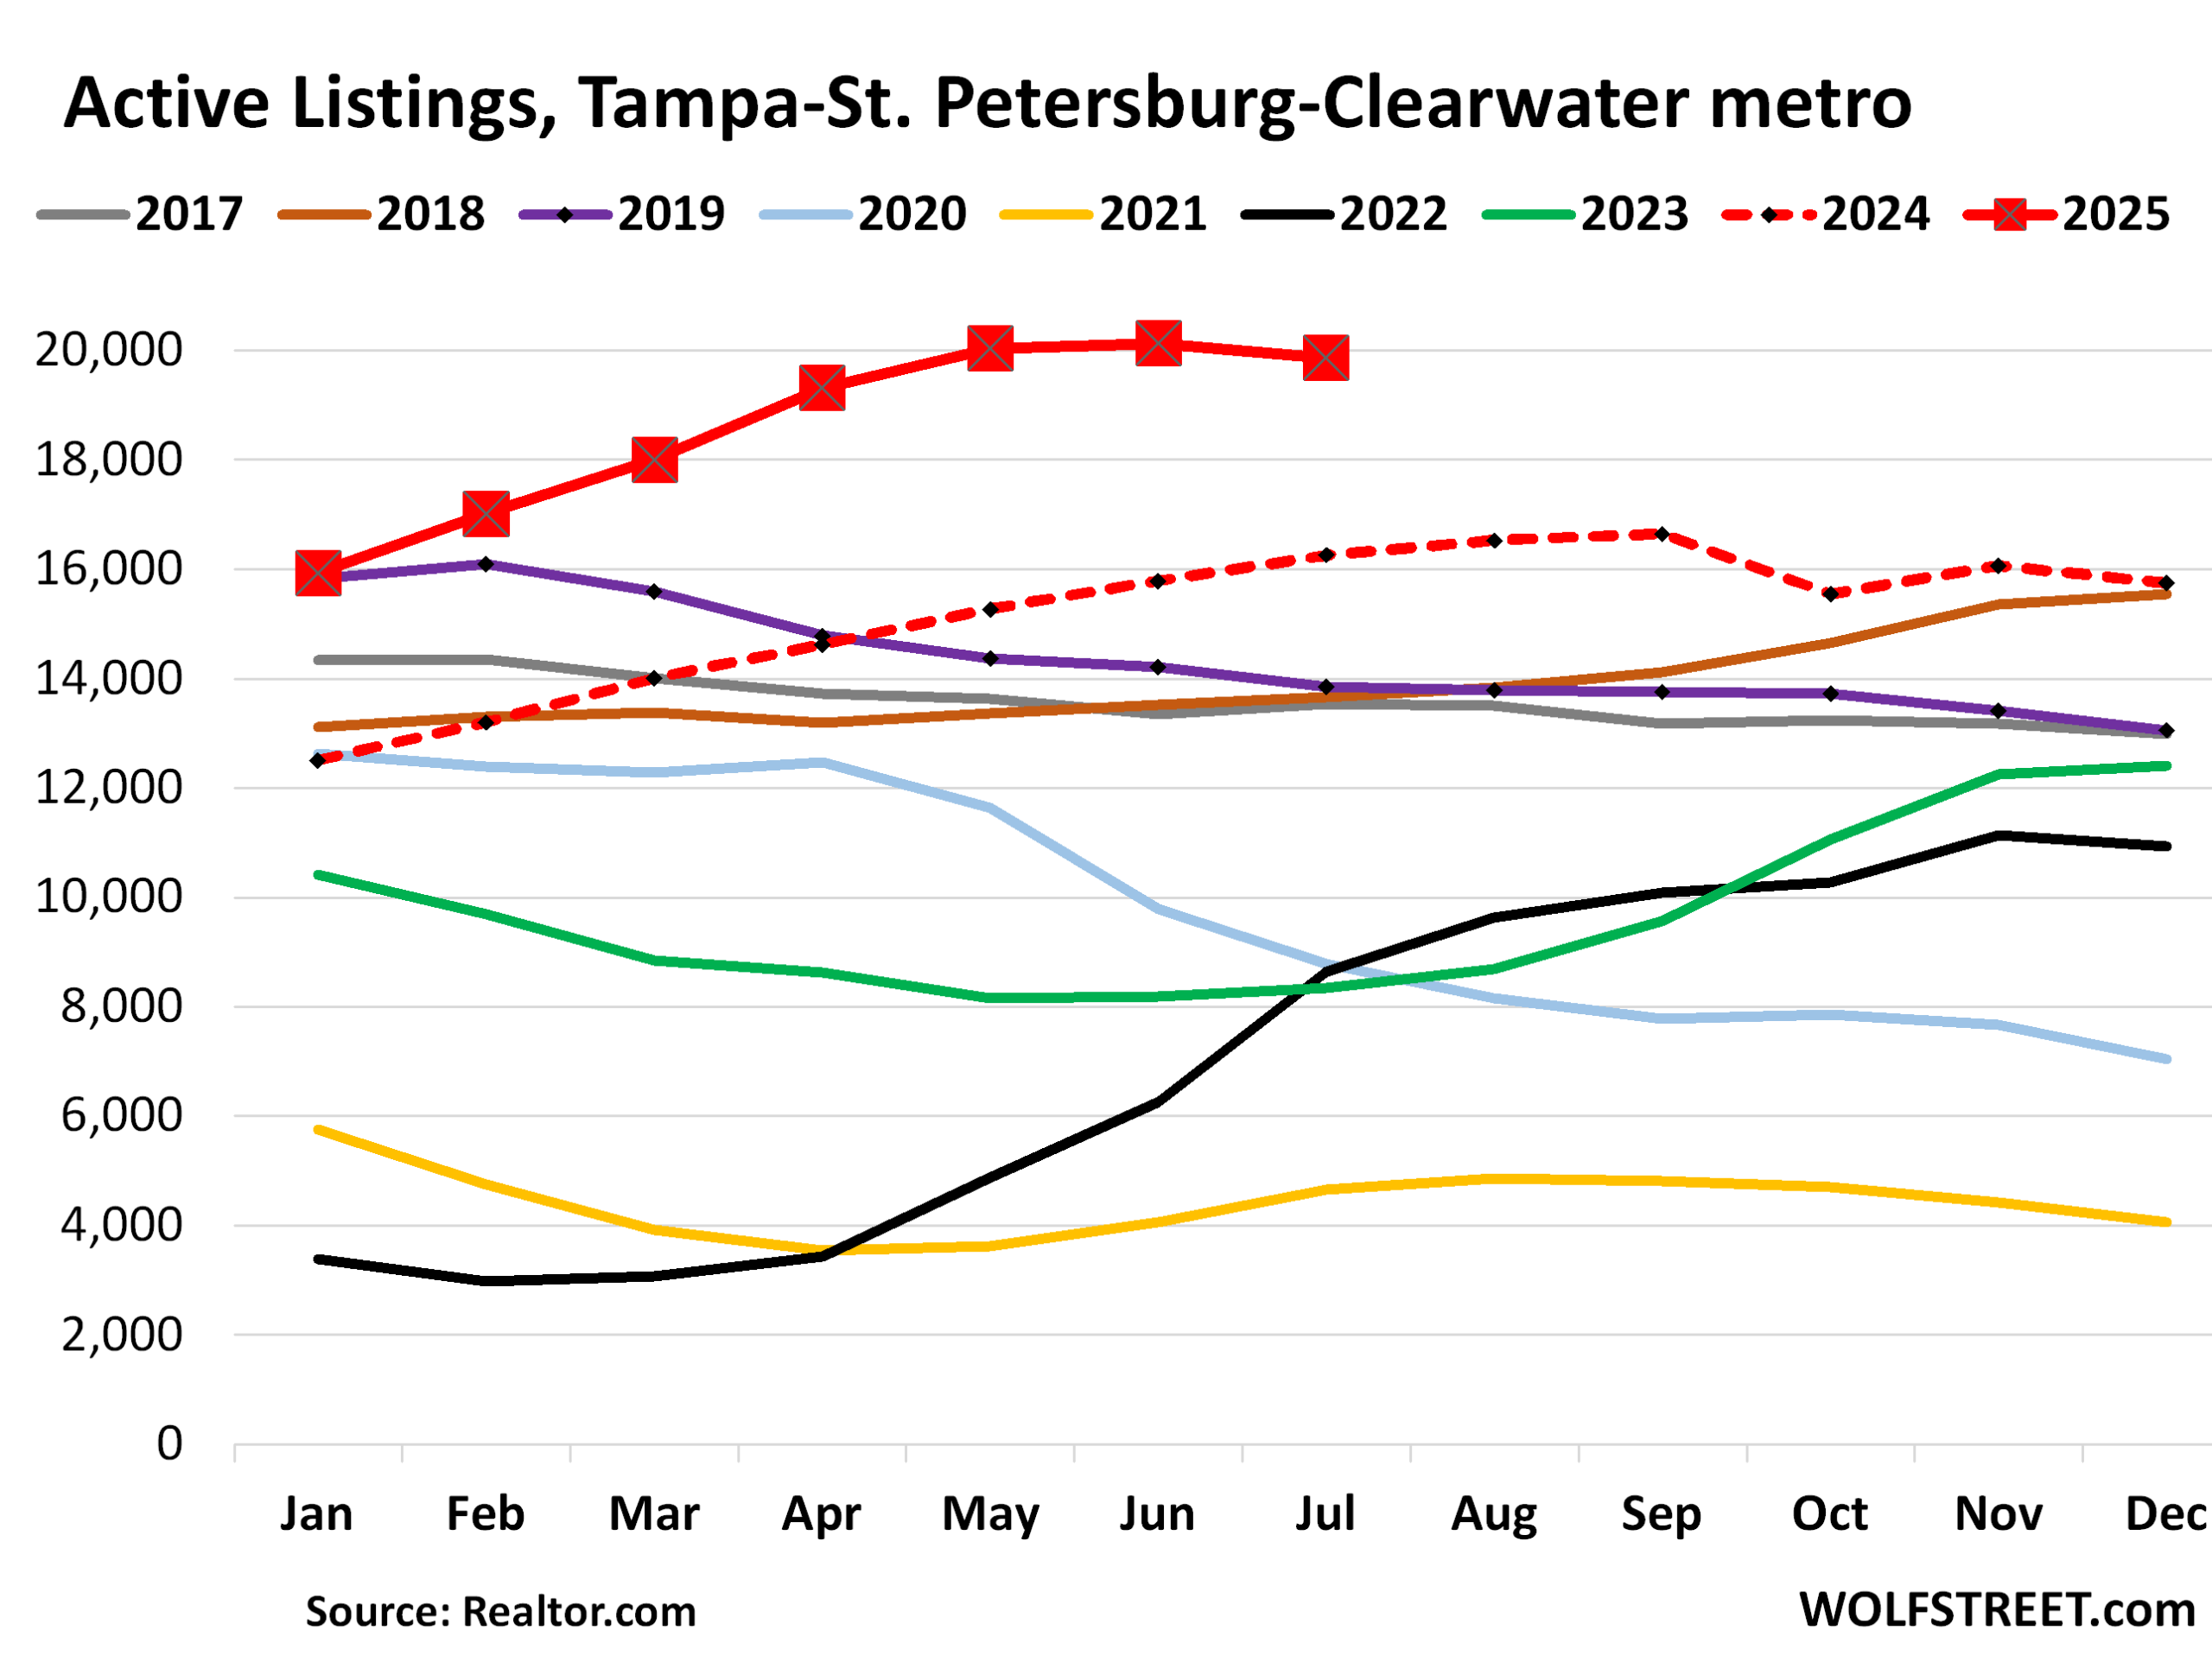
| Tampa MSA, Home Prices | ||||
| From Jul 2022 peak | MoM | YoY | Since 2000 | Jan 2020 – Jun 2022 |
| -5.3% | -0.8% | -5.7% | 258% | 60% |
Prices exploded by 60% in the 2.5 years between January 2020 and June 2022.
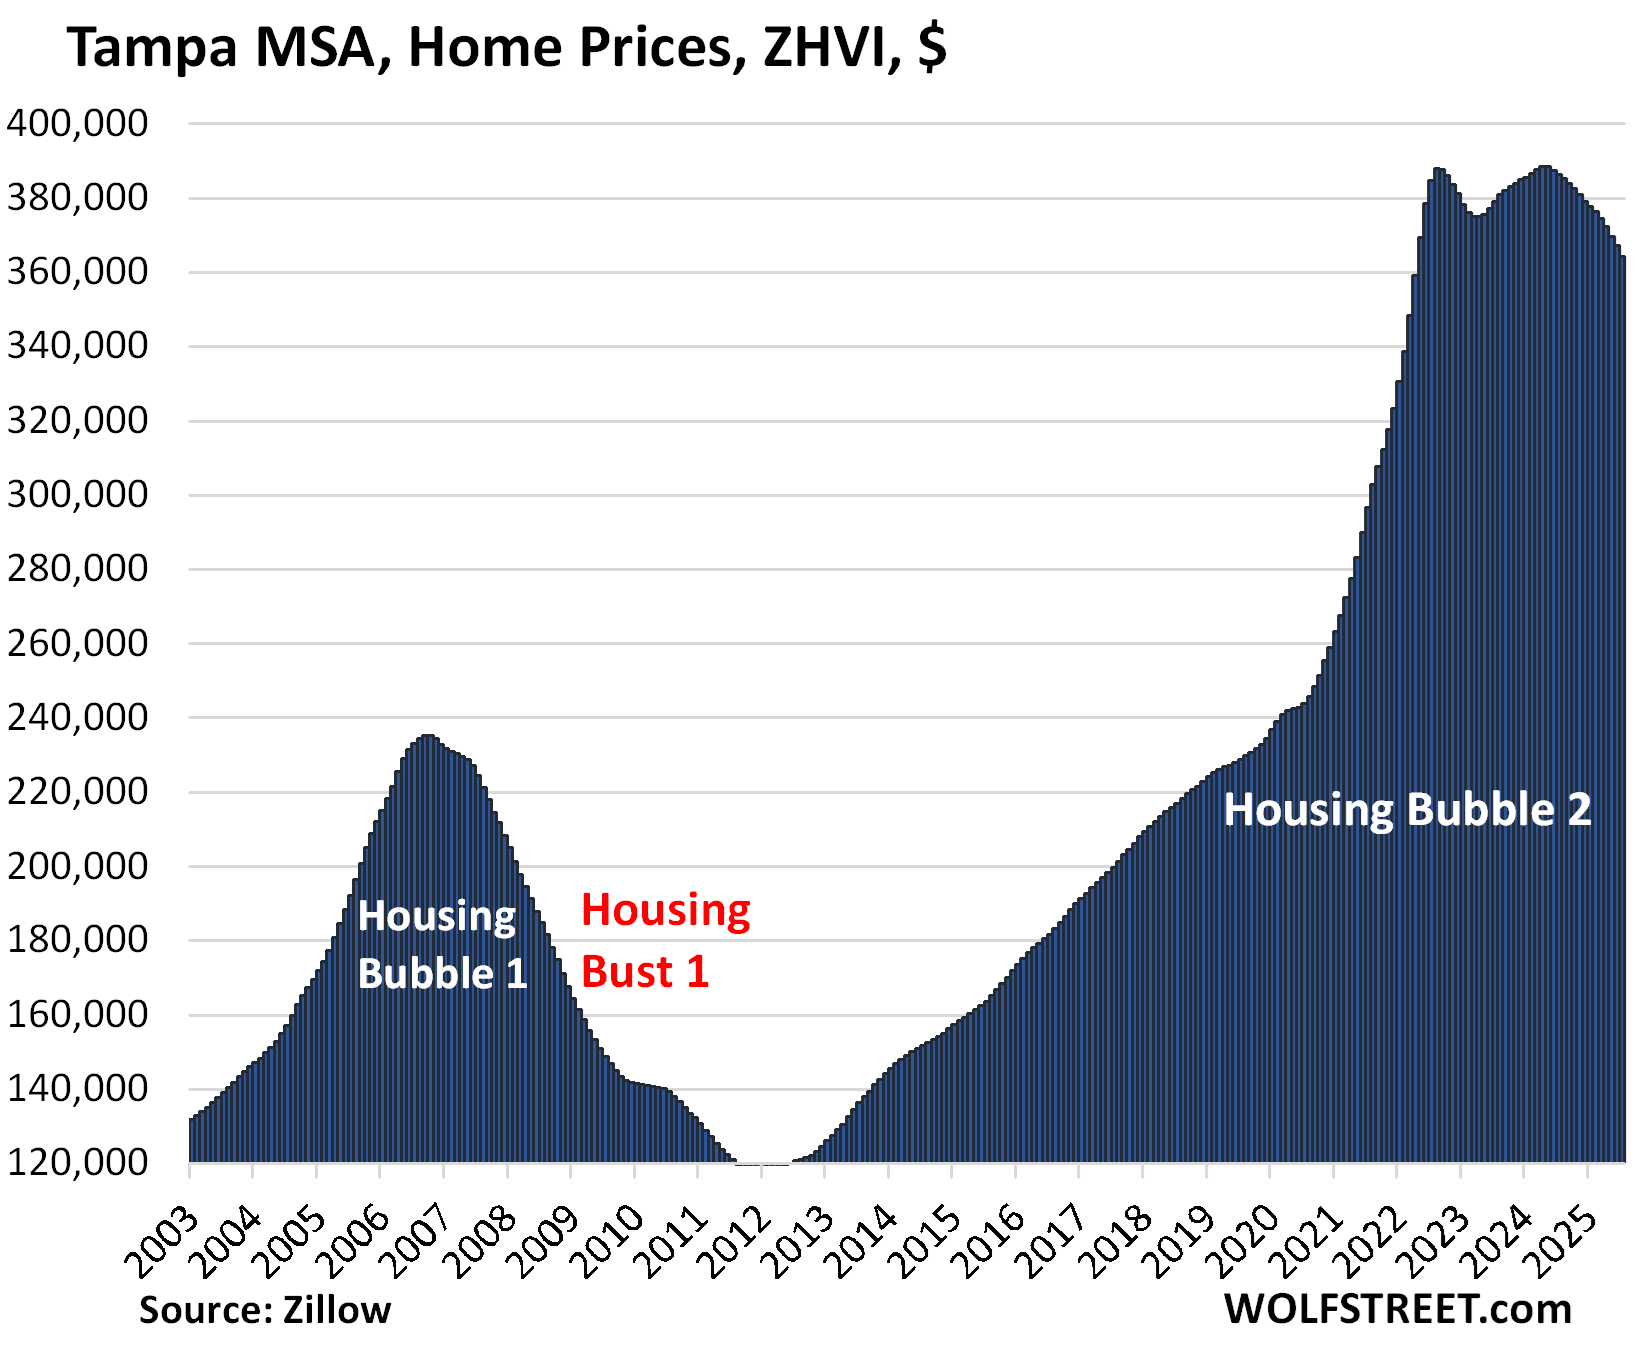
And inventory in the Tampa-Saint Petersburg-Clearwater MSA (detailed discussion of inventories in the big Florida metros is here):
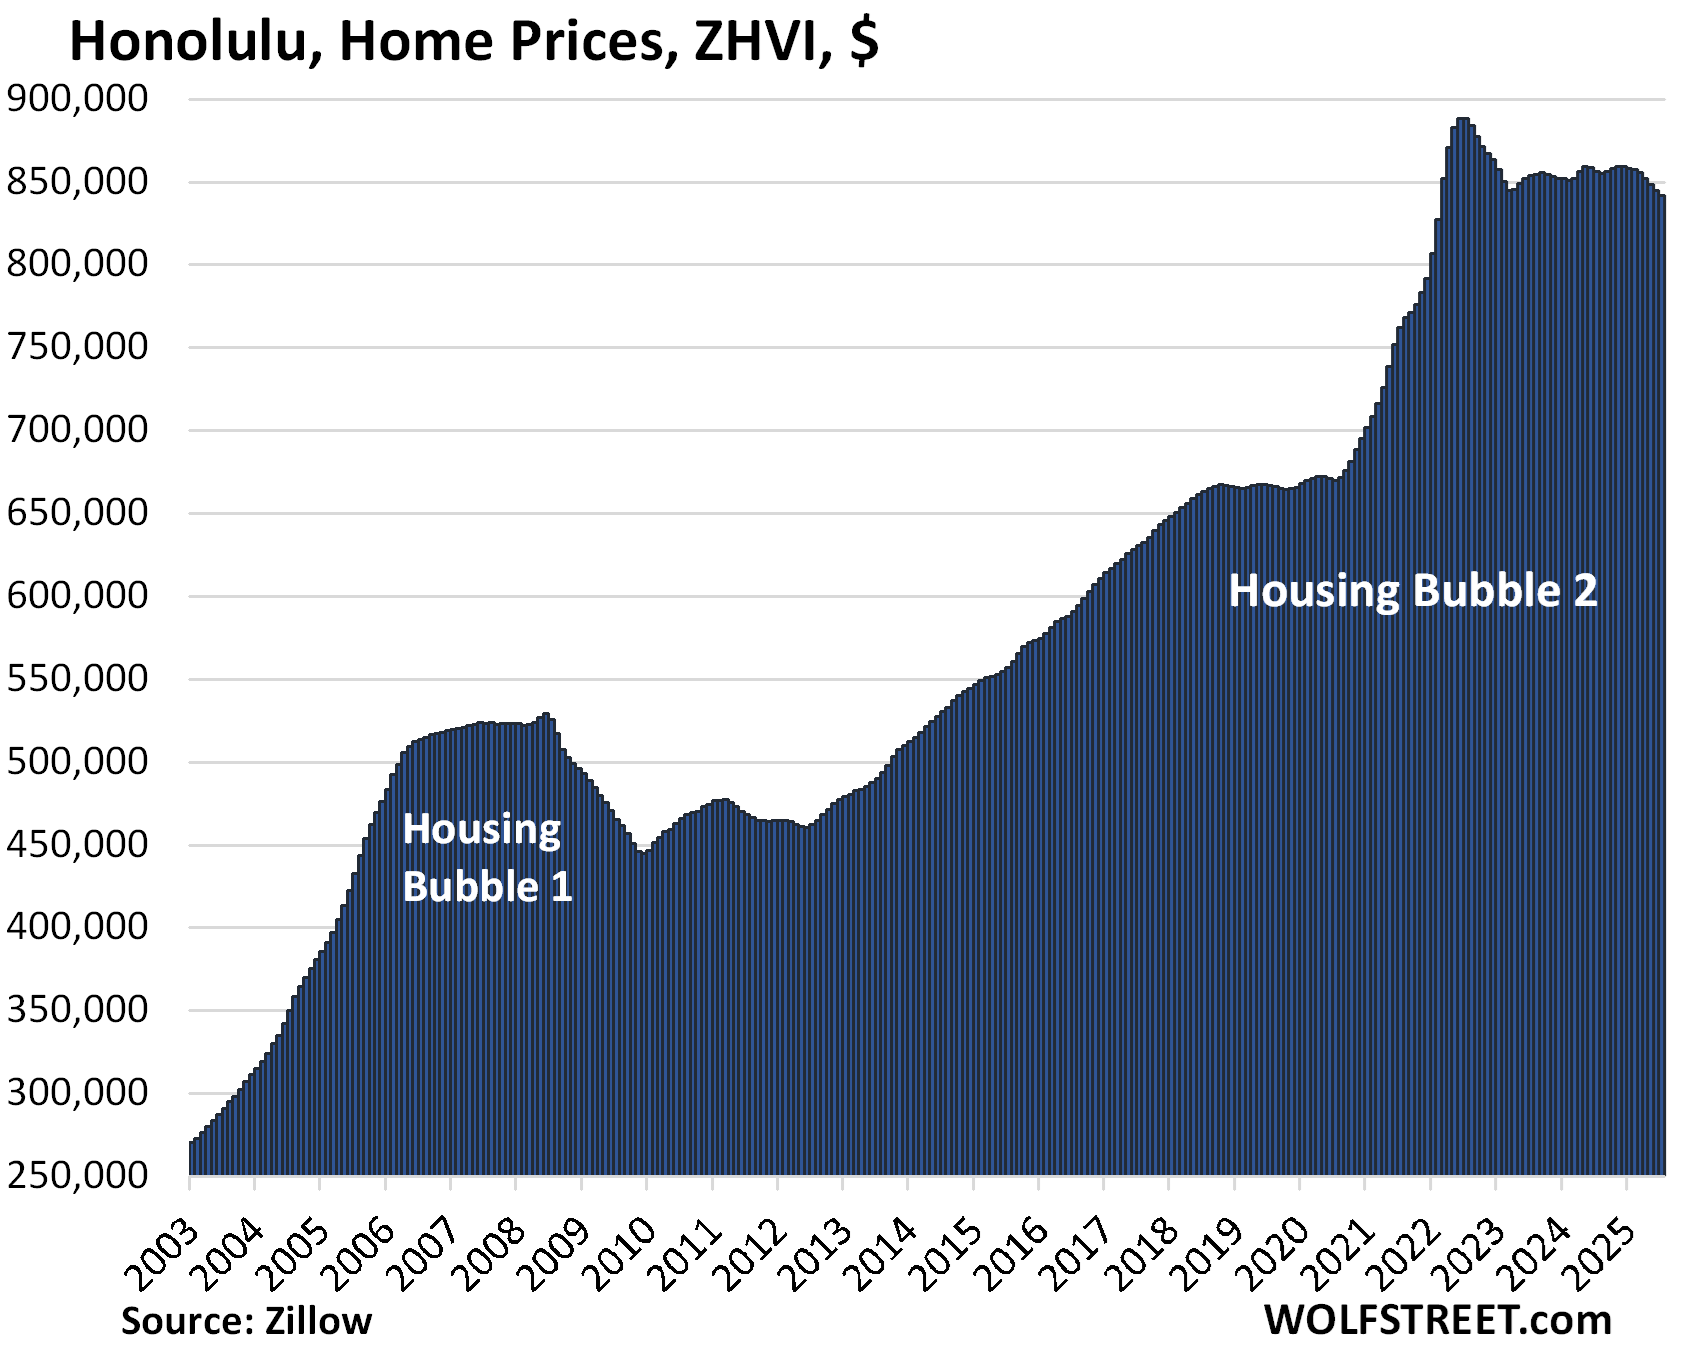
| Honolulu, Home Prices | ||||
| From Jun 2022 peak | MoM | YoY | Since 2000 | Jan 2020 – Jun 2022 |
| -5.2% | -0.4% | -1.7% | 276% | 33% |
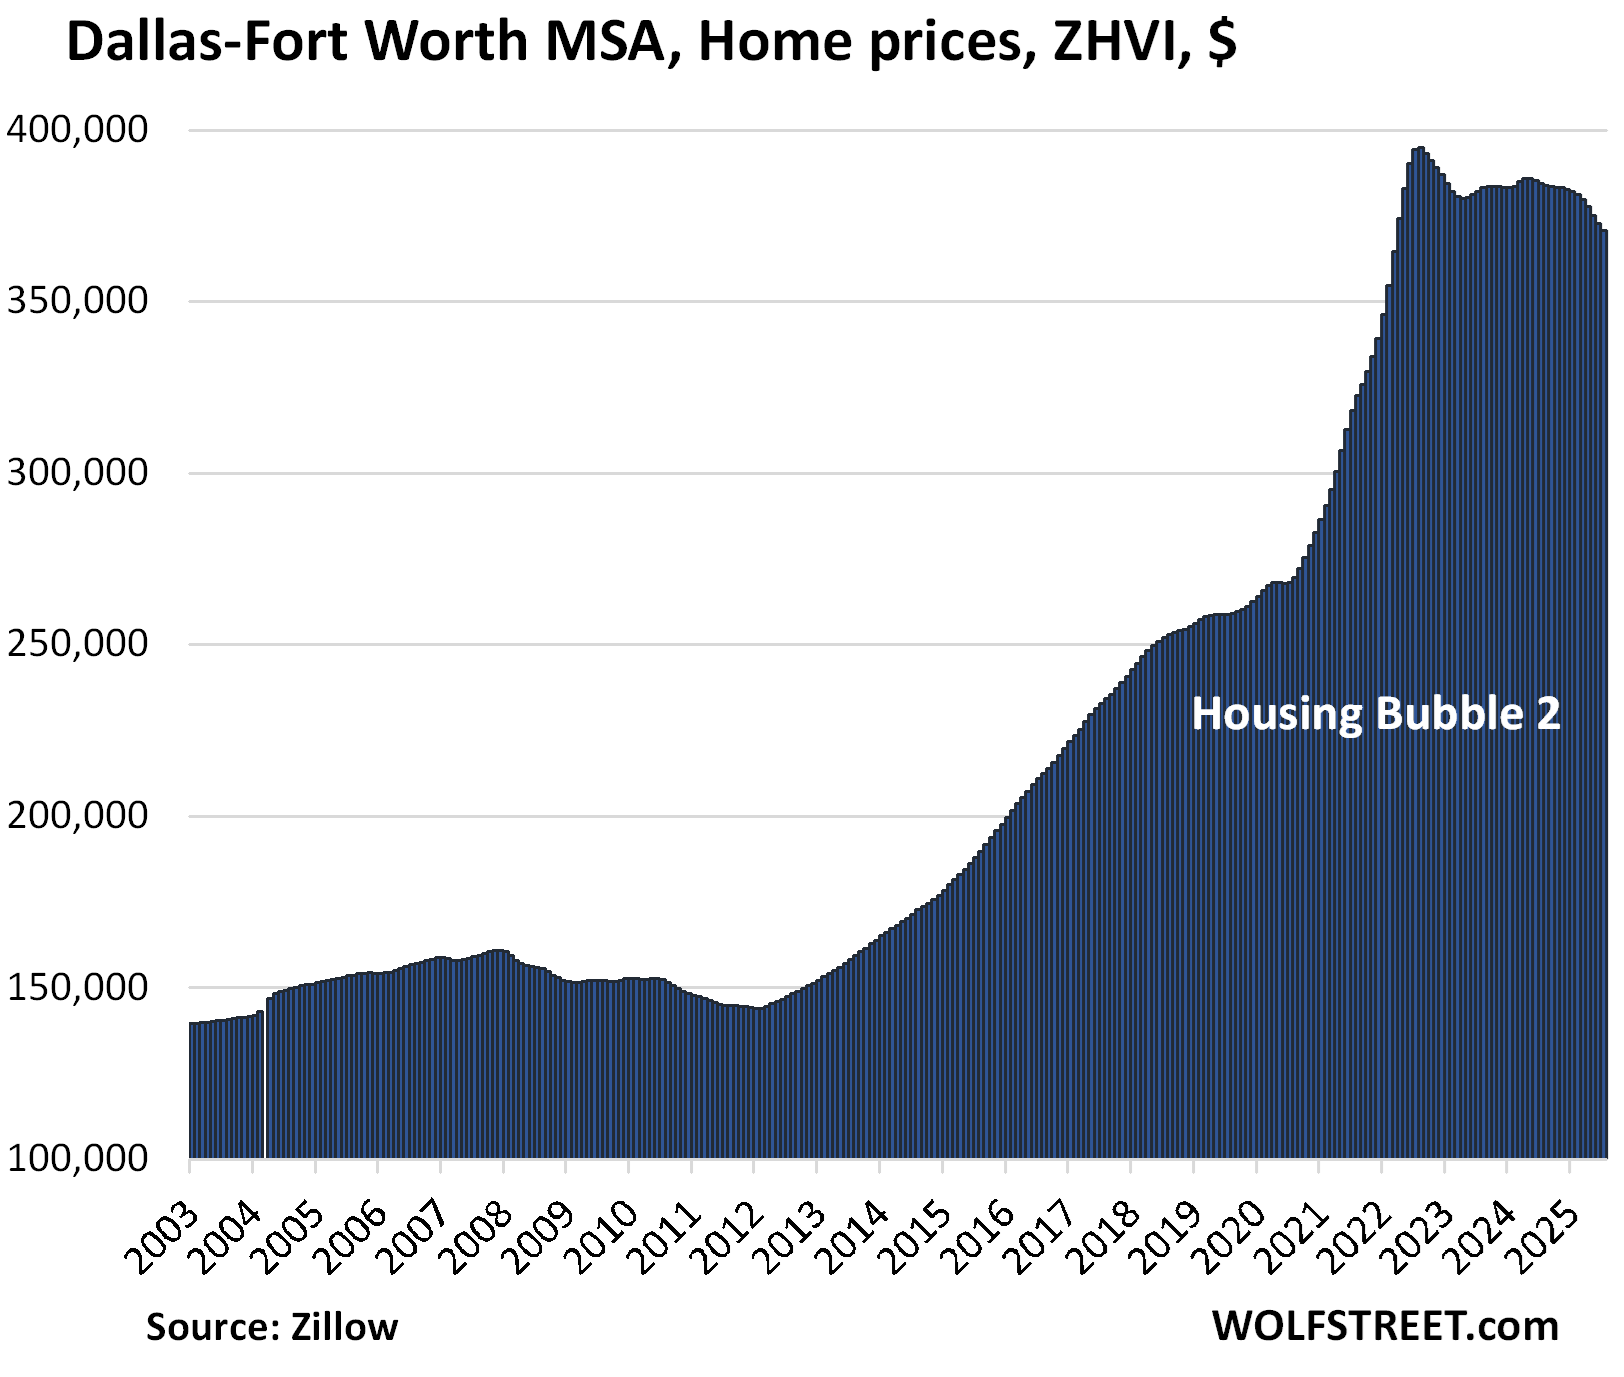
| Dallas-Fort Worth MSA, Home Prices | ||||
| From Jun 2022 peak | MoM | YoY | Since 2000 | Jan 2020 – Jun 2022 |
| -5.0% | -0.6% | -3.6% | 185% | 48% |
Prices exploded by 48% between January 2020 and June 2022.
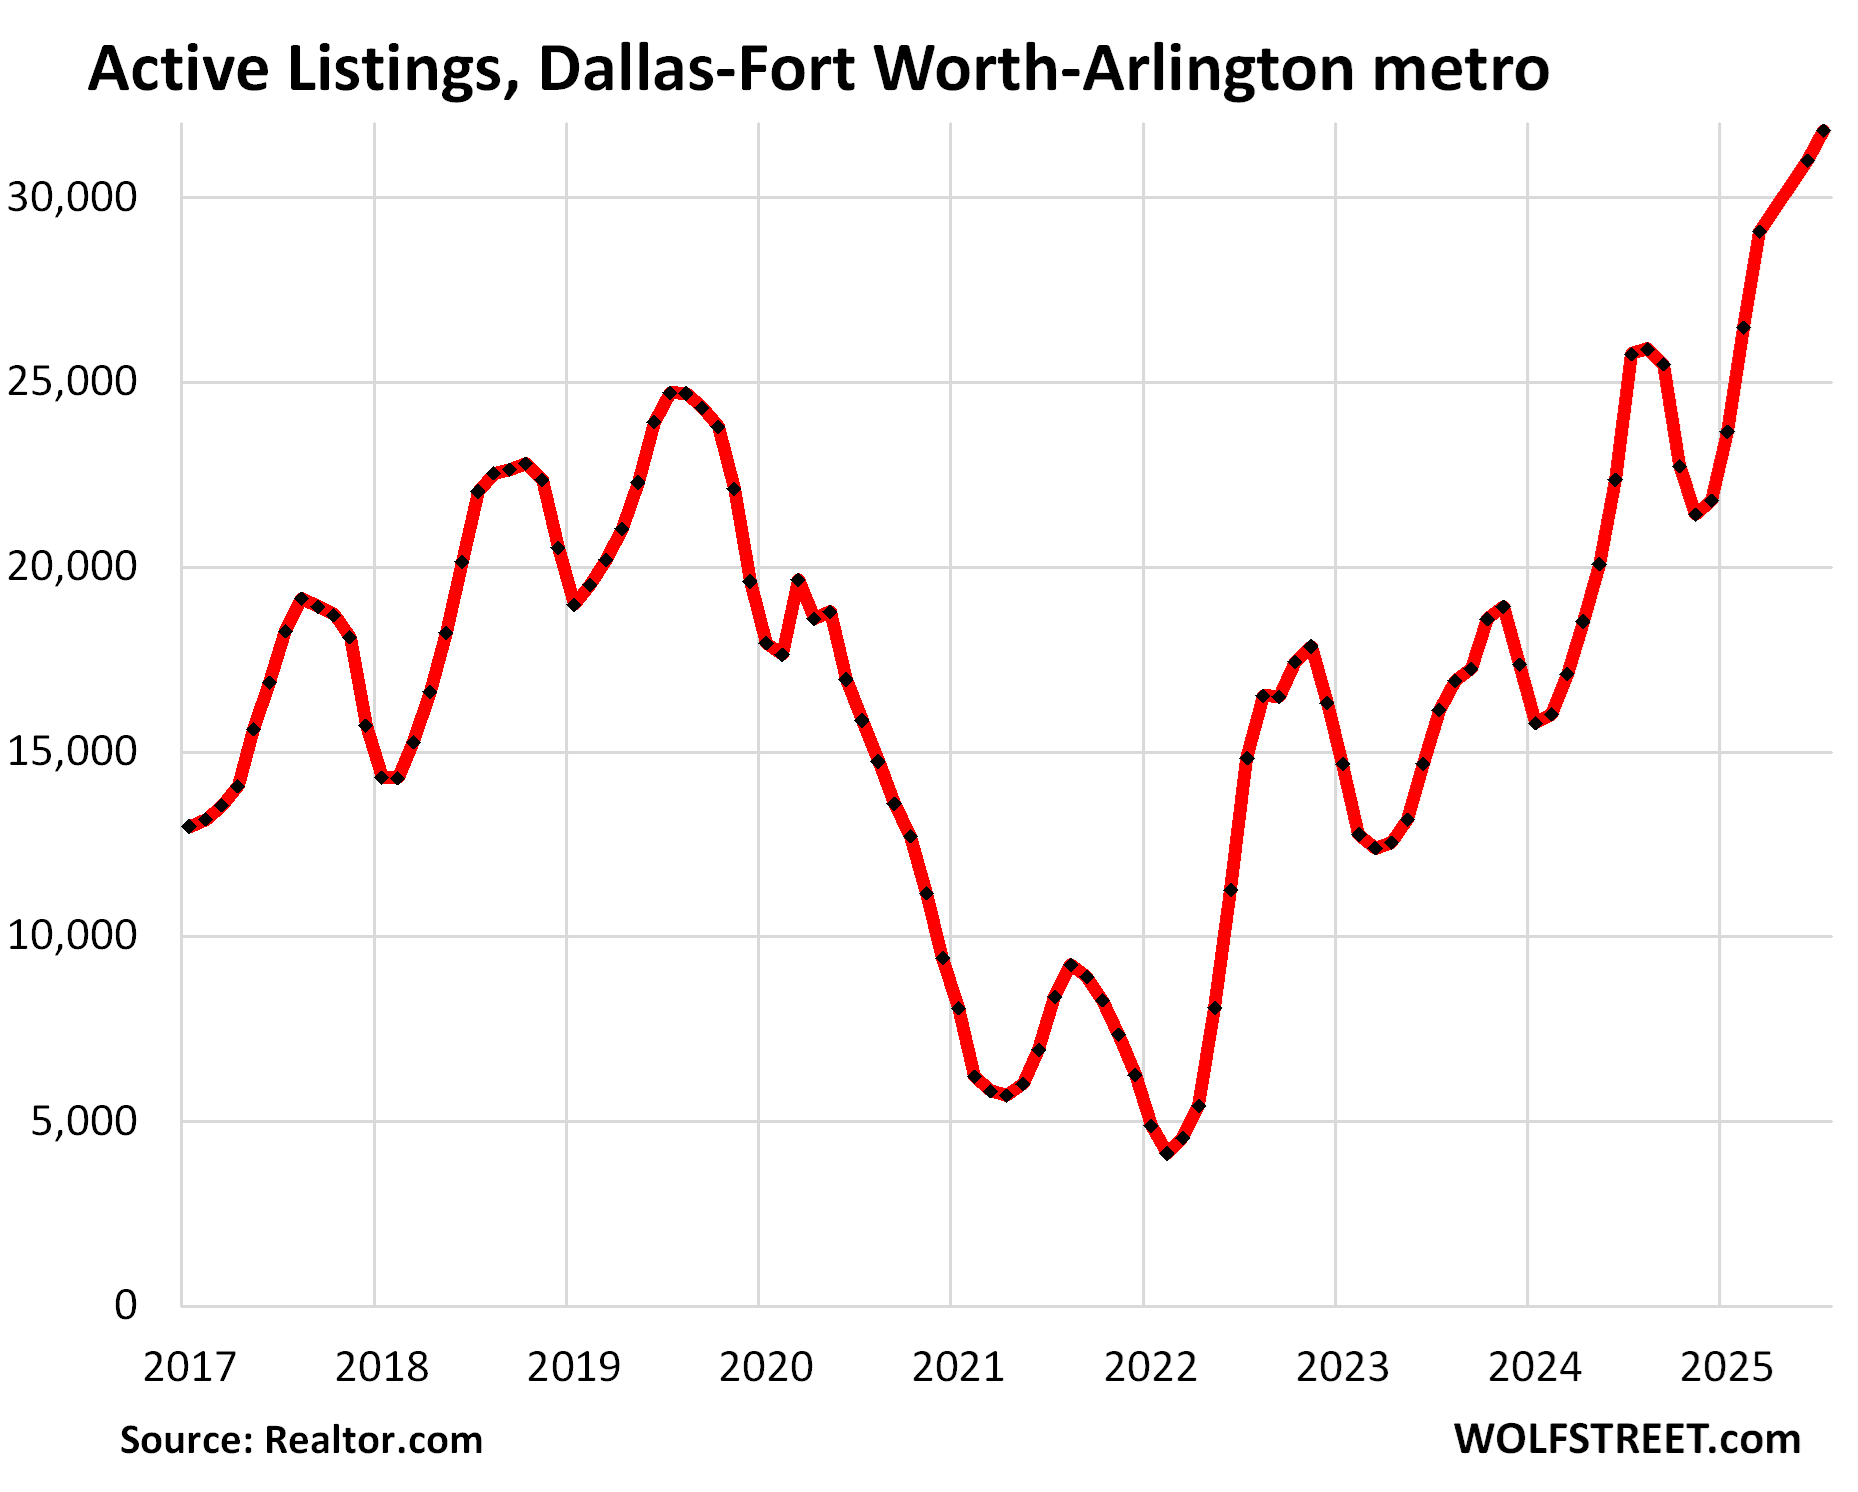
And here is the inventory situation in the Dallas-Fort Worth-Arlington metro:
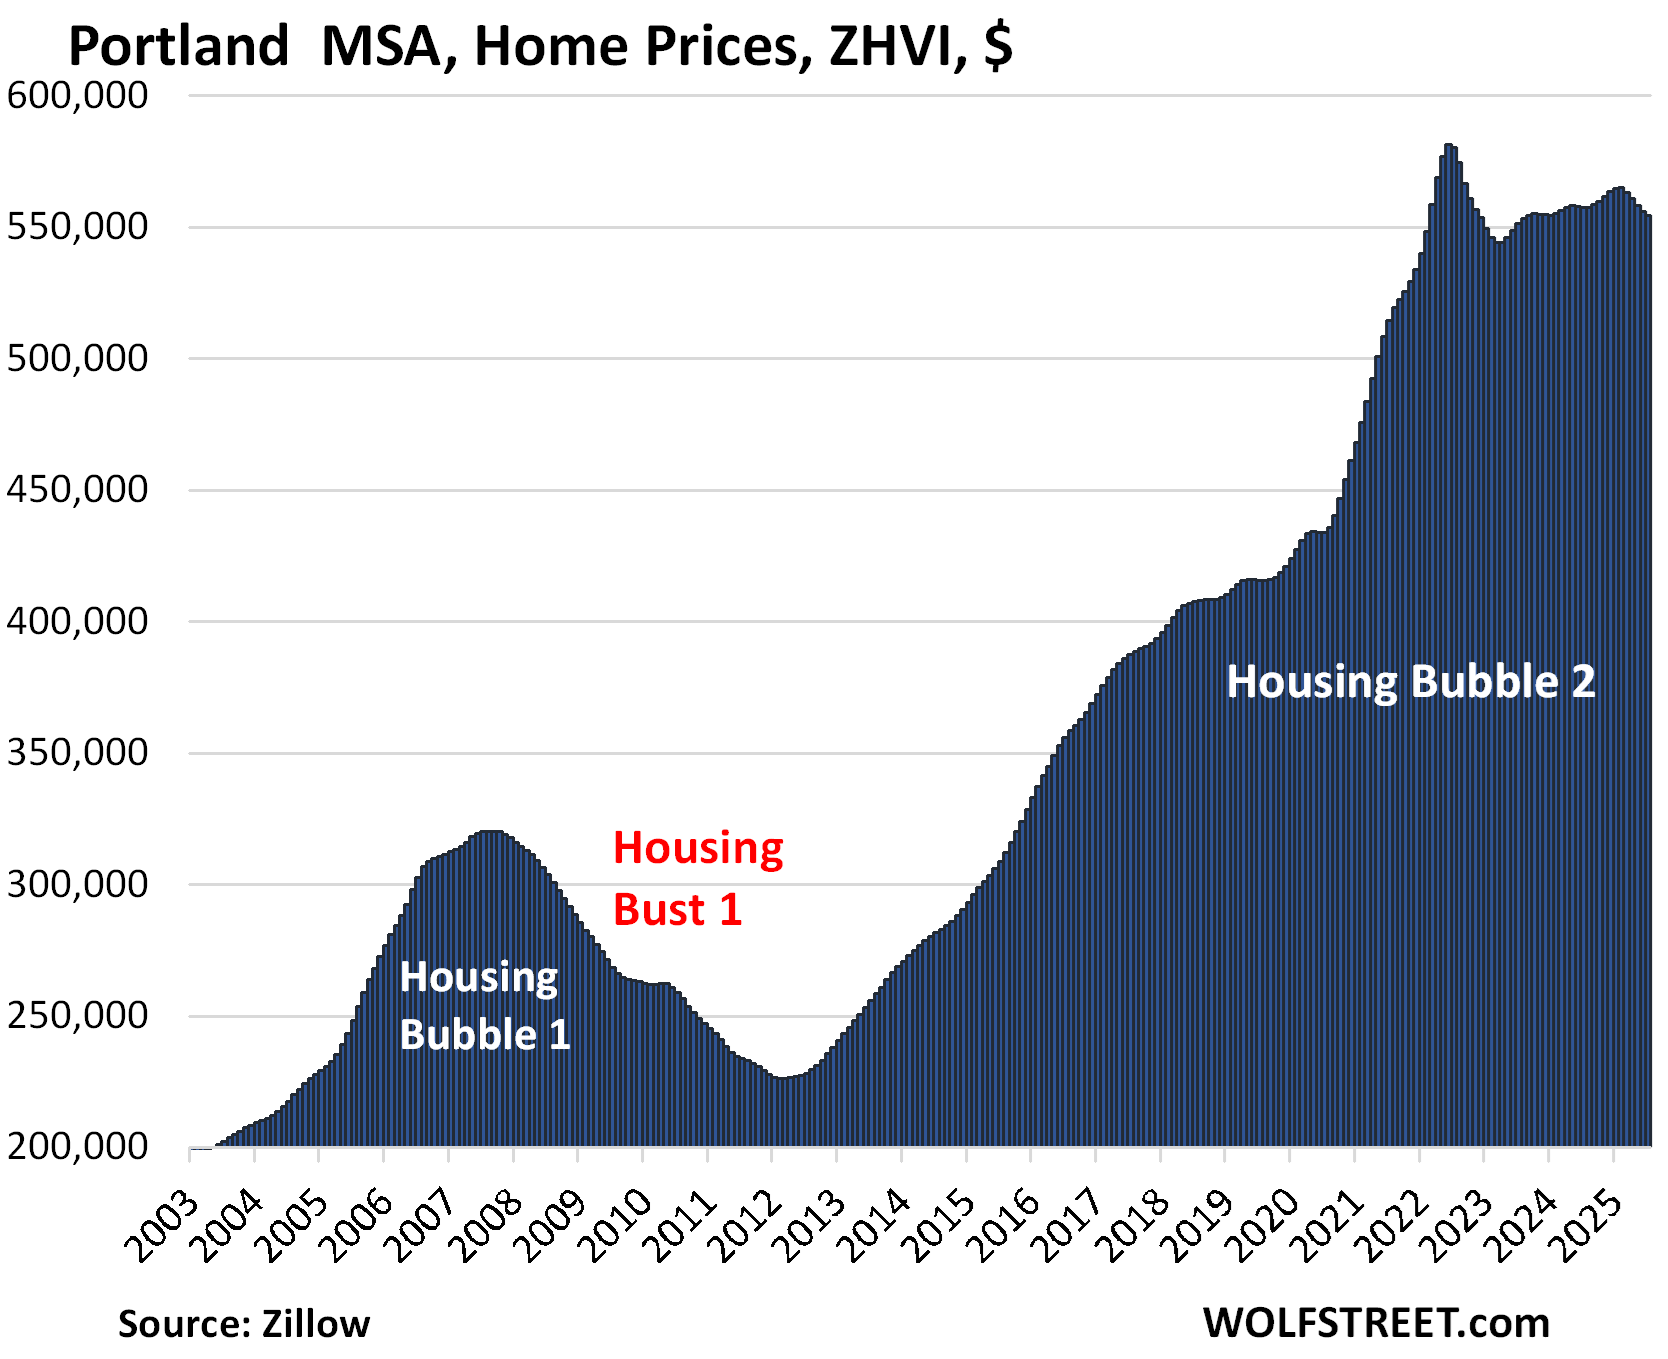
| Portland MSA, Home Prices | ||||
| From May 2022 peak | MoM | YoY | Since 2000 | Jan 2020 – Jun 2022 |
| -4.7% | -0.3% | -0.6% | 213% | 37% |
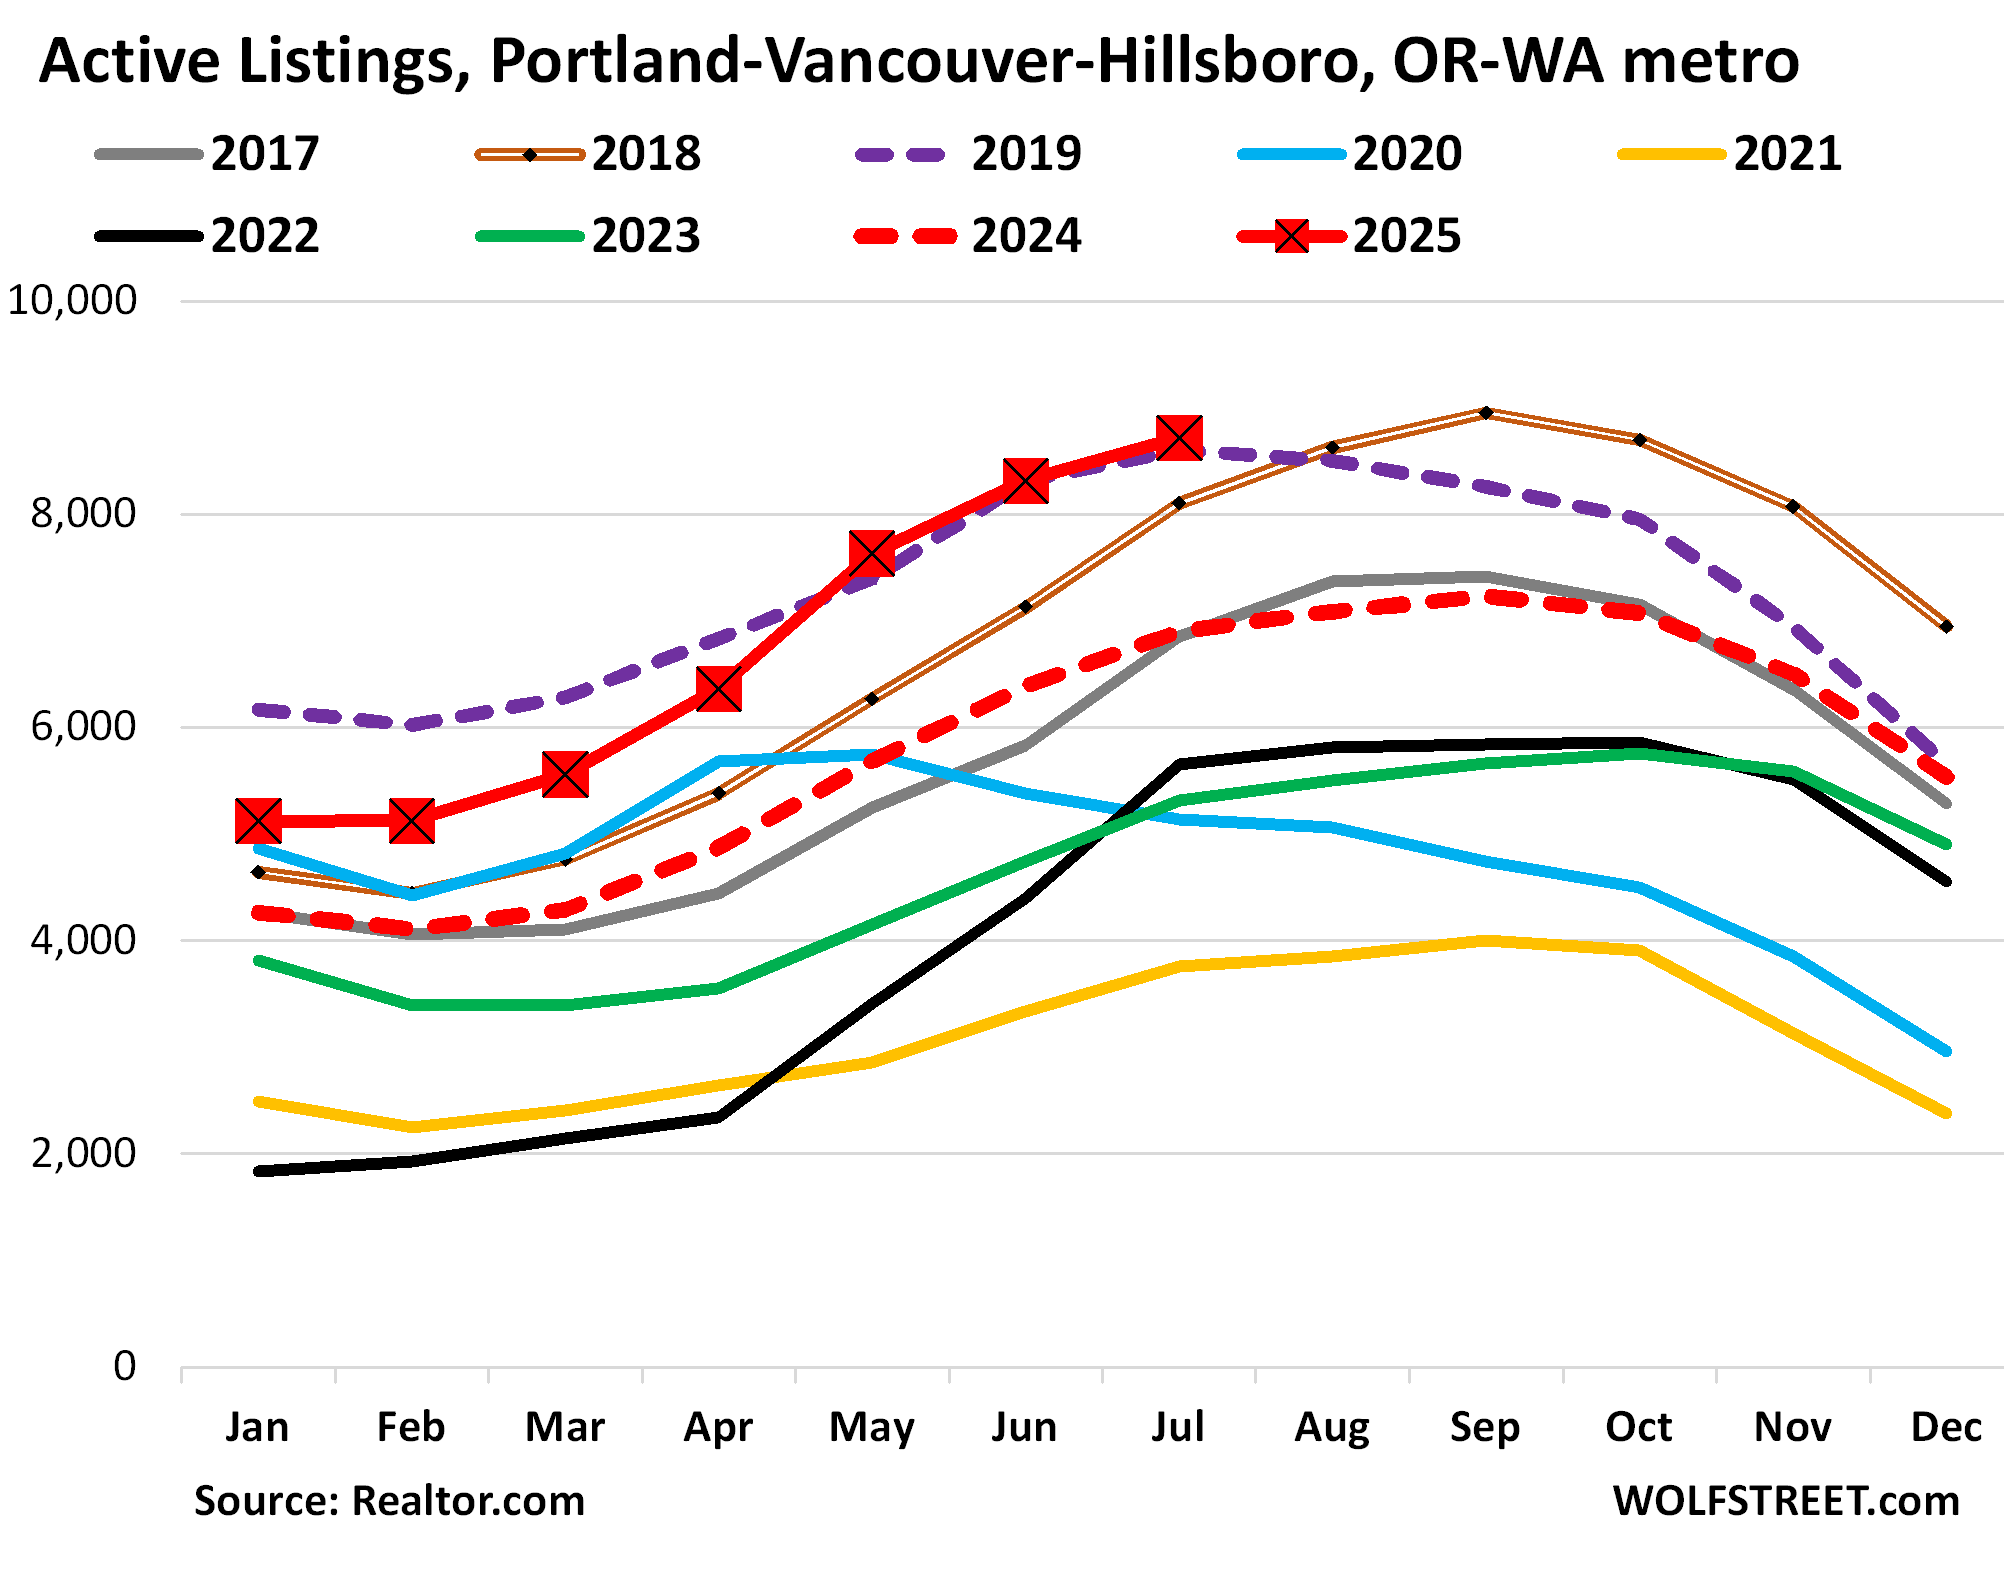
And the inventory situation in the Portland-Vancouver-Hillsboro metro:
| Salt Lake City MSA, Home Prices | ||||
| From July 2022 peak | MoM | YoY | Since 2000 | Jan 2020 – Jun 2022 |
| -3.7% | 0.0% | 1.3% | 214% | 54% |
Note the 54% price explosion from January 2020 through June 2022.
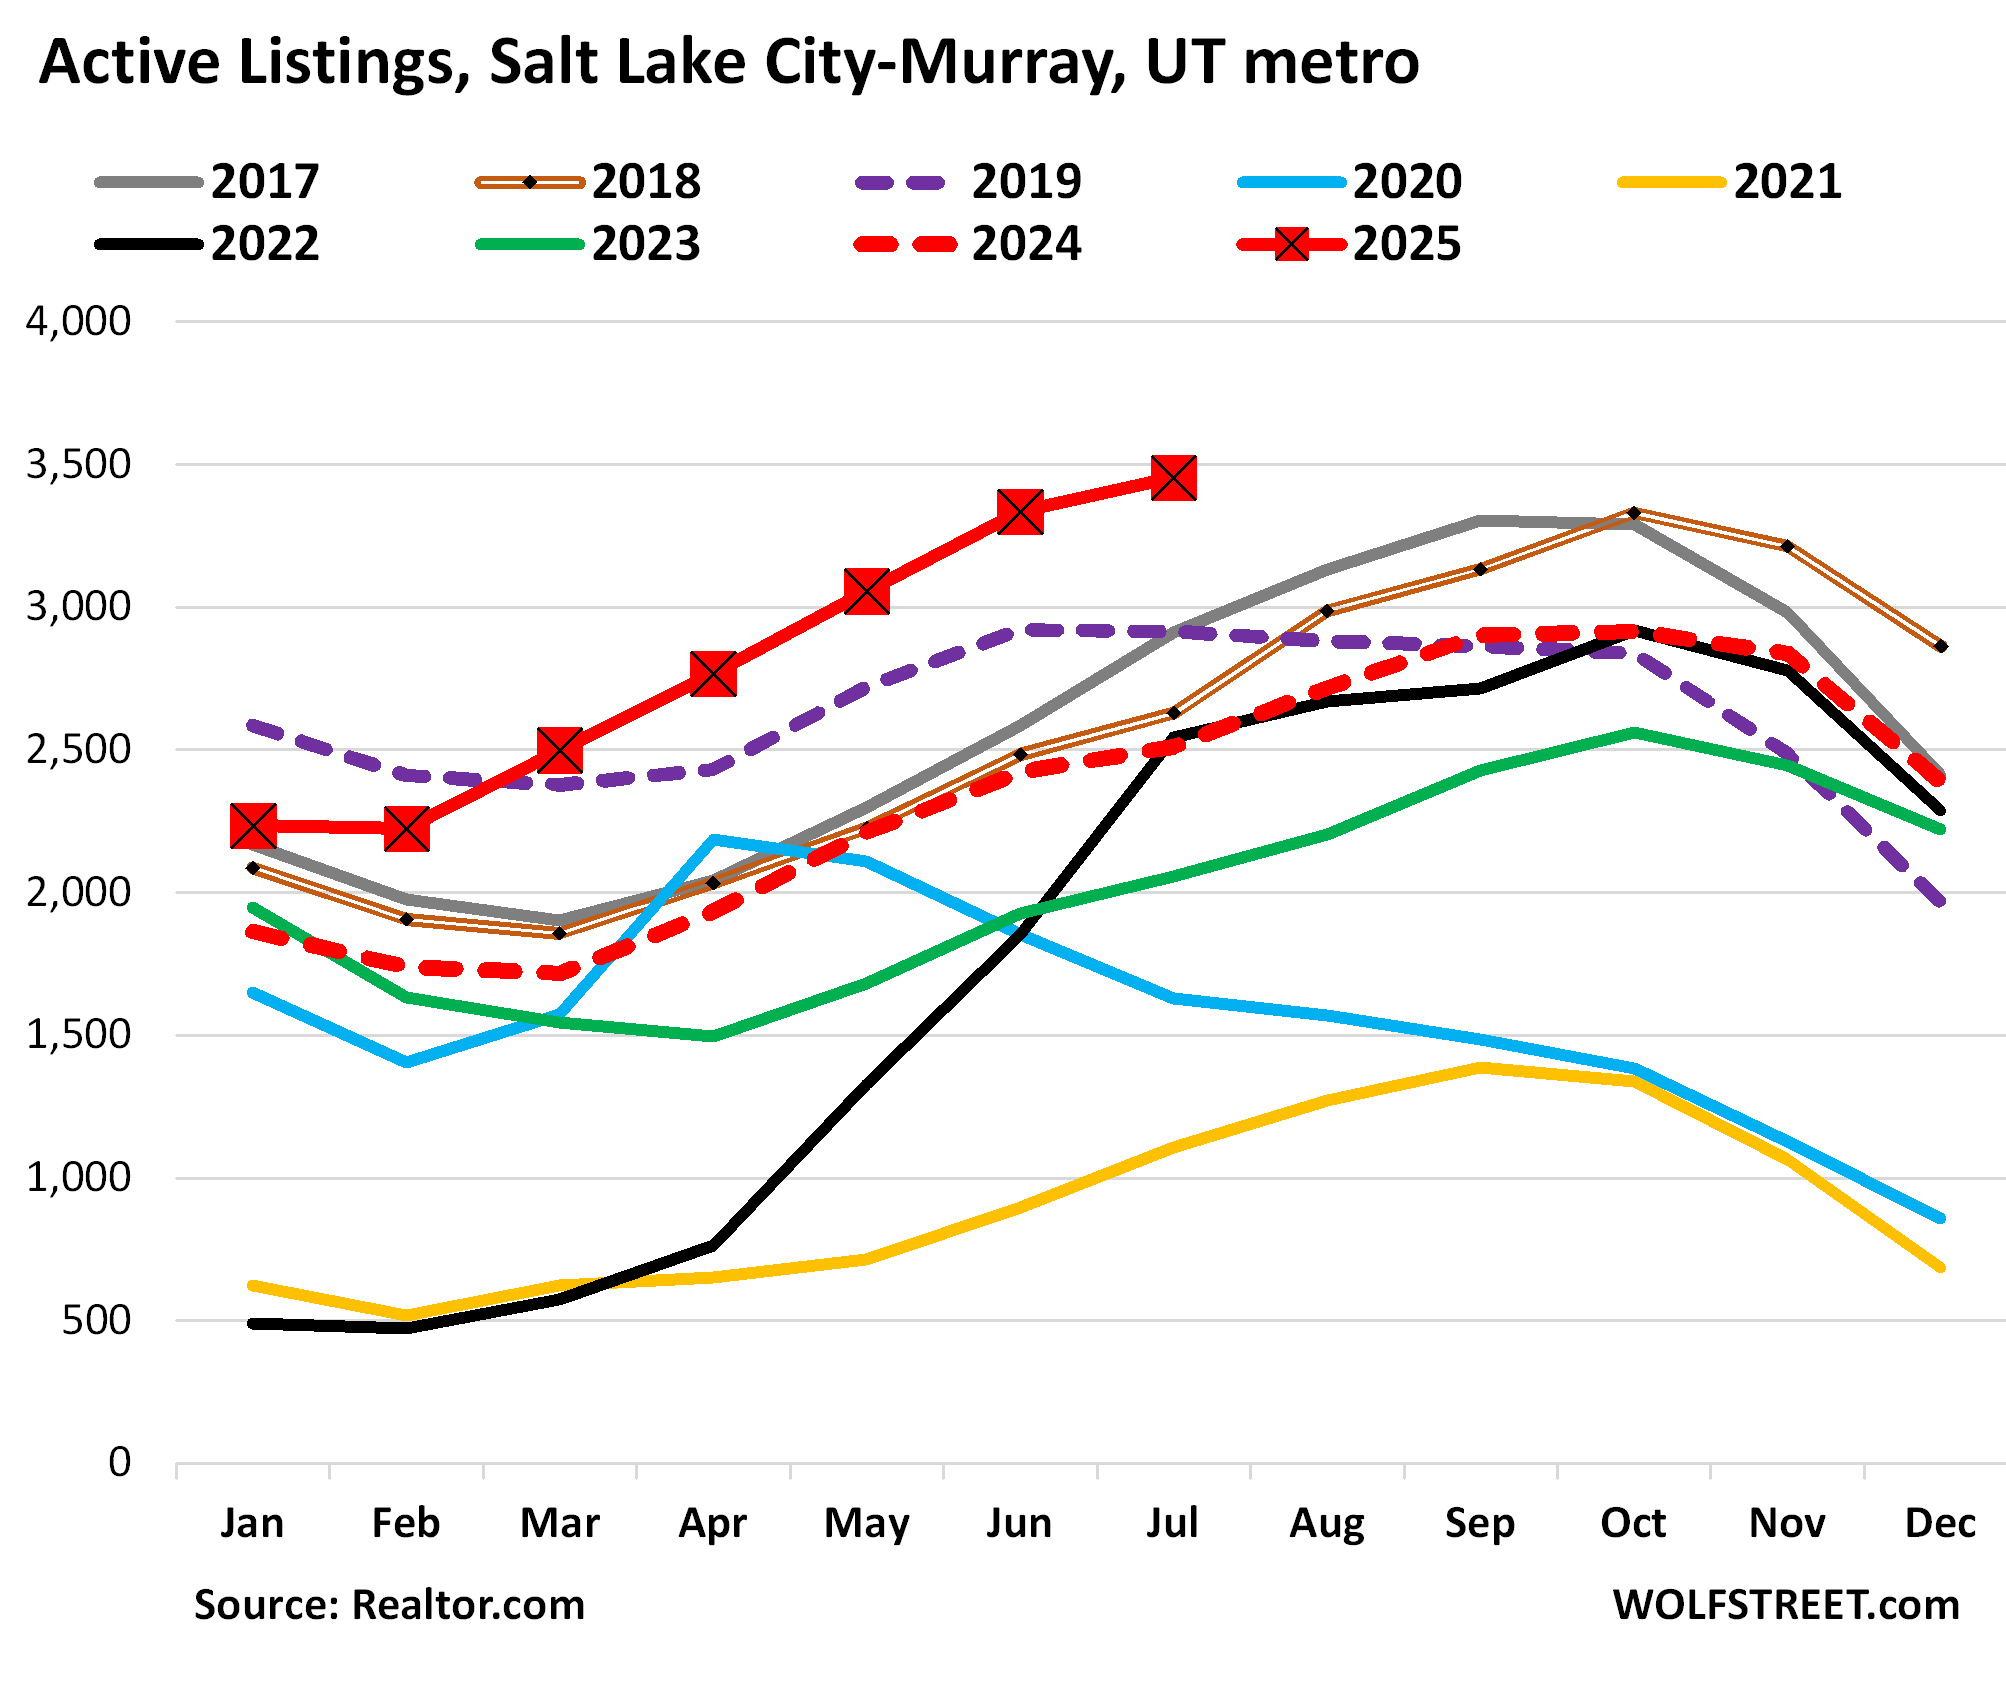
And inventories in the Salt Lake City-Murray MSA:
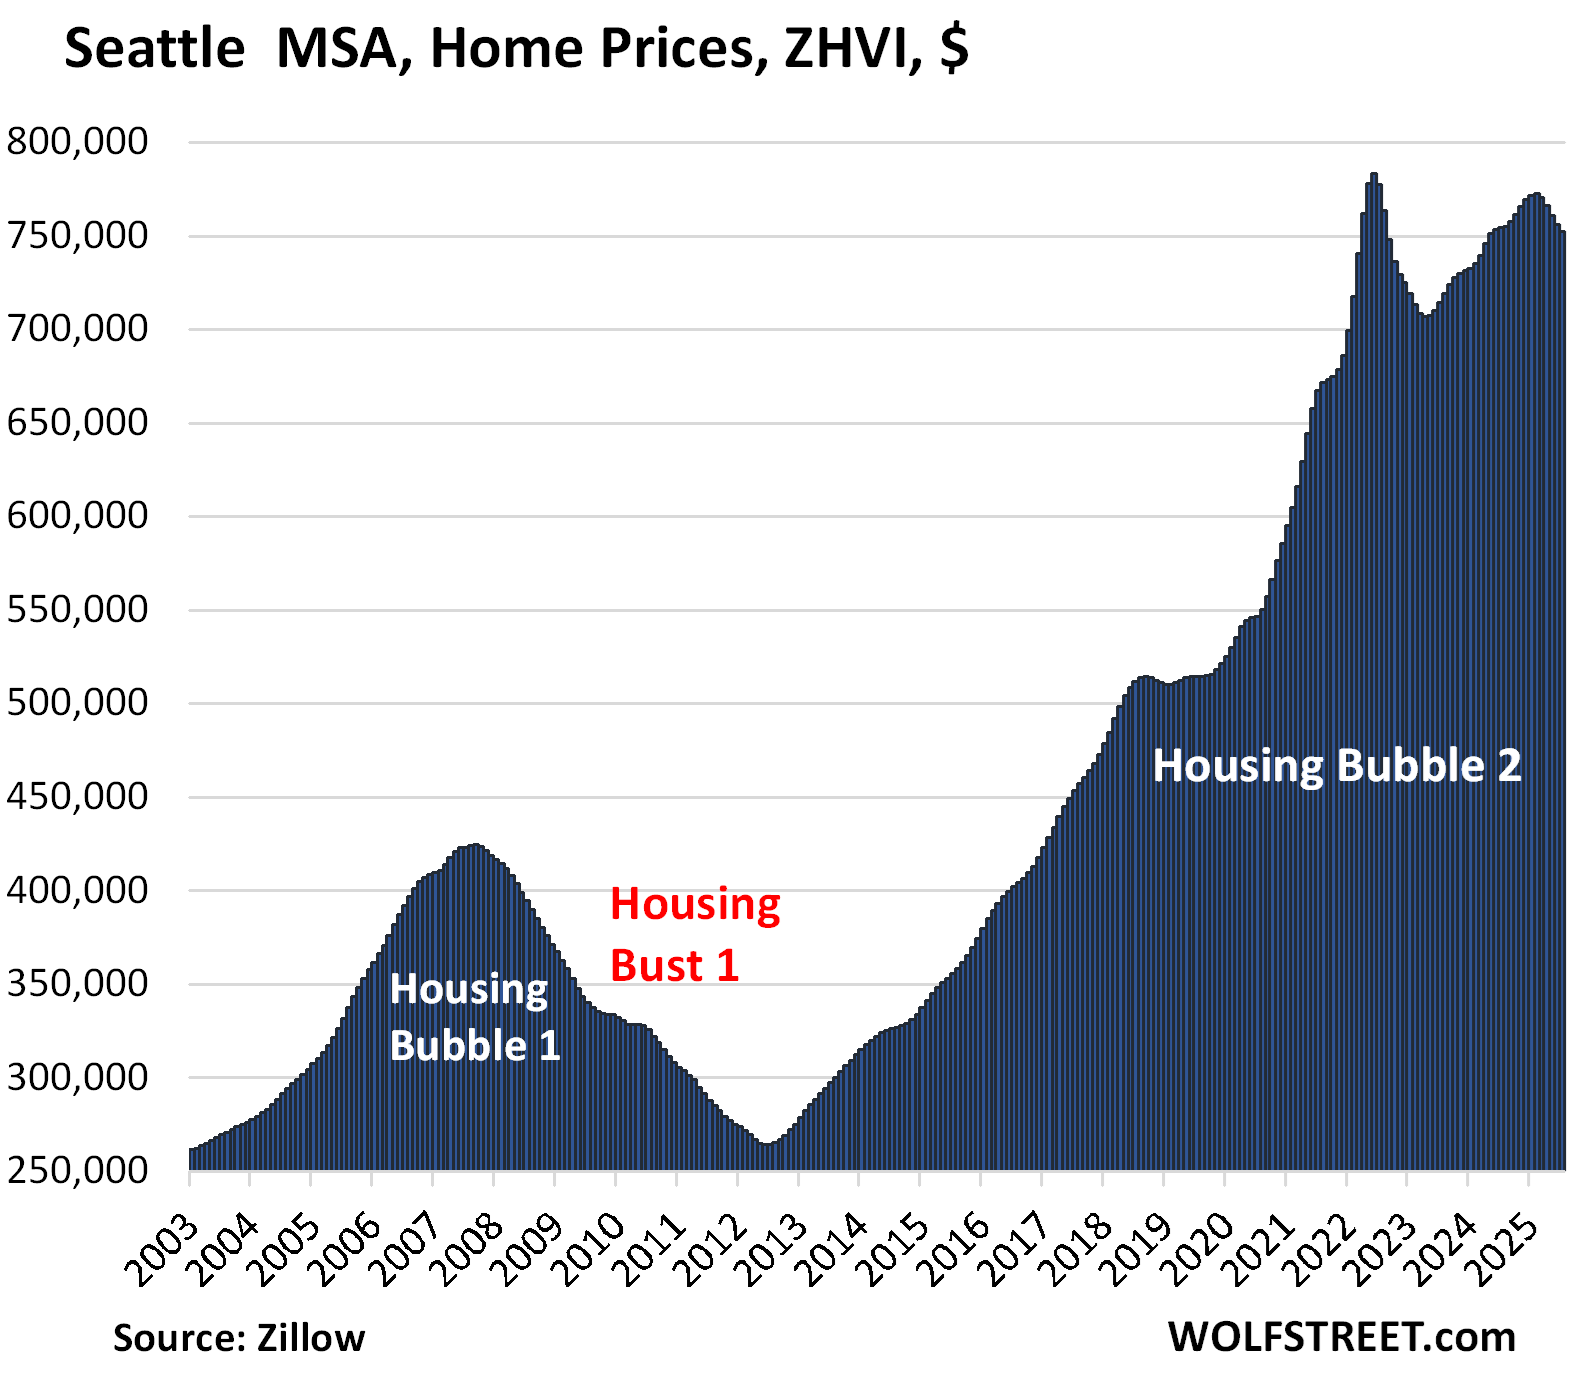
| Seattle MSA, Home Prices | ||||
| From May 2022 peak | MoM | YoY | Since 2000 | Jan 2020 – Jun 2022 |
| -3.3% | -0.5% | -0.3% | 233% | 49% |
In the 2.5 years through June 2022, home prices had exploded by 49%.
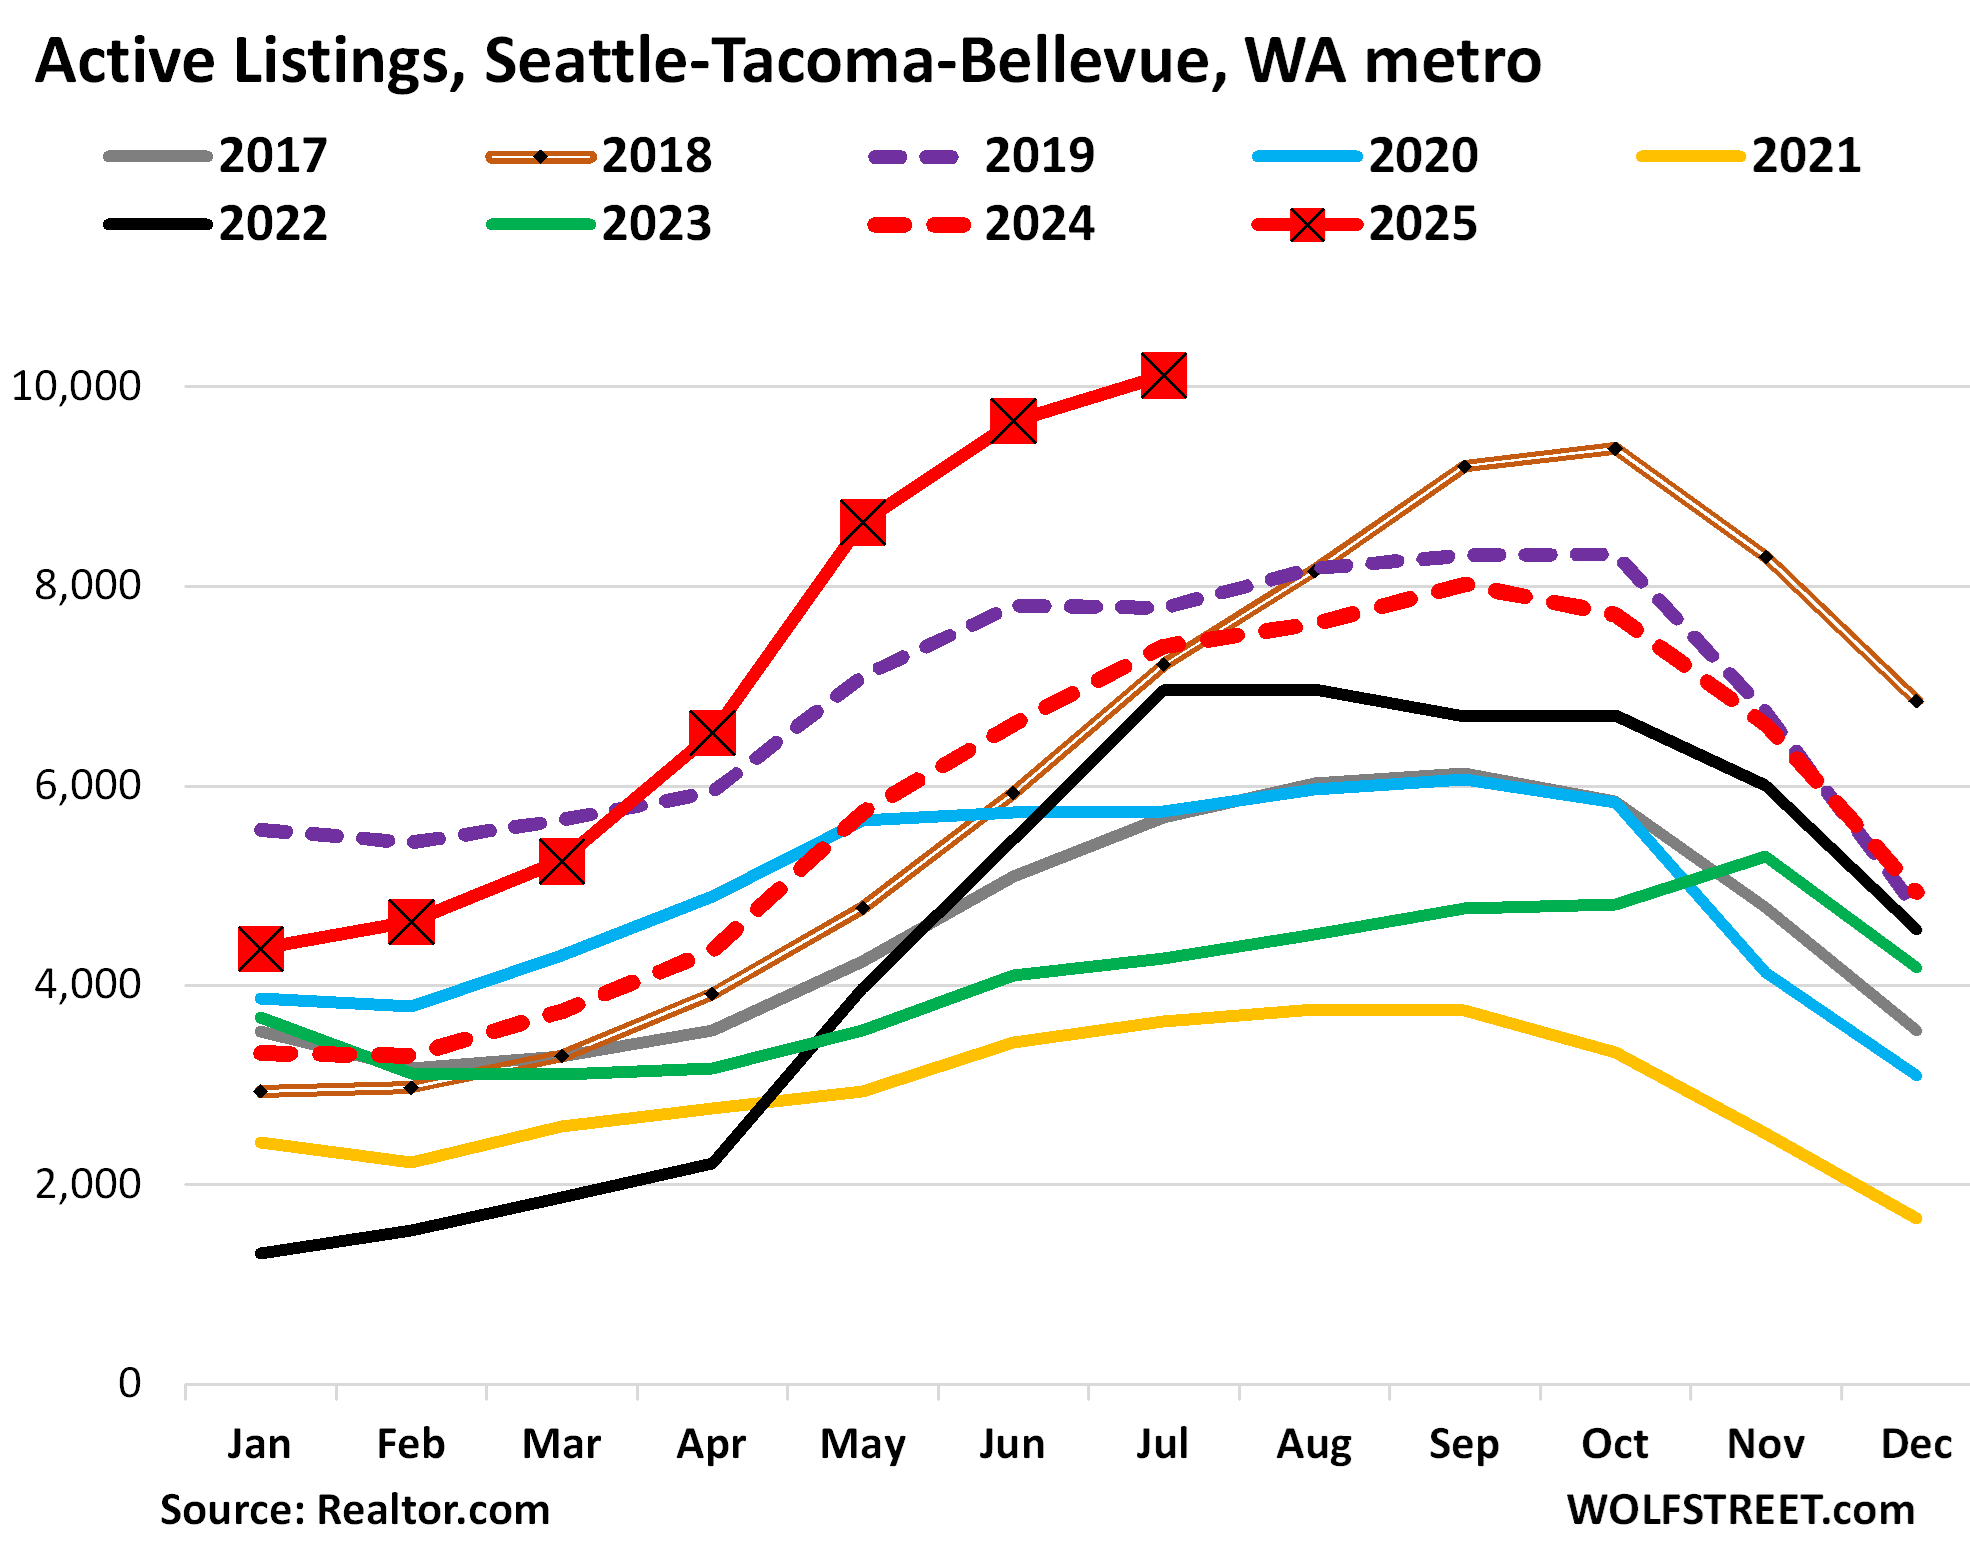
And inventories in the Seattle-Tacoma-Bellevue metro:
| Raleigh MSA, Home Prices | ||||
| From July 2022 peak | MoM | YoY | Since 2000 | Jan 2020 – Jun 2022 |
| -2.1% | -0.4% | -2.0% | 154% | 53% |
| Houston MSA, Home Prices | ||||
| From Jul 2022 peak | MoM | YoY | Since 2000 | Jan 2020 – Jun 2022 |
| -2.2% | -0.3% | -1.8% | 148% | 37% |
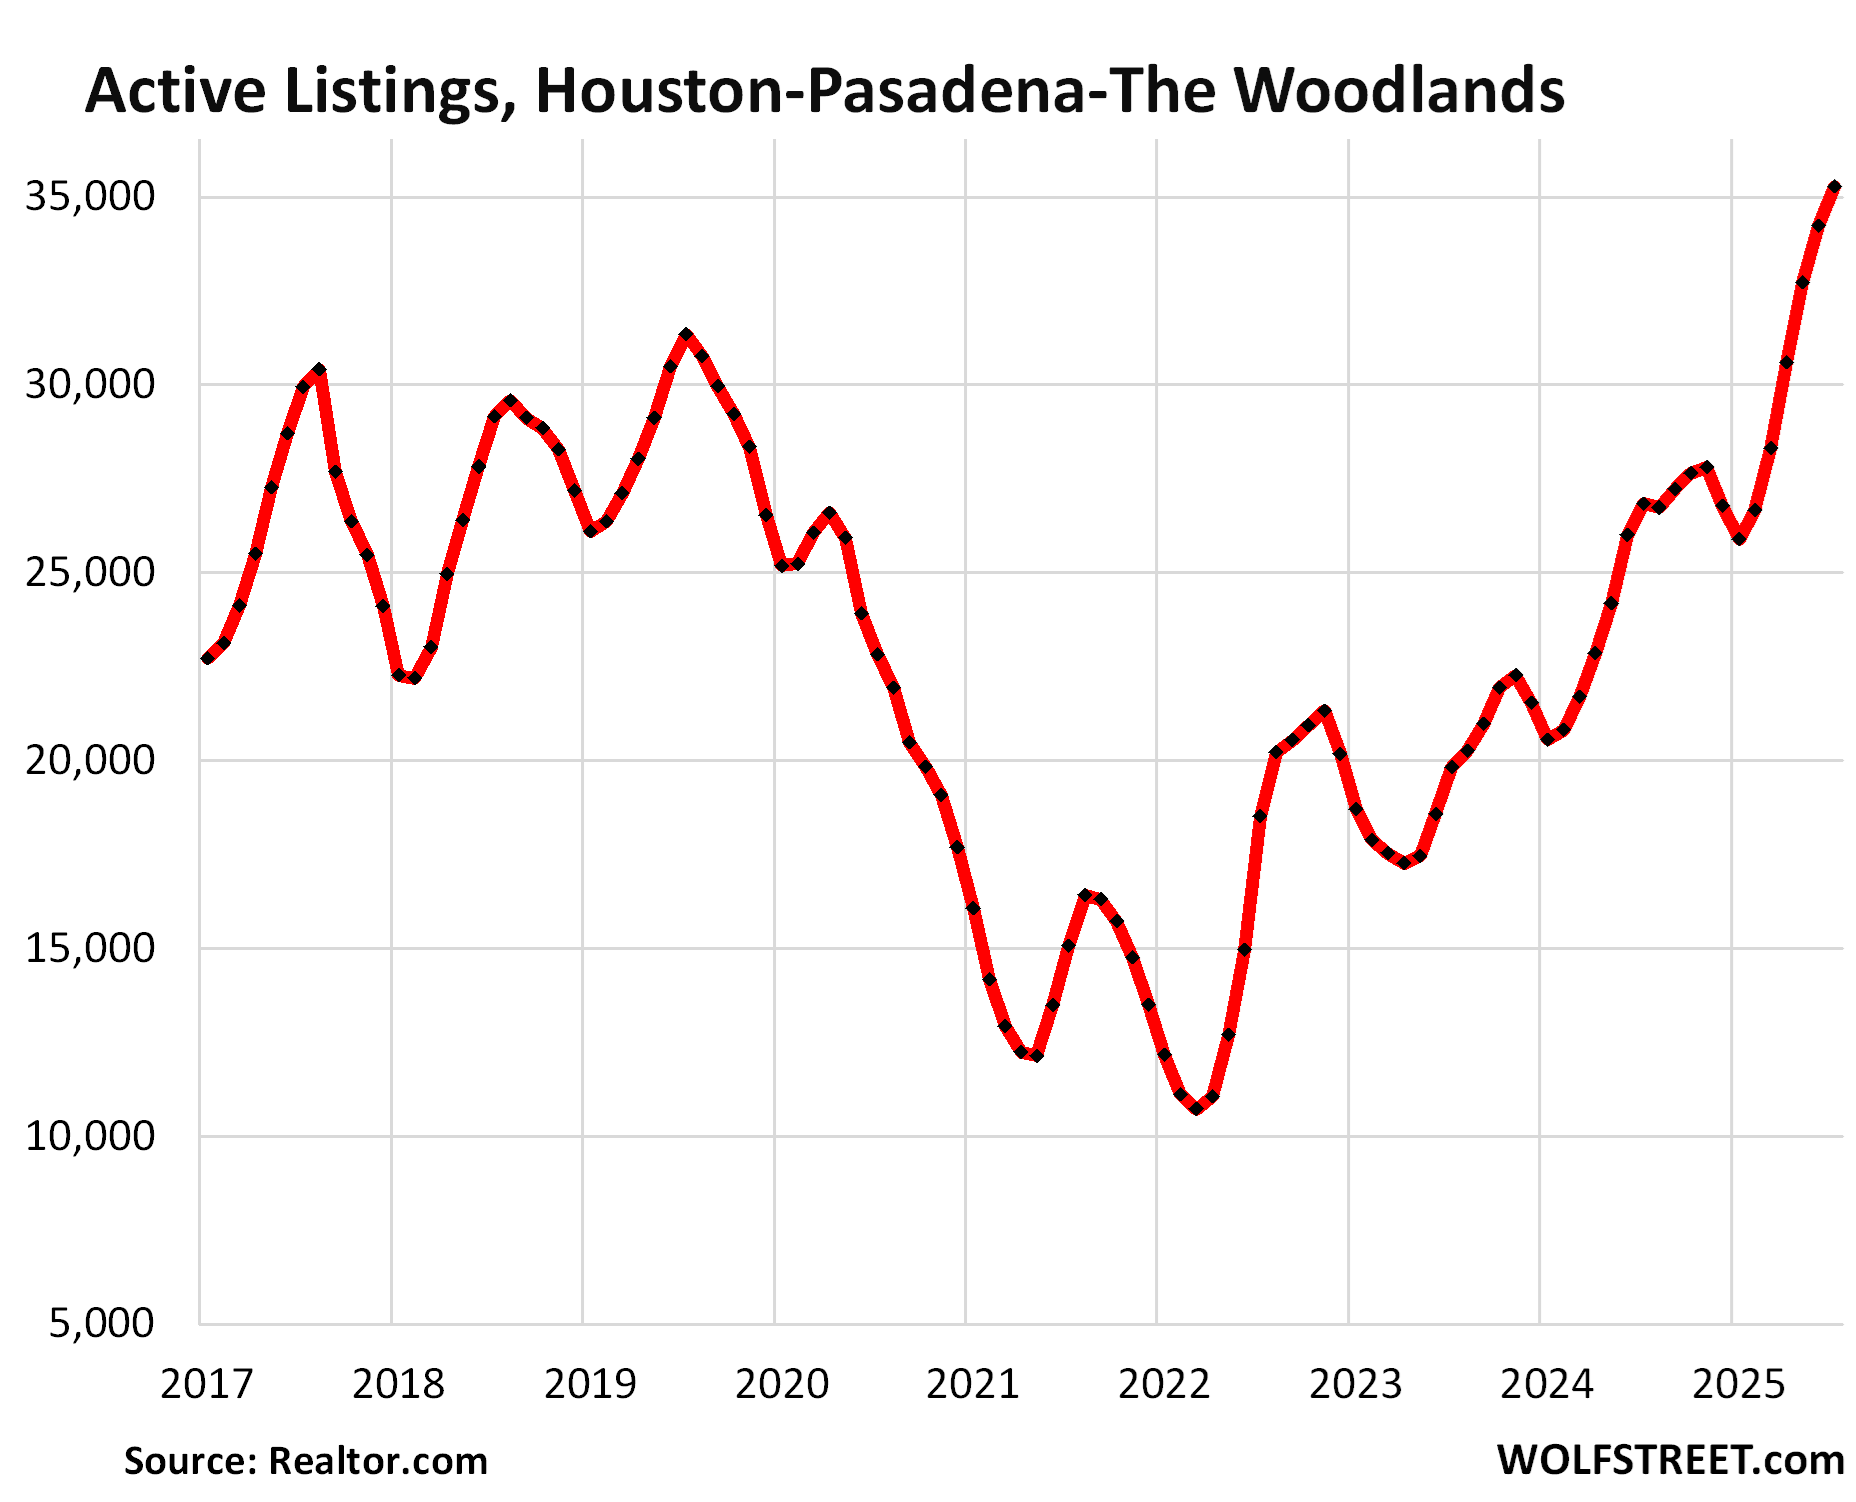
And the inventory in the Houston MSA:
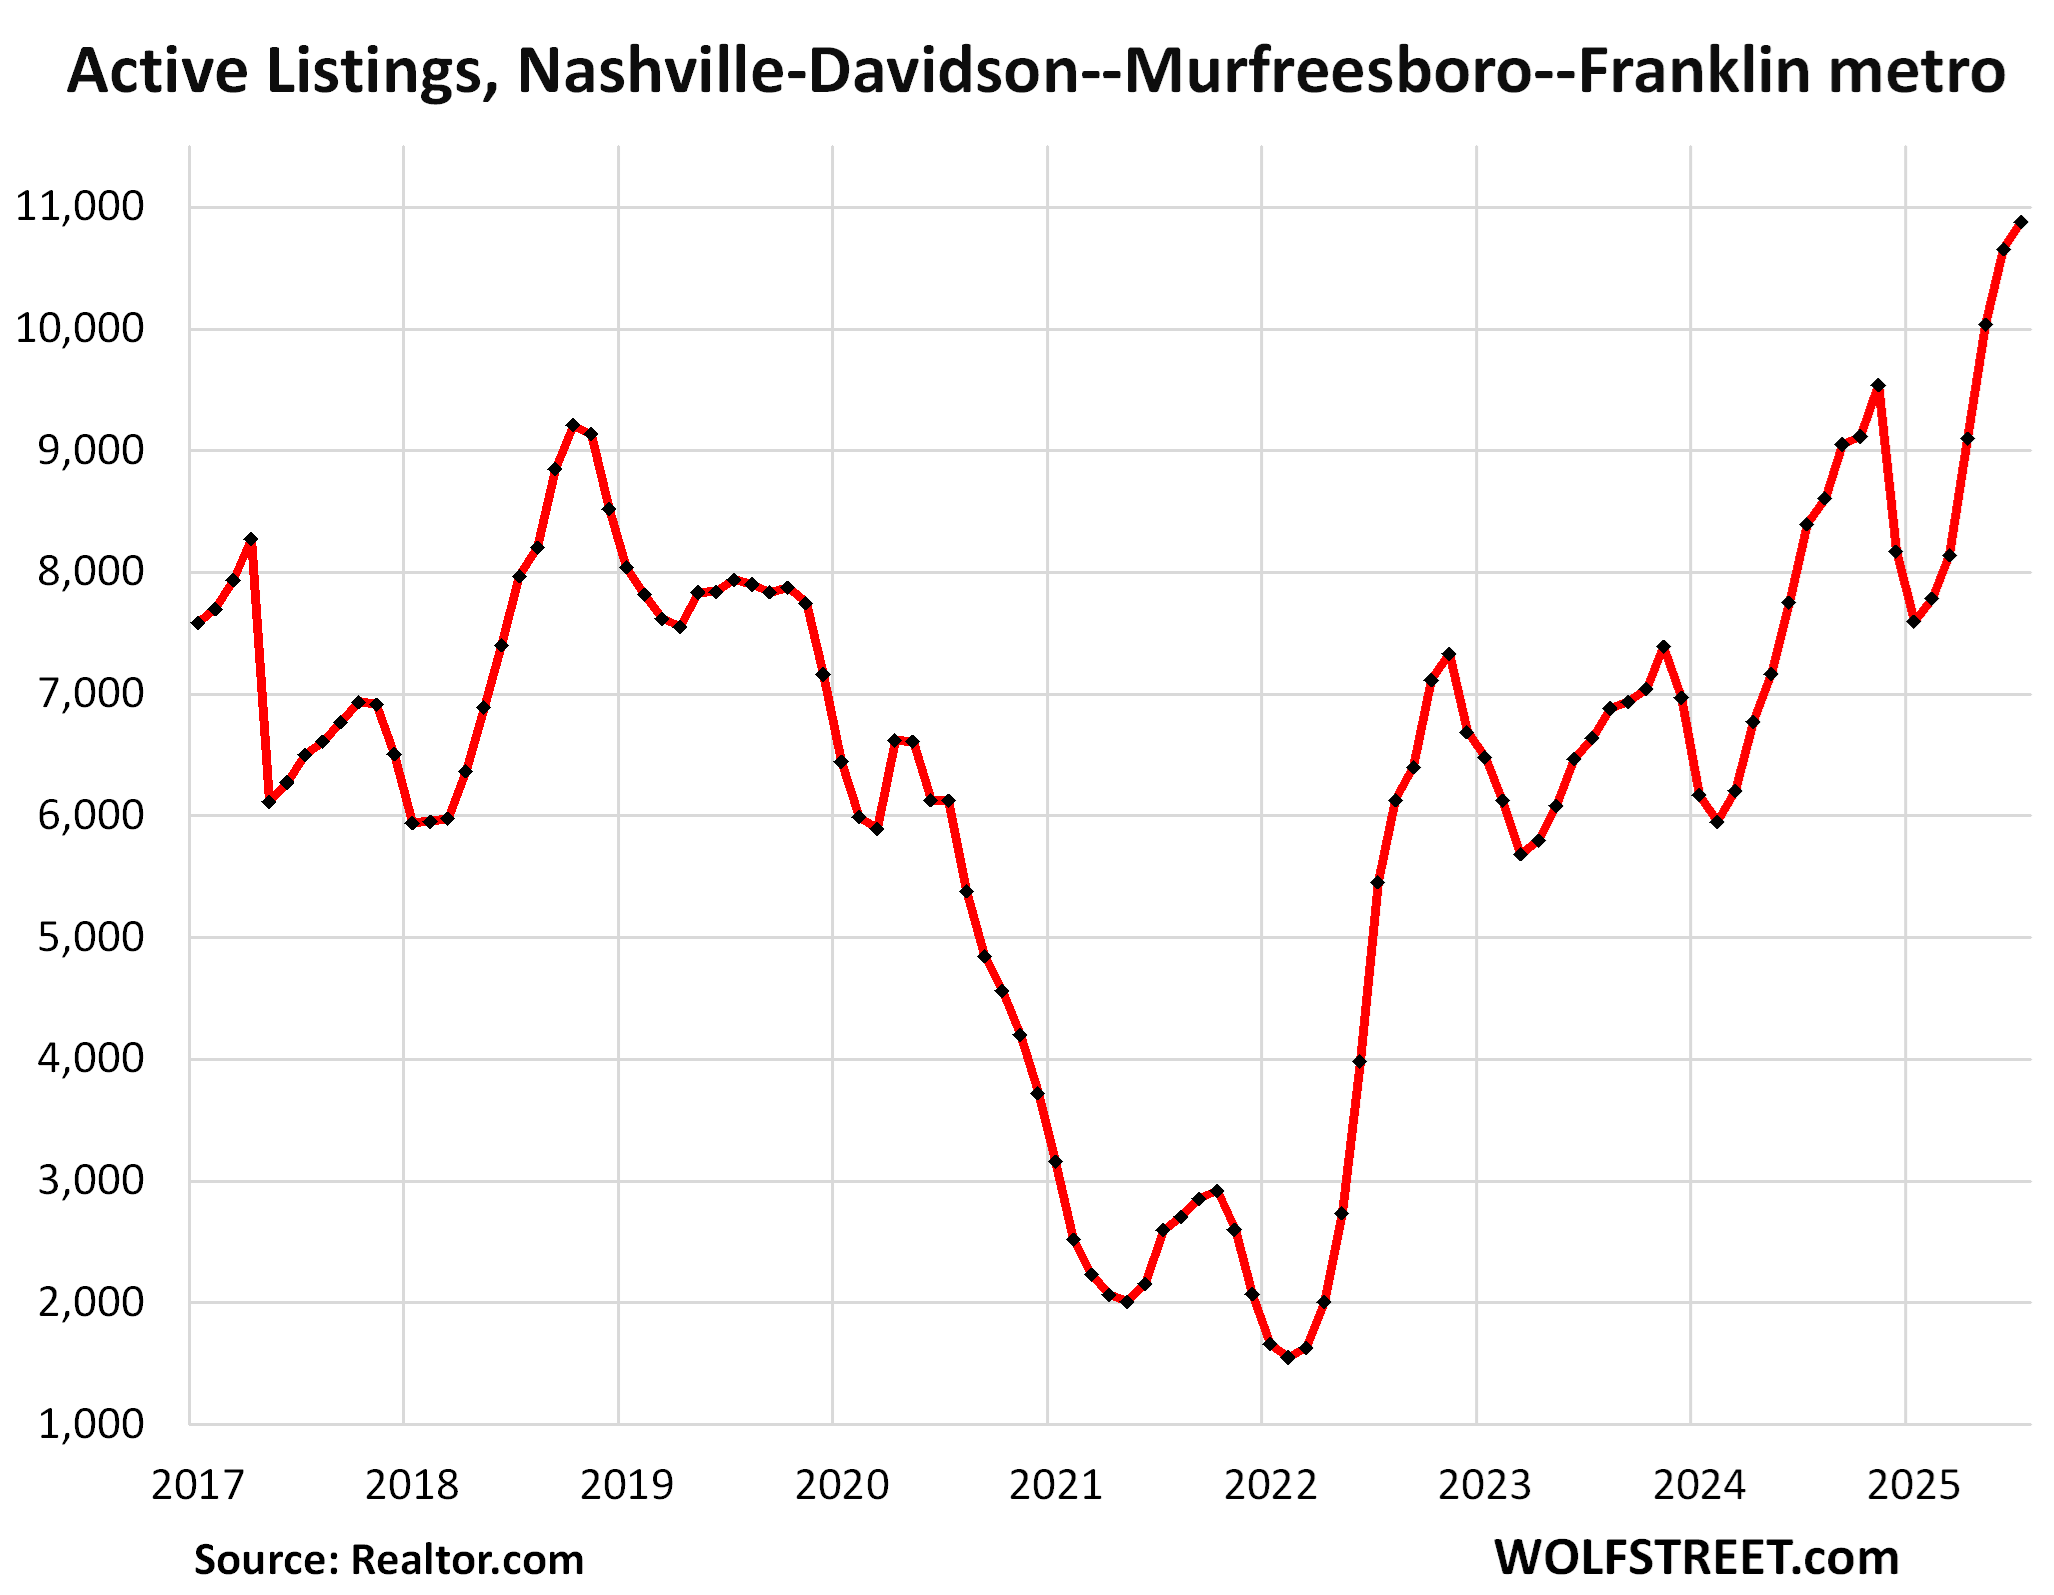
| Nashville MSA, Home Prices | ||||
| From July 2022 peak | MoM | YoY | Since 2000 | Jan 2020 – Jun 2022 |
| -1.4% | -0.2% | -0.1% | 216% | 50% |
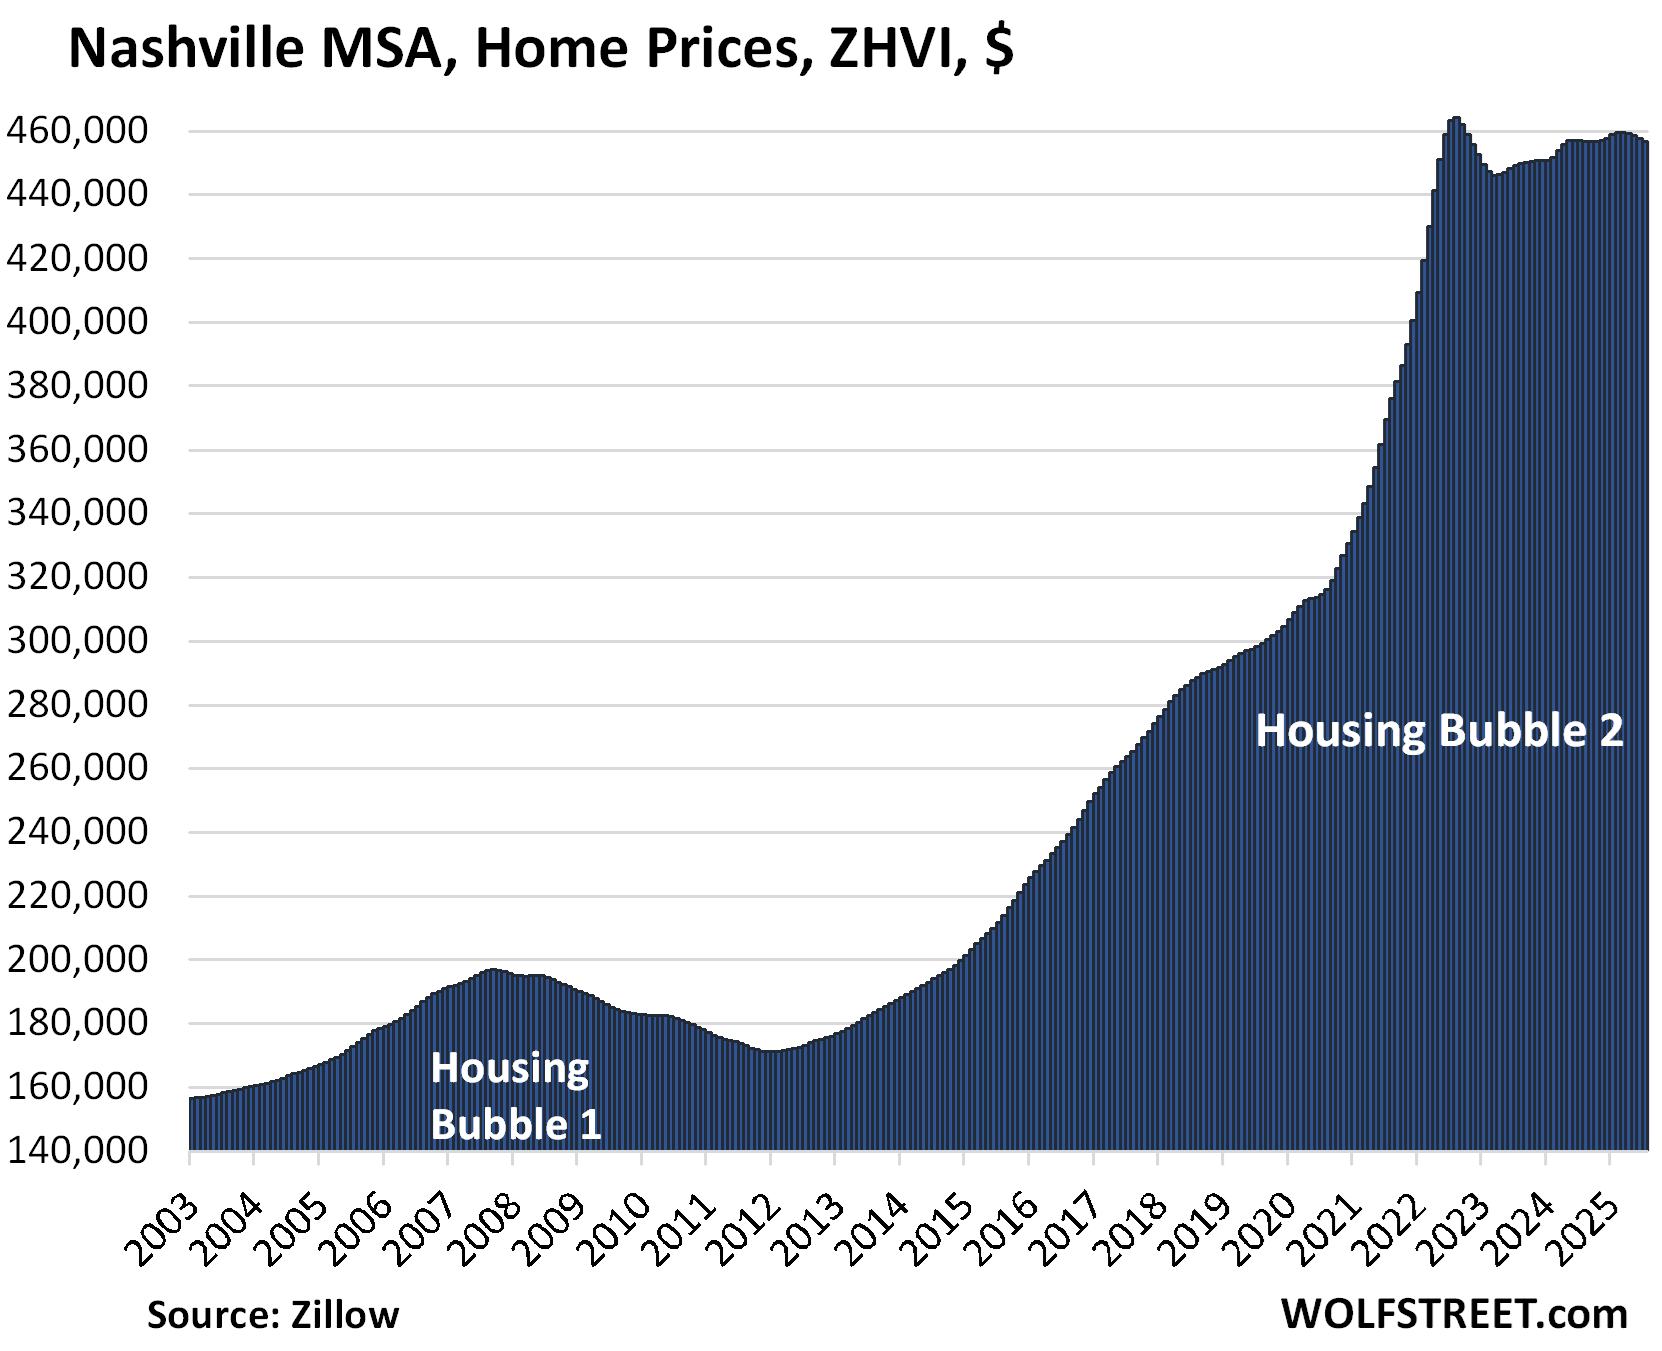
And the inventory pileup in the Nashville-Davidson–Murfreesboro–Franklin metro:
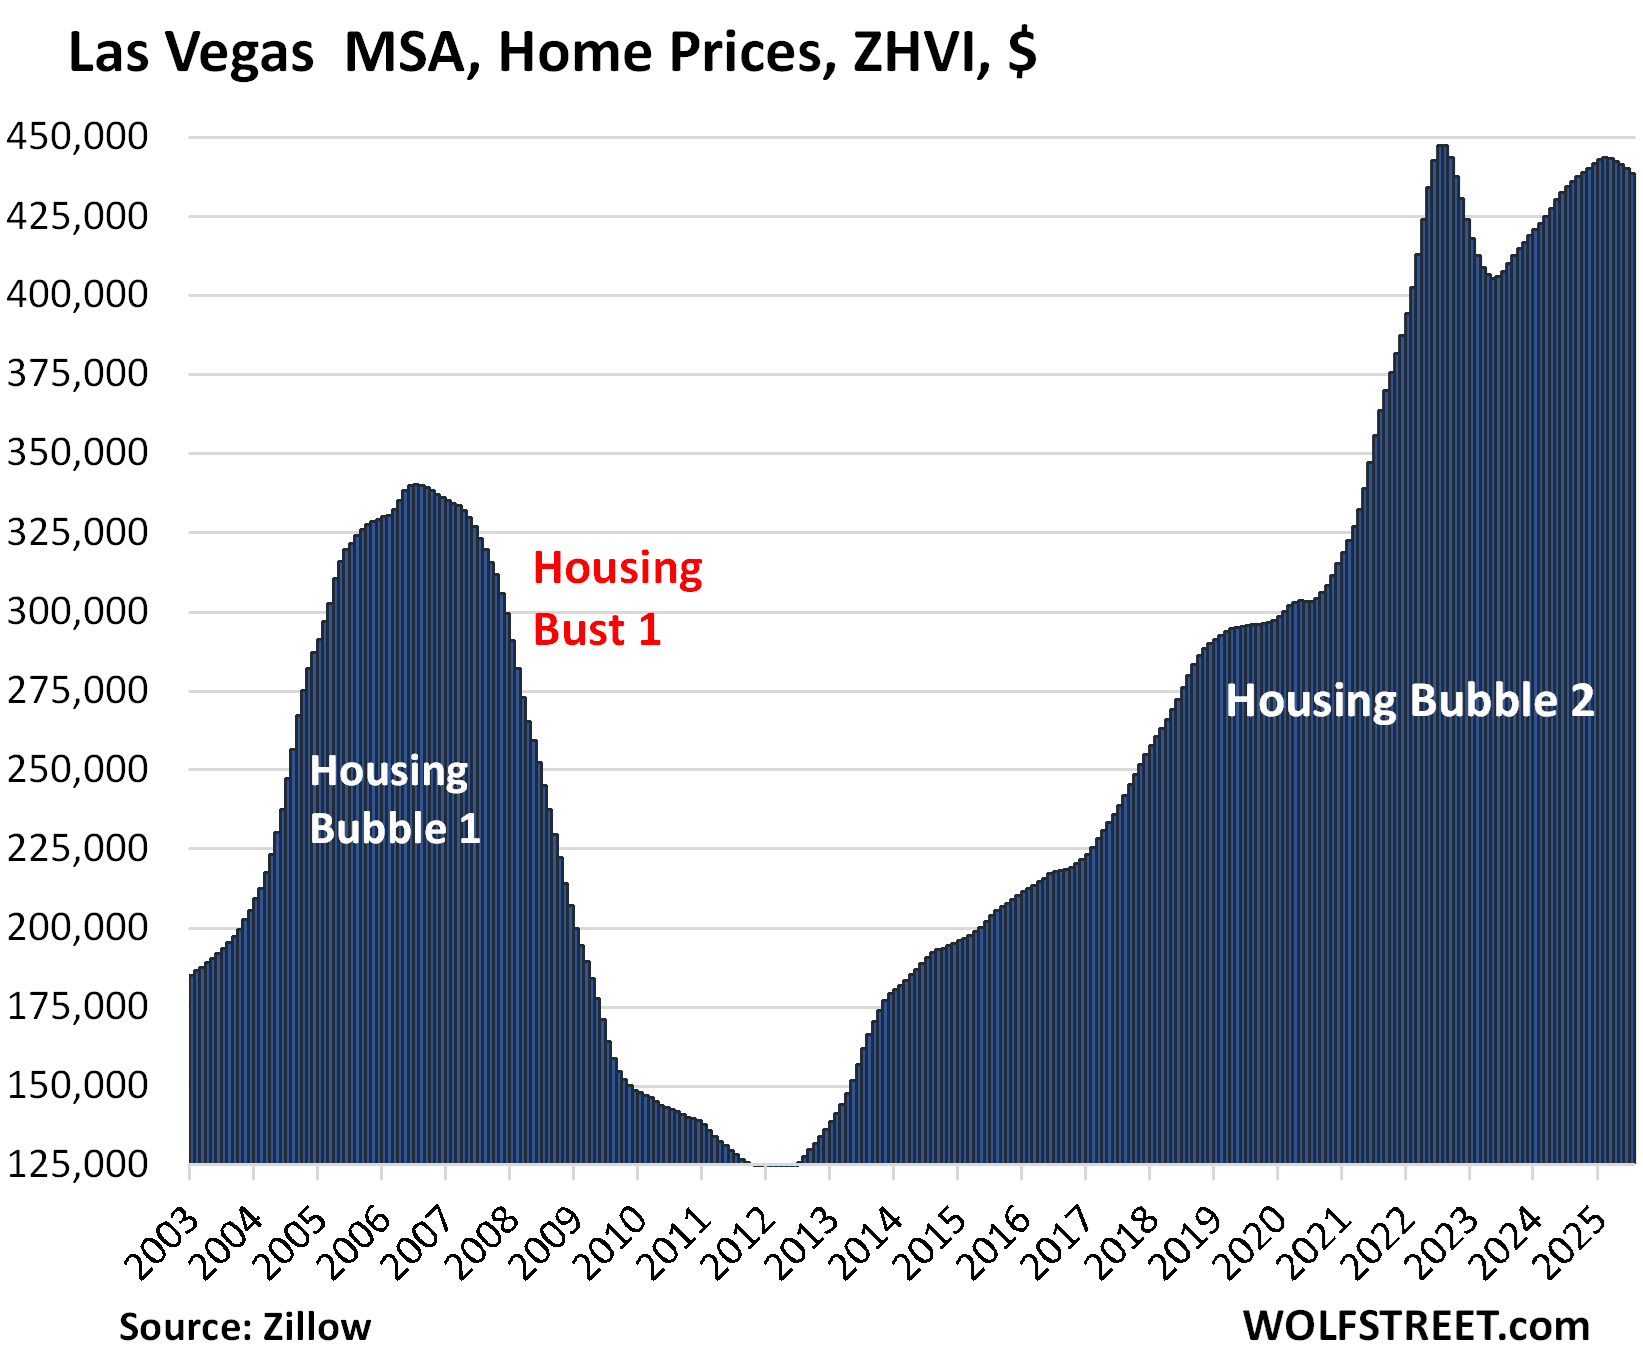
| Las Vegas MSA, Home Prices | ||||
| From June 2022 peak | MoM | YoY | Since 2000 | Jan 2020 – Jun 2022 |
| -1.0% | -0.4% | 0.9% | 180% | 48% |
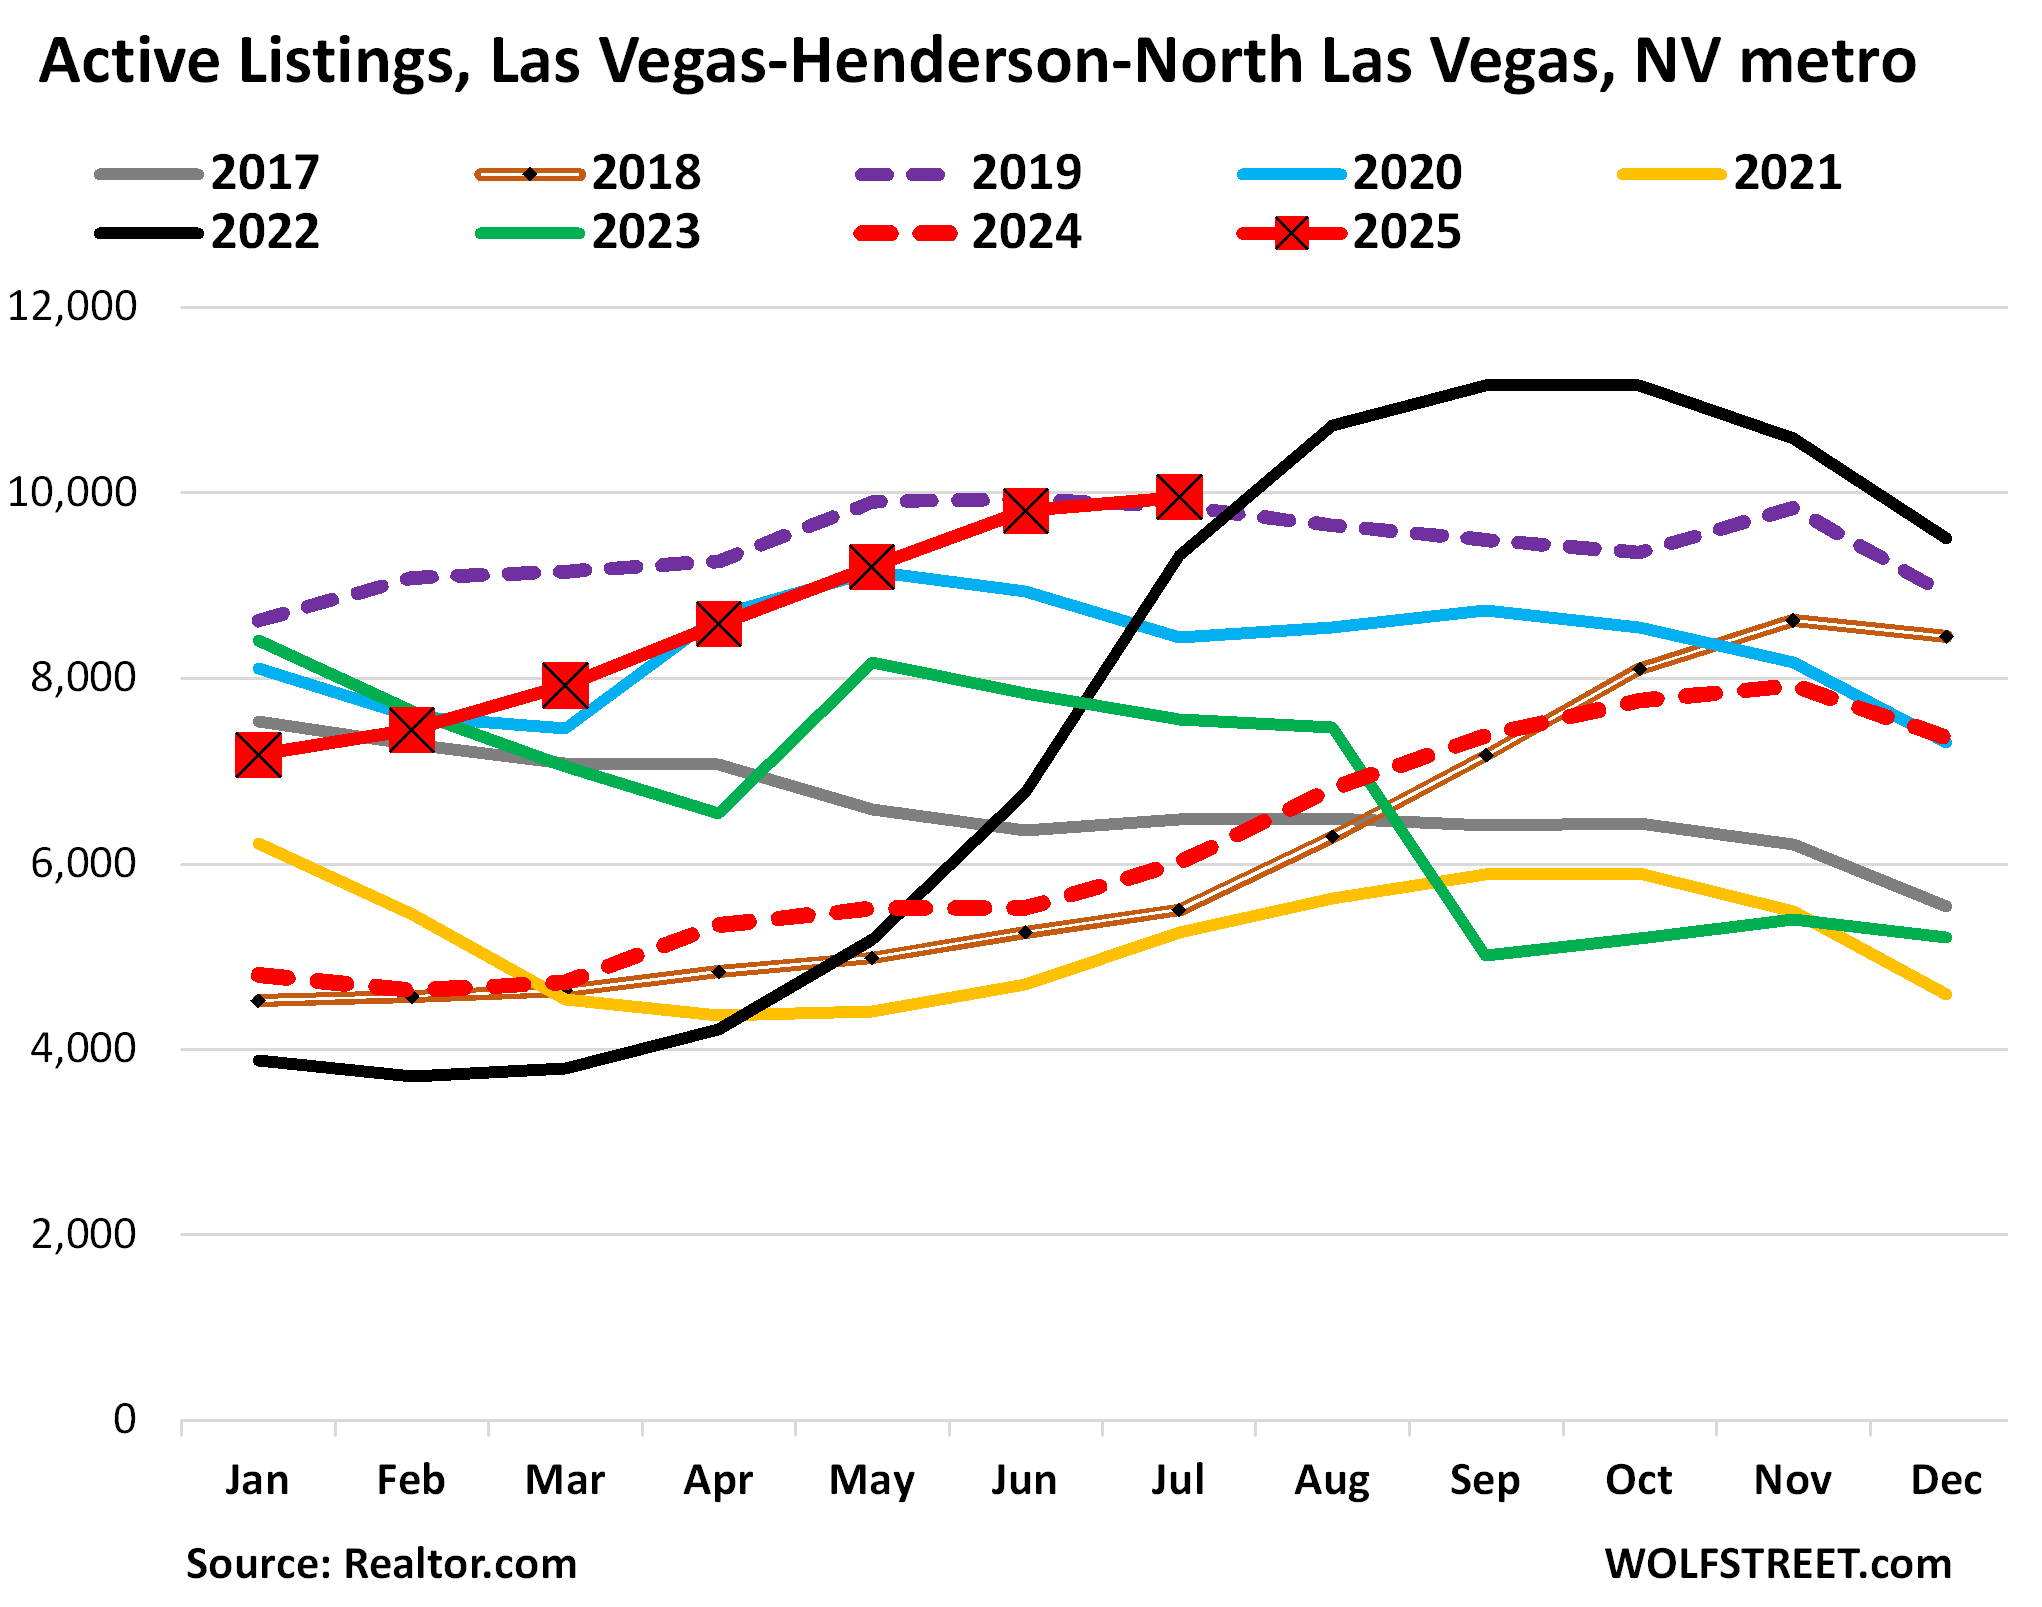
Inventory in the Las Vegas-Henderson-North Las Vegas metro (details here):
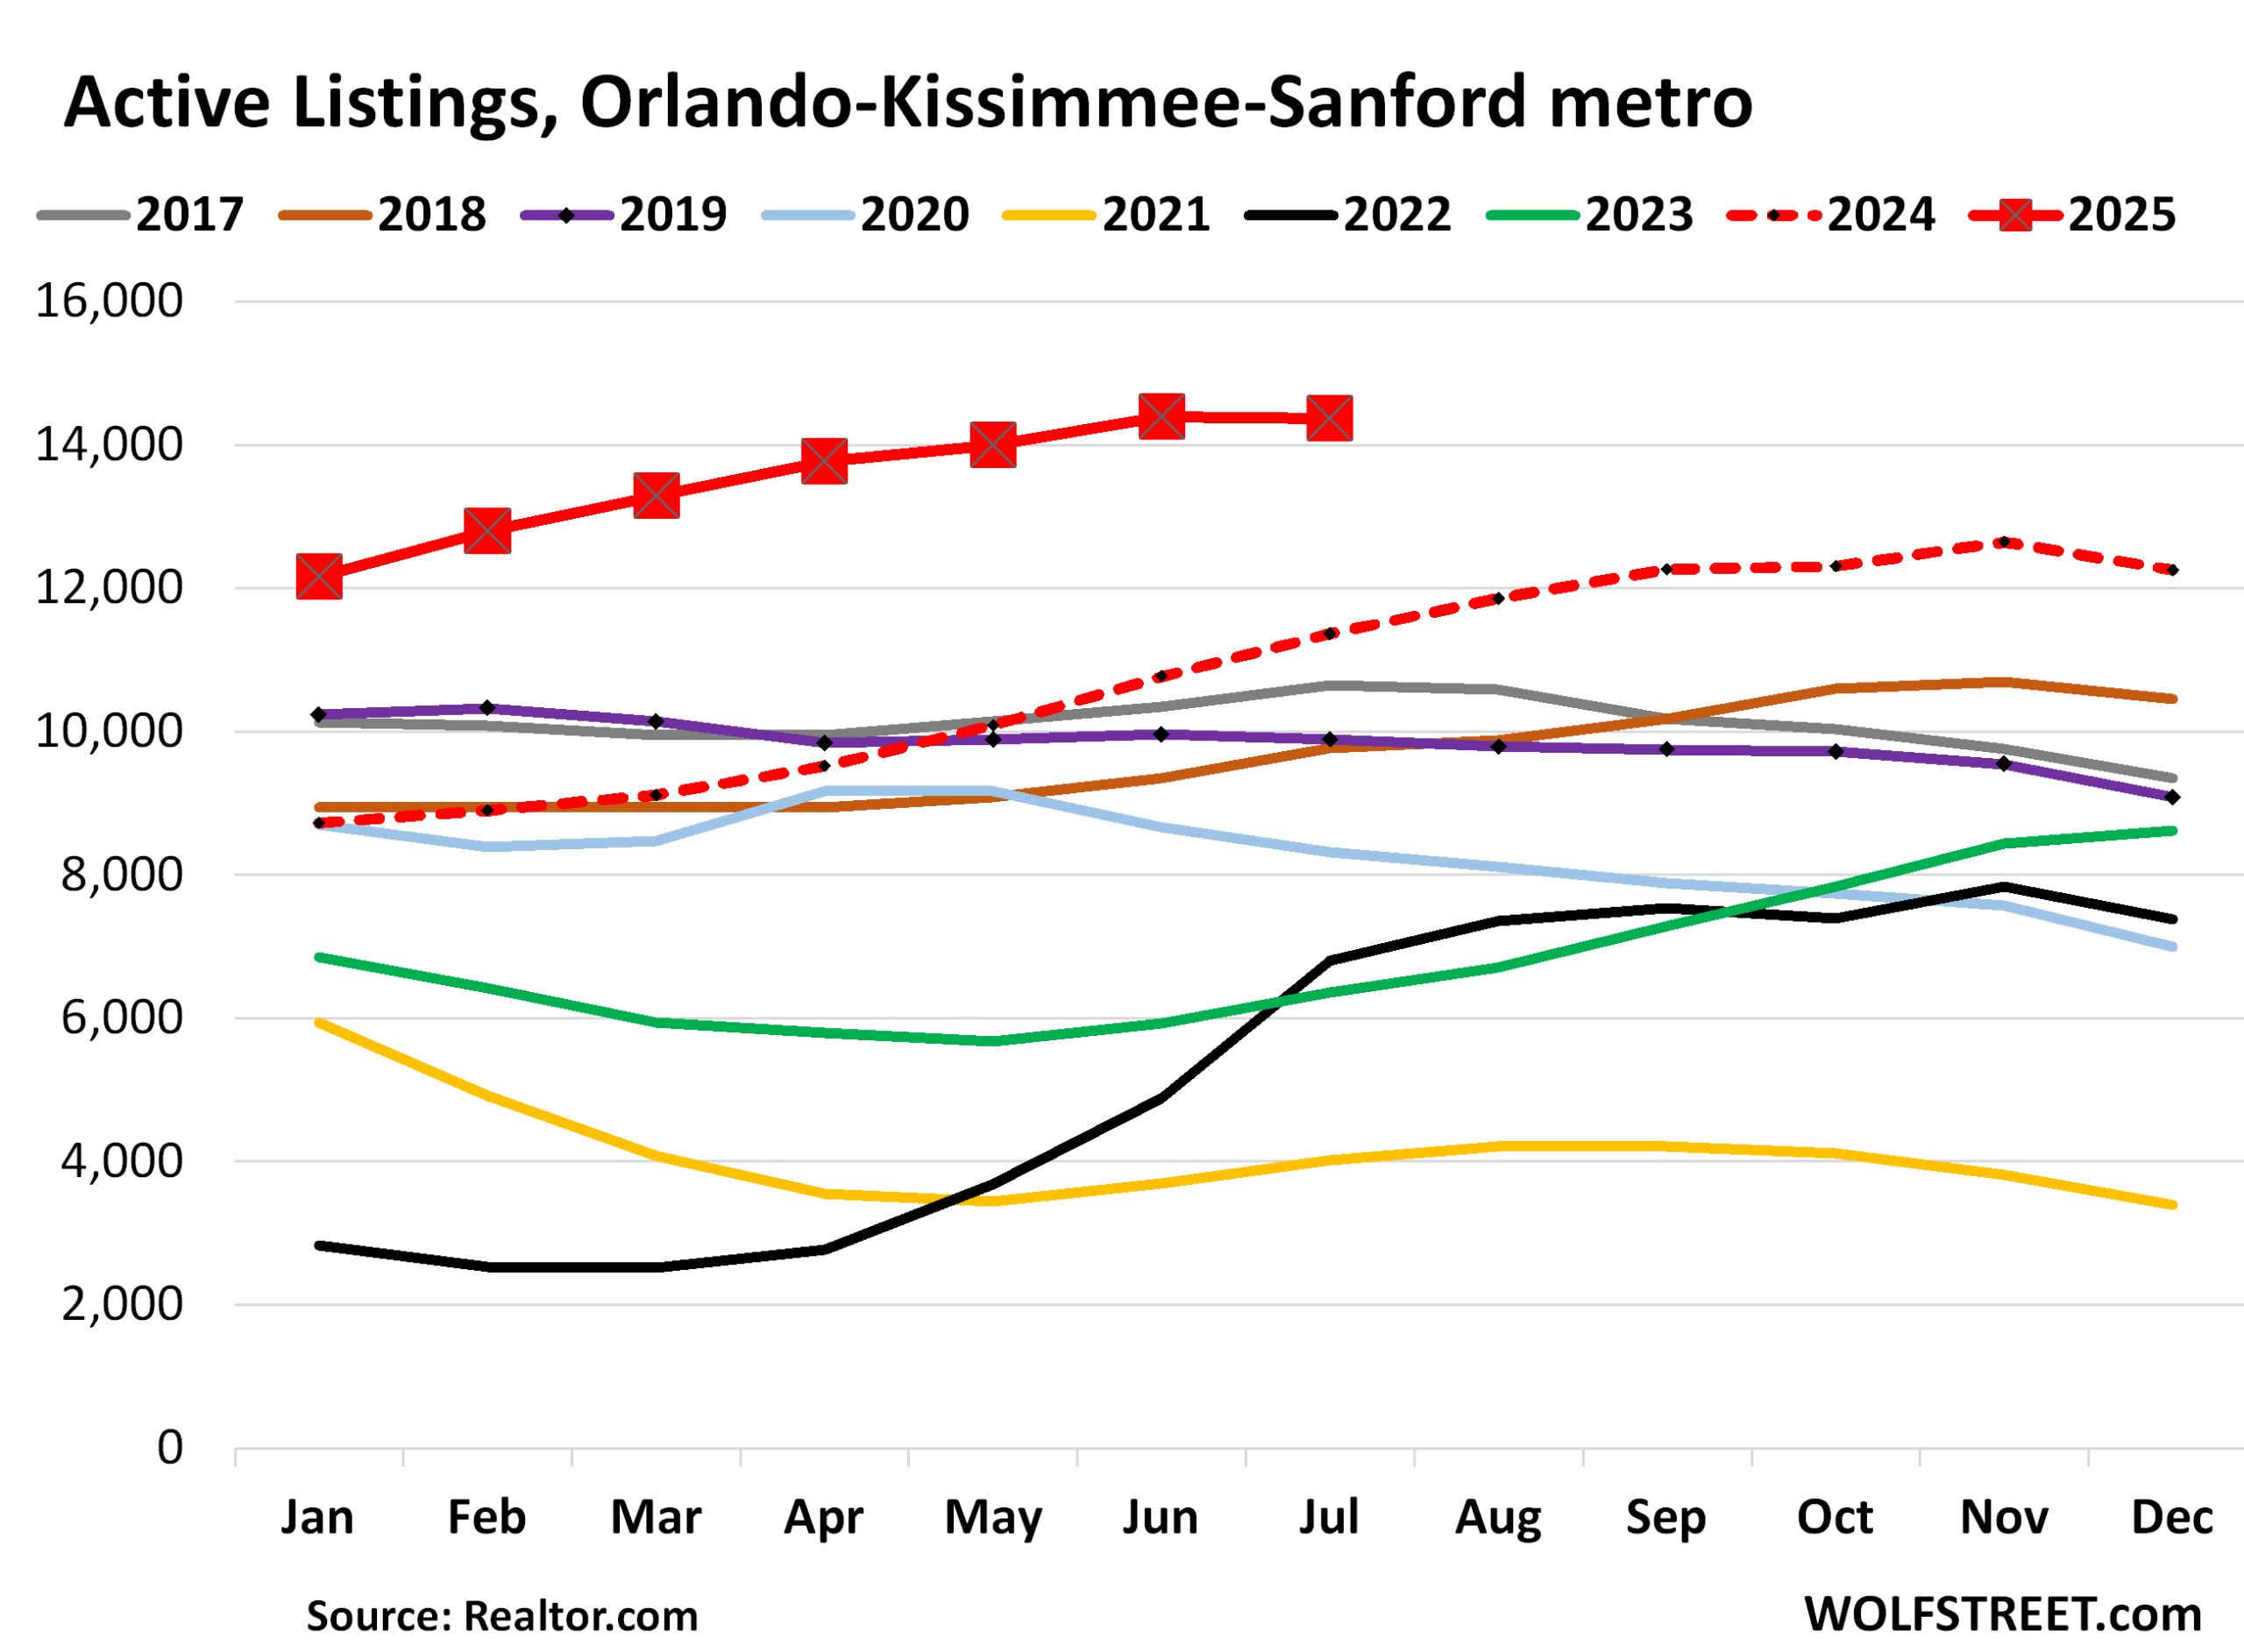
| Orlando MSA, Home Prices | ||||
| From June 2022 | MoM | YoY | Since 2000 | Jan 2020 – Jun 2022 |
| -0.2% | -0.6% | -3.6% | 227% | 48% |
Between January 2020 and Jun 2022, prices exploded by 48%.
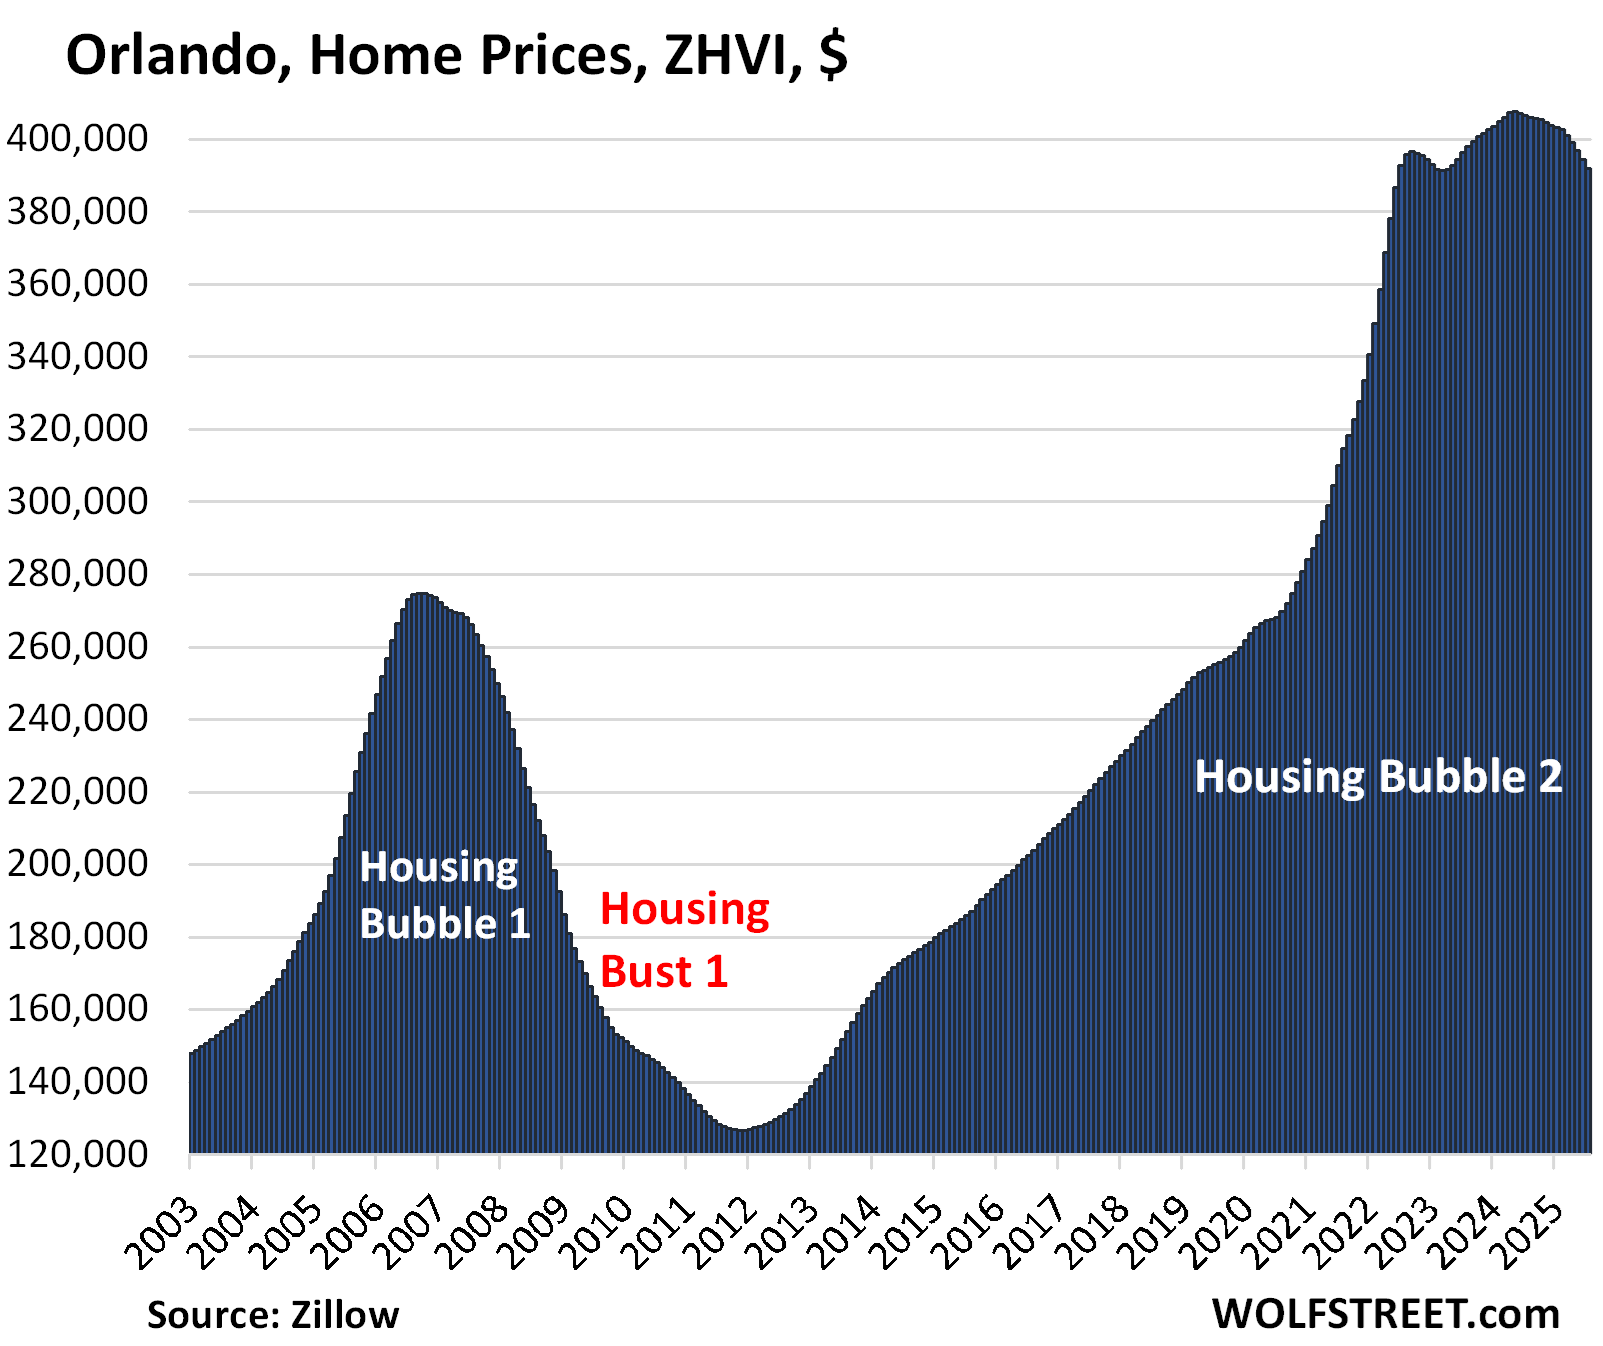
And inventory in the Orlando-Kissimmee-Sanford MSA:
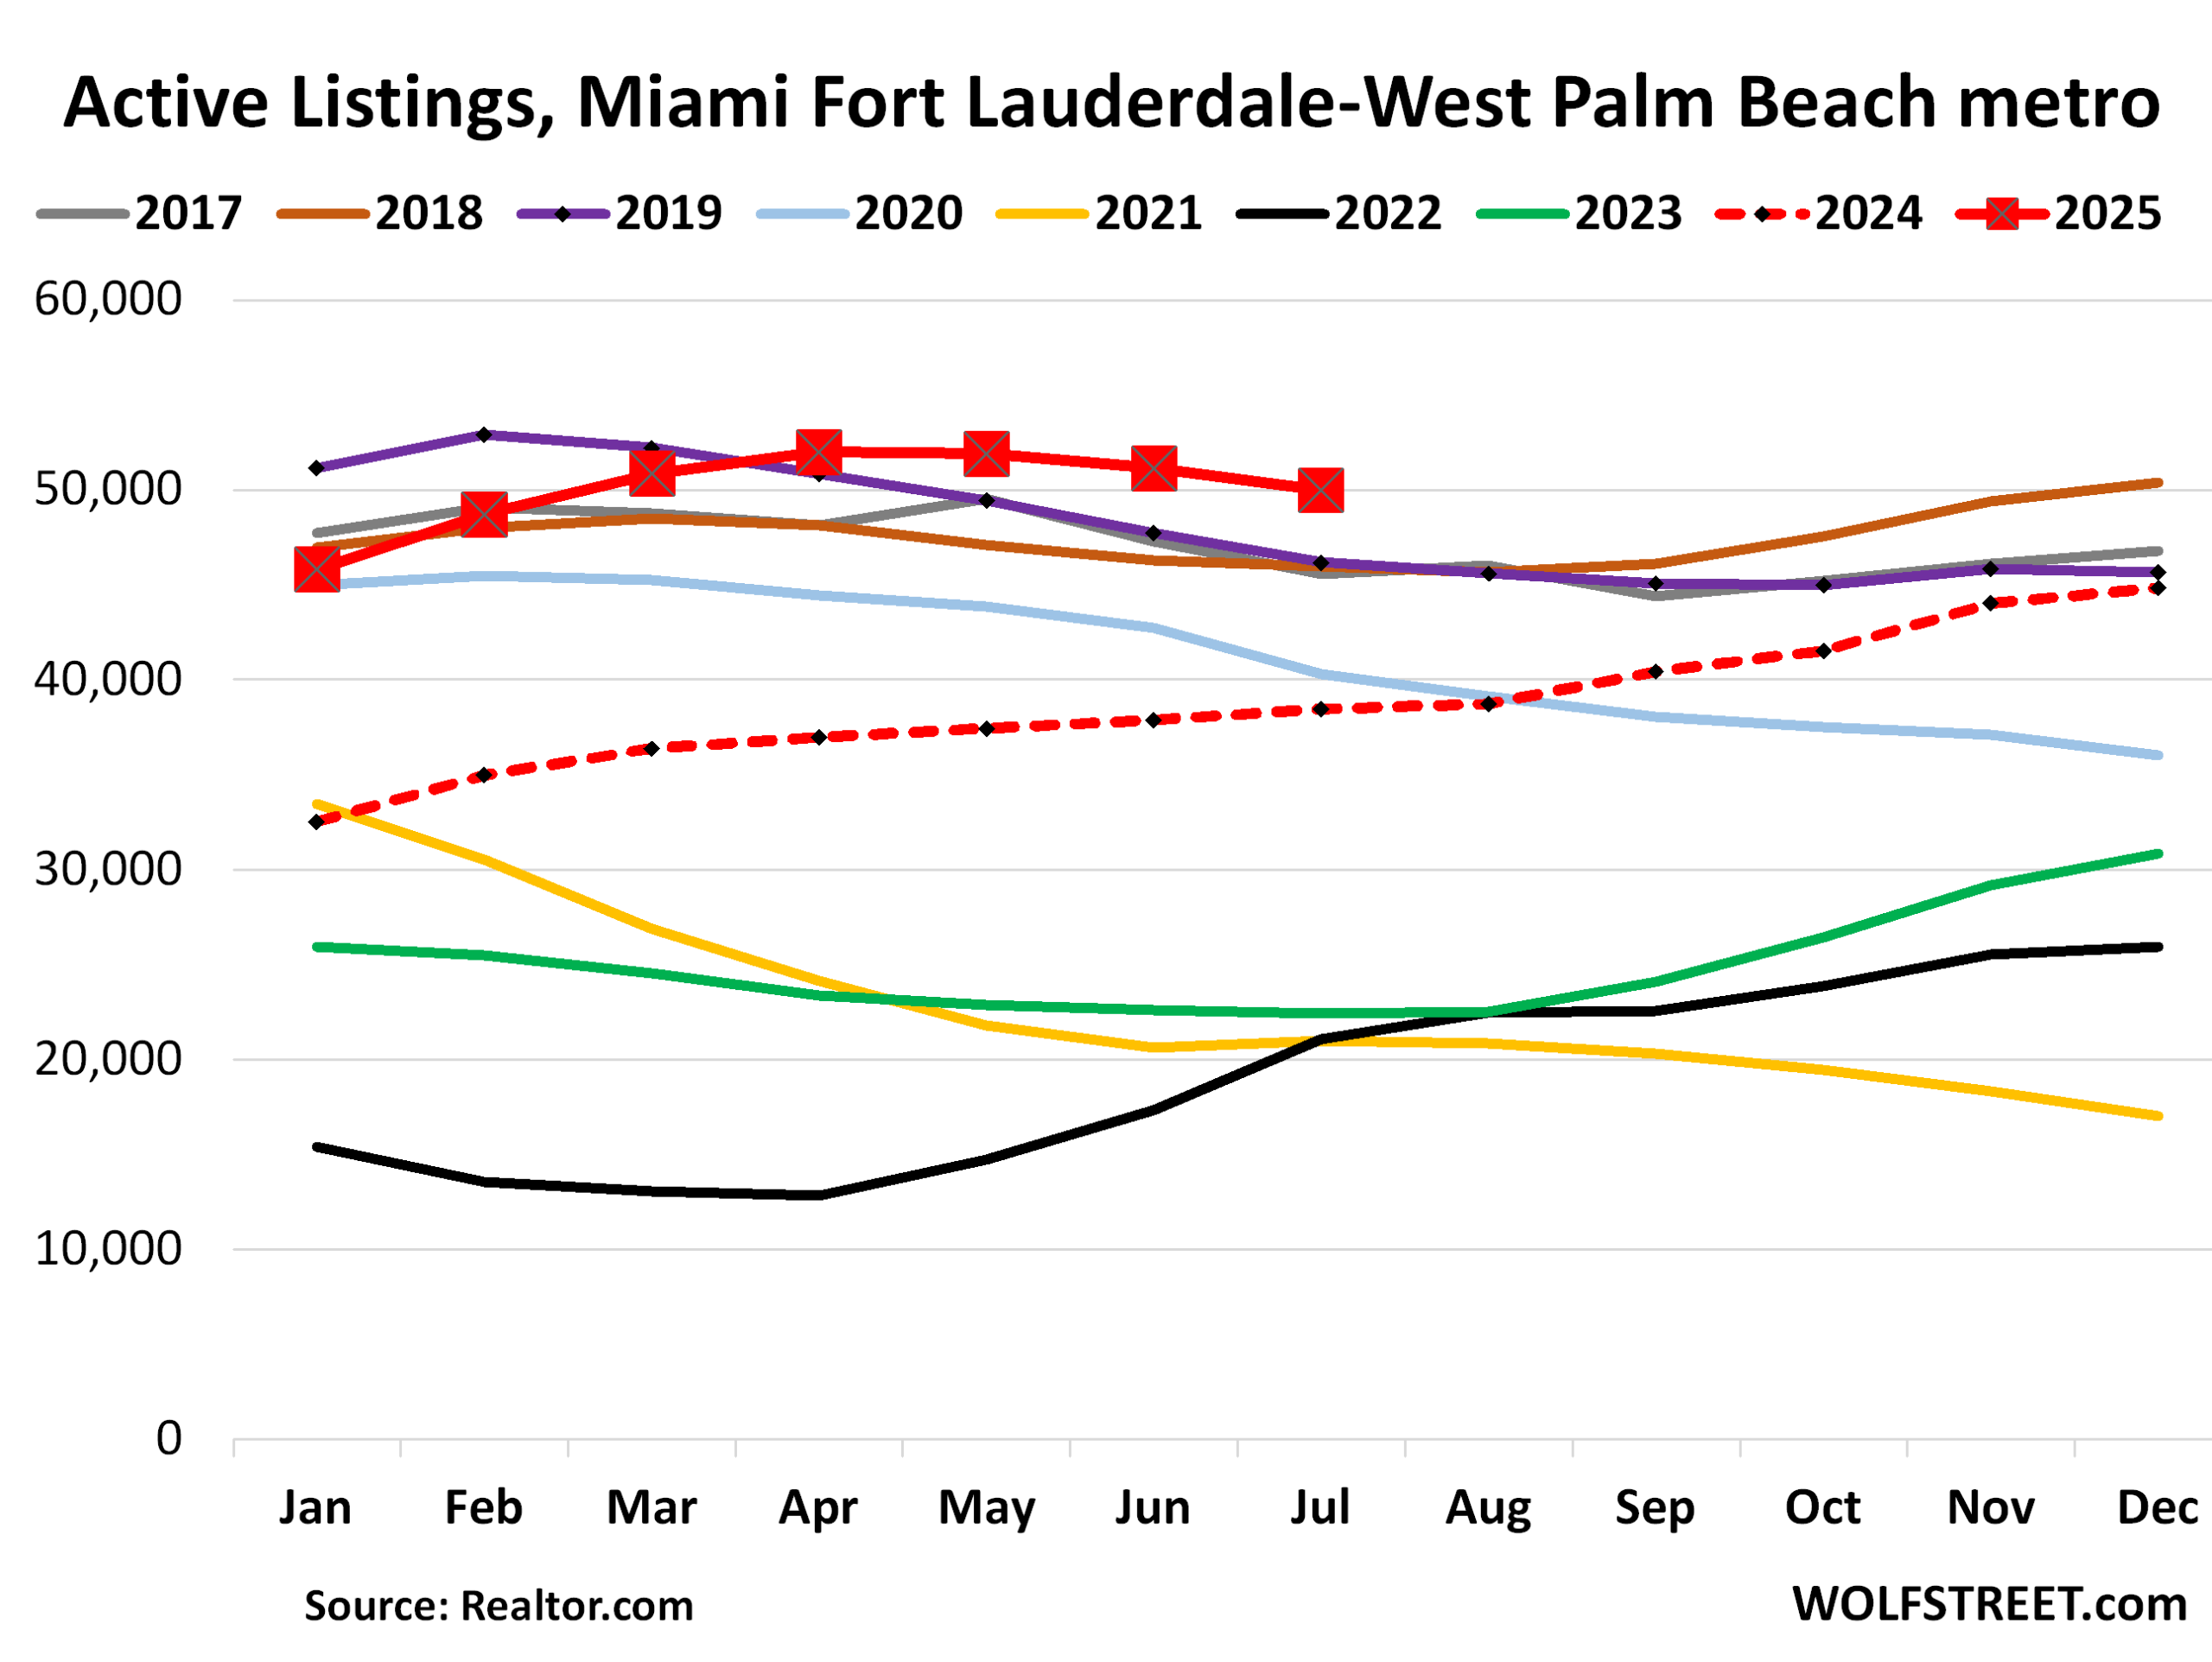
| Miami MSA, Home Prices | |||
| MoM | YoY | Since 2000 | Jan 2020 – Jun 2022 |
| -0.7% | -3.7% | 317% | 45% |
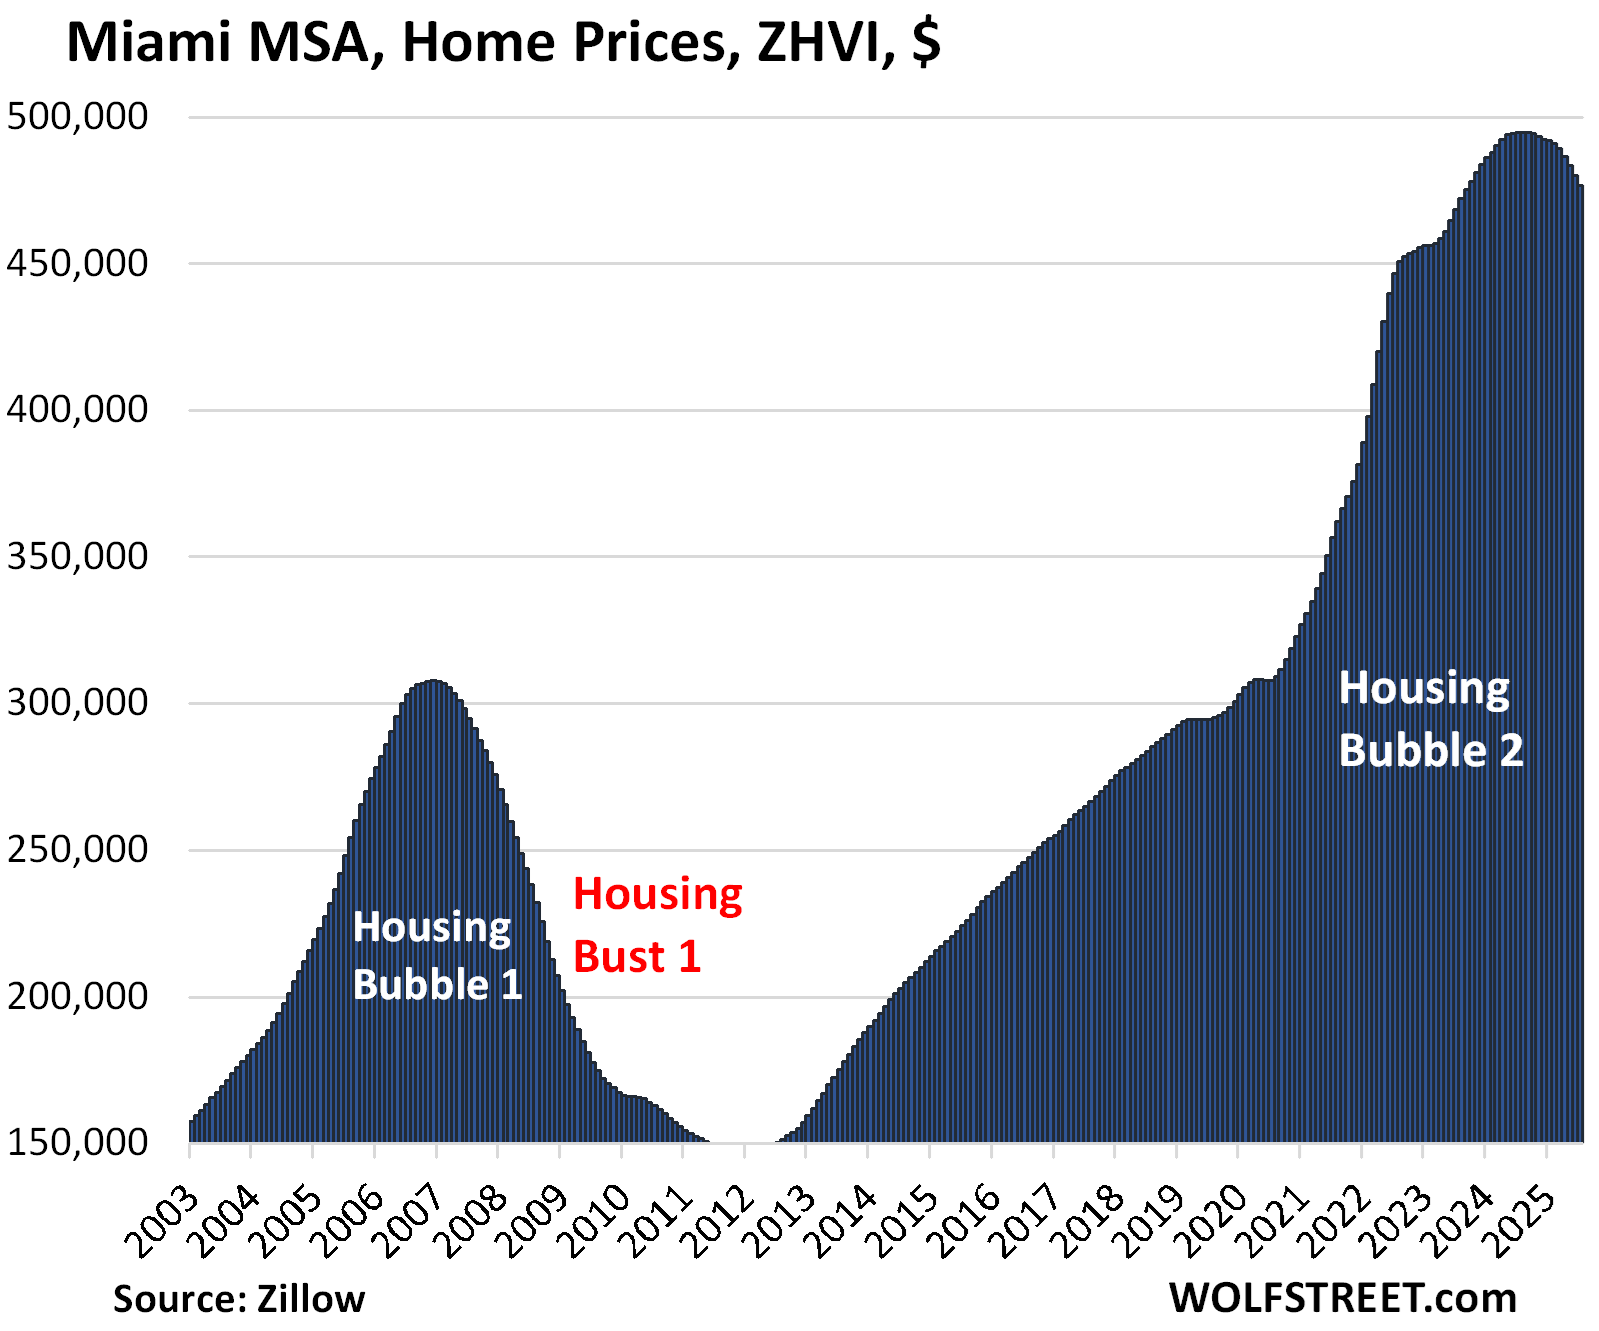
And inventory in the Miami-Fort Lauderdale-West Palm Beach metro:
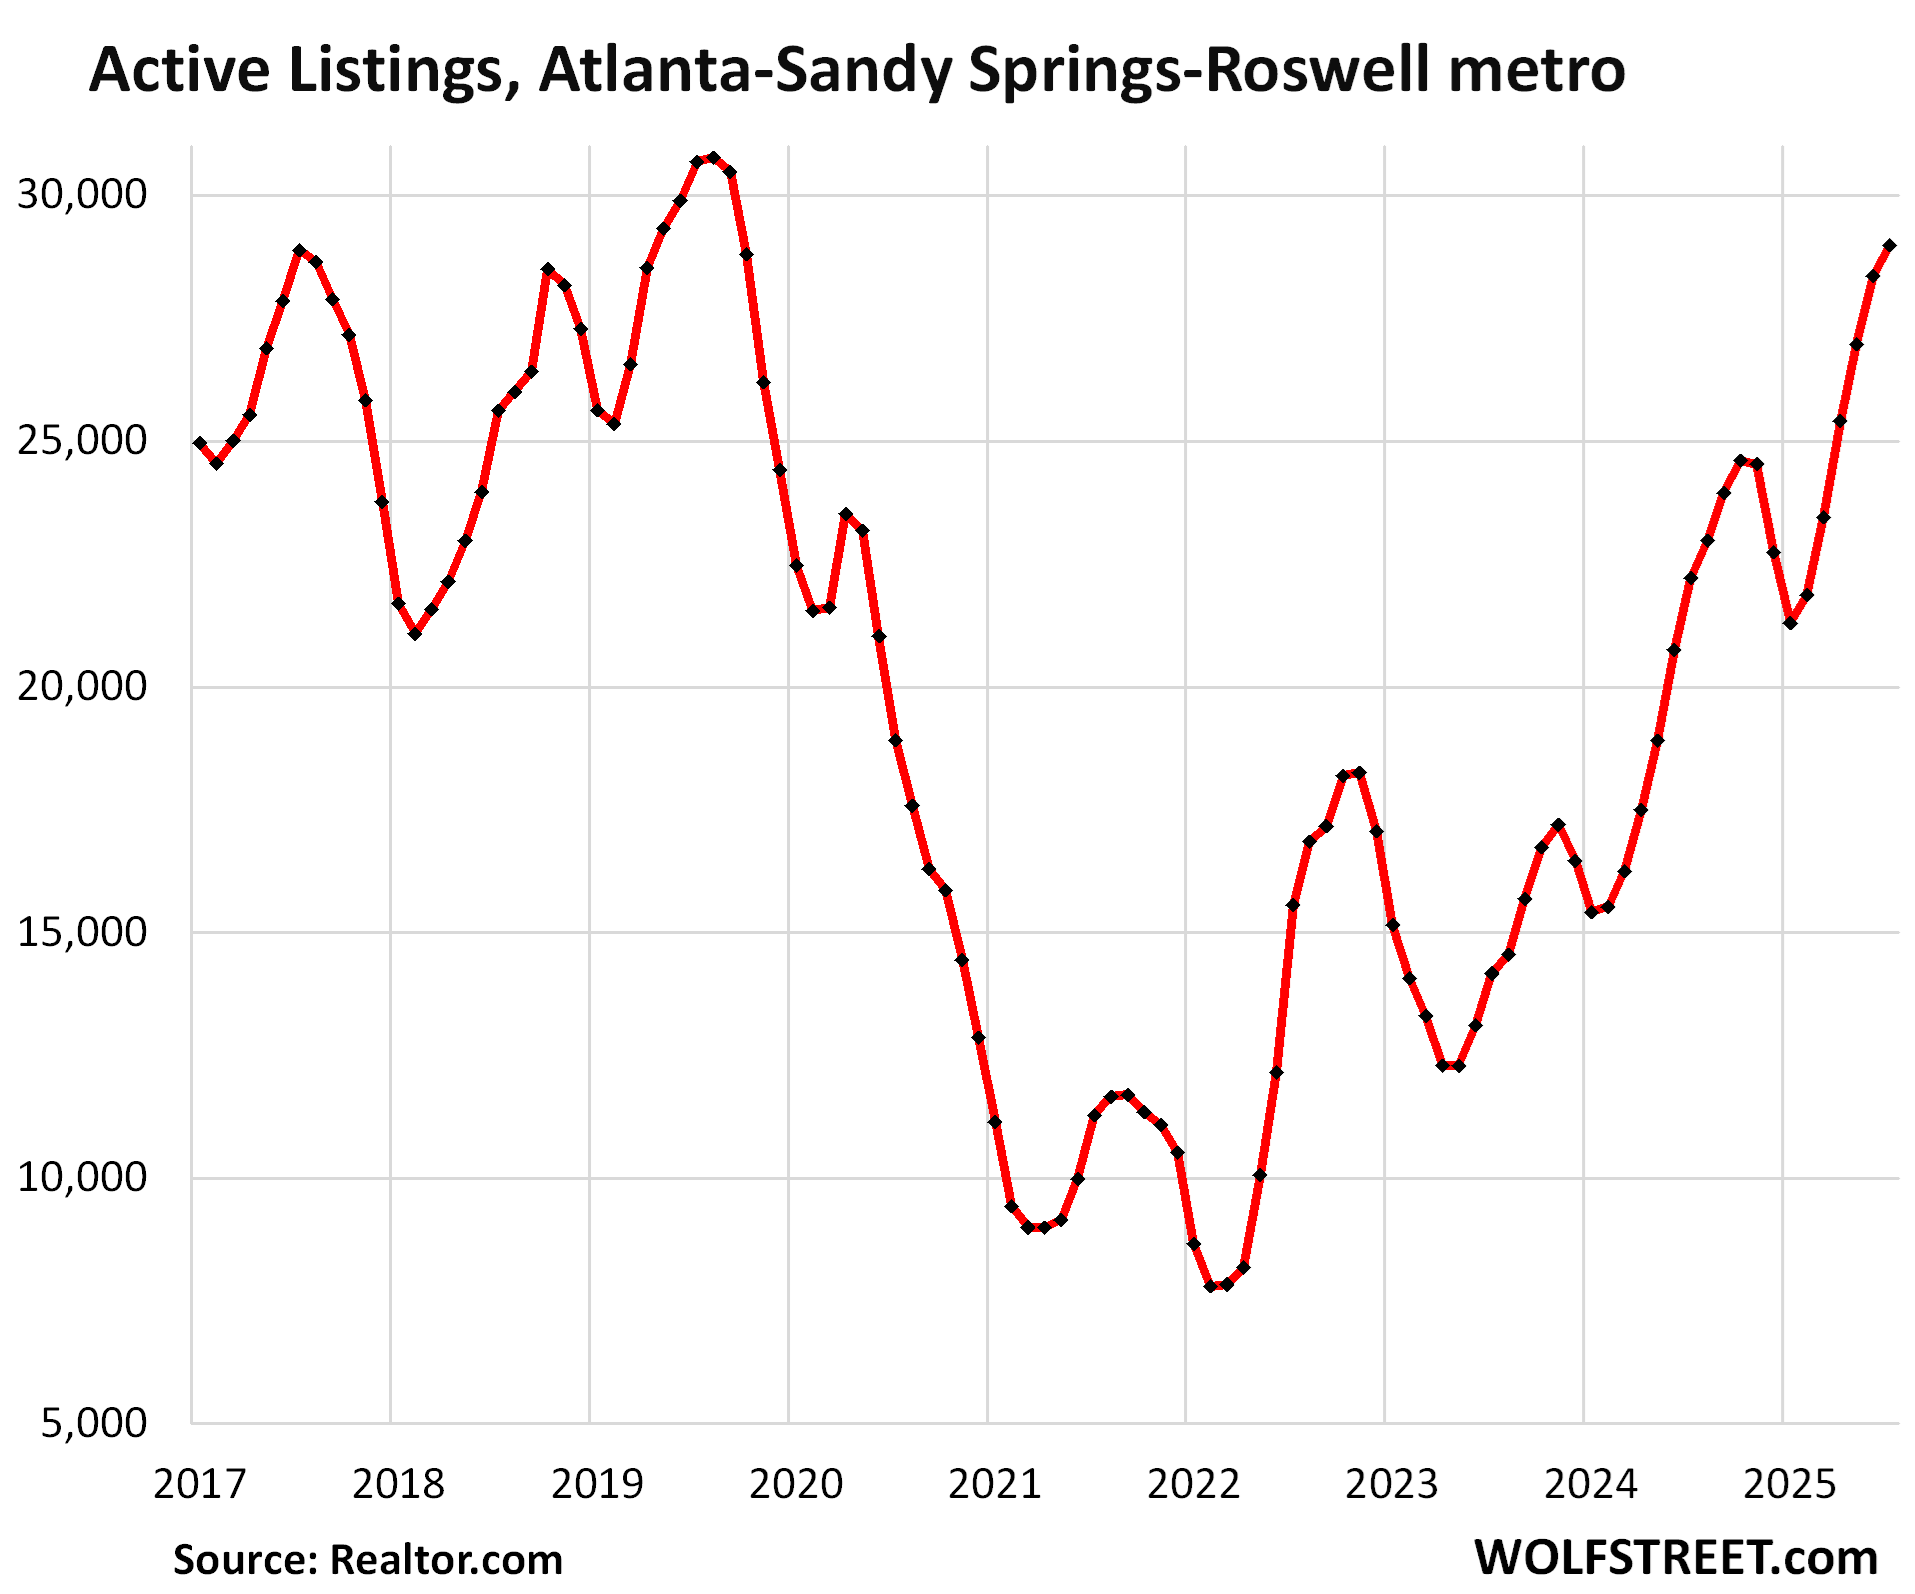
| Atlanta MSA, Home Prices | ||||
| From July 2022 | MoM | YoY | Since 2000 | Jan 2020 – Jun 2022 |
| -0.3% | -0.3% | -2.8% | 156% | 51% |
Prices had exploded 51% between January 2020 and June 2022.
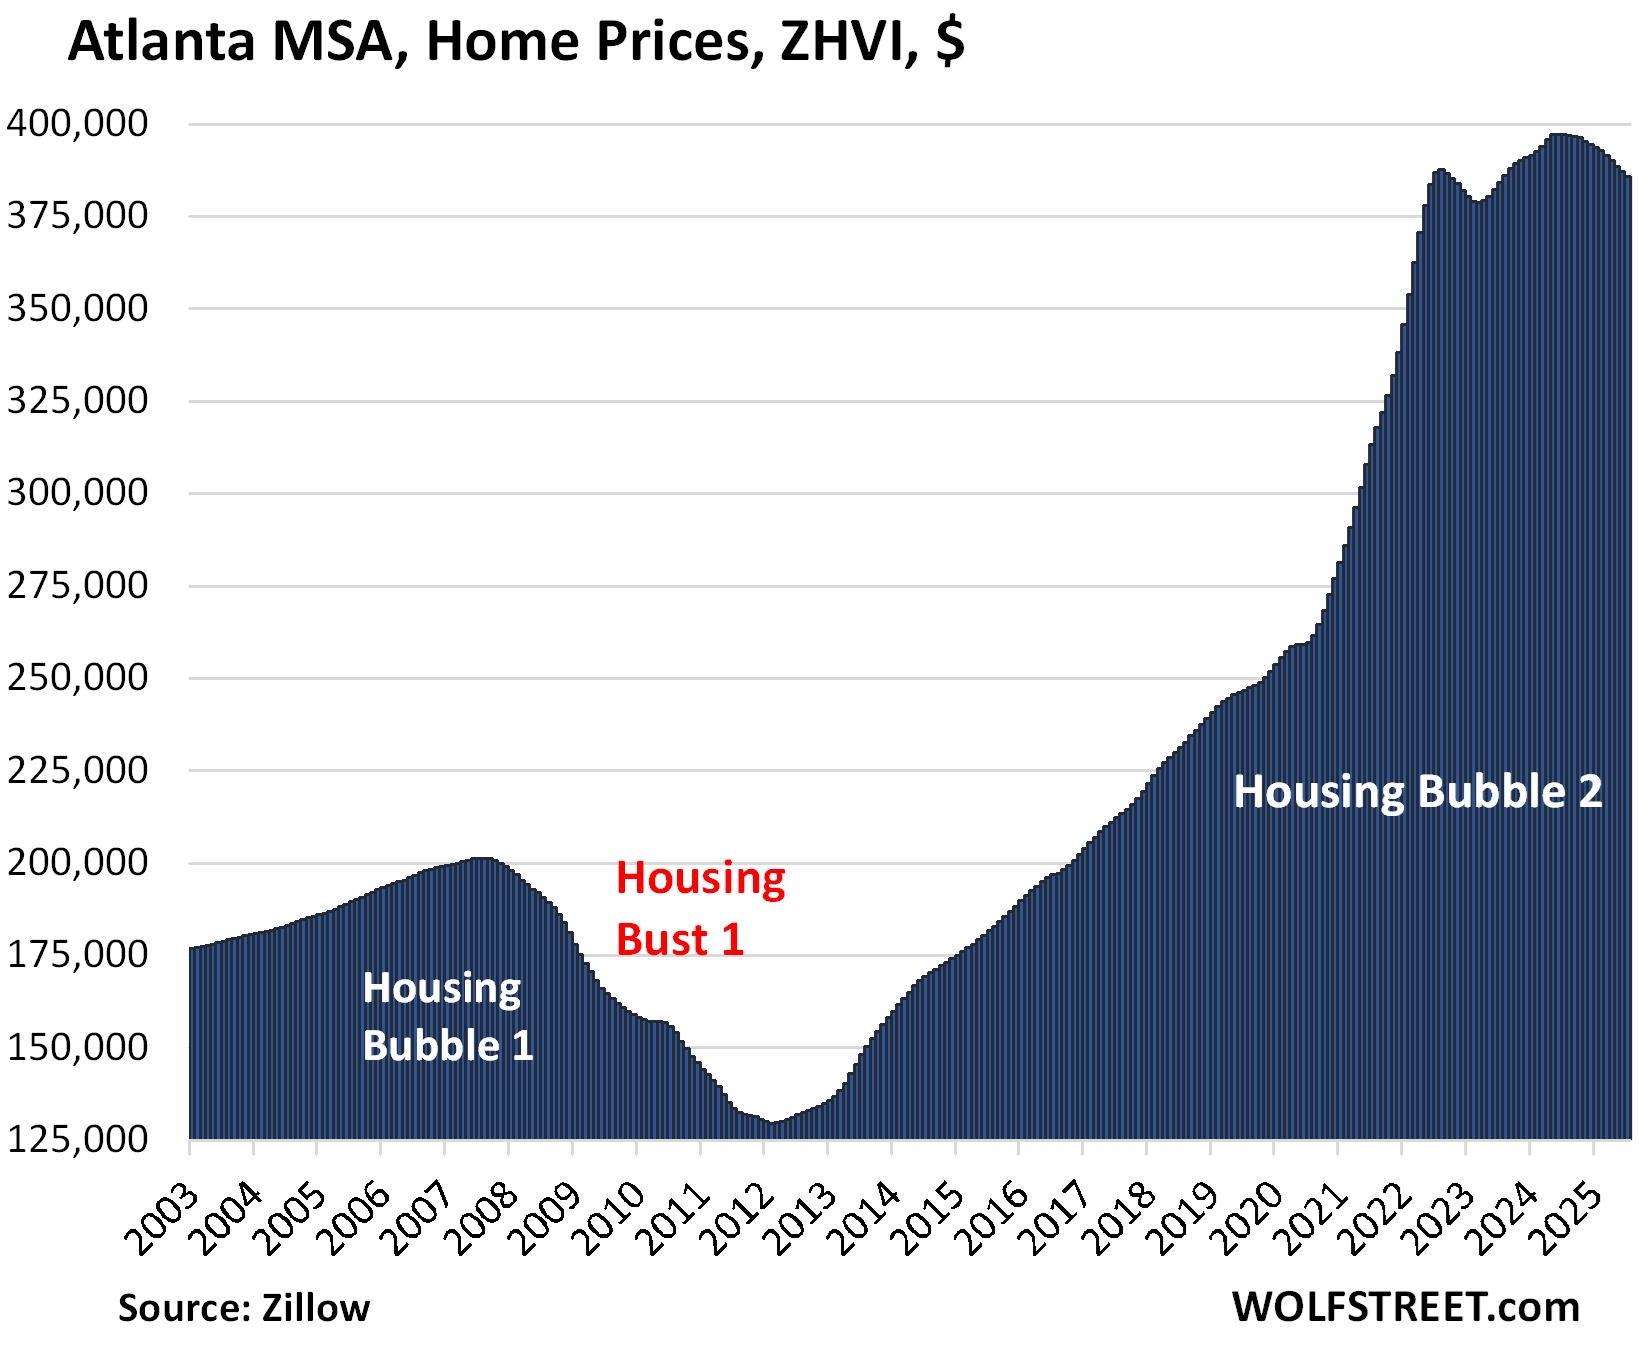
And inventory in the Atlanta-Sandy Springs-Roswell metro:
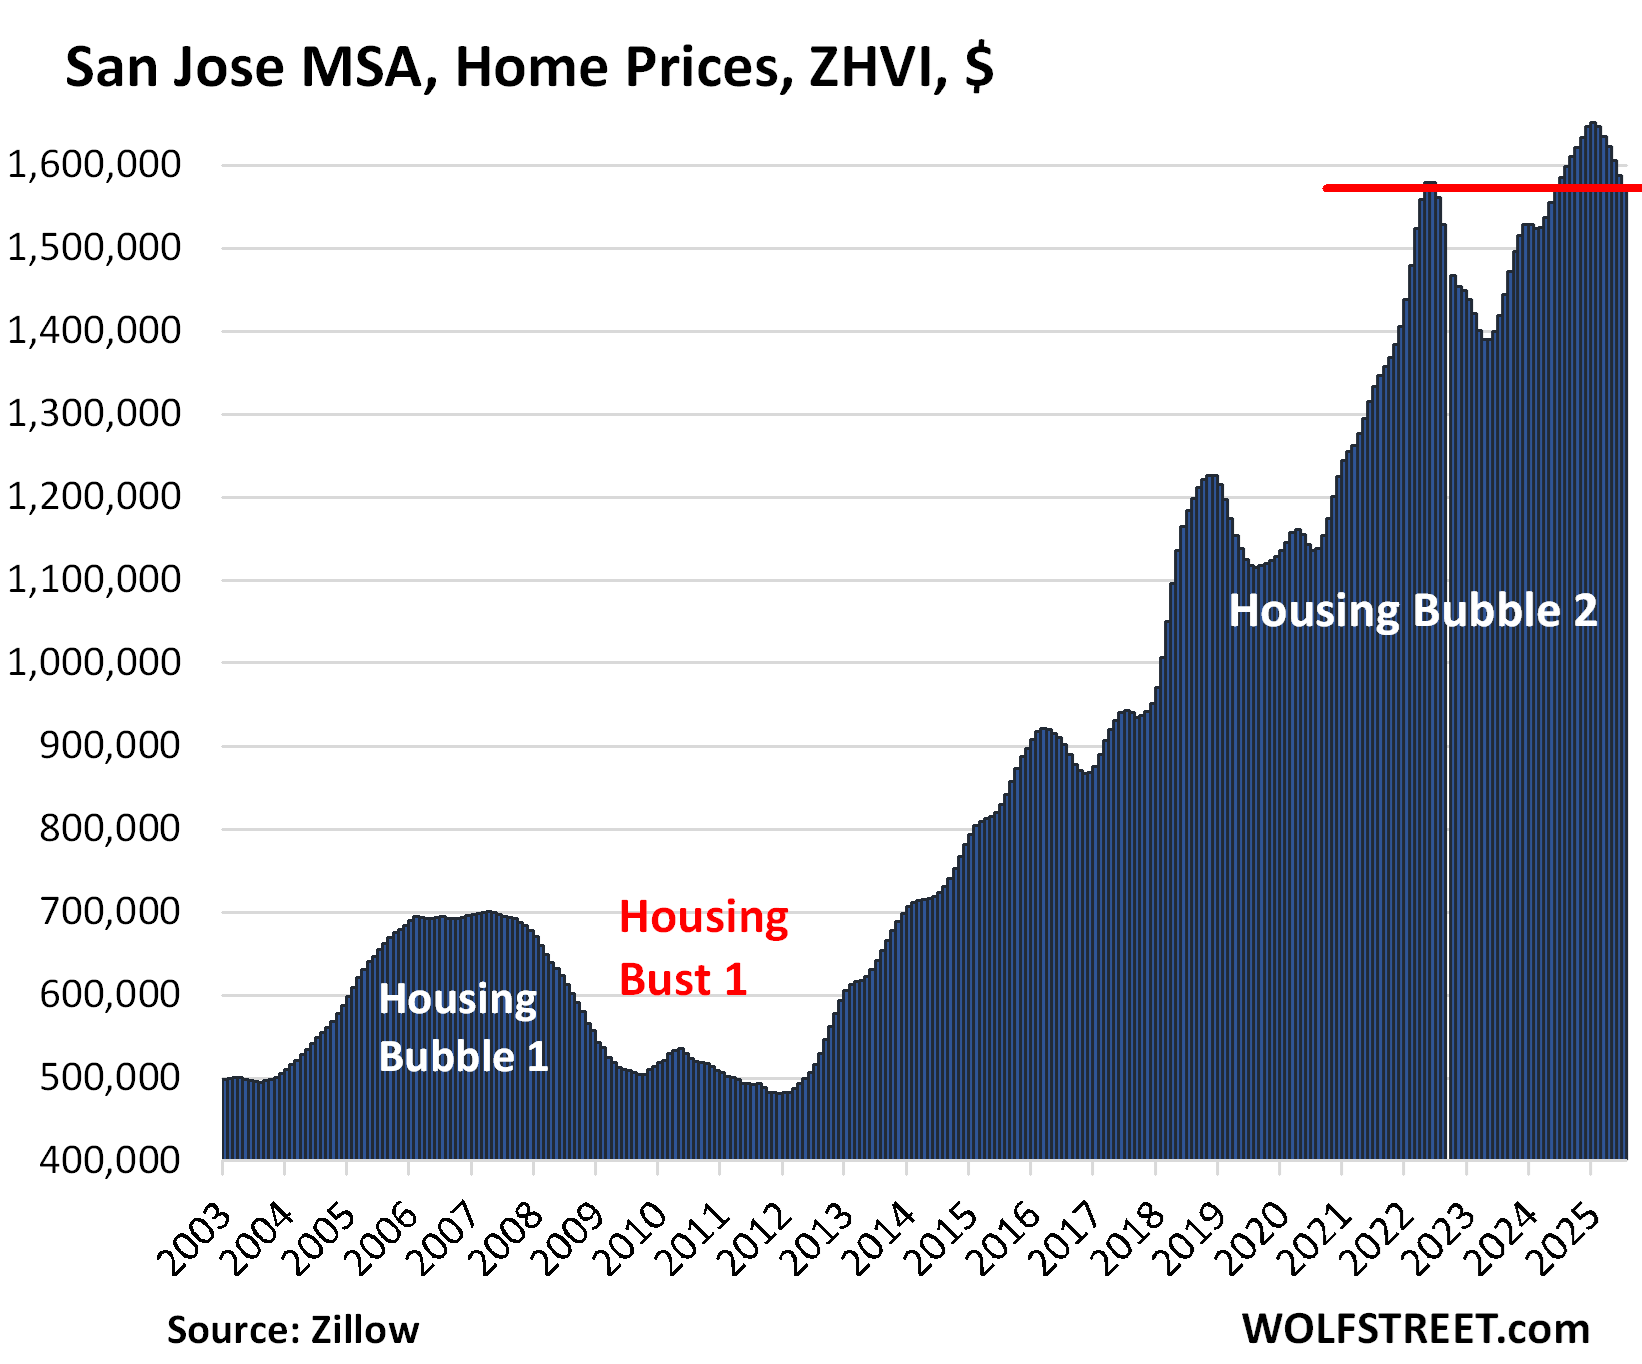
| San Jose MSA, Home Prices | ||||
| From May 2022 peak | MoM | YoY | Since 2000 | Jan 2020 – Jun 2022 |
| -0.2% | -0.8% | -0.6% | 327.2% | 39% |
Prices fell sharply over the past few months, turning the index negative year-over-year, and re-pushing it below the May 2022 high.
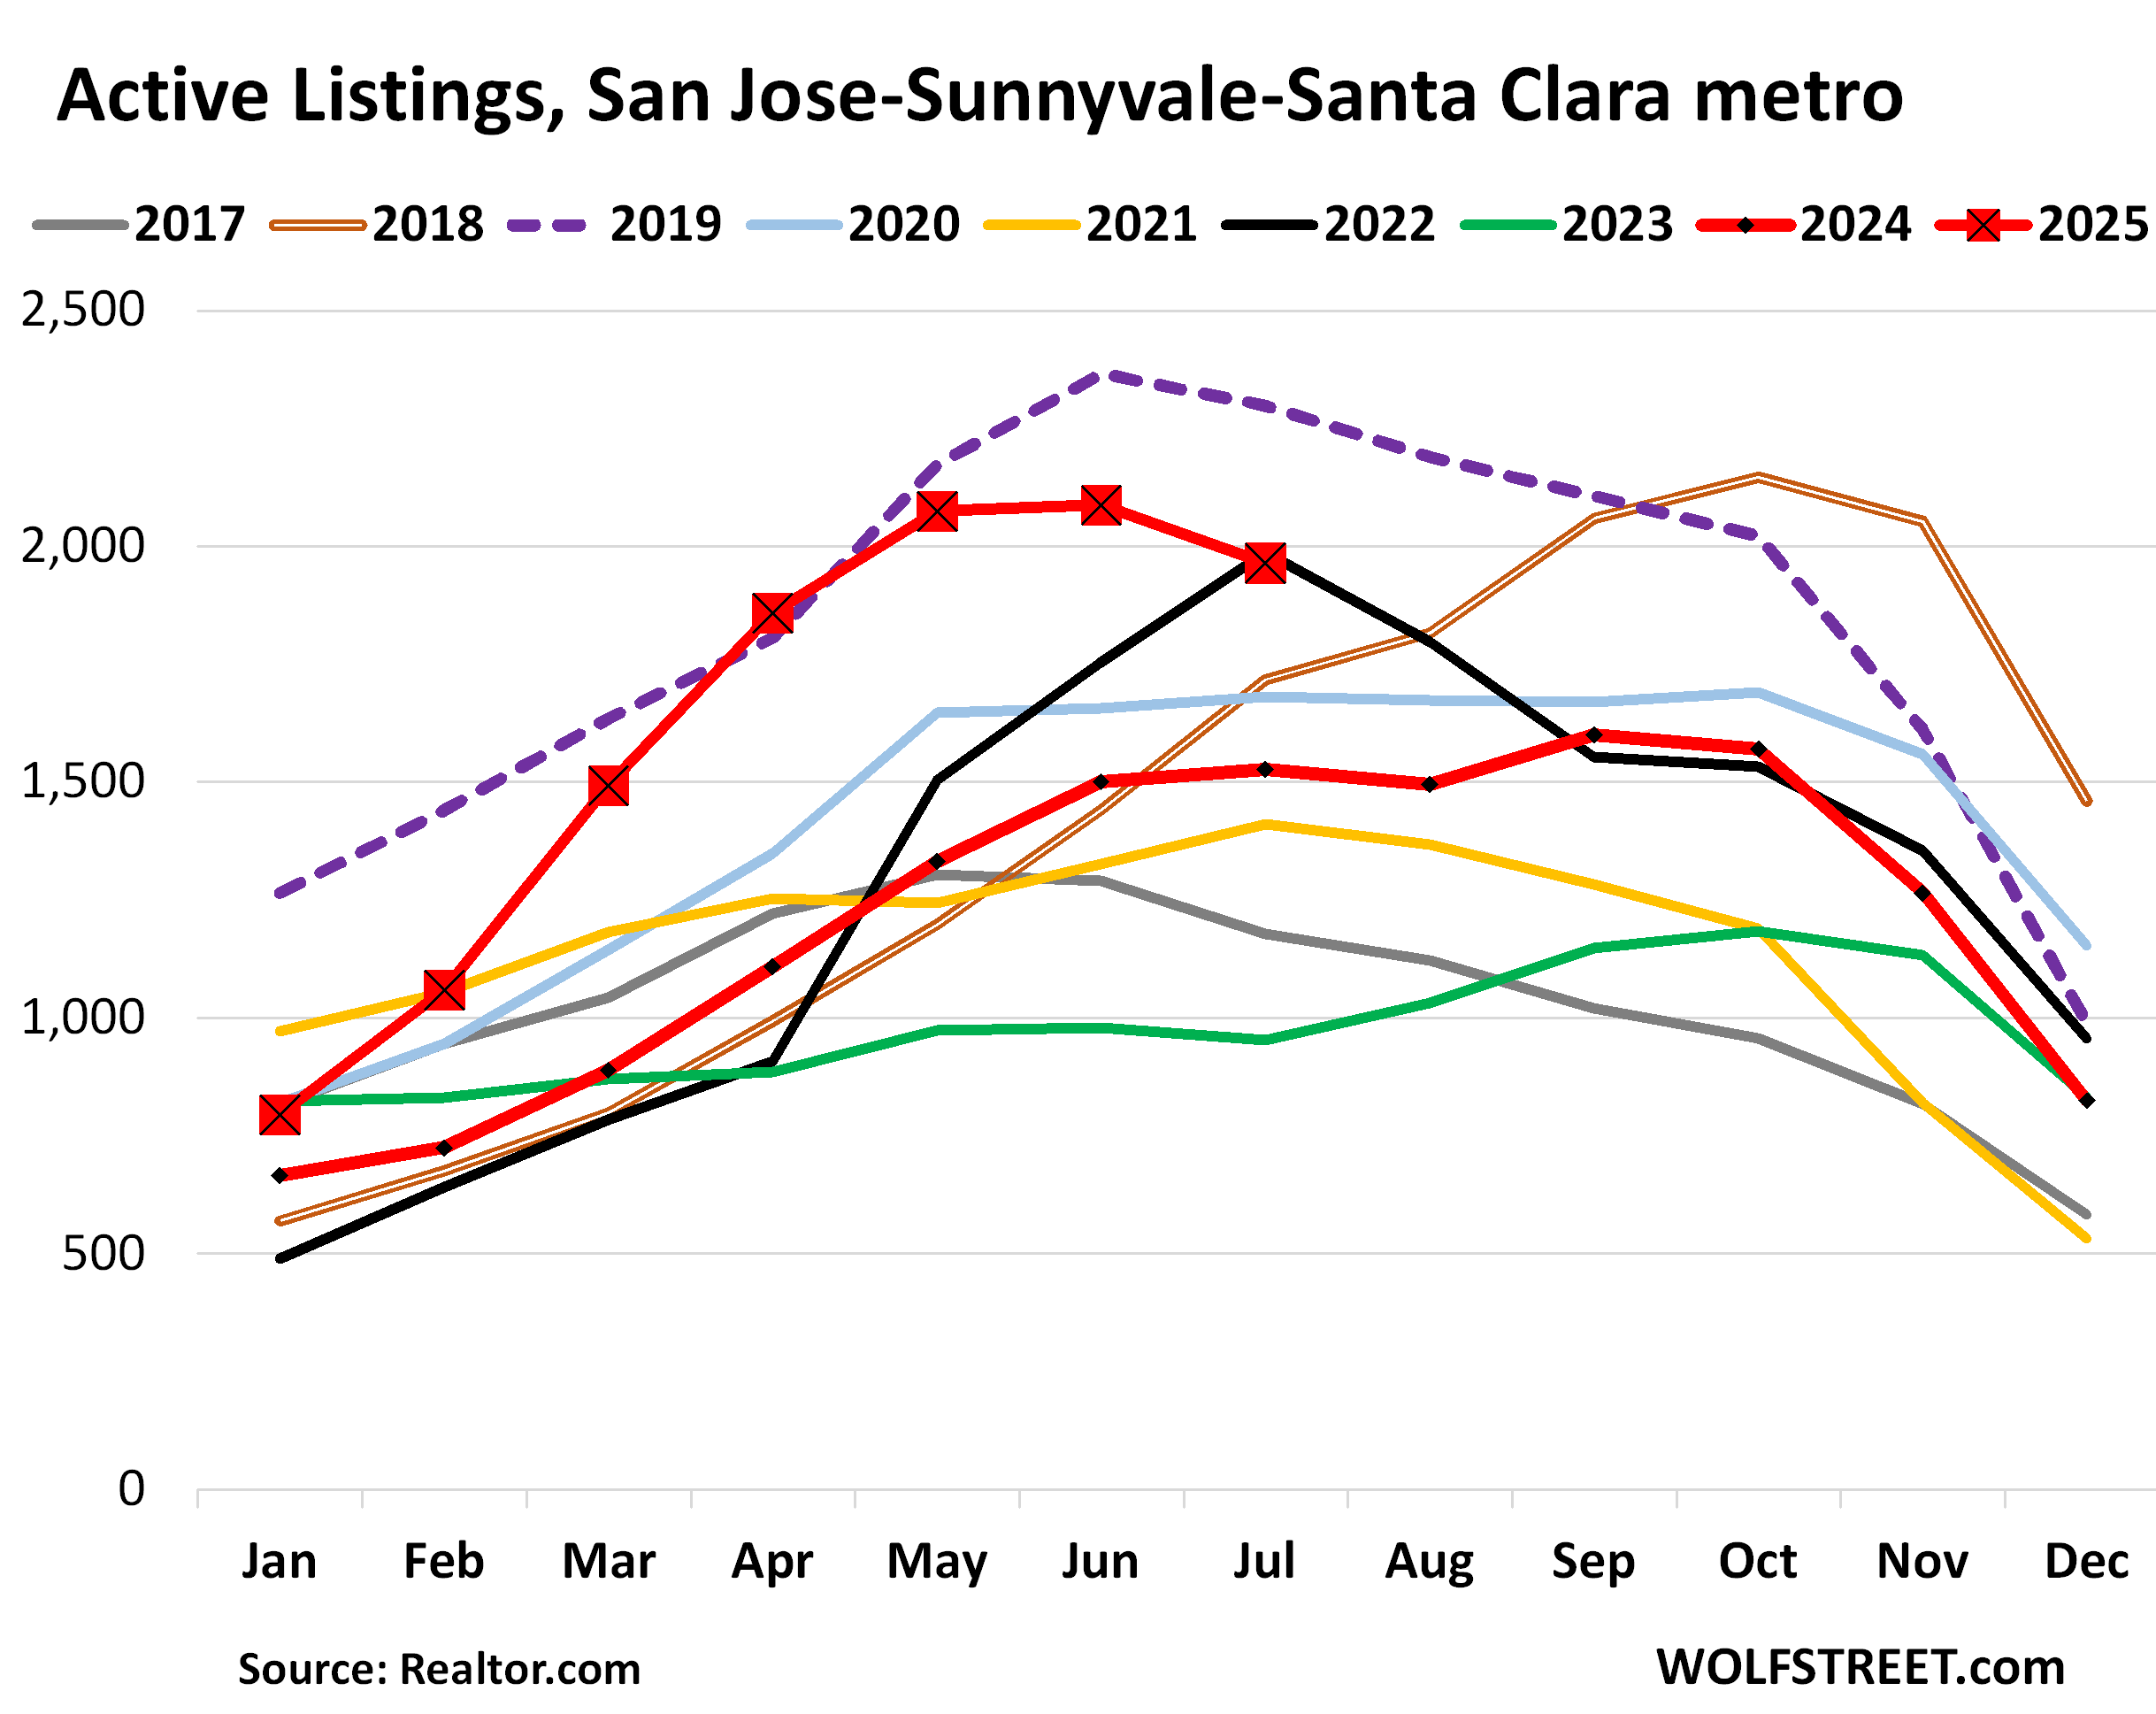
And inventory in the San Jose-Sunnyvale-Santa Clara MSA:
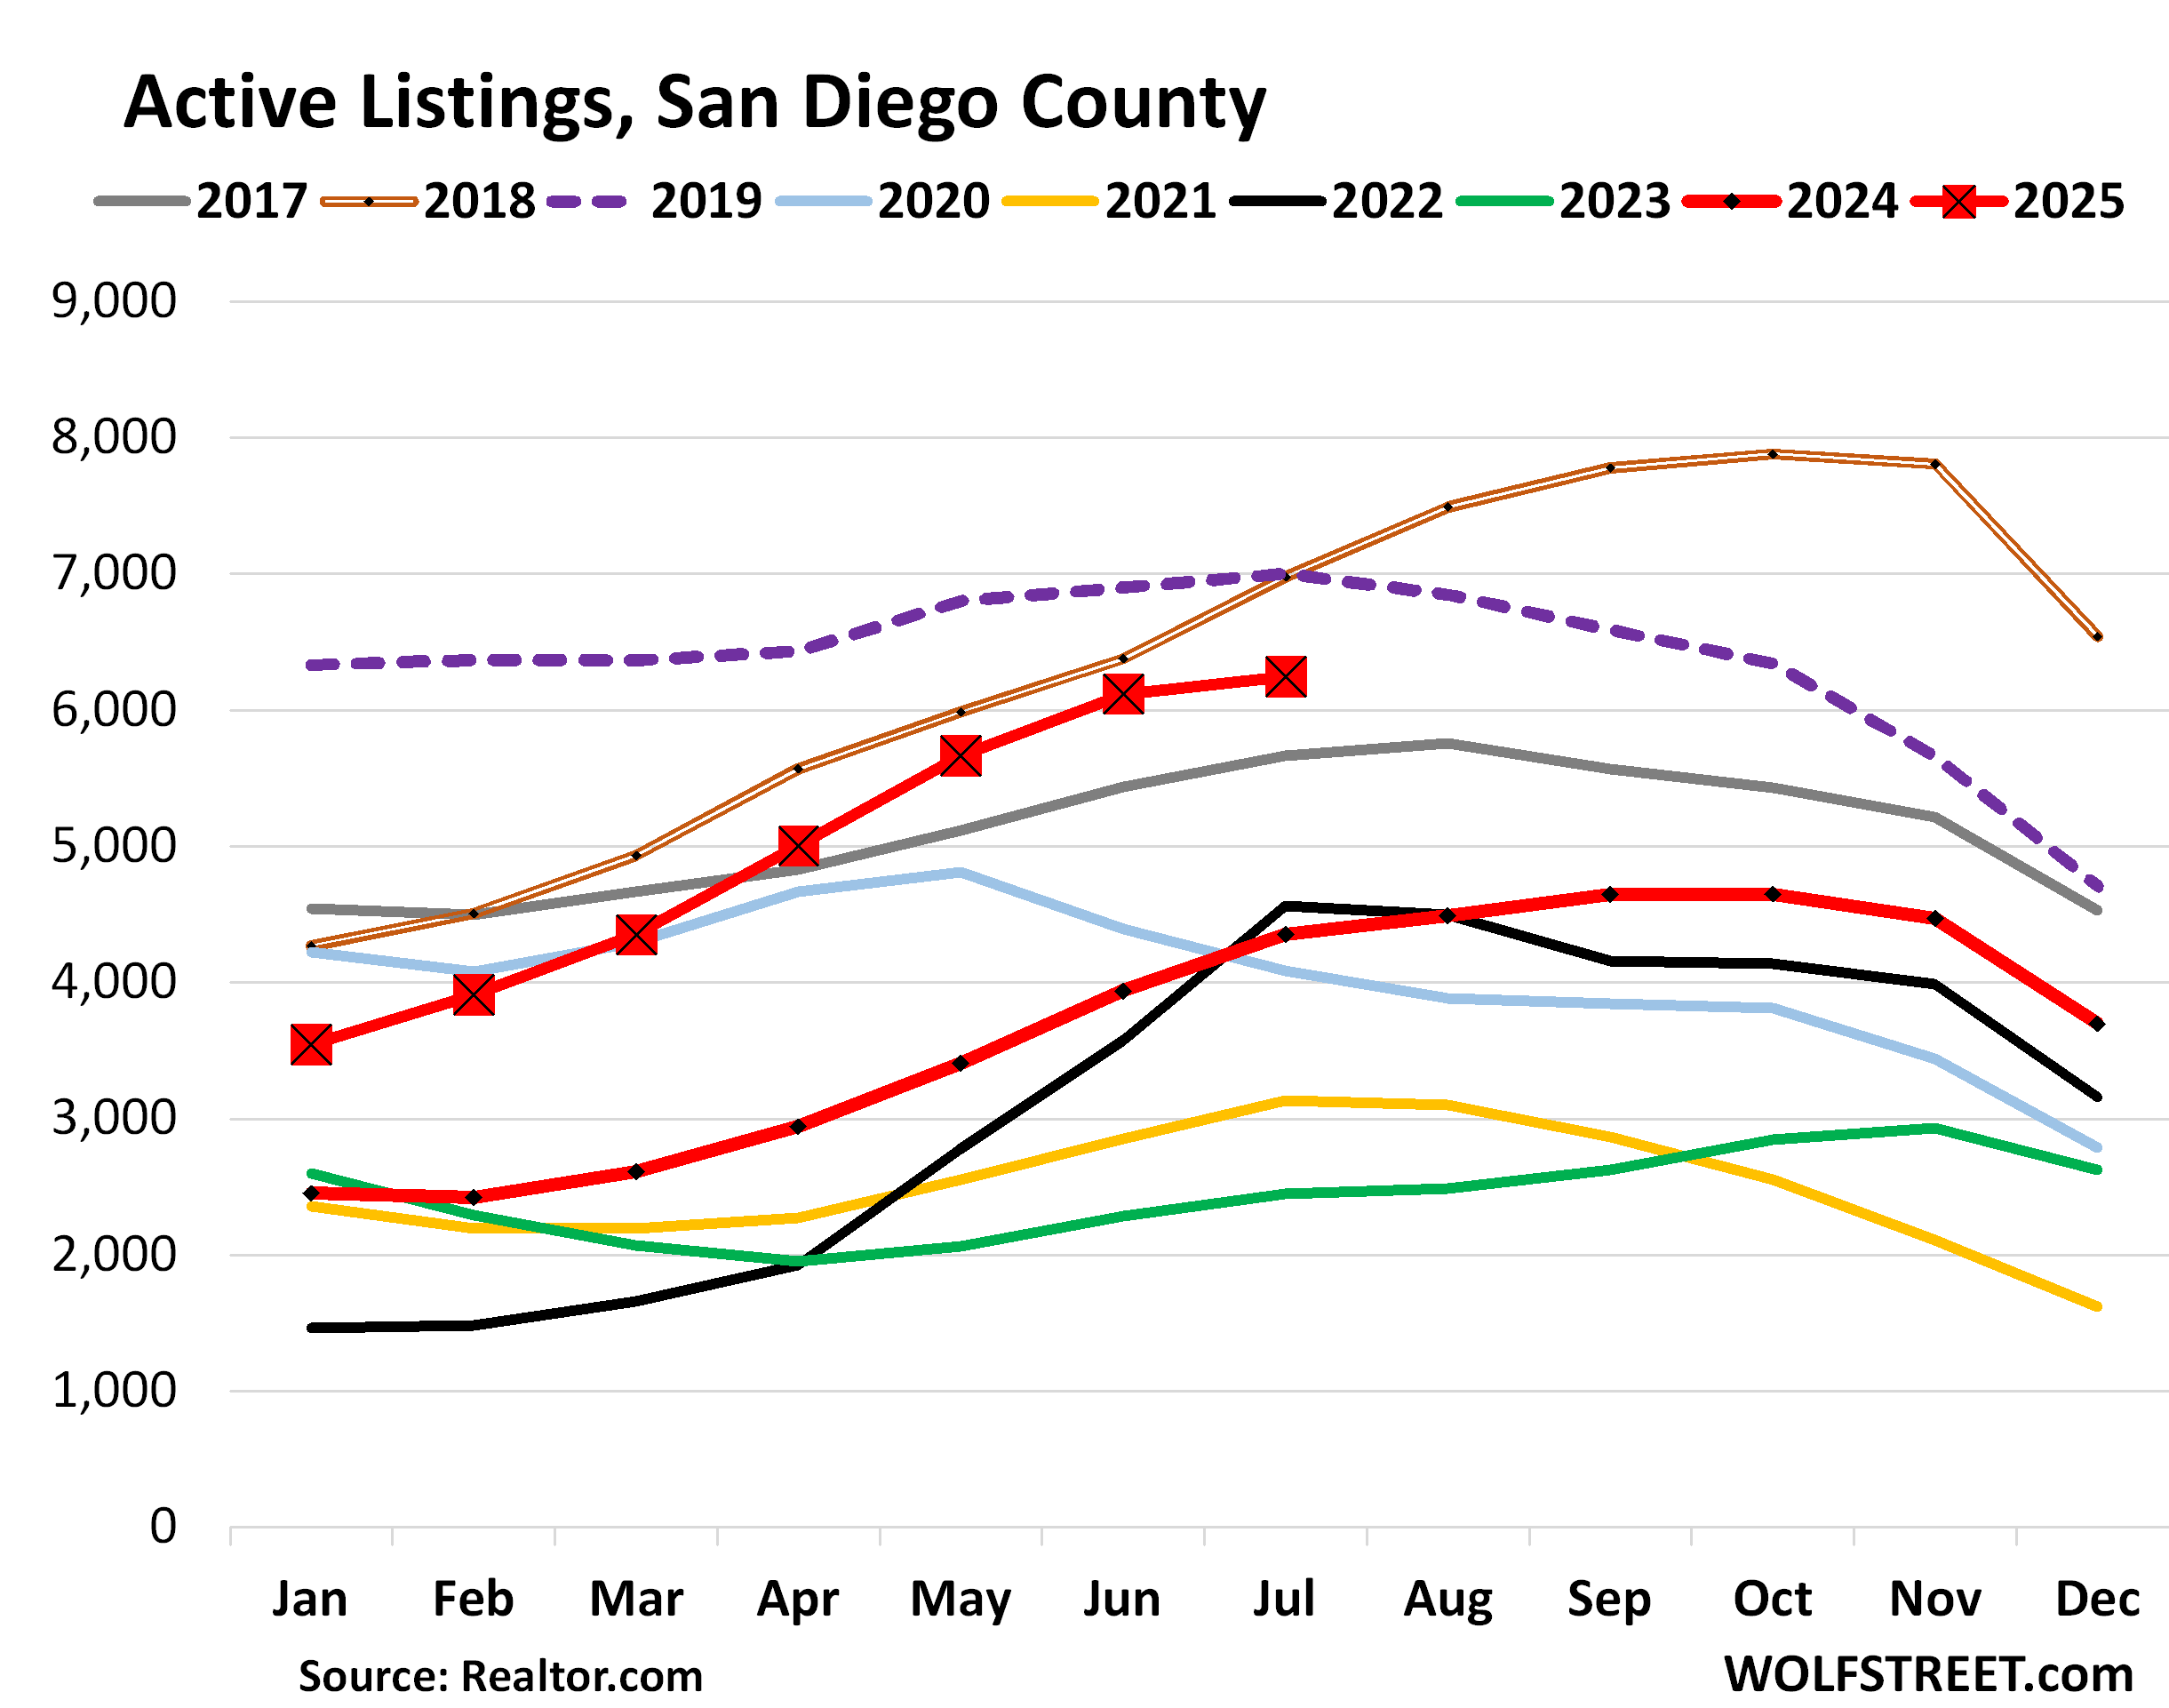
| San Diego MSA, Home Prices | |||
| MoM | YoY | Since 2000 | Jan 2020 – Jun 2022 |
| -0.5% | -2.2% | 330% | 48% |
Prices had spiked 48% between January 2020 and June 2022.
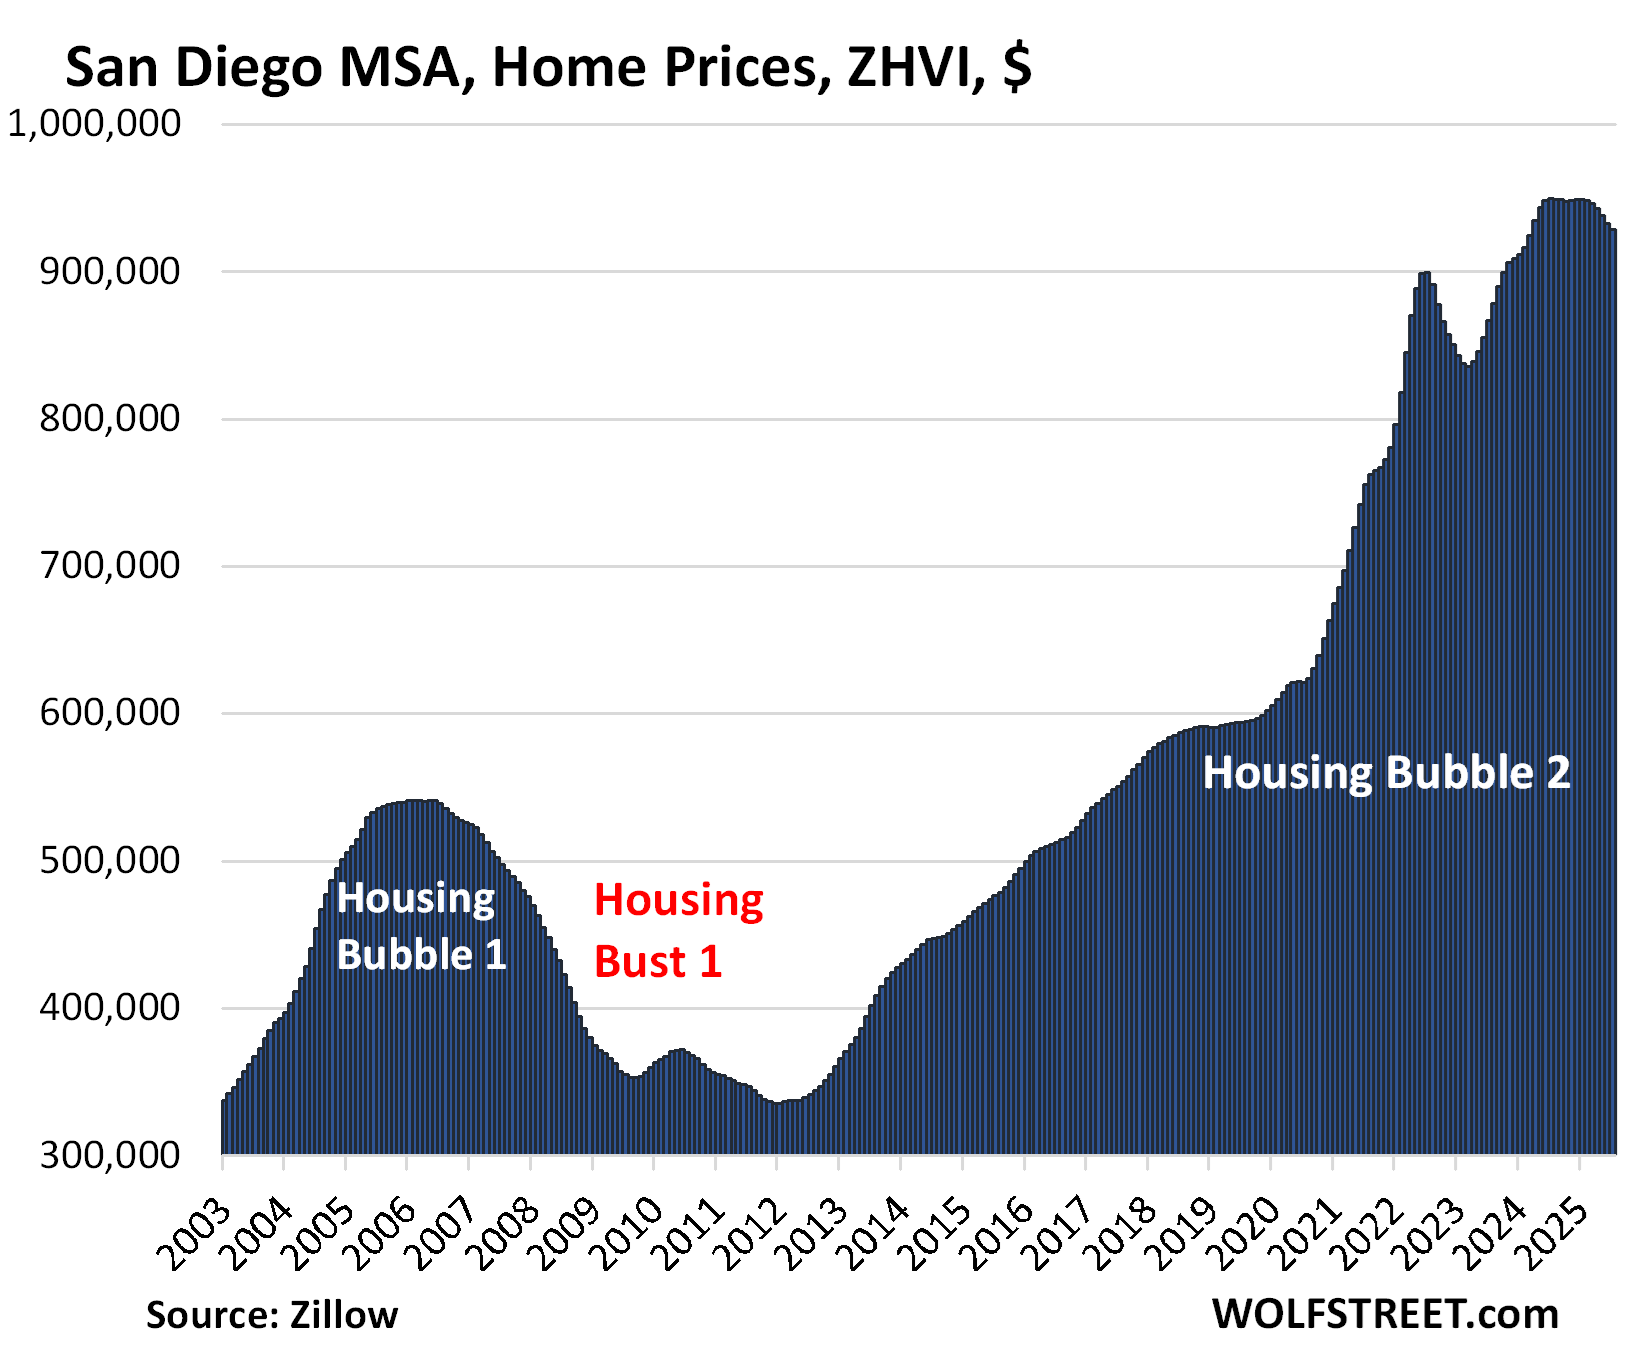
Here is the inventory in San Diego County:
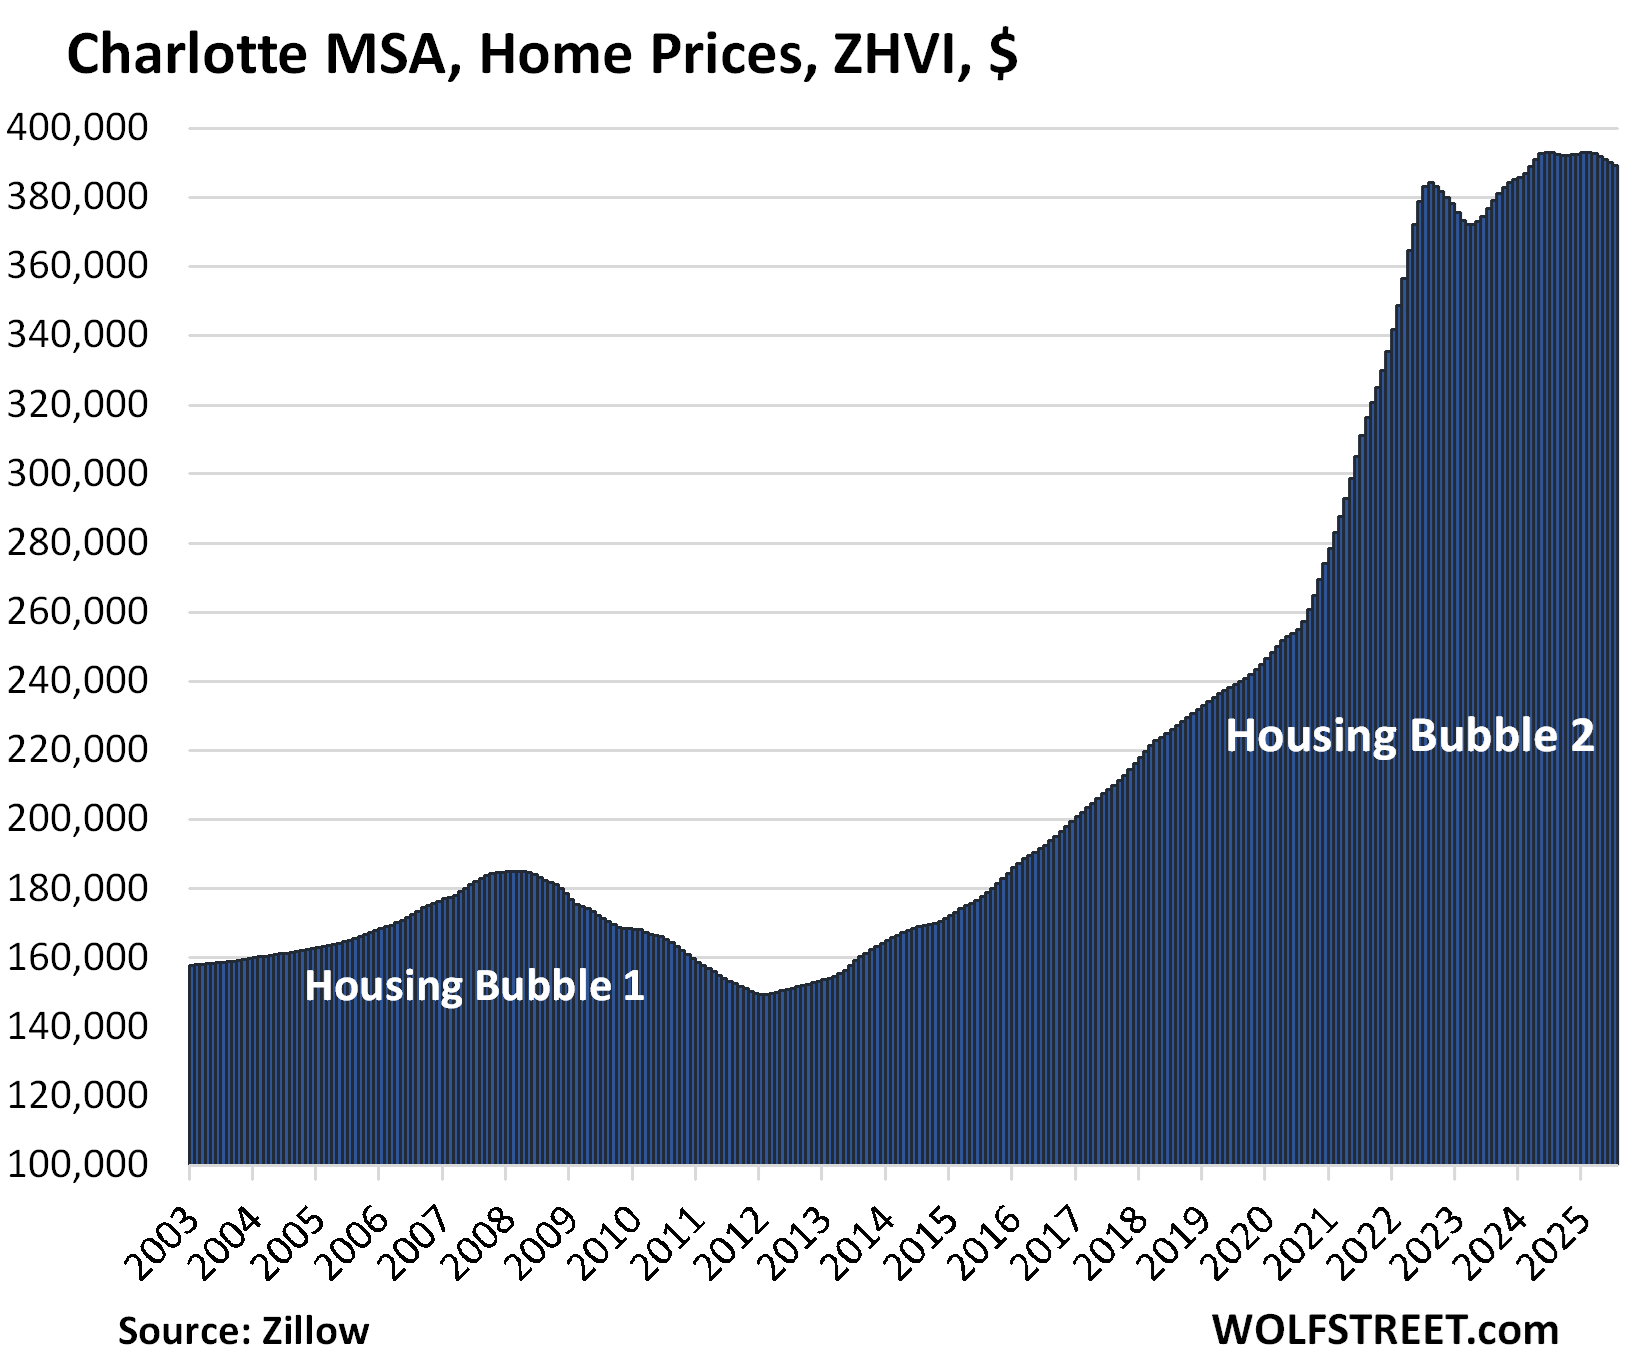
| Charlotte MSA, Home Prices | |||
| MoM | YoY | Since 2000 | Jan 2020 – Jun 2022 |
| -0.2% | -0.9% | 167% | 54% |
Prices had spiked 54% between January 2020 and June 2022.
| Los Angeles MSA, Home Prices | |||
| MoM | YoY | Since 2000 | Jan 2020 – Jun 2022 |
| -0.3% | 0.3% | 325% | 34% |
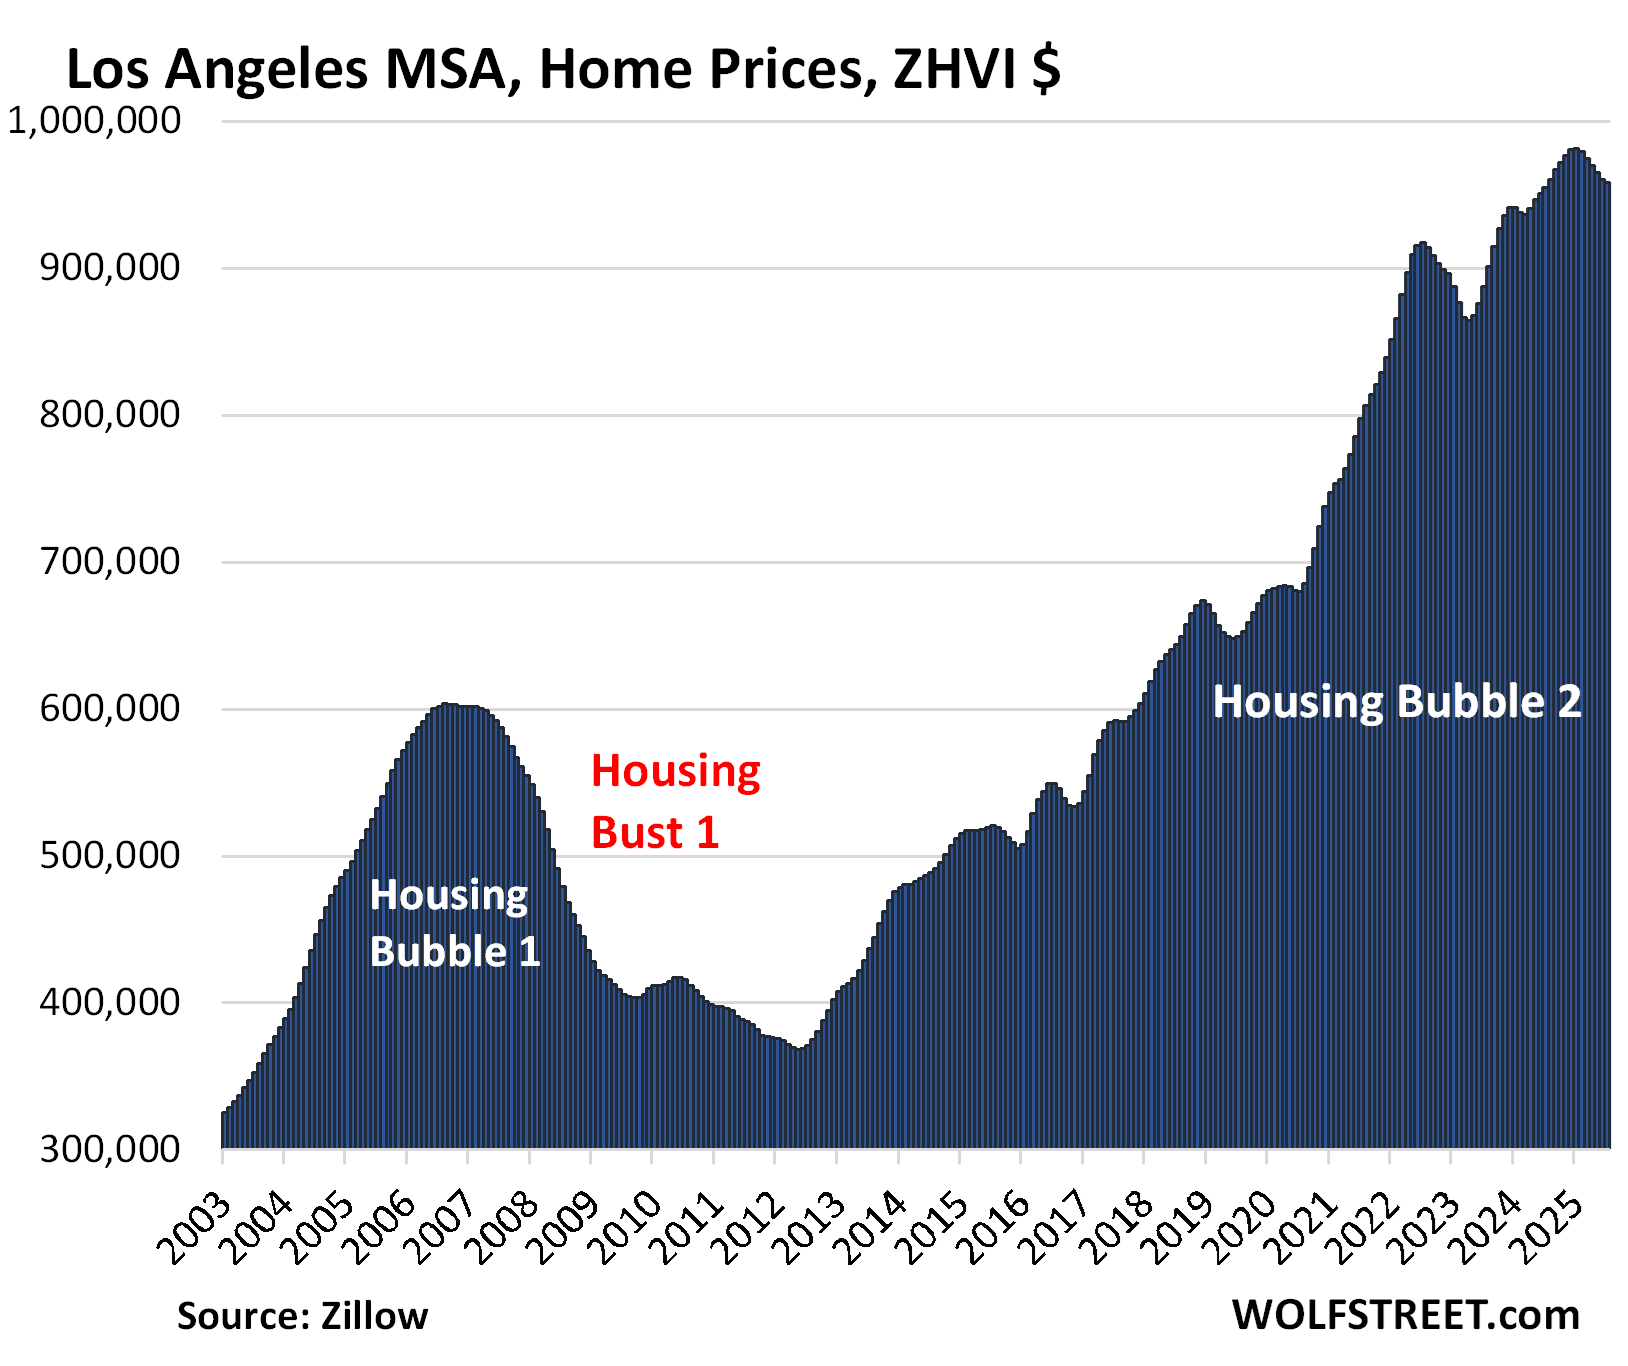
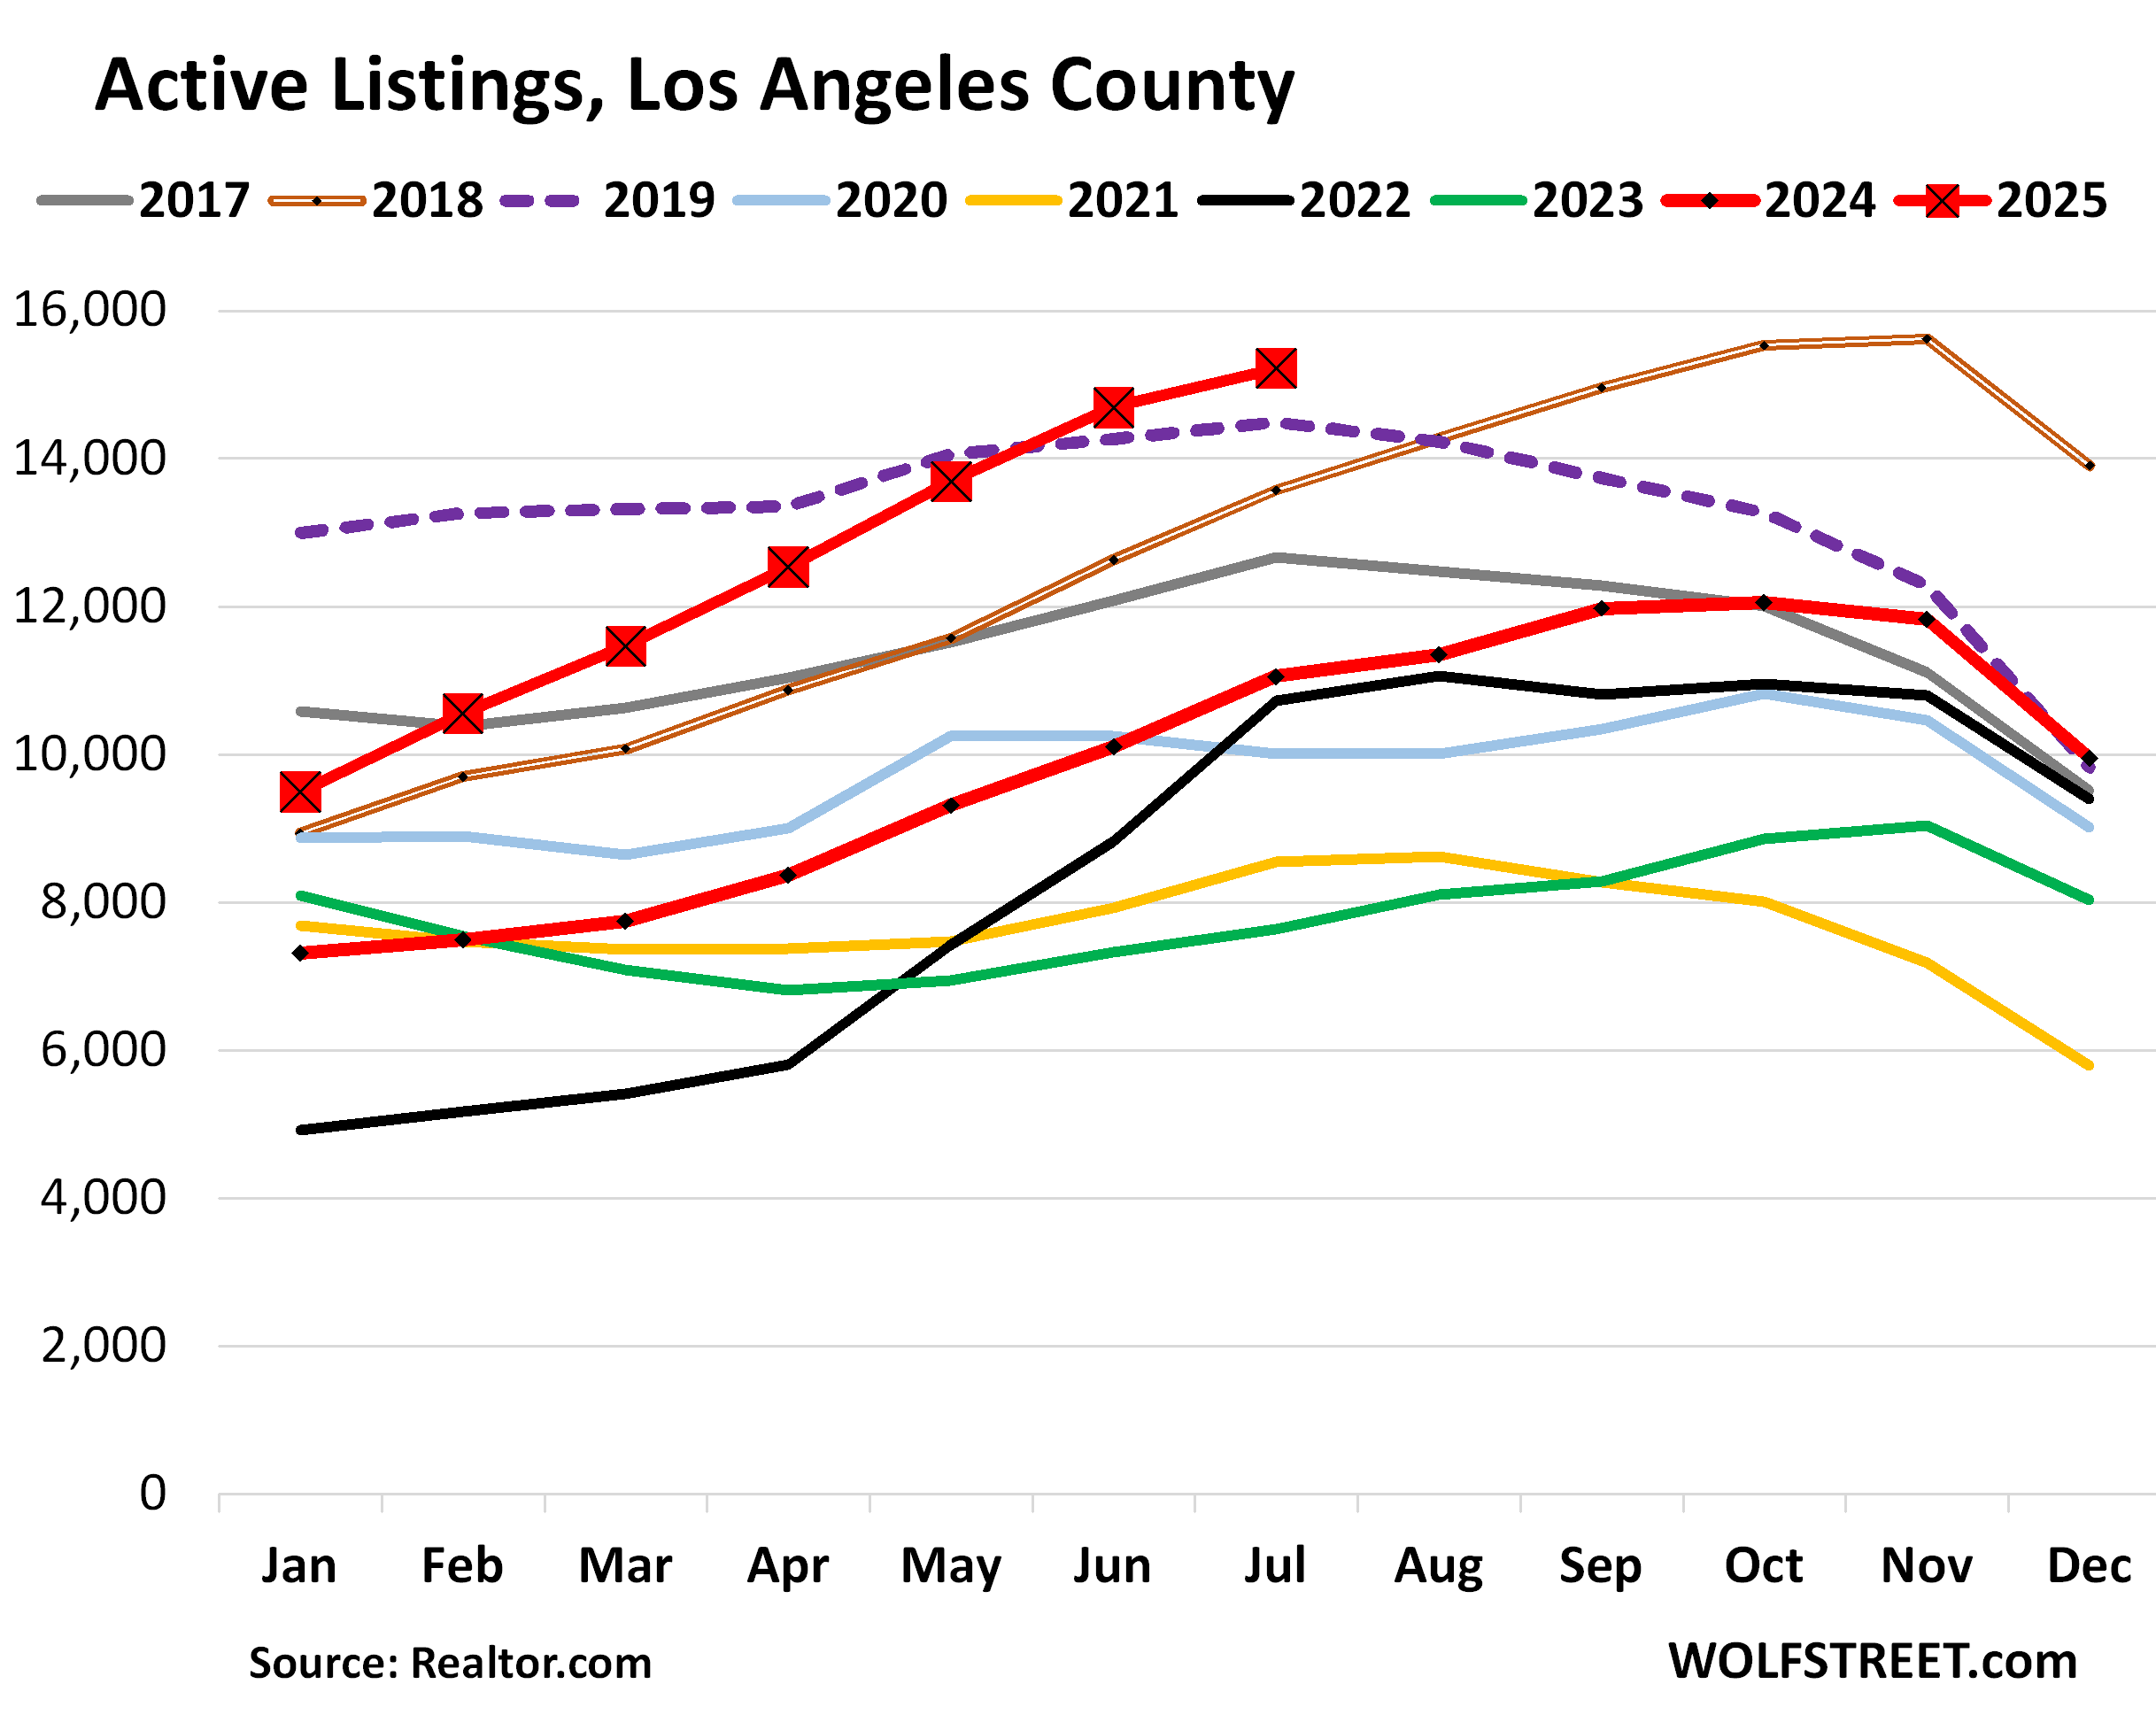
And inventory in Los Angeles County:
The metros where prices were still up year-over-year.
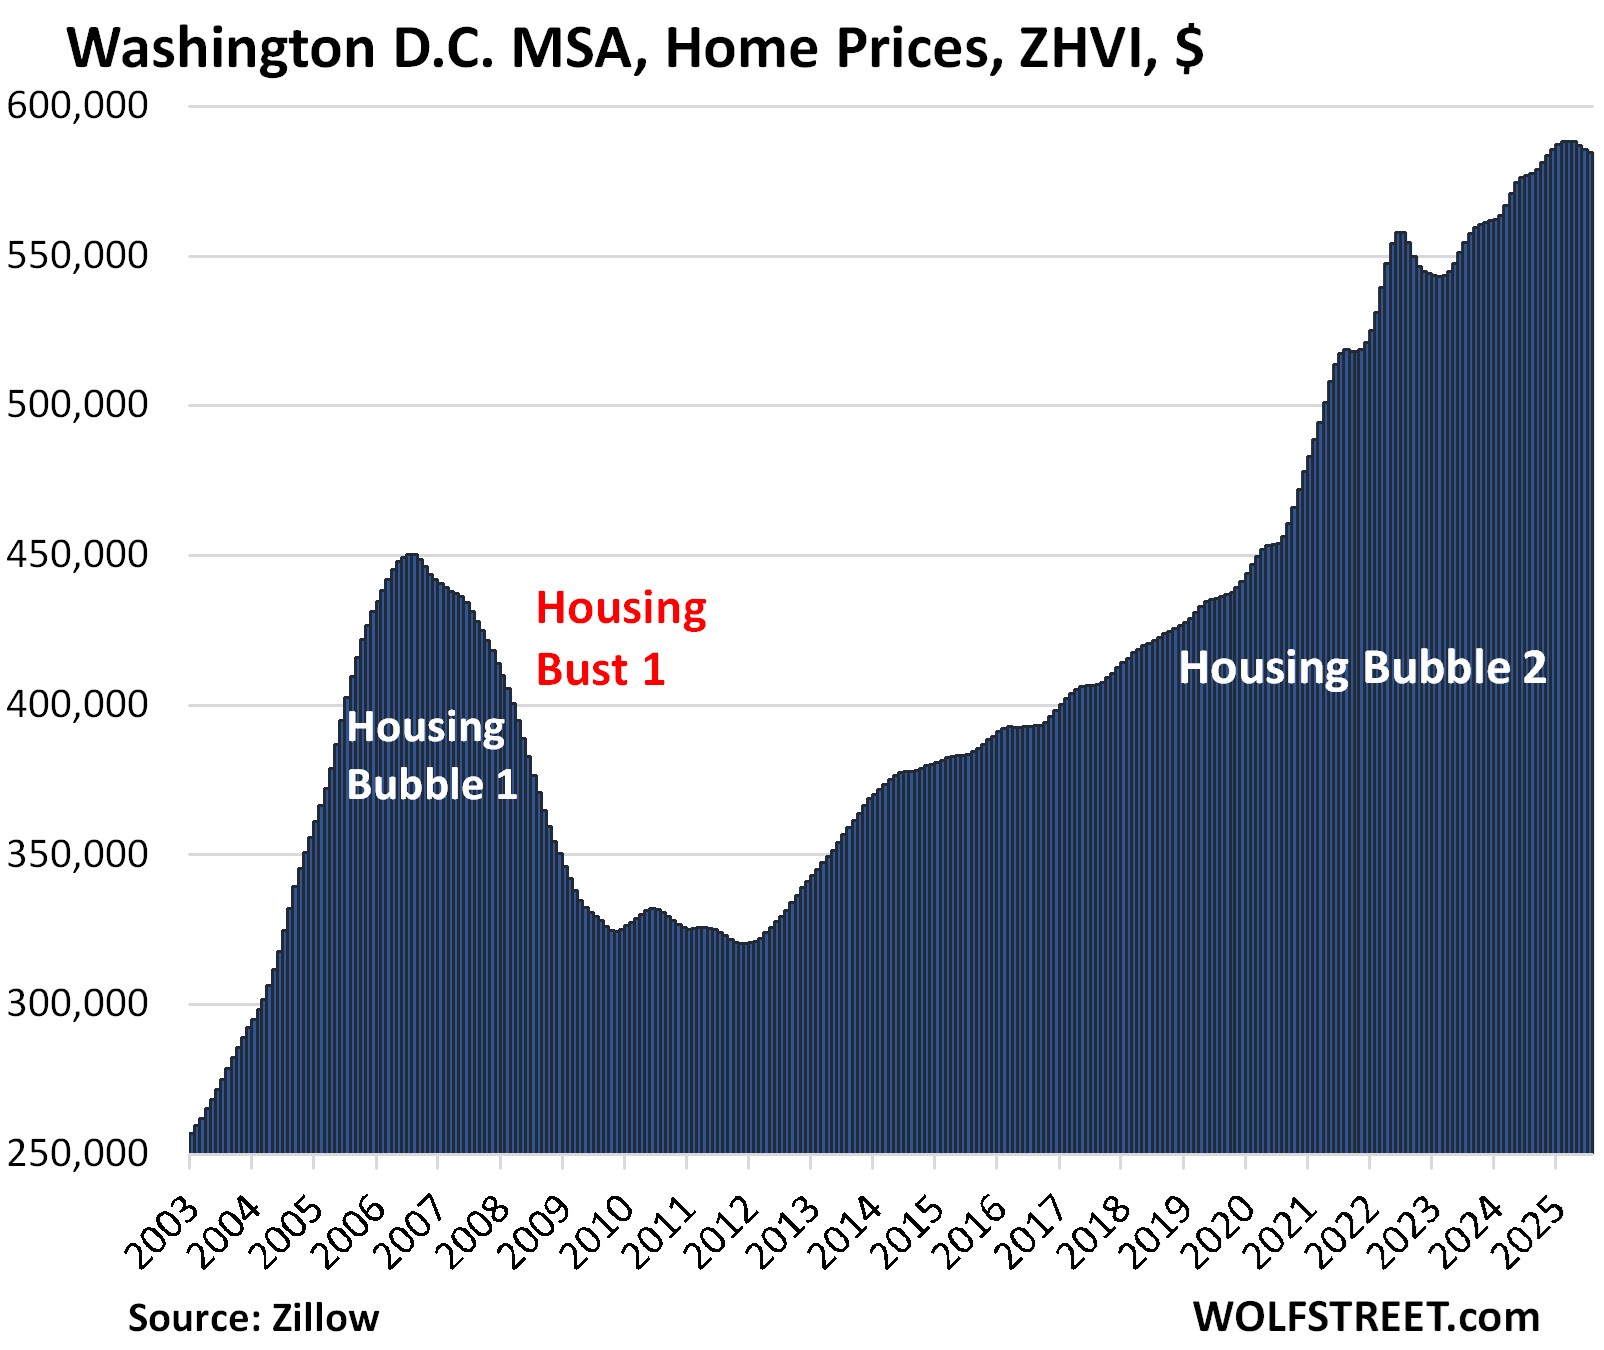
| Washington D.C. MSA, Home Prices | |||
| MoM | YoY | Since 2000 | Jan 2020 – Jun 2022 |
| -0.2% | 1.3% | 217% | 26% |
This vast MSA covers Washington D.C. plus portions of Virginia, West Virginia, and Maryland.
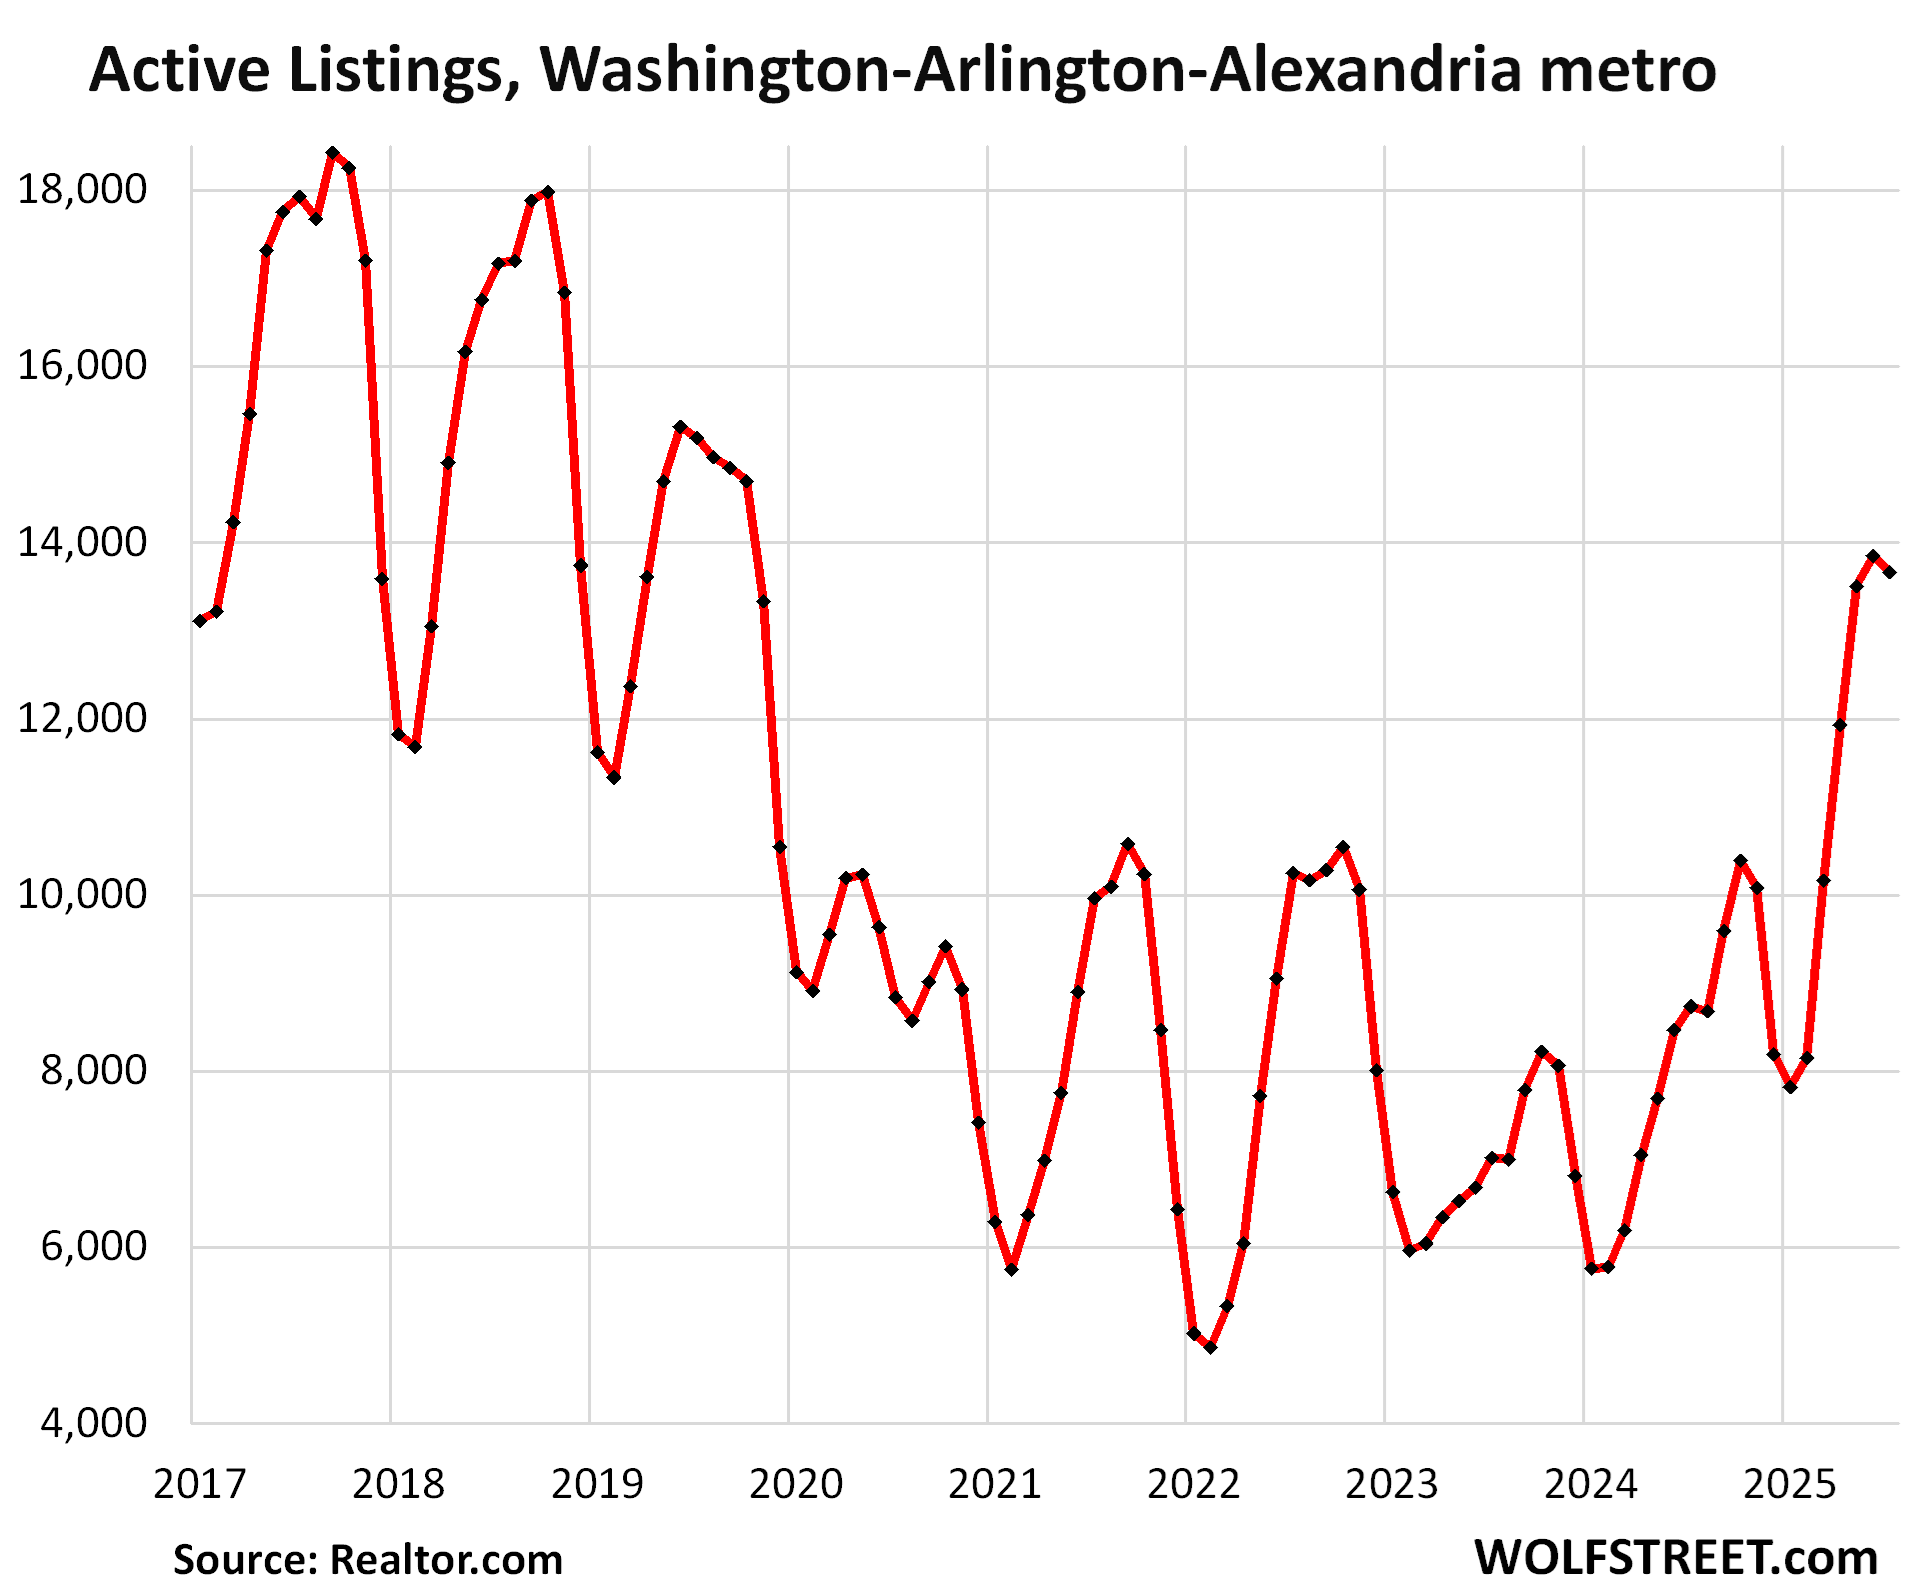
And inventory in the Washington-Arlington-Alexandria metro MSA:
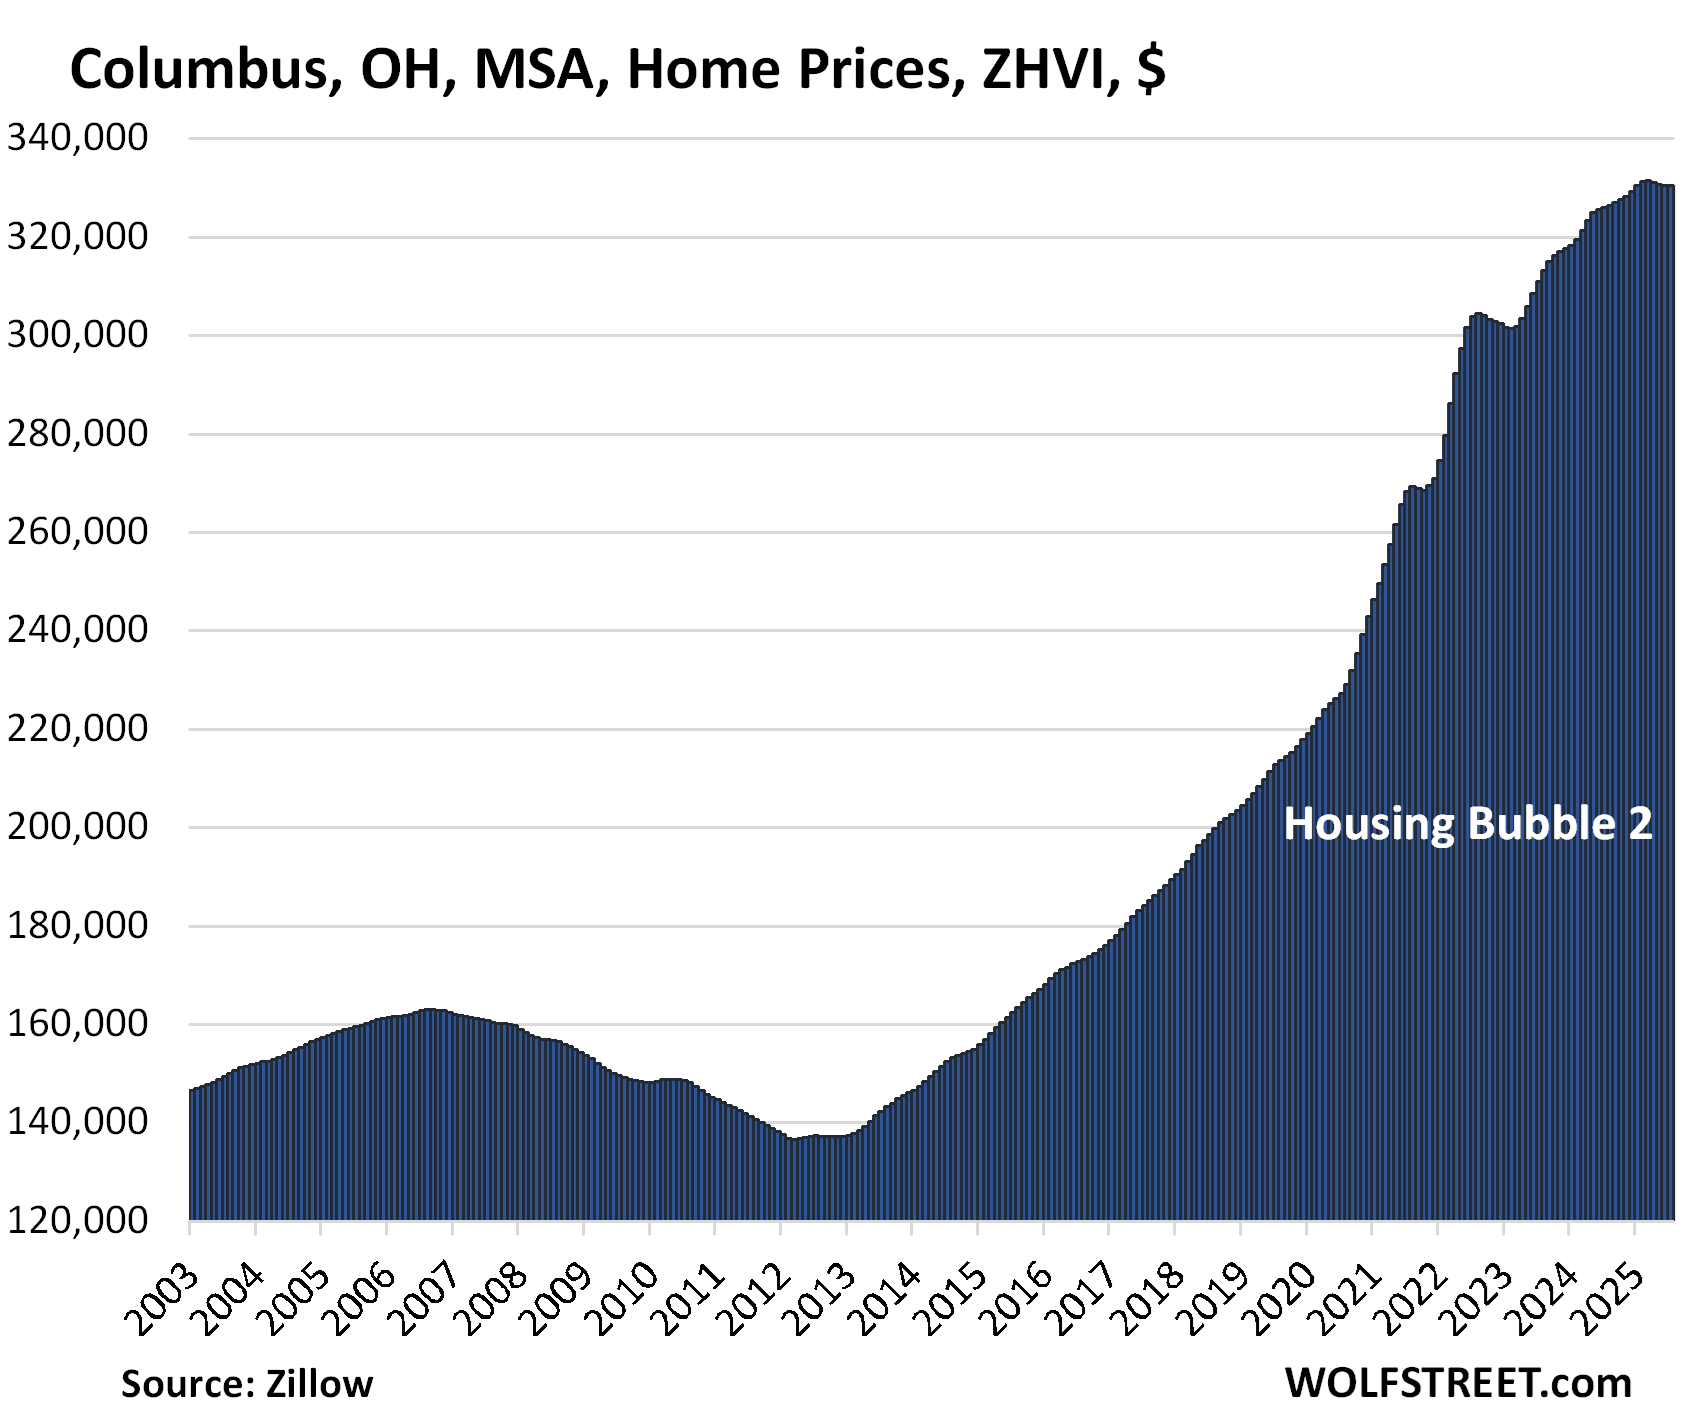
| Columbus, OH, MSA, Home Prices | |||
| MoM | YoY | Since 2000 | Jan 2020 – Jun 2022 |
| 0.0% | 1.4% | 154% | 38% |
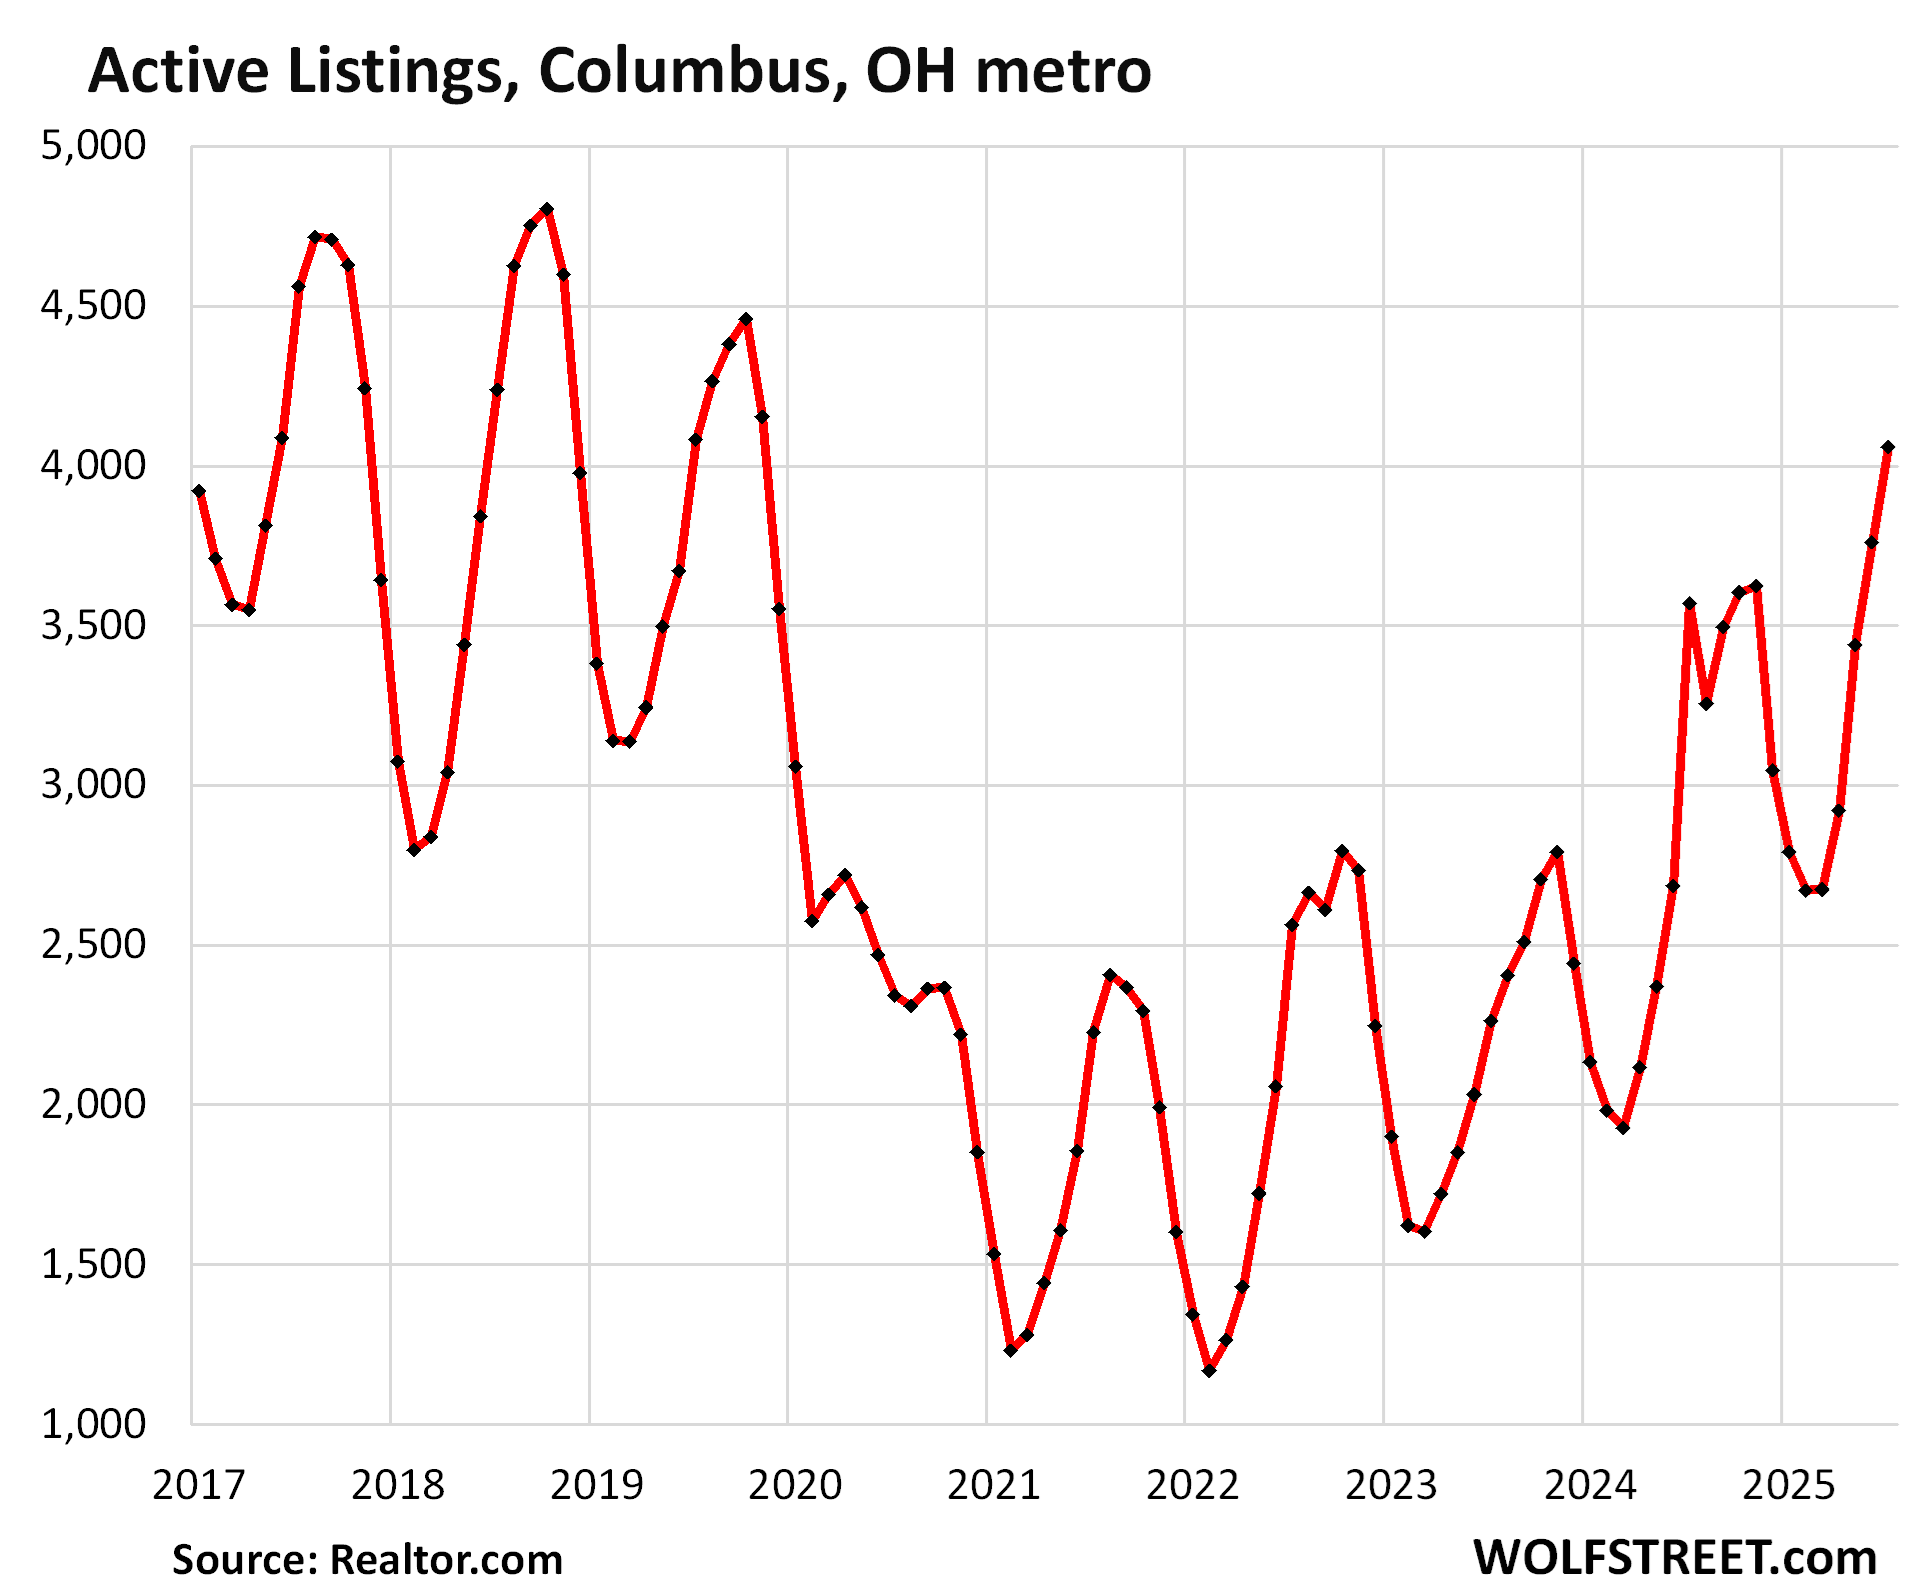
And inventory in the Columbus, OH, metro:
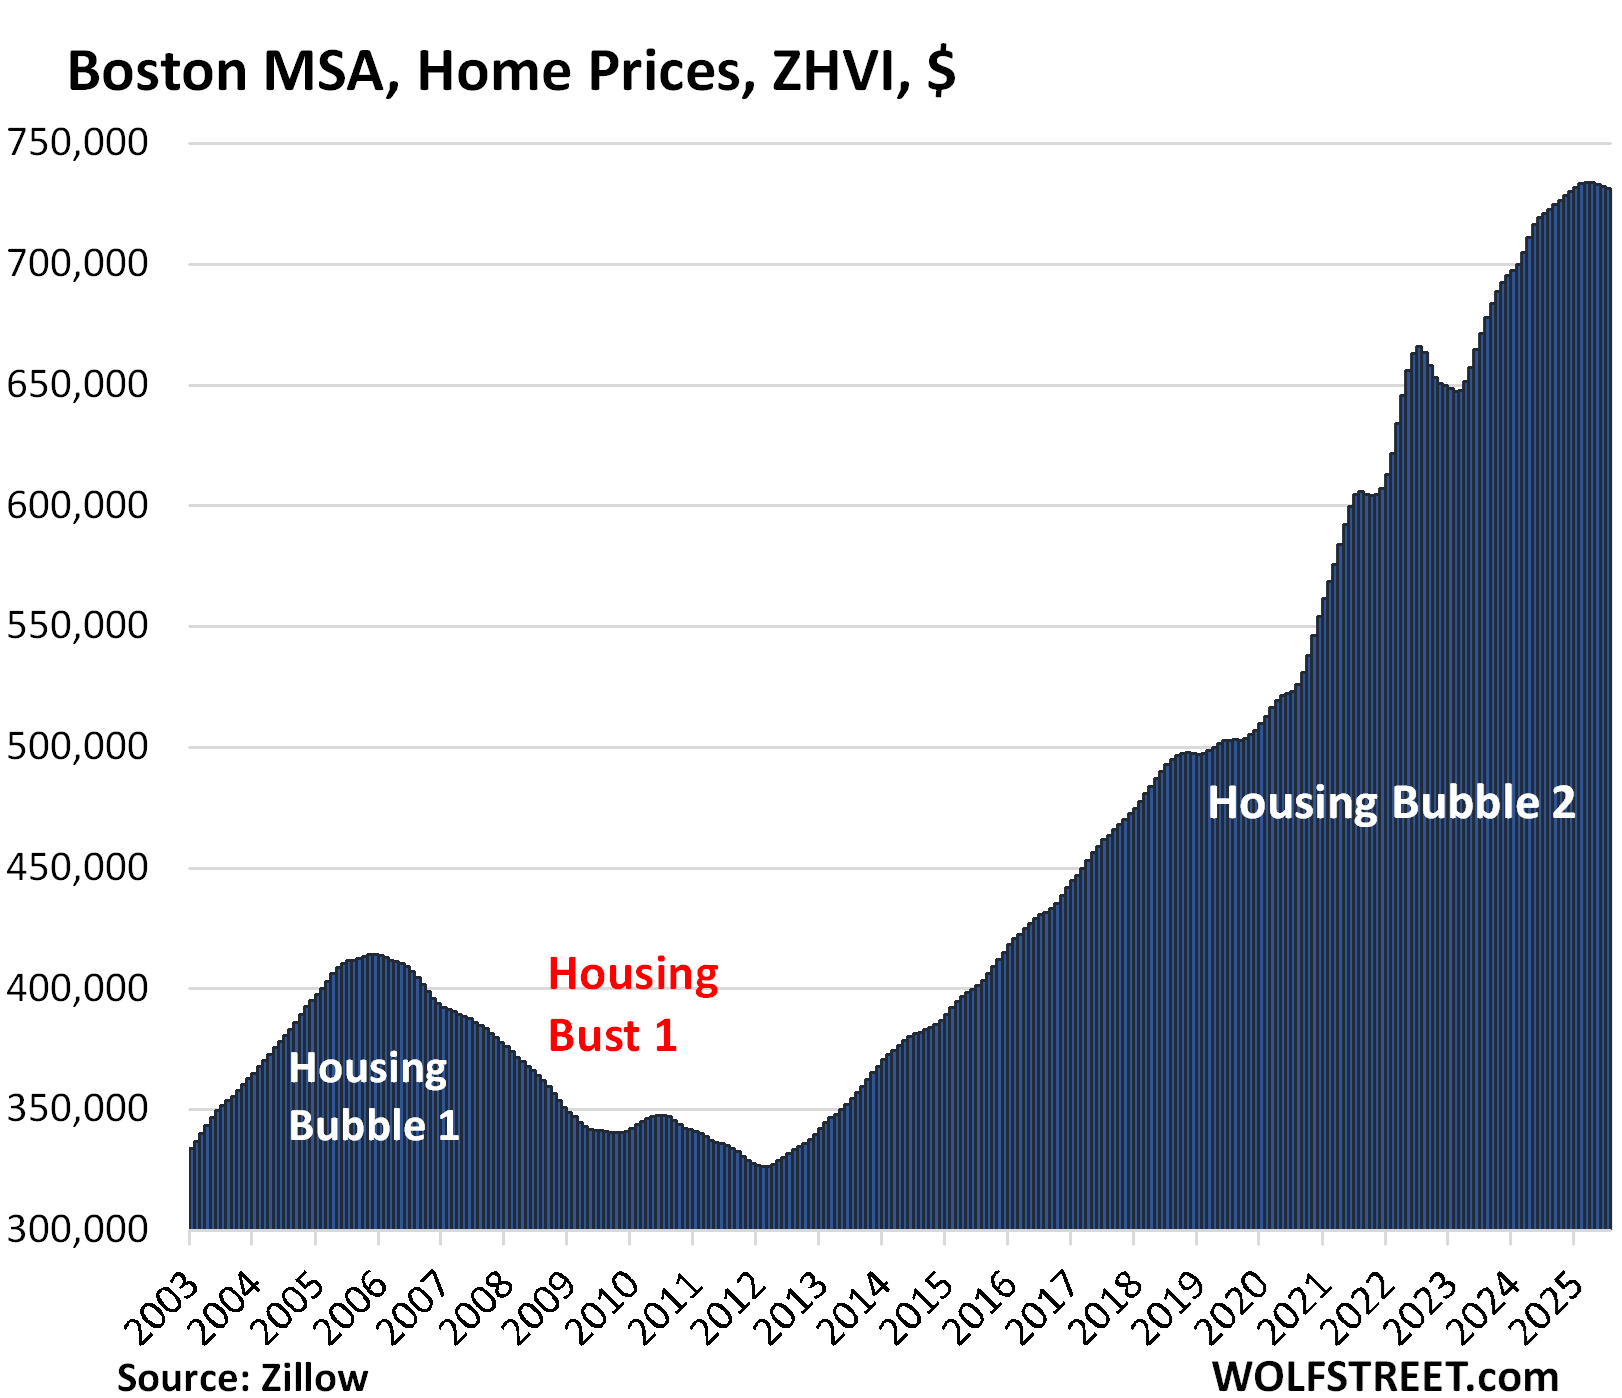
| Boston MSA, Home Prices | |||
| MoM | YoY | Since 2000 | Jan 2020 – Jun 2022 |
| -0.1% | 1.5% | 225% | 30% |
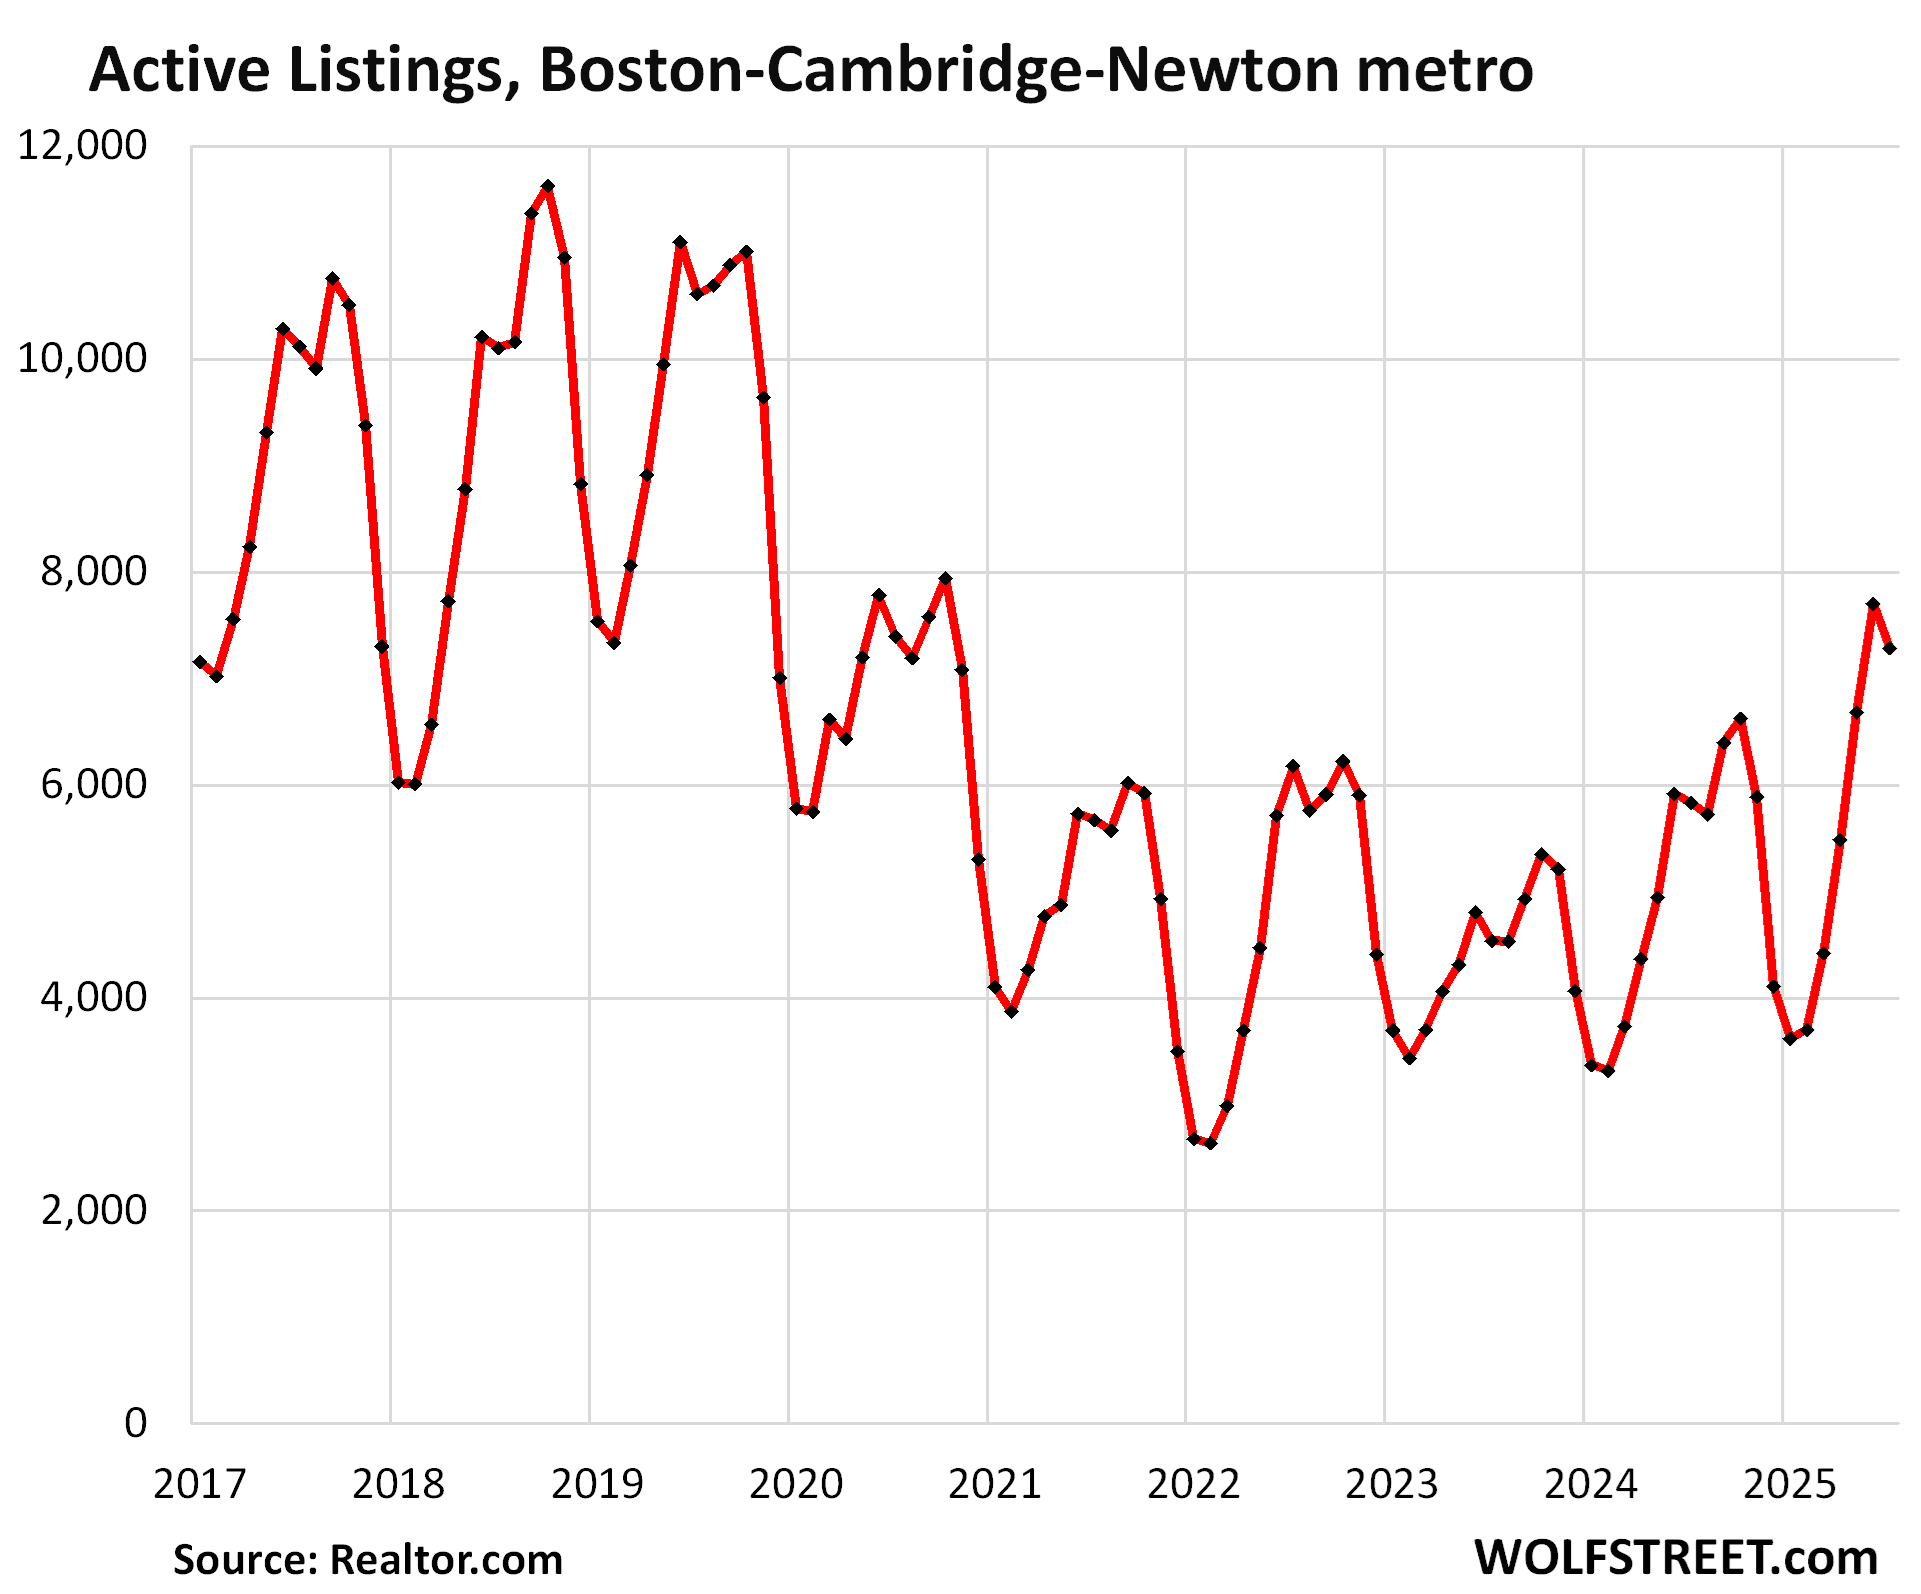
Inventory in the Boston-Cambridge-Newton MSA:
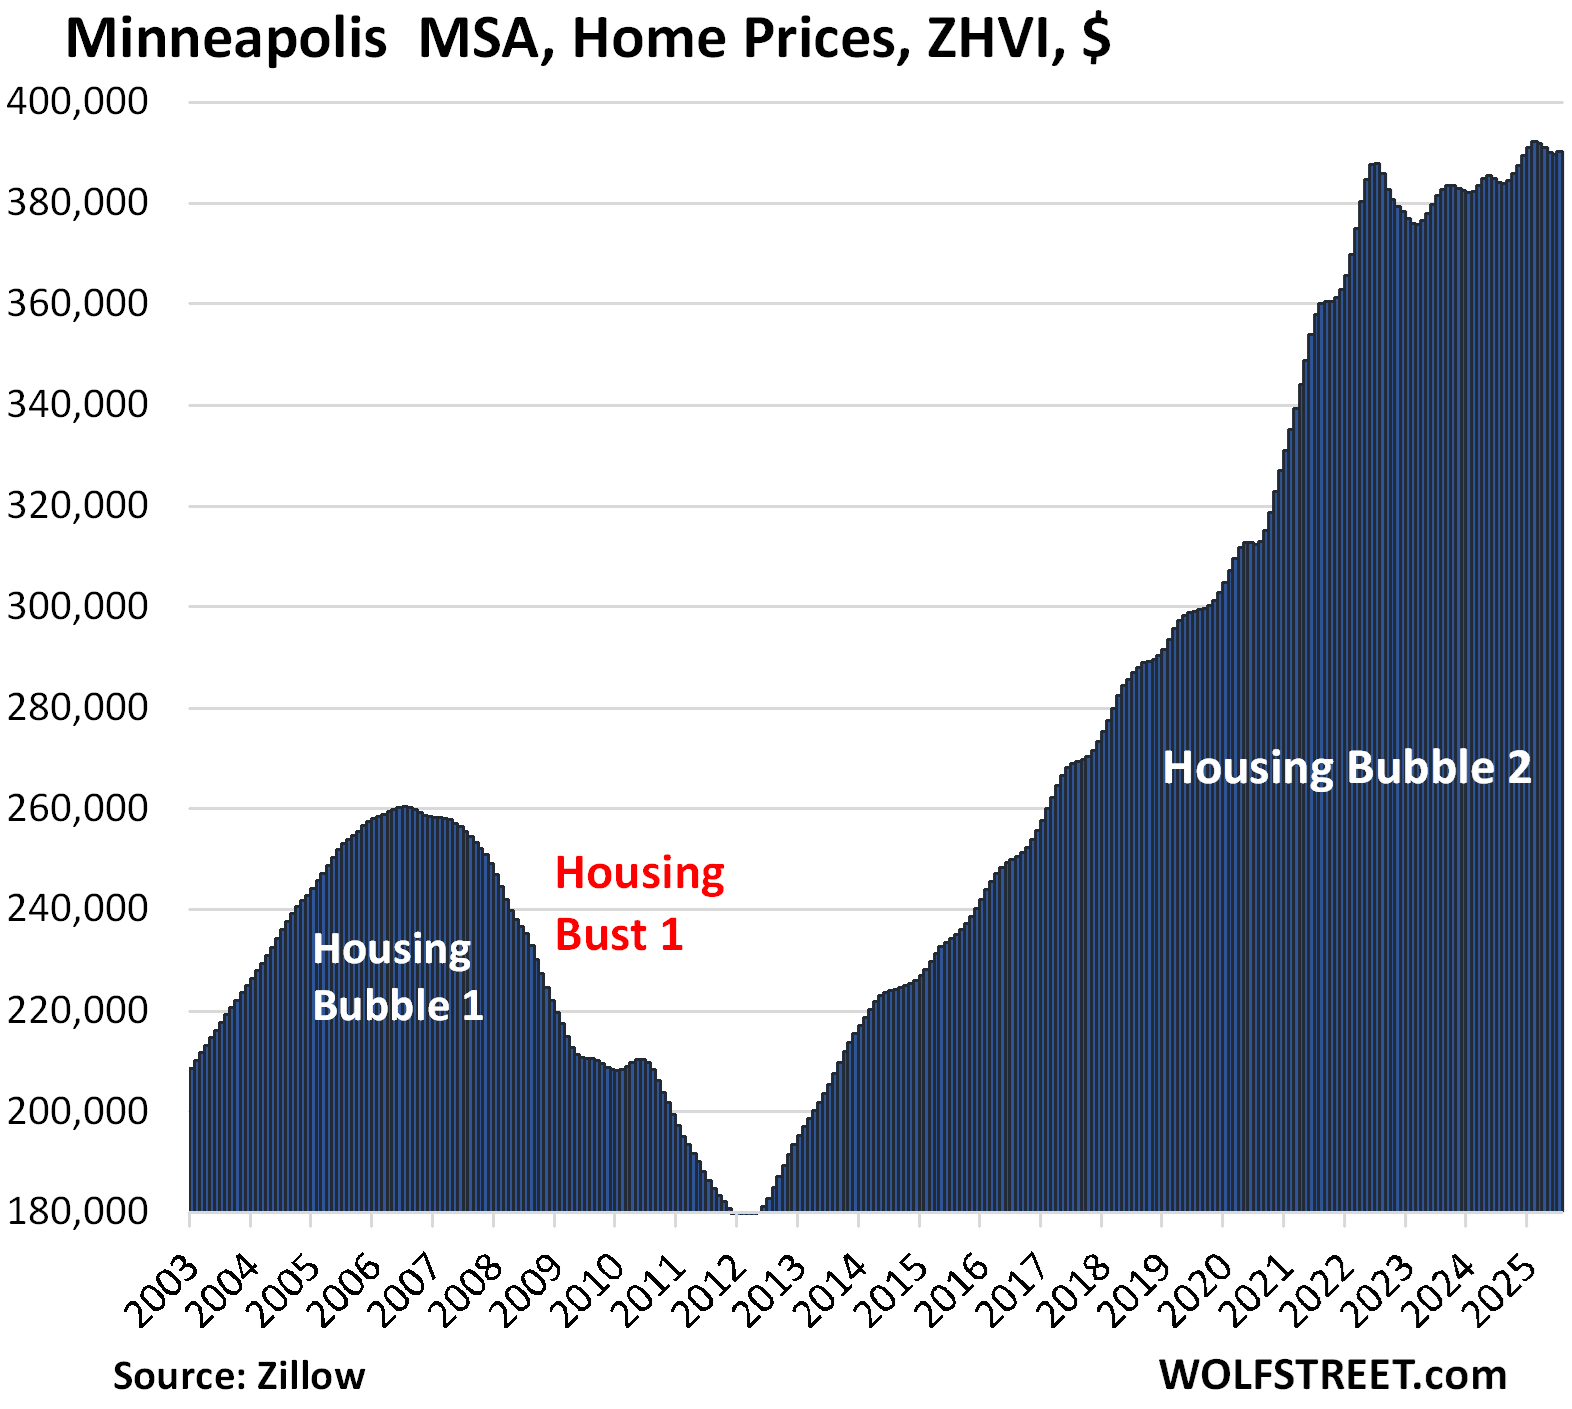
| Minneapolis MSA, Home Prices | |||
| MoM | YoY | Since 2000 | Jan 2020 – Jun 2022 |
| 0.1% | 1.6% | 159% | 27% |
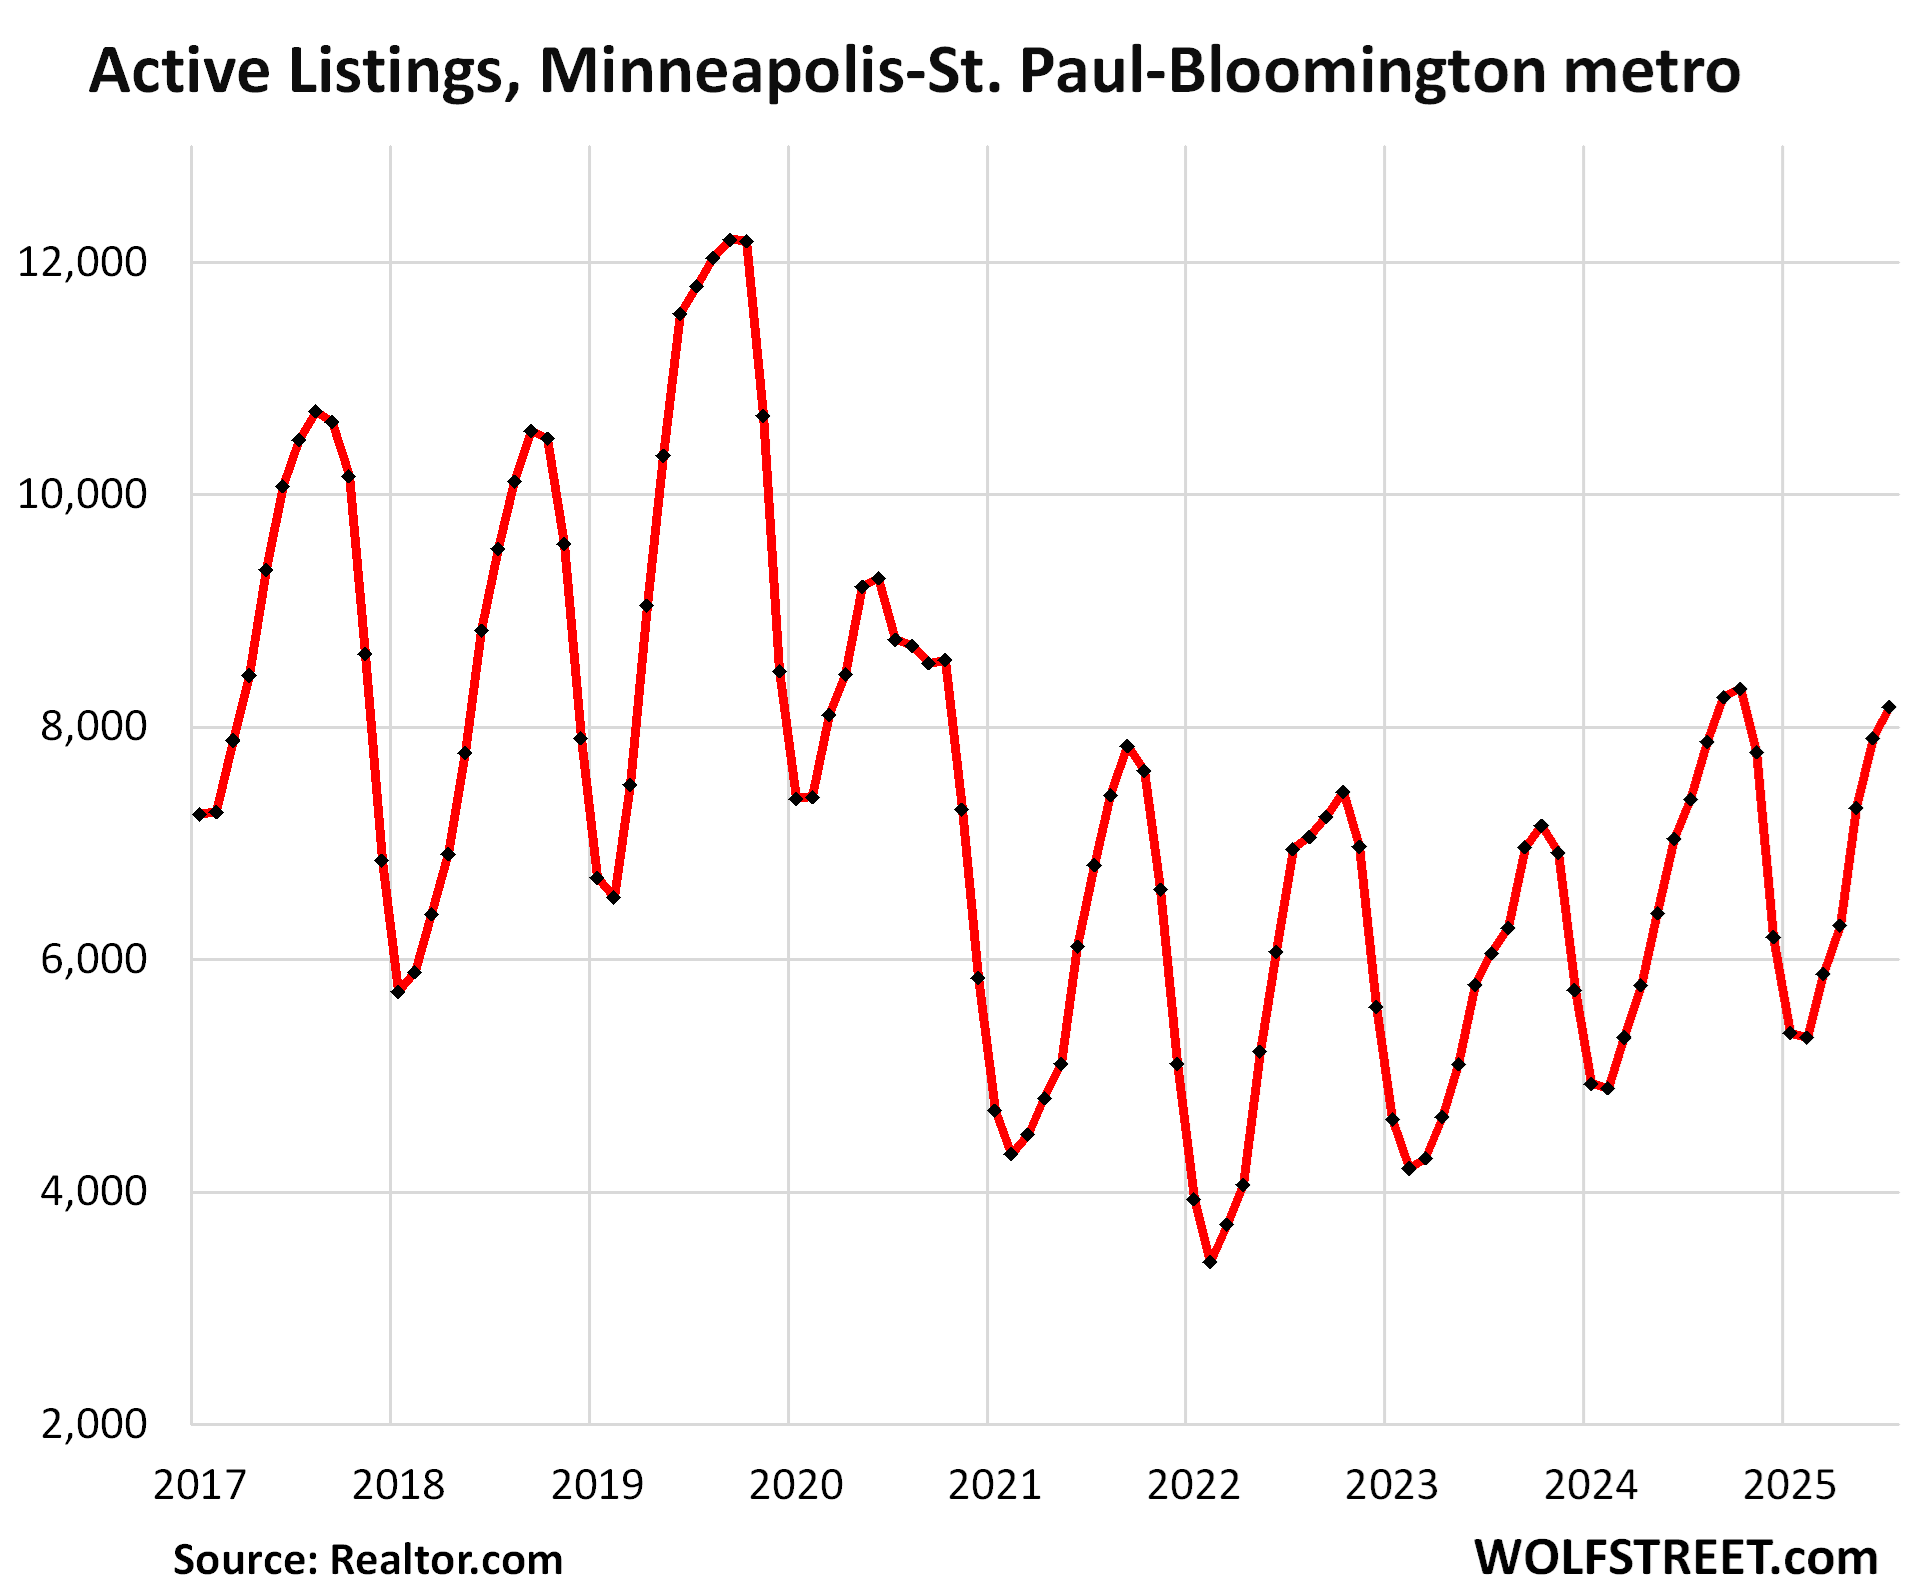
Inventory in the Minneapolis-St. Paul-Bloomington metro:
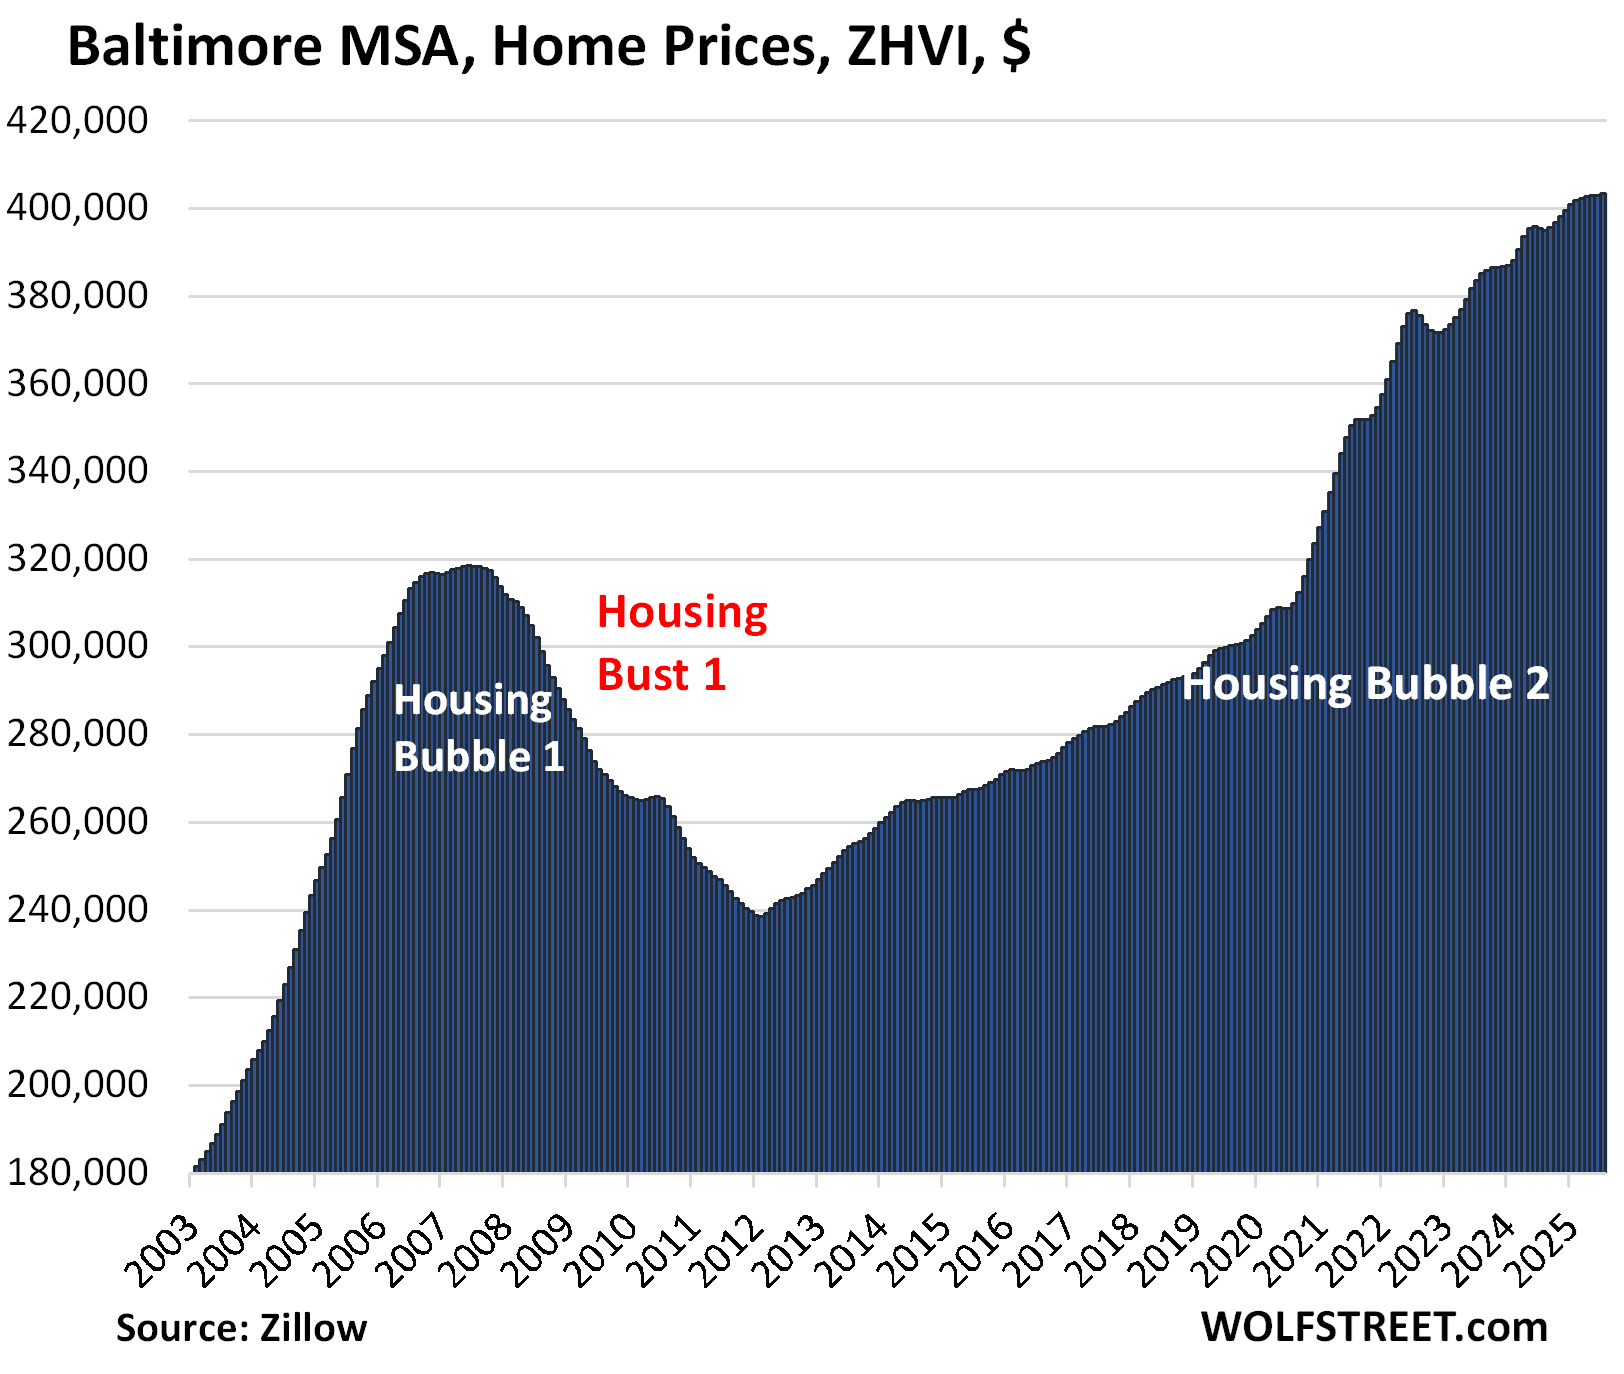
| Baltimore MSA, Home Prices | |||
| MoM | YoY | Since 2000 | Jan 2020 – Jun 2022 |
| 0.1% | 2.0% | 177% | 24% |
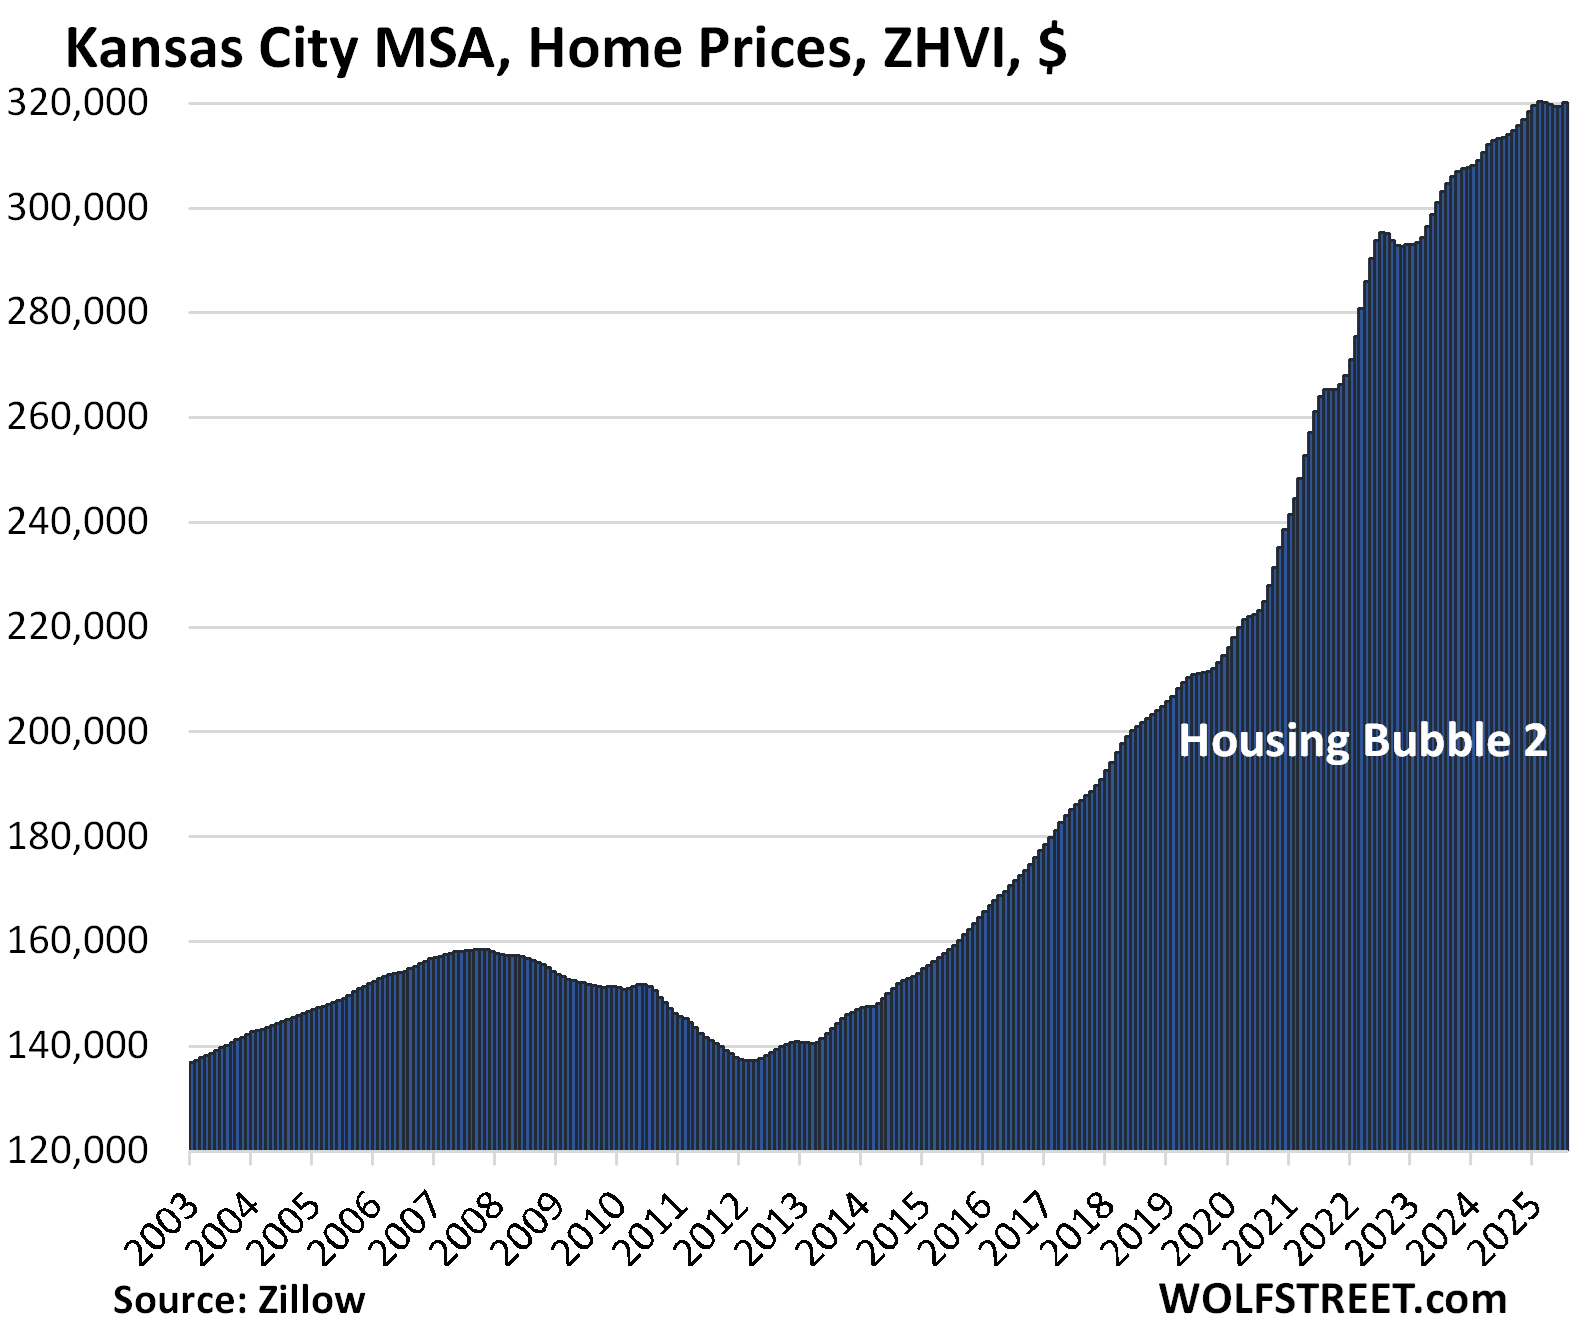
| Kansas City MSA, Home Prices | |||
| MoM | YoY | Since 2000 | Jan 2020 – Jun 2022 |
| 0.2% | 2.1% | 177% | 48% |
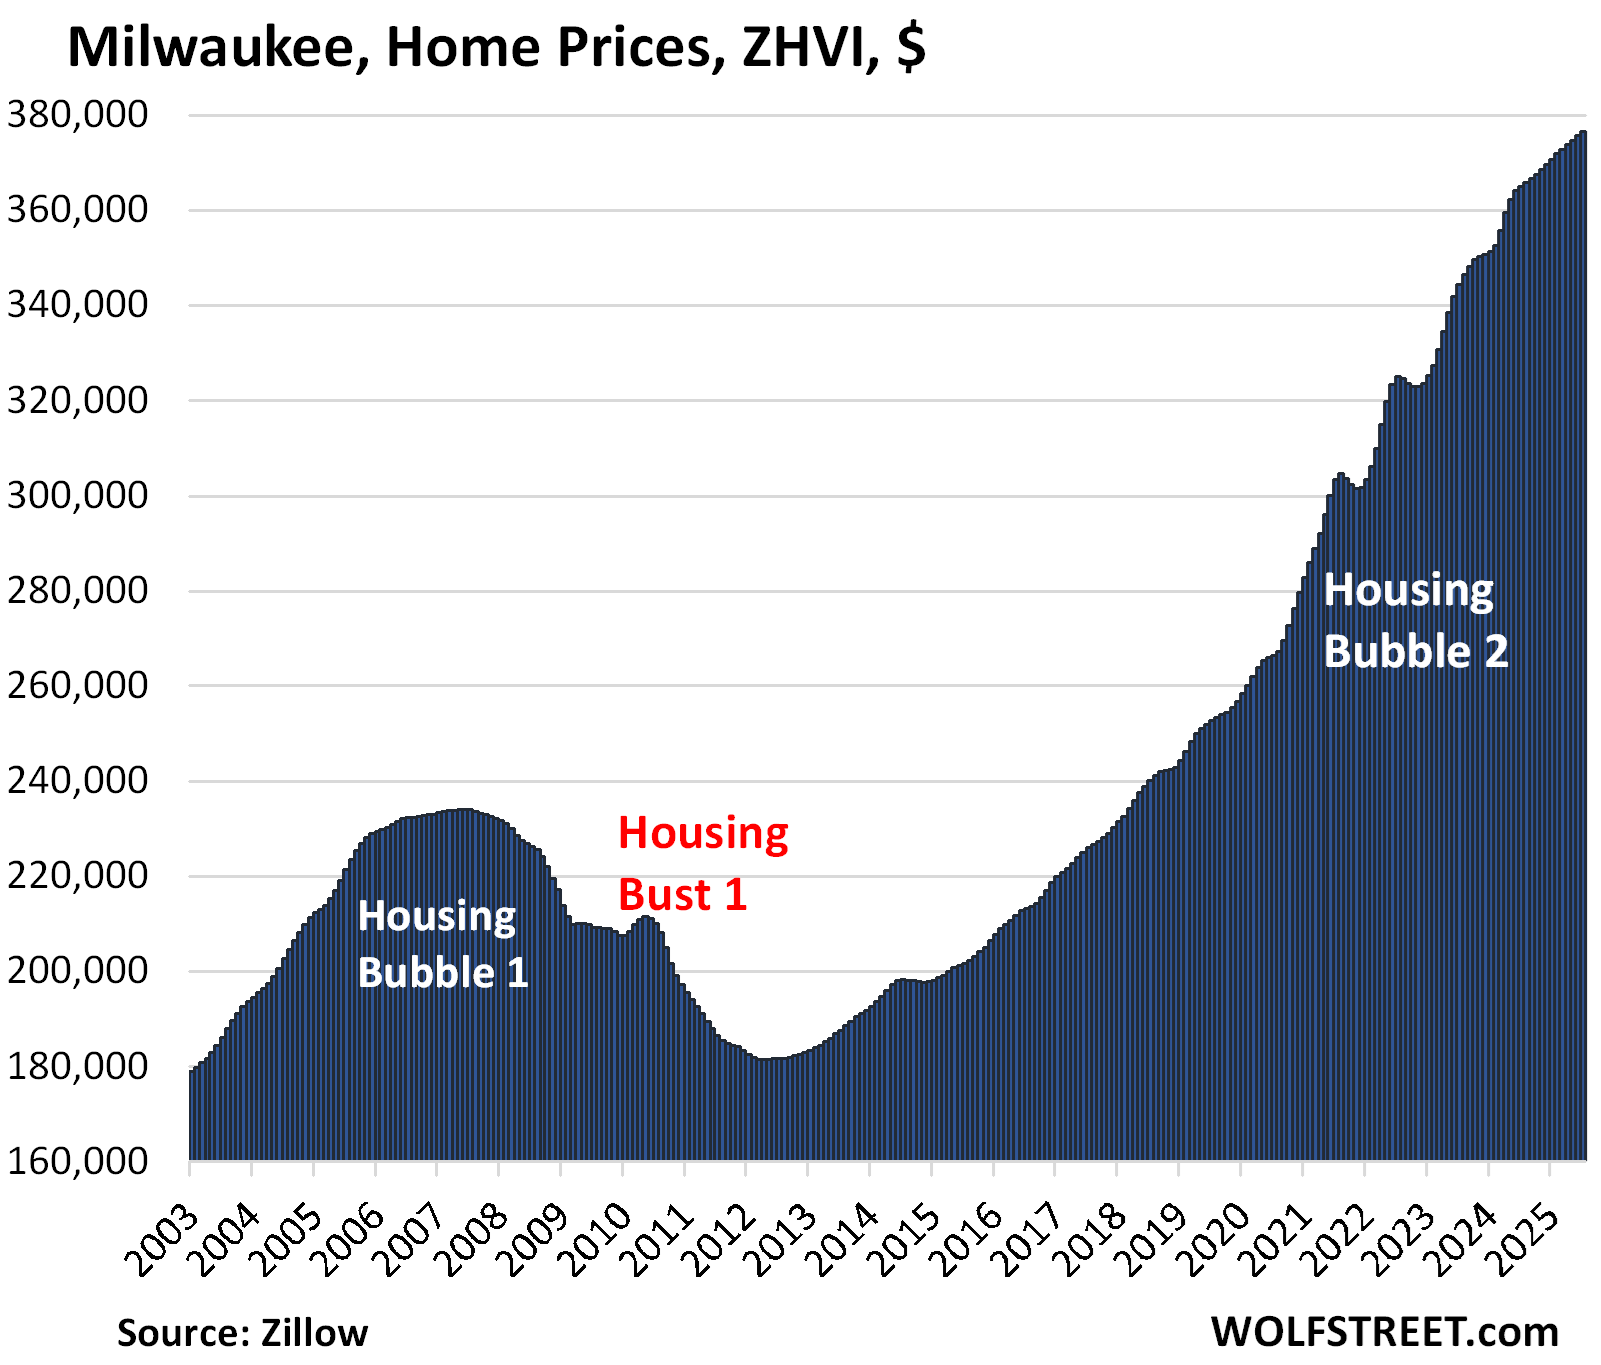
| Milwaukee MSA, Home Prices | |||
| MoM | YoY | Since 2000 | Jan 2020 – Jun 2022 |
| 0.2% | 3.2% | 150.1% | 25% |
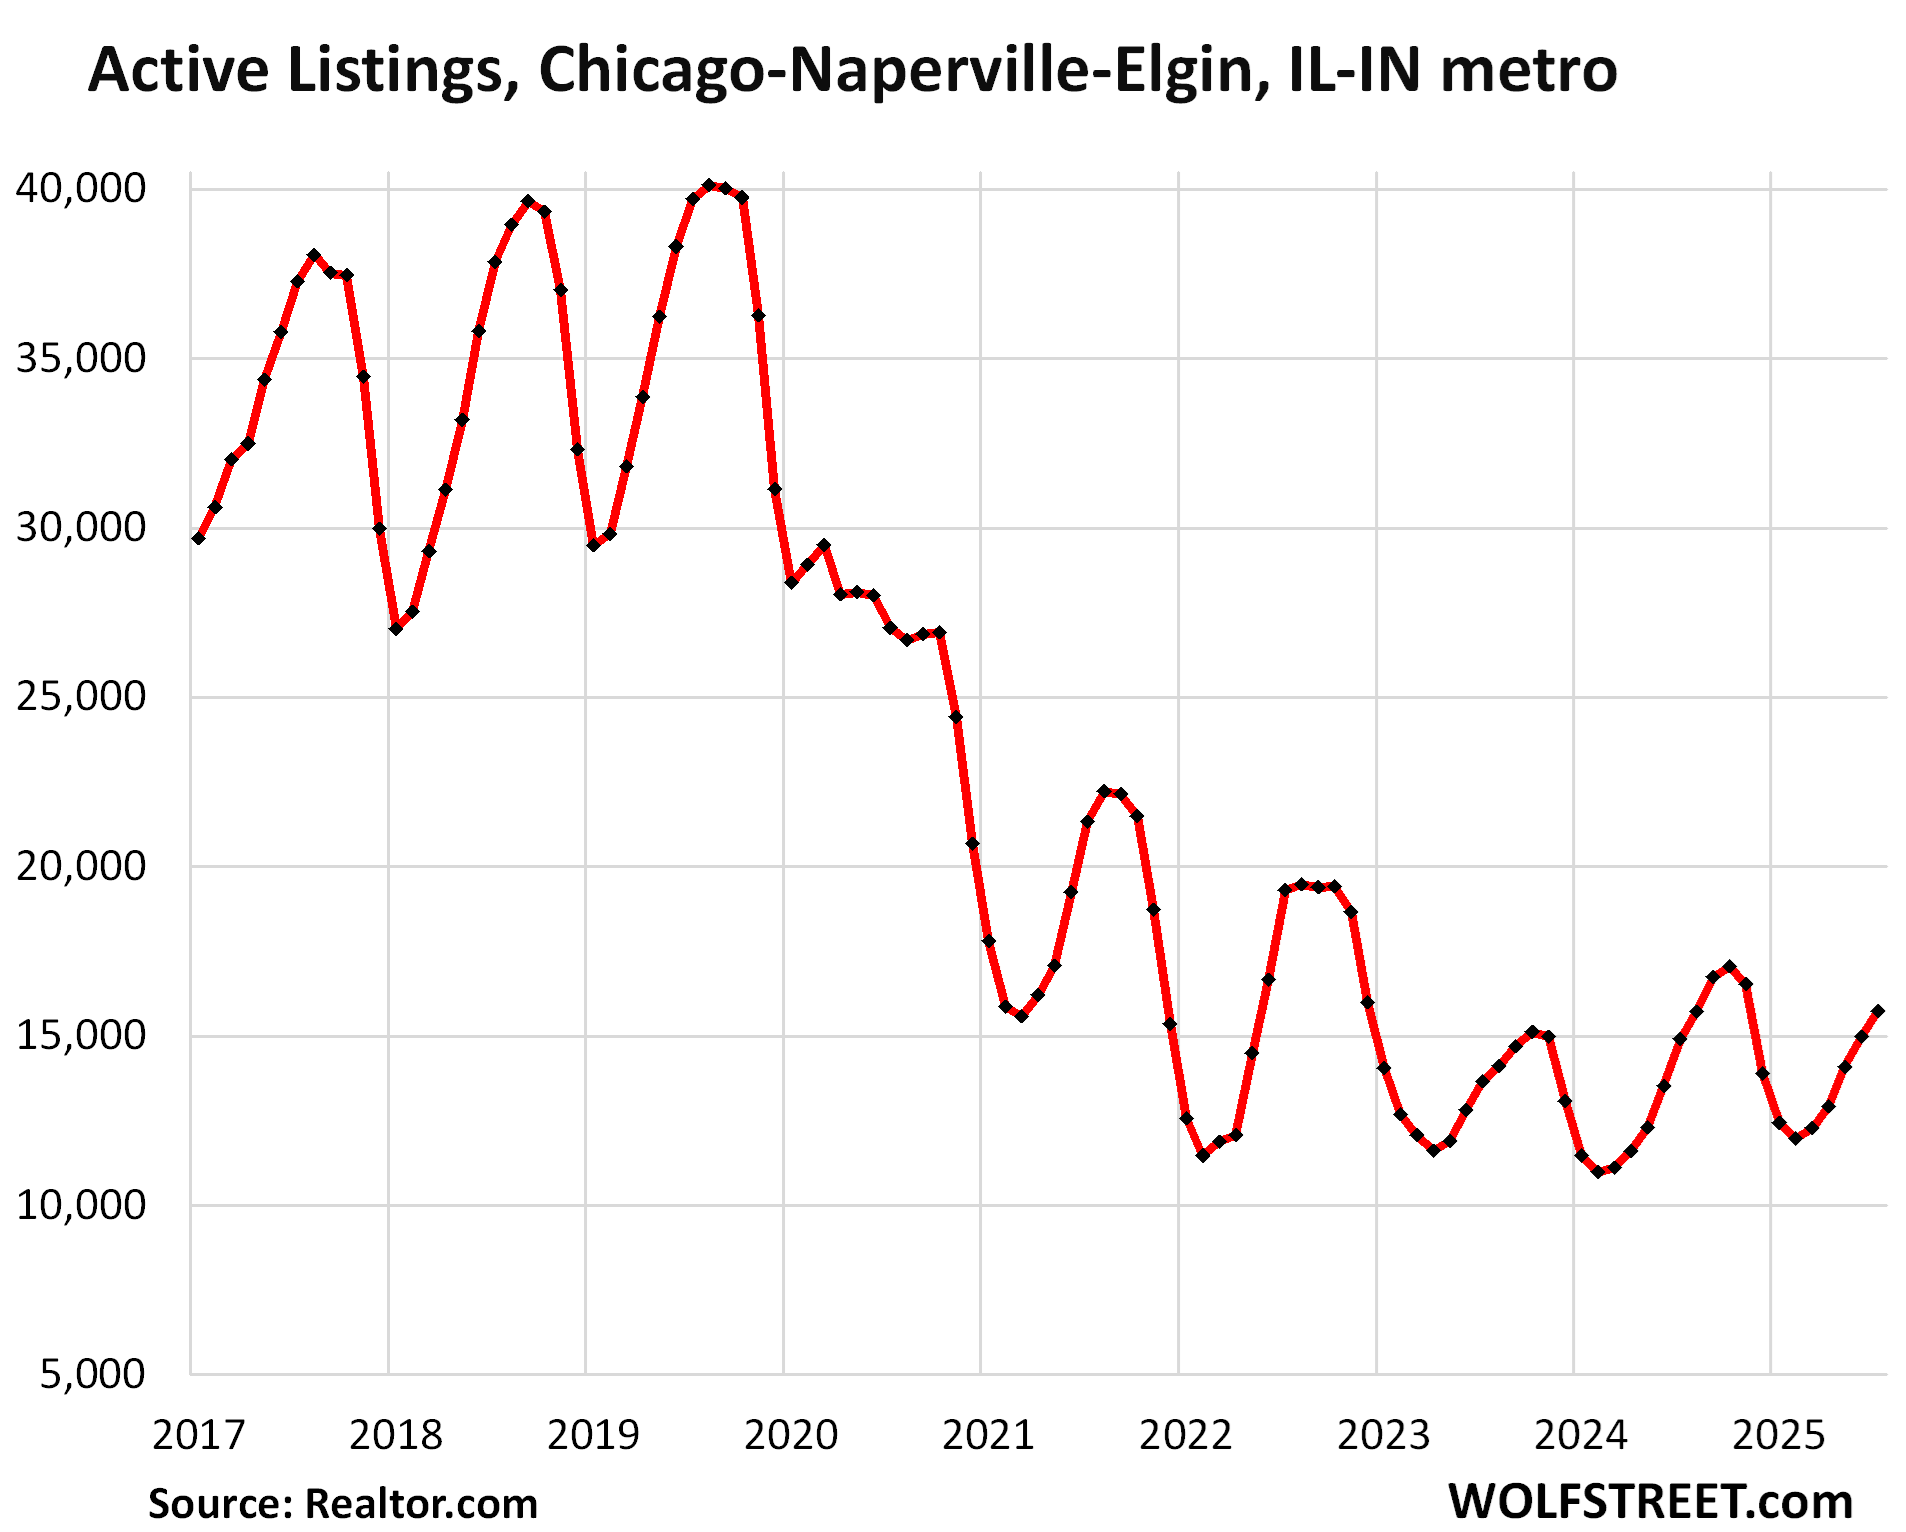
| Chicago MSA, Home Prices | |||
| MoM | YoY | Since 2000 | Jan 2020 – Jun 2022 |
| 0.3% | 3.4% | 117% | 25% |
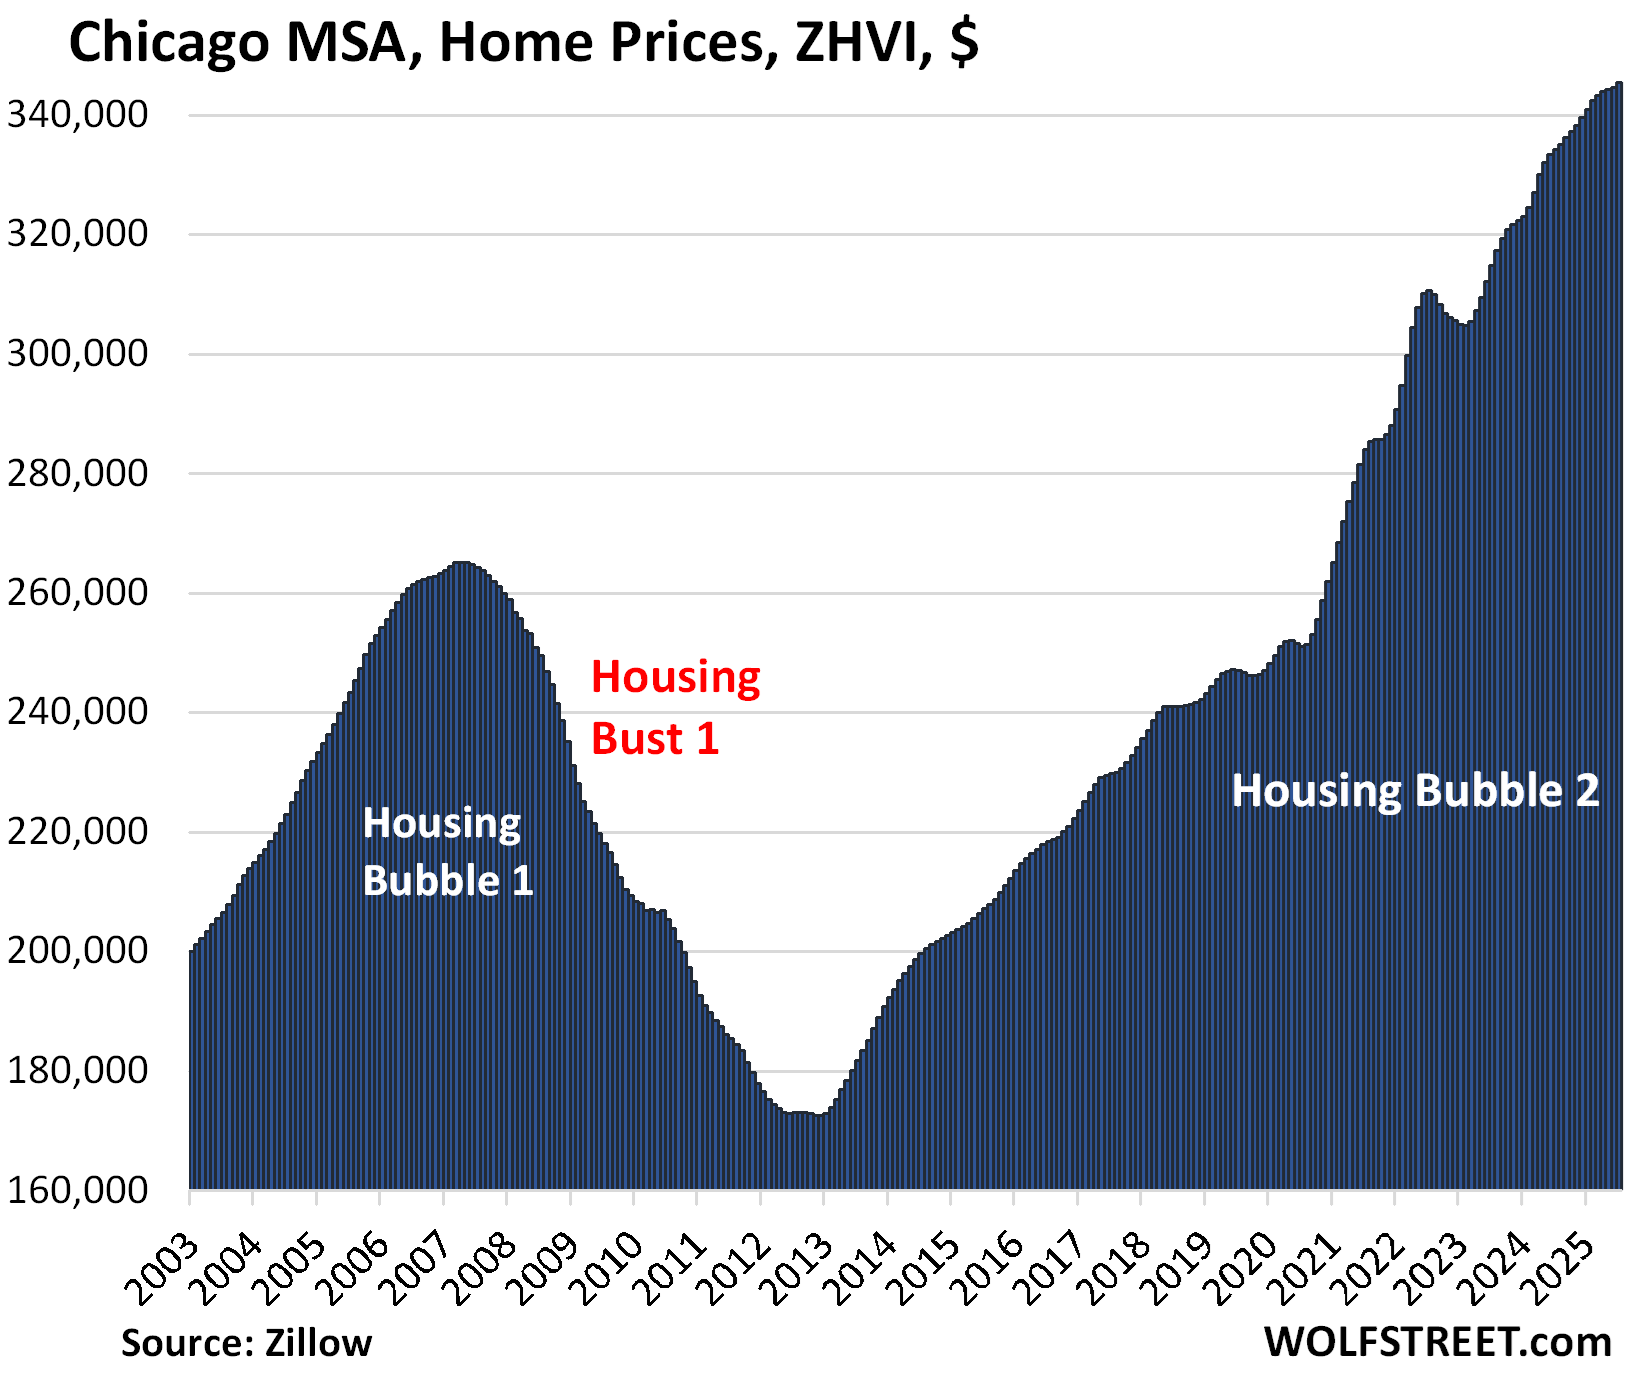
And here is the inventory in the Chicago-Naperville-Elgin MSA:
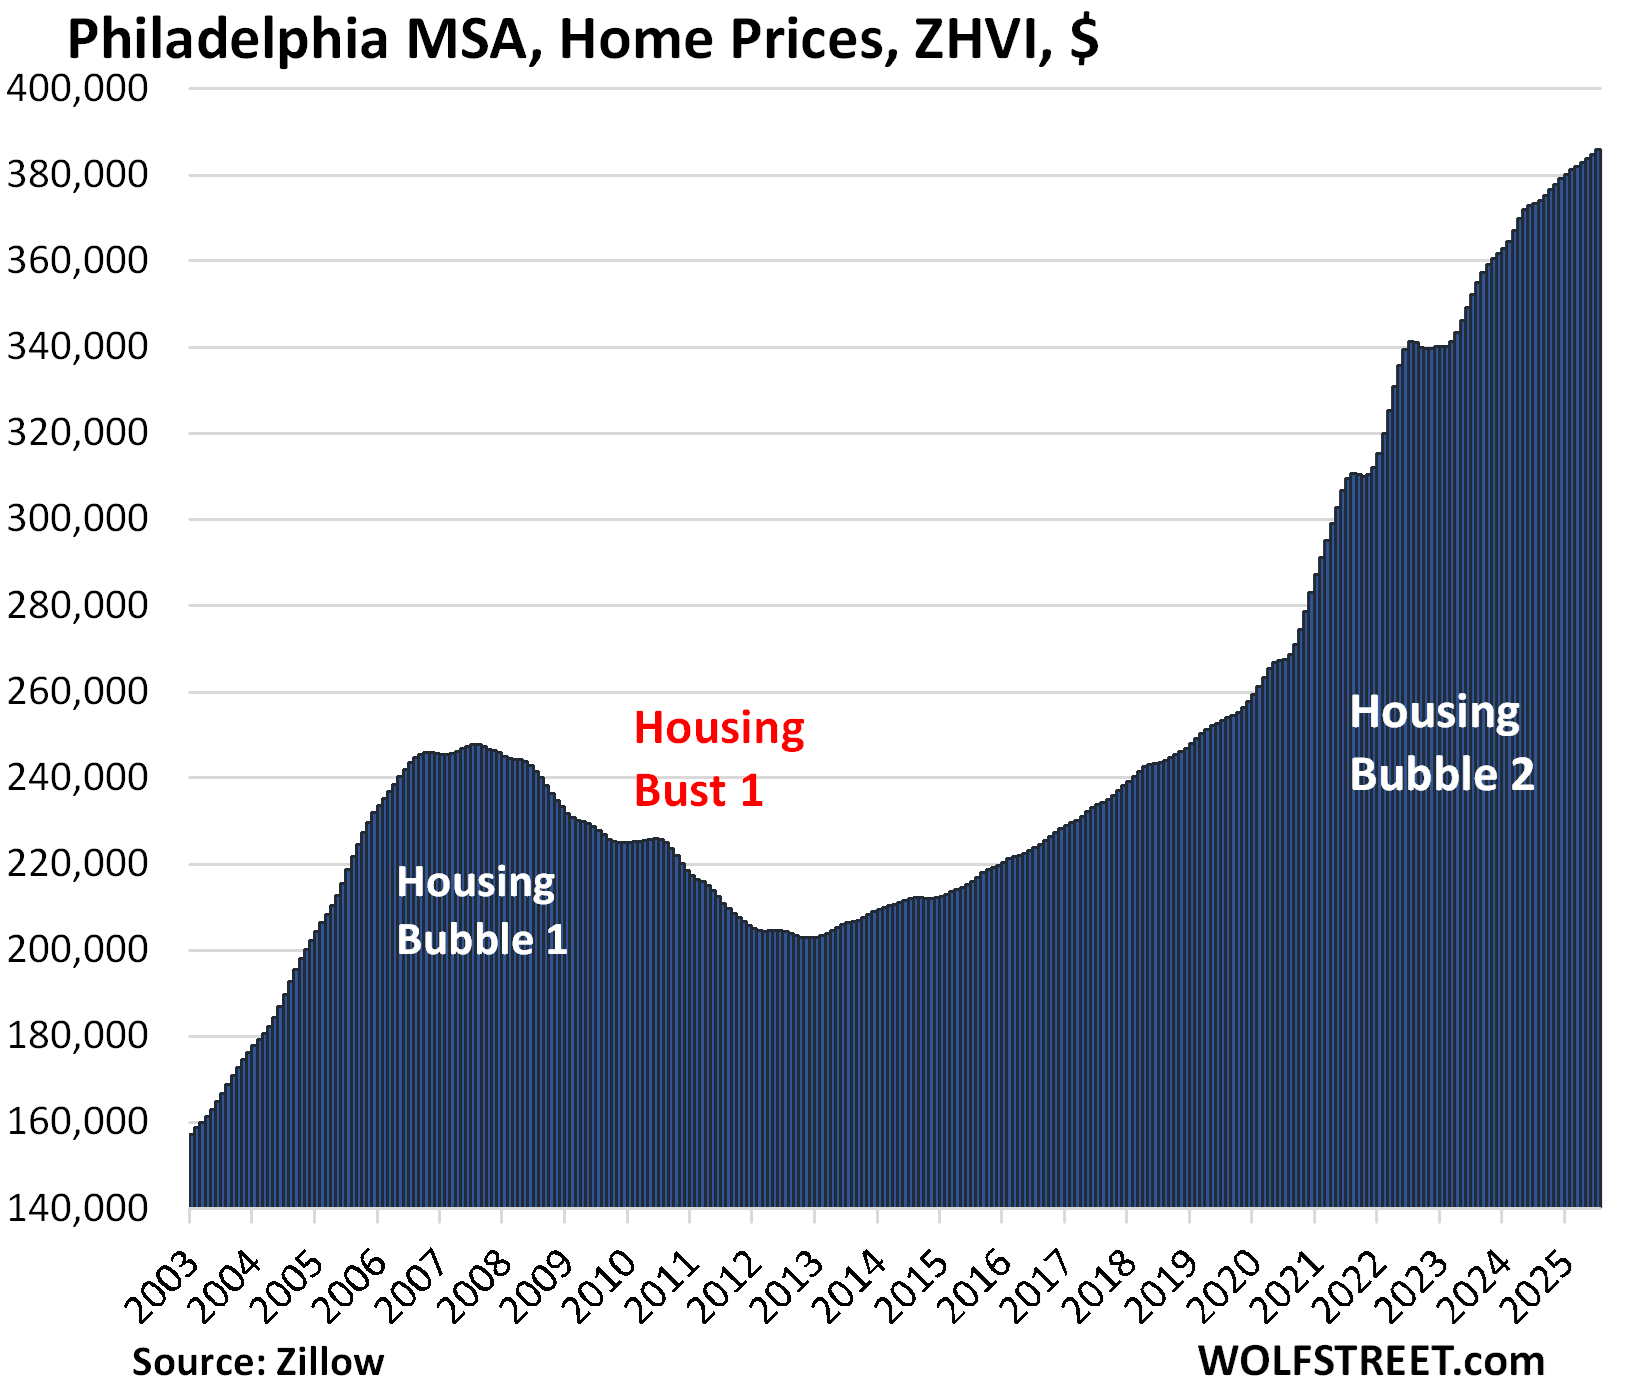
| Philadelphia MSA, Home Prices | |||
| MoM | YoY | Since 2000 | Jan 2020 – Jun 2022 |
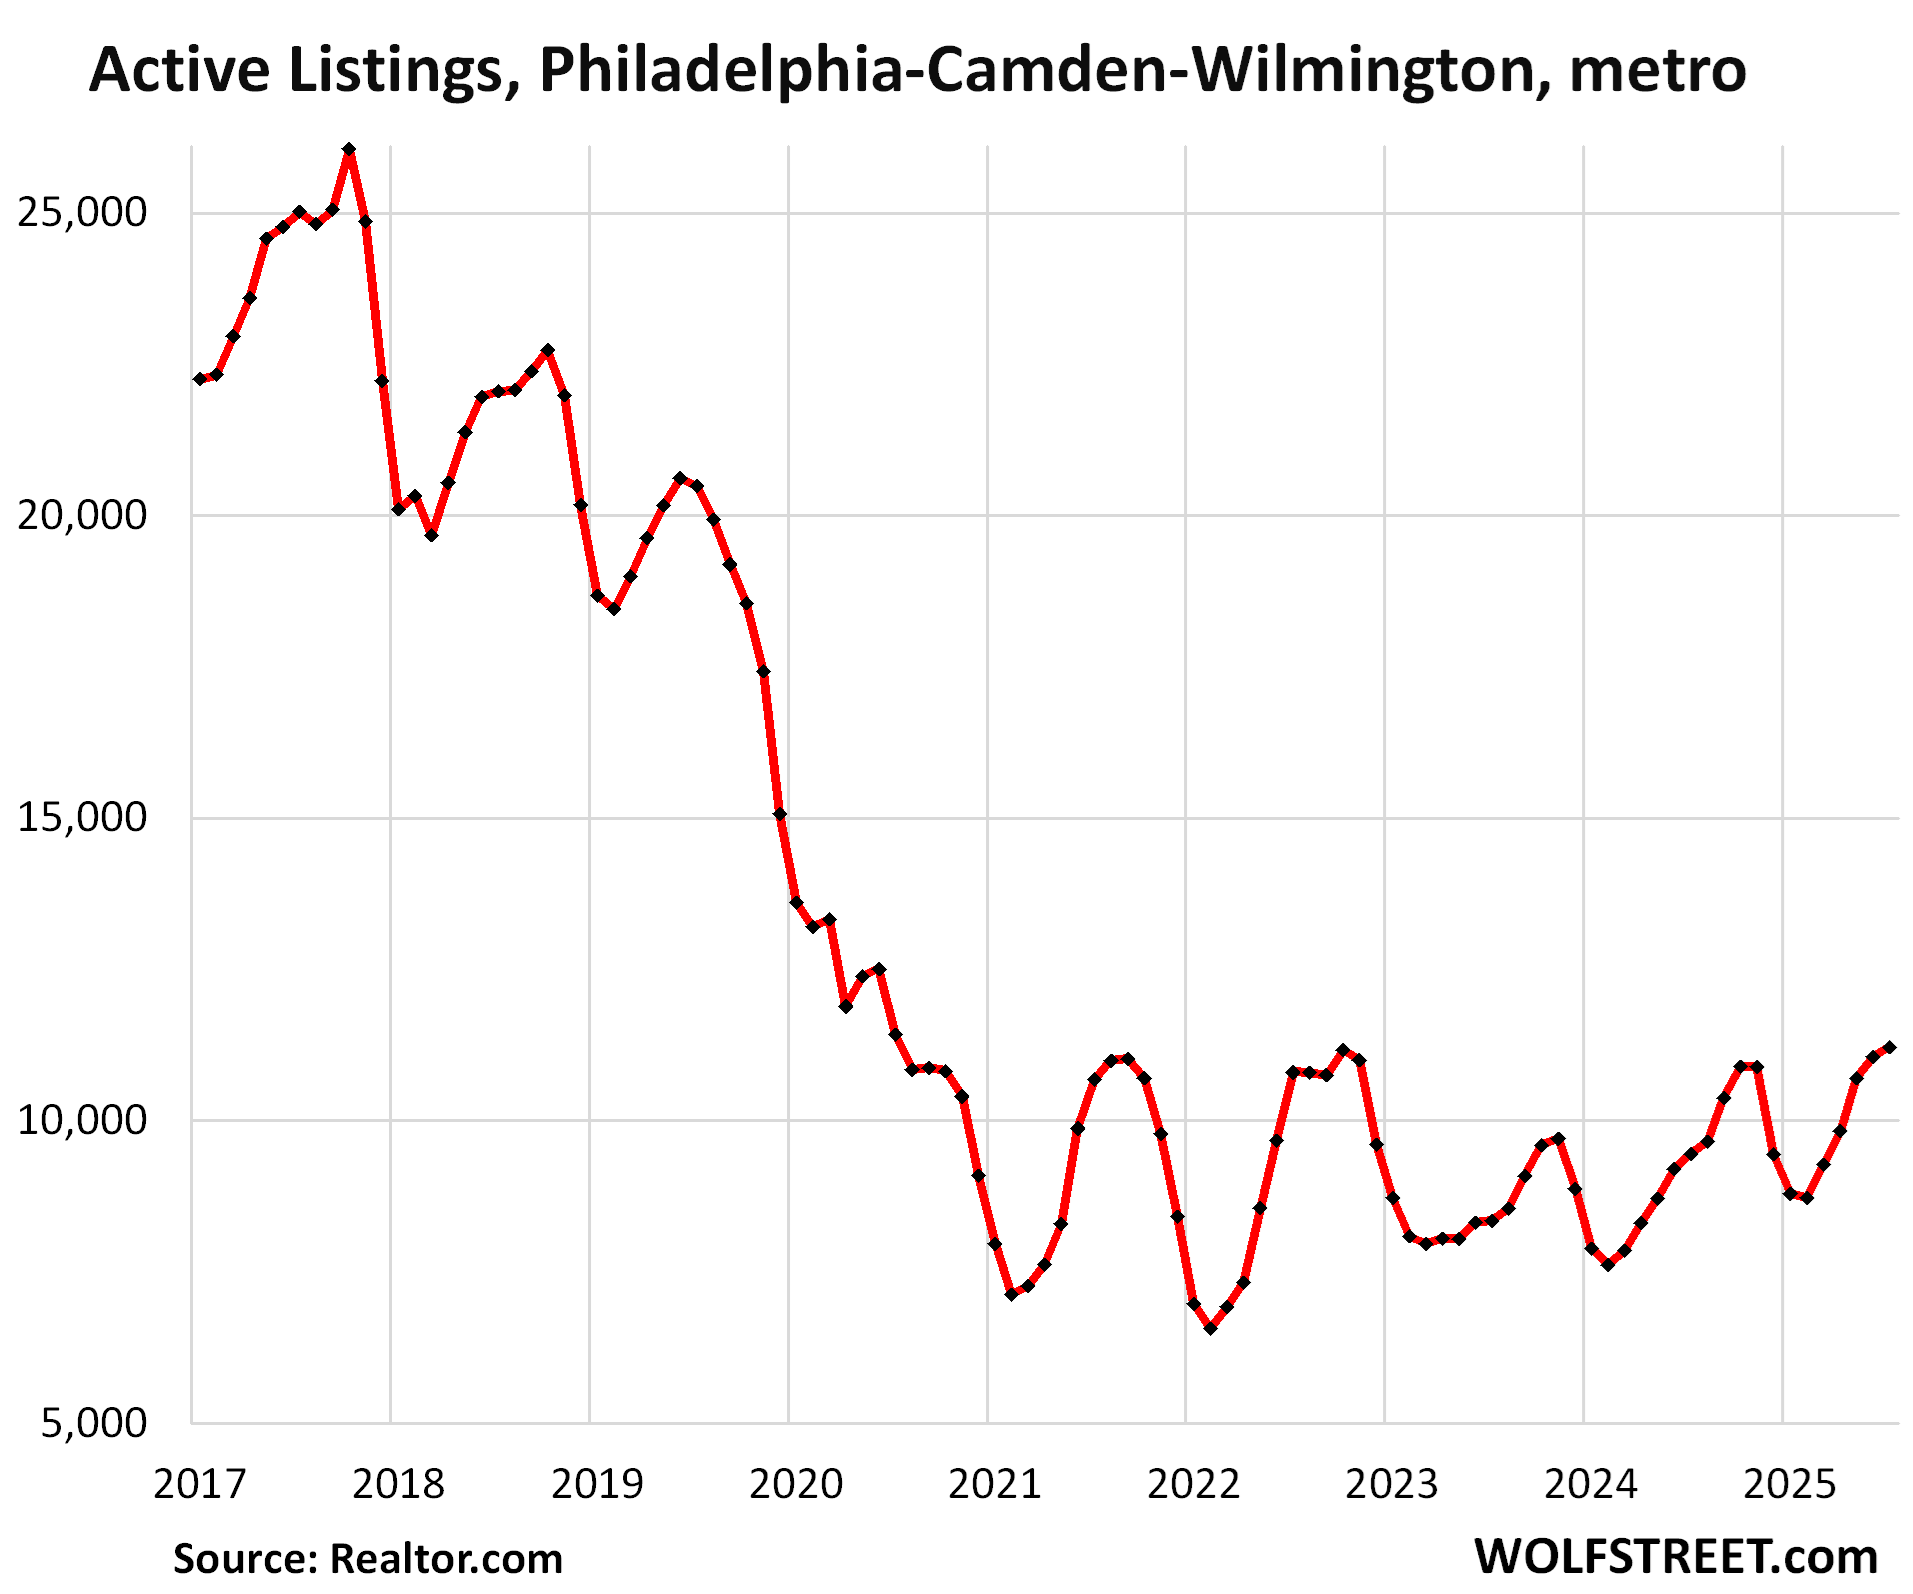
| 0.3% | 3.4% | 207% | 31% |
And inventory in the Philadelphia-Camden-Wilmington metro:
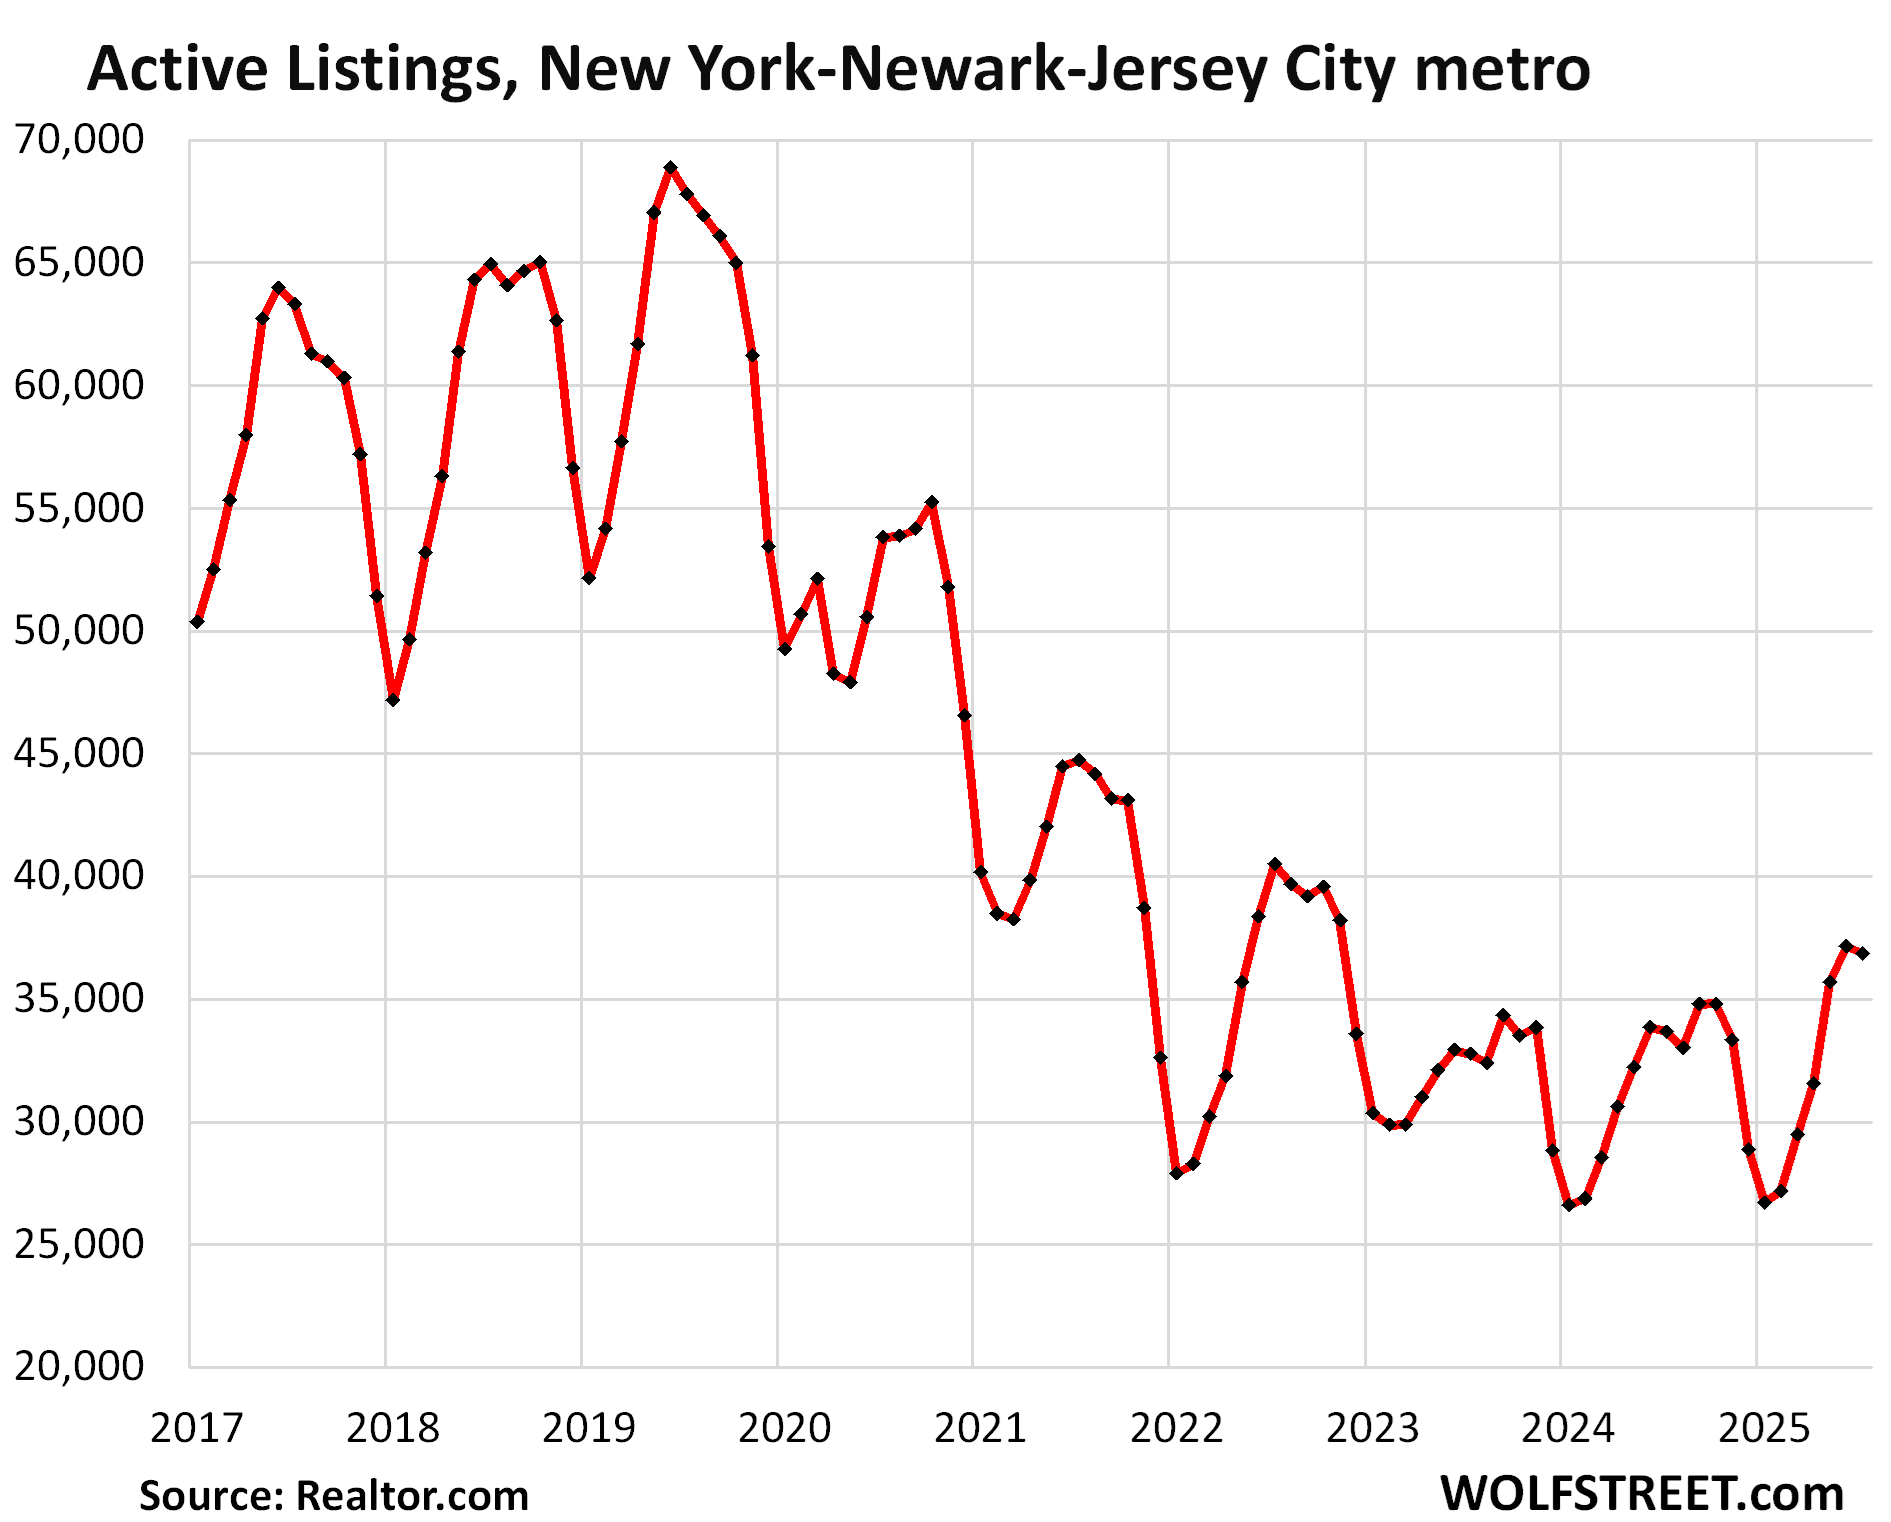
| New York MSA, Home Prices | |||
| MoM | YoY | Since 2000 | Jan 2020 – Jun 2022 |
| 0.2% | 4.0% | 219% | 22% |
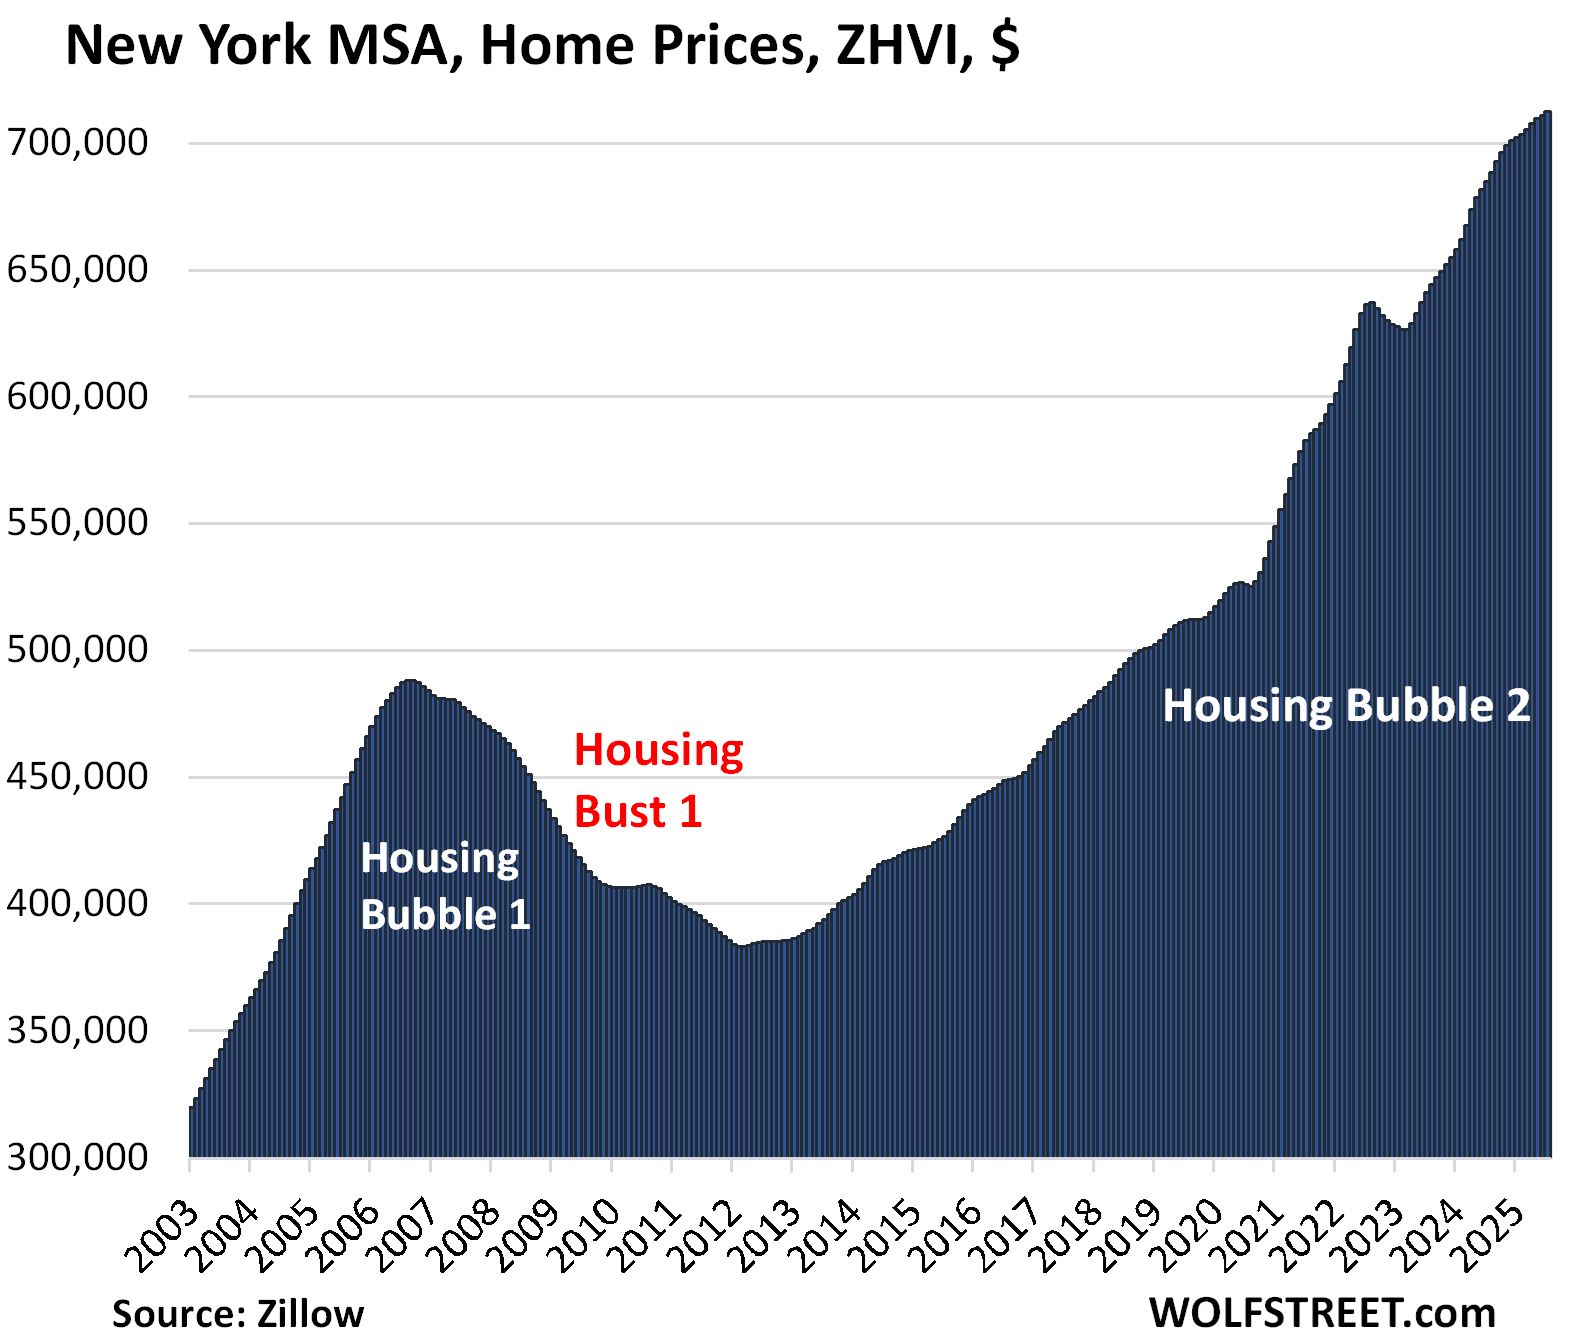
And inventory in the New York-Newark-Jersey City metro:
Enjoy reading WOLF STREET and want to support it? You can donate. I appreciate it immensely. Click on the mug to find out how:

![]()
I am still on strike though as said before need to really long term visit West Virginia,can get a lot of land and a home in the 300 range with at moment property taxes 3 figure,not 4 or 5.
I know economy is tight there but mostly retired so really does not matter unless it goes full mad max ect.
I had a friend there who moved only due to huge salary/job position he could not pass up.
Like me he is a avid hunter/angler/ and just general outdoor nut and says I would love area for those reasons,long road trip in order soon.
Plenty of cheap taxes in northern New England if you know how to game the system. Buy a run down something in the woods, set back from the road. Make sure there’s good canopy cover. Improve it if you like, just don’t let the tax authorities in. Or pull permits. Very rural towns are not aggressive in reconnaissance – if you keep the footprint small you may get by with a minimal bill.
Dave,really wanted to stay in N.H. but with the prices/taxes and me desire to put up a fairly large workshop just does not make financial sense,been on the hunt for a few years.
I suppose if some pricing sanity comes back would do it but am getting older and want to get this place up and running.
I also plan on besides small scale farming having a foster/adoption place for our four footed friends so will to a degree be in public eye.
@Wolf, when you say “second-smallest since the Housing Bust” do you mean “second-smallest since mid 2012” (when HB2 started)?
The Housing Bust ended in 2012 for the US overall (in some markets sooner). In my book, Housing Bubble 2 didn’t start until a few years later. My series started in about 2017. So that’s kind of the beginning marker here for HB2. But that’s just how I see it.
Just an anecdotal observation: My real estate agent contacted me again recently, first time in many years, – “good time to buy, sell or invest, mortgage rates are coming down”. Asking prices are still sky high, though.
My my freight broker contacted me too, and freight rates have been coming down pretty substantially lately. It looks like business has been slowing down in both sectors, but while businesses had to react fast to changing market conditions, real estate owners can’t or don’t want to face reality.
Please tell your RE agent to stop being lazy and come up with more creative pitch than rates are coming down to FOMO people into buying or is his plan to just say that and just like inflation is transition, give it enough time I guess eventually we will get there?
My only broker is the apps that tell me to repurchase something I bought.
Humans contacting you? Sounds horrible. 😆
“real estate owners can’t or don’t want to face reality.”
Yep – look at those Chicago, Phil, and NYC for sale inventory figures.
Comparatively speaking, those ain’t growing/thriving economies/employment centers – but they *are* filled with olds.
Yet somehow, SFH owners are *still* refusing to market their snow-bound homes – far, far below their own levels of 2019 and comparable to the pandemic years.
Weird, weird.
(Chicago is particularly interesting since somehow IL is losing population while its overwhelming population center – Chicago – ain’t remotely putting homes up for sale. How does that work? Rest of IL utterly vanishing while Chicago homeowners stand pandemic level pat? Weird, weird.)
If these numbers only include existing home prices and not new construction, there is even more pricing pressure in markets like Florida and Texas which have seen the majority of new home construction developments by the national home builders in the recent past.
However in any market there is still a lot of location, location, location that impacts individual home prices
Crying won’t help you, praying won’t do you no good
No, crying won’t help you, praying won’t do you no good
When the levee breaks, mama, you got to move, ooh…
As the housing market bubble loses air doesn’t that affect the American “drunken sailor’s” perception of wealth and therefore affect consumer spending which will eventually lead to a fall in stock prices?
No. Housing prices have little to nothing to do with stock prices.
I think any amount of money you lose whether it is in stocks or housing has a real negative effect on you.
Now some of us who see house values as “funny money”, well maybe us less so. In a sense it’s all “funny money” until you buy something you need with it later on.
Also, if the US housing market was say worth 20 trillion and overnight goes to 10 trillion. Then someone somewhere is going to lose their S…
So to say stocks won’t be affected, ummm yeah prob will be either some to a lot.
Another 50% or so and it might start to look reasonable!
ATX Commenter:
Austin Business Journal had an article headline from two days ago: 250,000 HOME SITES ARE JUST SITTING THERE.
Not 25K but 250,000K! ATX prices will continue to slide like a pat of butter in a hot cast iron skillet.
Ever heard of the Green belt from the UK?
So back in the day the only way to deter farmers to not use scrubland to farm on (that is the worst kind of land) was to make an edict, they cannot use scrubland.
However they could rent from a lord or something the next grade of land above that. Call it crap dirt. Next was some dirt with a bit of top soil, well they had to pay more to rent that. At the top would be land where Royal ponies or something fertilized it.
If the green belt or rule prohibiting the use of scrubland didn’t exist, then the value of all useable land would go down.
It’s kind of interesting to realize these boundaries exist to protect values of assets.
Ferrari’s Daytona SP3 599+1 Just Sold at Monterey Charity Auction for $26 Million
Monterey Car Week gave one lucky buyer outside the original 599 allocation the chance to purchase a one-off, two-tone Tailor Made version of the sought-after sports car.
“lucky buyer” LOL. Lucky seller!!!
“Charity Auction” being the key words.
On the topic of housing: In Minneapolis, a nice starter home can be found for around $300k. We have older homes, typically on 40′ by 120′ lots in the residential parts of the city.
If a prospective house has a good foundation and frame, which most 100 year old homes that have been taken care of do, buying it, and building equity, and having your own place to live makes for a good quality of life, IMO.
For those weighing the rent versus buy options for housing, I’d advise to look into the future on a long term view to help make the decision regarding what to do. Yes, houses are expensive historically speaking, but starting small lessens the risk of paying too much now if the market drops a lot in the next few years. And if the market stays flat, you’re ahead of the game by jumping in now.
Good luck everyone. . .
Why aren’t those 100 year old houses you describe $30,000 or less?
Get what you are saying (and don’t want to be really *too* rude),
but,
It is Minneapolis.
January daily *highs* will be 5 degrees.
The Mary Tyler Moore Show showed her cute little apartment but not the fact that she had lost 3 fingers and 7 toes to frostbite.
And that hat tossing?
Pull that in January and you are dead in 45 seconds…
(Obviously sarcasm…but not by a lot…)
Oh no, not precious San Diego on the list…
Hmm, still not seeing Los Angeles or OC on the list, either the housing cheerleaders are right that this time is different or tick tock, matter of time…
Both are there, you just missed them:
The Los Angeles MSA is on the list of 33 with its own price and inventory charts; check out the price decline in the chart.
The Los Angeles MSA includes Orange County.
OC by itself is not on the list because it’s a “county” not a metro (MSA), but it’s part of the Los Angeles MSA which is on the list.
You’re right it’s the chart, I was referring to the YoY decline list though, looks like they are still positive even though barely.
Either case, interesting to see San Diego made the list, out of all the SoCal metro areas, SD probably isn’t the black sheep when it comes to price decline, last time it all started out in the 909, maybe that’s still the case especially if Riverside/IE is roll into LA metro area like OC.
I do wonder when, if ever, home prices will come down.
I don’t think my wife and I will ever be able to afford a decent home in this metro. Especially when said decent home is going for $800,000+ in a shitty part of Anaheim or Santa Ana, or the best new construction we can find is in Valencia or Ontario.
Phoenix_Ikki,
LA: +0.3% yoy in July, reflection of the drop a year ago. In June it was slightly negative YoY.
MoM -0.3%.
When it’s this close, it’s going to switch back and fourth for a while.
Since the peak in January: -2.4%. Quite a bit for 6 months. It’s down more from peak than San Diego, which declined by 2.2% from its peak a year ago. And it’s not seasonal. In 2024, January was close to the low point of the year, not the high point. This year, prices have been declining every month since January, by $23,000 in total.
………………………………
AnnoyedMillenial,
Prices ARE coming down in Southern California, as you can see, just slowly. What do you expect? Real estate is not crypto that can dissolve into nothingness overnight. Santa Ana is down 2% from the peak in January, seasonally adjusted. City of LA condos -5.0% from peak in 2022, seasonally adjusted.
Realtors are getting desperate to get business. Some scumbag Realtor from Washington State called me up at midnight yesterday to try to get me to unload my home to a builder to tear down. He didn’t even know that we were 3 hours head in time zone. He knew my name and phone number. I told him to go f$ck off and never call me again.
My mom paid $20,000 for her house back in 1967. I’m holding out for those prices again.
These charts are the best. Grateful that they don’t use log scales on the y axis.
🤣❤️
“Grateful that they don’t use log scales on the y axis.”
Just give it time in Weimar America.
Thank you for the article! Would you be able to post the active inventory graph for Raleigh? I didn’t see it under the price graph.
This is Wolf’s kitchen, and you eat what Wolf serves, or you don’t eat.
🍺
I can totally picture Wolf saying this
“If you don’t eat your meat, you can’t have any pudding!
How can you have any pudding if you don’t eat your meat?!”
No soup for you!
I can save you the trouble.
If you are selling Raleigh is horrible.
If you are buying Raleigh is horrible.
Also
The traffic in Raleigh is horrible.
I live in a Raleigh suburb. I agree with your first two statements, which are pretty much objectively fact (given current market conditions). The third statement is relative and subjective.
I find Raleigh traffic to be perfectly acceptable. Compared to NOVA/D.C./The People’s Republic of Montgomery County, etc. where I used to live, traffic is downright breezy. It isn’t Atlanta (or even Charlotte). The NE Corridor cities all have worse traffic as well. Hell, I’d argue my former rush hour commute on I-696/I-96 in the NW Detroit suburbs (Oakland County) was worse than anything I’ve experienced in Raleigh.
I will say that the municipal governments around here do need to get their heads out of their asses, otherwise there will be problems in the future. For example, the recent failed expansion of Six Forks Road, due to costs ballooning since the planning phase, was a case study in government official red tape and bureaucratic slow downs.
You should have seen it 20 years ago.
That 440 construction is ridiculous
and the few instances of cars traveling the wrong way down off ramps, leading to head on fatalities is unacceptable.
the stretch of 40 from Durham all the way thru Raleigh is pretty hazardous. That’s some white knuckle driving.
The speed limit is 70, yet most go 80-90mph.
They also get right on your bumper to somehow say “speed up!” Instead of just passing you.
Very aggressive drivers
Cops are there but really do not enforce the rules.
All that makes our highways here in Raleigh extremely dangerous, especially if you have a flat tire. You are in mortal danger 💯 trying to change that yourself.
Raleigh to Atlanta transplant here (well, 12 years ago). The ATL traffic really made me miss Raleigh. I went from an 18 mile commute in 25-30 minutes, to a 13 mile commute in 40-50 minutes (still good by Atlanta standards). I never minded the high speeds on I-40, but I was younger then. I’d get in the left lane and put the pedal down, and cruise at 80. It was faster, but more predictable. In Atlanta, I’ve seen more instances of crazy unpredictable maneuvers and less turn signals. And the traffic is THICK everywhere.
The NC DOT also seemed to stay ahead of the game with road construction. In Georgia, they seem to wait for things to get very bad before they do anything about it. There also seems to be more of that “induced demand” argument down here. “If we add another lane, it’ll just fill up with cars.” Yeah, that’s kind of the point.
All we need now is a little bit of panic… still a lot people pulling listings saying next year when interest rates drop it will be better. Here in Denver lots of homeowners trying to get people to sign 8-10 month leases so they can list next Spring.
The moment the media picks up on the fact that next year won’t be better, says this the beginning of a crash there will be a race to the exits. He who panics first panics best….
Also next year will likely be flat to down. The chances of prices going up are really small.
Here’s why:
1. Cutting short term rates doesn’t guarantee a decrease in long term rates
2. Long term rates even if they do decrease won’t gone down enough to make a meaningful difference without a recession
3. Spinning off Fannie and Freddie is likely to increase mortgage rates
4. There seems to be some inherent extra risk premium in mortgage spreads already, decreasing asset values aren’t likely to decrease that
5. This years unsold inventory + new sellers = even more inventory
6. Amount of buyers that aren’t a 1:1 transaction, i.e first time homebuyers or investors is unlikely to change
7. Airbnbs in COVID hotspots struggling
Also very curious how the marry the house date the rate crowd is doing….I’m seeing a lot of places listed at their 2022-2023 purchase price + cost of commission.
“Speak Now or Forever Hold Your Peace”.
Sell now, or forever lose your shirt.
They say Realty the bubble man can be heard inflating prices by childish adults everywhere, even once he disappears.
Fear not childish adults, Realty the bubble man will be back soon!
☃️
@Wolf I’m curious if you have any info on what the big guys are doing? I had it suggested to me the narrative won’t change until the big are out or deleveraged.
Then it’s the small flippers and retail investors that will be the bag holders.
The big guys – the big single-family landlords whose shares are publicly traded – have become nets-sellers over a year ago, of the homes they bought in 2012 out of foreclosure from banks. They’re making huge profits selling these houses. And they’ve been building their own build-to-rent developments, such as 300 houses all in one neighborhood, with a leasing and maintenance office, a pool, etc. Some of the big buys have their own homebuilding division. Others work with D.R. Horton, Lennar, etc. It’s the hottest trend in housing. A development of 300 houses and a leasing/maintenance office is a lot cheaper to operate than 300 far-flung individual houses. And the houses are brand new, higher end, and people love them. They attract “renters of choice” with above median household incomes. All the big guys have all have been talking about it in their earnings calls, and are showing it on their financials. That’s the big guys, the smart money: They came in when houses were cheap and they started unloading when houses were at the peak.
But there are still mom-and-pop landlords buying houses.
Total purchases by investors have also dropped but not as much as purchases by households.
Economics can be different for mom and pop.
Let’s say you bought a 4-plex 10 years ago for 10x rents (Let’s say 50k rents, $500k 4-plex, rents are now 40% higher or $70k), and now you can 1031 into a 6-plx for 15x rents that costs the same as you can sell your 4-plex for (let’s say $1.2M for 80k rents). You get higher income, and it’s going to be pretty much tax free even if you don’t exaggerate your maintenance costs due to depreciation expenses. Even though the GRM is worse.
I’d bet there are a lot of people in those situations who invested last decade.
I would surely think that Las Vegas would be on the list of US metros with the largest year-over-year price drops (if not the largest). I have heard that the business to casinos is way down. I knew many people that lost homes in Vegas during the prior housing bust. Vegas was the “I’m gonna get rich” place for many Californians (and others). It was the ‘casino’ of the housing market. Vegas is fun to visit. I would not want to live there – super hot, dry, and mostly ugly.
Prices keep on losing to inflation and more importantly, wages which continue to go up.
That’s the key difference from 2008 for all those wishing for a twice in a lifetime opportunity. Unless you live a really long time, they don’t.
2 more years, and median household income in the 35-45 range (prime buying years) will be over $120k, easily supporting a $43k annual/$3600/month PITI payment. Which is easily a $400k mortgage plus T&I in most locations ($2500 P&I, plus $900 taxes, $200 insurance).
Prices just will stay flat. Those “holding out” for 2 years will probably do just fine. They don’t have NINJA loans this time around.
“Prices just will stay flat.”
Funny looking “flat” — similarly funny looking as the “permanently high plateau,” as Irving Fisher called the stock market just days before the 1929 crash:
This is going to be a repeating theme.
Anyone who thinks real estate prices can just stay flat for a while doesn’t understand reality. Wages would have to triple/quadruple for these prices simply to be afforded.
Prices will crash, at least 60% nationwide if not 80%. You simply can’t have demand otherwise.
Good reference to the 1920s too. There was also a huge real estate bubble then. Real estate in Manhattan fell 75% from 1929 peak to 1933 trough and didn’t regain their former value until the 1950s/1960s.
All bubbles pop explosively. This one will too.
Prices are falling with record low unemployment and a strong economy. What happens if unemployment goes up by 1-2%?
Also $120k household income isn’t that much at our current cost of living. Also why buy if you can’t rent for $1-2k cheaper, no maintenance costs, no having to keep a place updated.
Nothing. You’ve seen the debt to income ratios.
Feels like David is the new Kunal….
Just realize 2008 was a once in a century event.
2030 will roll around. Median pricing will be between $450 and $500k and you’ll still be complaining how houses are too expensive
Mate, 2008 wasn’t a natural disaster, so the assertion is meaningless. WWI was a “once in a millenium” war, until WWII happened. You may be on to something with what you say, or you could just be “fooled by randomness”.
What conditions exist now that approximate 2008?
Debt service? Not at all
Ninja etc loans? Not at all
Unemployment increasing? Not at all
Deflation? Not at all
The only thing is that prices went up a lot during an inflationary time and now they’re losing to inflation. But you insist they need to drop a lot nominally in a high inflation environment. Not gonna happen.
This time is different are always famous last words.
We have price declines at record low unemployment. What do think happens if unemployment goes up to 5-6%?
Also they’re not just losing to inflation. Prices are actually going down. If you offset that for inflation the prices declines are significantly worse
As a real estate agent I have always been a “glass half empty” guy. Beyond cautious. I want a solid gold, not just gold plated, exit strategy on any purchase i make and I tell clients the same. Most of my business tends to lie with professional investors.
Yet my daughter in LA had to buy 2 years ago and bought a 2/1 PUD somewhat beater in San Demas for 520k. 2 years later she is forced to relocate to Sacremento and just sold for 600k. I told her not to buy 2 years ago and I was wrong. I’ve been wrong more than right. I wish I could predict the future but I can’t. Good luck to those who can!
Waiono,
That’s the beauty of a local market. If she had bought at that time in Oakland, for example (see charts below), she’d be down by $100,000-plus, and likely wouldn’t be able to sell or move now.
“2008” was really 2006-2012.
Where did you buy your crystal ball? I really want to get one of those.
How does your calculus hold up with 10+% mtg rates?
“What does your bat radar tell you, Batman?”
“It’s him. We’ve found the realtor, Robin. Let’s bring him to justice.”
We get it David. You’ve come up with the David Affordability Index (DAI). You post it here every single Wolf Street article about real estate. You invented something called “Prime Buyer Age” and arbitrarily set it to 35-45. You took the median income for that age group, which is conveniently a bracket provided by the census bureau. Then you provide the median price for a home. Nobody gets to see the values of your index, but you provide guidance like, “Price drop? Not gonna happen”, and “Future? Going to be sideways for three years”. You also provide historical guidance like, “This isn’t 2008” Great. Thank you.
The problem with your DAI is that it doesn’t reflect reality. If it did, prices wouldn’t be dropping in most major metros. If it did, inventory wouldn’t be stacking up to decade highs. I realize you put at least five minutes into googling these numbers so I appreciate your hard work. However, please forgive me if I put more trust into The Federal Reserve Bank of Atlanta’s Home Ownership Affordability Monitor (HOAM) that shows home affordability is at a 20 year low.
I’ll check back in on the David Affordability Index in 2-3 years to see if the rest of our realities finally caught up to yours.
Let’s check back as we’re doing every month, every year.
Home prices will lose to inflation, until they’re a bit more balanced.
The drop is a lot smaller than you think
No I’m not a real estate agent. I own a couple homes and several rentals so I’m invested. I own mortgage notes.
The facts that reflect reality are what I’m posting. Buyers can afford stuff, they’re not willing to pay. Sellers don’t want to come down on price. Every year a more will dribble onto the market every time the price ticks up and that will match demand from buyers who throw in the towel. Hence no real nominal price movement until inflation erodes the circa 2020 price gains.
You’ll wake up in 2030 and the house you had your eye on in, say, Raleigh will be the same price.
David,
You just completely don’t want to get it. You refuse to look at any of these charts or any other charts of local markets. You’re blind to the fact that NO ONE buys that national median home. People buy and sell in LOCAL markets. And I show the local markets, and they’re NOT “straight lines” per your theory LOL. If you don’t see that, if you think these charts or any of my other charts of local markets are straight lines — a theory that you keep promoting here — you’re just a goofball pumping real estate on this site.
Here are more charts that blow your braindead hype about “straight lines” to little bitty pieces. A bunch of these local markets are already down by over 20%. LOOK AT THE PICTURES, you goofball:
The 10 Bigger Cities with the Biggest Price Declines of Single-Family Homes (-9% to -23%) from Peak through June
The 19 Bigger Cities with the Biggest Price Declines of Condos (-12% to -24% from Peak through June)
You seem to be from around the Bay Area, so here is a local example of a market where prices are already down over 23%. The only “straight line” in this chart is the red line:
Thanks David for admitting your vested interests in real estate.
I am also invested in real estate as I have couple of homes in So Cal and I think prices have to fall a lot or rates have to drop a lot for homes to become affordable.
I also think average buyers are not that smart to see through what’s all happening.
Average buyers just want to buy but they can’t afford. They are not intelligent enough to see that home prices are much more detached from fundamentals and may/can/should fall a lot.
I am biased as I want home prices to fall a lot so that American dream is alive, average family is able to afford a home as a shelter, not as an investment, and we don’t become a nation of renters.
“You just completely don’t want to get it.”
What person who bought an asset at a peak price or what broker would want to understand that prices are falling because they are ridiculously high. If they understand, then they are admitting that they made a mistake and will lose money on this transaction.
You’re the one that’s wishful thinking. You continue with this drivel and I continue to correct you. It will take 13 years of income growth to catch up to home prices.
So either home prices stay flat for 13 years, or home prices correct to the mean. Home prices appreciating 50% in 2.5 years is a twice in a lifetime event which will be followed by a similar crash.
13 years isn’t enough.
Median household income would have to triple for real estate prices today to make sense.
Even with fast growth, that’s still a lifetime change. It will take a bubble pop to correct for reality, since tripling income at best takes a lifetime.
Will prices continue to fall even if interest rates are lowered? I’m shocked but it seems as though there is a real possibility that we will get an interest rate cut even if inflation is not under control yet.
Yeah see they actually rose the last time they lowered rates. Didn’t they?
Like owners anticipated it.
I have PTSD since powells been holding for so long.
Yes. Last time they cut interest rates, long rates and mortgage rates went up.
The housing prices going up on a rate cut is pure real estate agent marketing propaganda.
Also a .25-.50% drop in mortgages wouldn’t change affordability by enough to bring buyers back.
The Federal Reserve policy interest rates are short term overnight inter-bank interest rates and have nothing whatsoever to do with mortgage interest rates on residential property which are all keyed off the yield (interest rate) on 10 year US Treasuries.
Last year when the Fed cut by 100 basis points, mortgage rates jumped by 100 basis points. That was quite a lessen everyone learned about inflation, the bond market, and the Fed. It completely knocked the wind out of the real estate promoters.
QE and subsided housing is over for a while. Reduced interest rates are in the review mirror. Rentals are the smartest and cheapest alternative move for survival. Lots of socialist sanctuary cities already facing huge budget shortfalls, Denver just fired 200 city employees to scrounge up $250 million dollar deficit. Uncle Sam is not coming to the rescue, you can’t keep spending other peoples money and not expect it to run out. What will be the next good fabricated crisis that will turn the printer back on?
What will be the next good fabricated crisis that will turn the printer back on? It hasn’t been turned off! But to your question: War. Never ending war.
Interesting read on U.S. housing trends! The breakdown of price changes highlights shifting markets, and it’s a reminder of how important data accuracy is just like checking your tax info.
Long term real estate will again be a tough investment. But hey, you have to have a shack to call home. I see it to be slow. And if you have too much leverage, well pfft.
Just like the first time around. The problem is macro economic concerns are overwhelming interest rates and housing is always along for the ride when that happens.
Wolf correctly points out the disconnect between the Fed and mortgage rates, because of the uncertainty of political economic decisions.
So now we just have to watch this slow decline either stabilize or accelerate over the traditional slower winter months. Except Austin and Las Vegas, they seem to be going to heck in the straight line….
Don’t worry, once the fed starts cutting prematurely and blows out the long end of rates, the ultra rich and their various blackrocks won’t be satisfied with their short term rates in cash anymore. That cash will come off the sidelines and seek out anything resembling an asset and these cheaper but not affordable houses will be on the menu.
There is no way to substantially reduce housing prices in a low interest rate environment with the current level of wealth inequality.
Atta boy, you got it right. Low returns do not make the big boys happy. In an inflationary environment assets are the way to go. Inflation pays off the national debt, it makes it worthless in time. Inflation, in the long run, is not going away. Think Argentina.
Only problem is: Home prices are flirting with ATH and are defined by monthly outlay one can afford. If inflation goes up, I’d see home prices going down more and more because of mortgage rates.
1980. Days of 10%+ mortgages and all that.
Price per square foot: $41
2025. Days of 6-7% mortgages. Price per sq foot: $172
Value of $41 in 1980 inflated to now: $170.
Houses sure seem massive bubbly over inflated. Or not.
Now do wages along side it
Nominal 1980 median income, $21,020
Current household median income: $80,610
3.83x 1980 income
$/sq ft up 4.19×1980
Housing has had a big run up going up a little over 4x nationwide and close to 10x on the SF Peninsula where I live but those gains are nothing compared to the more than 40x (FORTY TIMES) increase in the S&P 500 since 1980 (and up more than 50% in just the last two years)
Another swing a miss from the over-leveraged investor.
1980 Median sale price = 3.8 X median household income
2025 Median sale price = 5.3 X median household income
Home Prices are 40% overvalued using your 1980 baseline. This doesn’t even include the huge increase in taxes and insurance
How do you explain a 60+ percent increase in property prices from 2020 to the end of 2022?
Does that seem normal to you??
2.5% 30 year fixed rate wasn’t normal.
The 50% run up in the S&P 500 over the past two years is not normal either…
Apartment
The S&P has done it in the past. Def not reversion to the mean tho.
Man those 2 years were good!
And apparently this recovery since April has been the uh… Best Ever. No joke.
There are no such rates anymore, and people who have locked in such rates are selling, see the previous articles by Wolf.
So why don’t prices drop by 60+ percent?
The inflation in every other price wasn’t normal either.
Inflation of goods and services since 2000 is approximately 80 percent. Wages are below 100 percent. See previous articles by Wolf.
Inflation of RE reaches 400 percent in some places?
How do you explain this fact?
Interesting. In 1981 mortgage rates went up to 18%.
You like numbers… Why don’t you tell me the average loan amount in 1981, and compare it to the average loan amount now, and then tell me what the payment would be if it was at 18%?
As Mark twain once said, there are lies, damn lies, and statistics.
1980 is cherry picked since 1970s inflation caused people to rush into RE.
If you use 1970 numbers housing price to income is 3x worse now than it was then.
Not even including the much higher costs (absolute and relative) for things like food, property tax, insurance, and repair/maintenance.
Housing should be costing 2x median income at best with those expenses being what they are. That would be $150k. Quite a drop from $450k.
Why does the Seattle Graph look smoother than it did last month. Did they data get revised or something?
Good observation. I inadvertently switched data sets from the “raw, not seasonally adjusted,” which I normally use, to “seasonally adjusted three-month average.” Zillow releases both data sets, and I maintain both sets with two complete sets of charts, so it’s easy for me to get on the wrong page.
The “raw” data drives everyone nuts, so I have been thinking from day one about switching to the “seasonally adjusted three-month average.” My twin series on single-family price declines and condo price declines by city already use seasonally adjusted three-month average data. But I’m leery of seasonal adjustments, and so I wanted to watch both develop over time before I switch, knowing that eventually I would have to switch because some of these raw data are just crazy. So I switched now for July accidentally. I might switch back to raw in August. Or I might stick with seasonally adjusted three-month average. I’m still conflicted.
Feedback by anyone is welcome on the “raw” v. “seasonally adjusted three-month average” debate here.
Thanks for the response, the seasonally adjusted three-month average is definitely easier to interpret and digest. I like smooth lines.
There is an interesting article on Yahoo Finance site (finance.yahoo.com) about interest rate expectations for the next 5 years.
Basically they (using predictions from Goldman Sachs, CBO, etc.) are estimating 10 yr treasuries to be in the 4.1-4.3 range THROUGH 2029, and mortgages to be in the range 6.2-6.4 through the same time period. In other words, no big changes from now.
Basically, we have got Matt Dillon (home buyers) on one end of the street, and the black hat guy (home sellers) on the other end. My money is on Matt.
Apologies if you are too young to understand the reference.
Real Estate in the Swamp is deader than a doornail. No activity whatsoever. The DOGE and crime headlines have killed the market. 300,000 Federals workers, many in the DC area, have been told to take a hike. Realtors have started doing cold calling in the middle of the night harassing homeowners. They are spoofing the calls to make them look like local calls when they are in fact coming from the West coast of the USA. Local Realtors here may want to look for a new career. I heard NJ, the only state that requires gas station attendants to pump your gas, are hiring.
New York is still ok?
This is such a good series of curated data – thank you.
Question for this educated group. I have been following along. I have a you g family in San Diego and w bought a “starter home” for $1.1M in 2022. We need more space. I have a 4.5% rate. Do I add a second story for $300k at $400 Sq ft to keep a $5400 PITI mortgage scenario OR sell now and buy a larger house for $1.4M at a 6.25% rate coming out to a $7900 PITI payment scenario? Or do I just collect as much cash as I can in my starter home and check back in 3-5 years and wait for the crash?
Maybe you’ve already got all this worked out down to the day and the penny, but…
Where are you going to live when you add your second story? That’s part of the costs.
How long does something like that take in San Diego? I don’t know either, but it’s going to take a LOT longer than they estimate, and it’s going to cost a lot more too than you think at first.
Are you eager to have lots of additional stress in your life? Like a contractor took some of your money but then ghosts you and doesn’t finish the job… Happened to a friend of mine.
There are lots of other questions you’d want to get comfortable with before making a decision.
Or you could just decide in your gut to go with it, and then make it work, come hell or high water. I’m known to have done things that way, including starting this site 🤣
Hahaha. Being aggressively stubborn has it’s benefits sometimes. We would rent a townhouse for the year the construction would be taking place. And I know it would be incredible painful to essentially move twice with young children and basically balance work, family, and construction project management. We make $385k/year combined, but the job market is incredibly cut throat right now and I strongly believe either myself or my wife will be laid off at least once in the next 3-5 years. I also am not excited about signing up for a $7900/month mortgage payment that would make up 40%+ of my after tax pay. That also sounds stressful. But somehow people seem to be buying 1.5M homes left and right and living with these huge mortgages.