Home price rise since 2012 “may be coming to an end”: Shiller. Biggest YoY drops: Seattle, San Francisco, Las Vegas, Phoenix, San Diego, Portland, Denver, Dallas.
By Wolf Richter for WOLF STREET.
“Probably what’s happening with the increase in home prices, it’s just seasonal, it’s the summer, typically it [the Case-Shiller National Home Price Index] is going up in the summer,” Robert Shiller, one of the guys that developed the Case-Shiller Home Price Index, told CNBC yesterday.
It “has been just growing ever since 2012, about 10 years in the US of steady growth in home prices,” he said. “But it may be coming to an end with the advent of this interest-rate rising cycle.”
It was the second time in the interview that Shiller used the phrase, “may be coming to an end.” Moments earlier he’d said: “The fear of interest rate increases has influenced people’s thinking — it’s not just the homeowners, it’s new buyers who wanted to get in before the interest rates went up even more. They wanted to lock in. So that’s been a positive influence on the market. But it’s coming to an end,” he said.
Today’s S&P CoreLogic Case-Shiller Home Price Index for “May” is a three-month moving average of home prices whose sales were entered into public records in March, April, and May – so that’s smack-dab in the spring selling season, when prices always rise from the prior month, even during Housing Bust 1. And given the lag in the Case-Shiller Index, the spring selling season is reported in the summer, and “typically it is going up in the summer,” as Shiller said.
On a month-to-month basis, the 20-City Case-Shiller Index rose 1.5% in May from April, but it wasn’t enough, and compared to a year ago, it fell by 1.7%, the third month in a row of year-over-year declines, and the biggest since 2012:
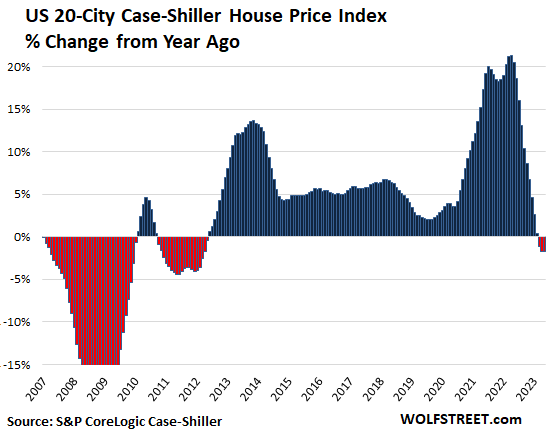
Half of the 20 cities in the index had year-over-year declines:
- Seattle: -11.3%
- San Francisco Bay Area: -11.0%
- Las Vegas: -7.8%
- Phoenix: -7.6%
- Portland: -5.1%
- Denver: -4.9%
- San Diego: -4.2%
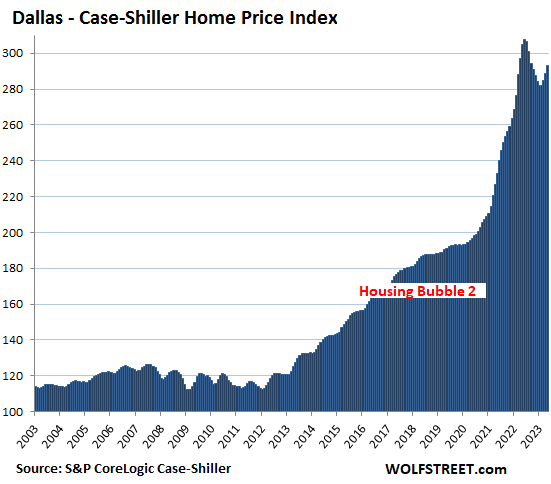
- Dallas: -3.8%
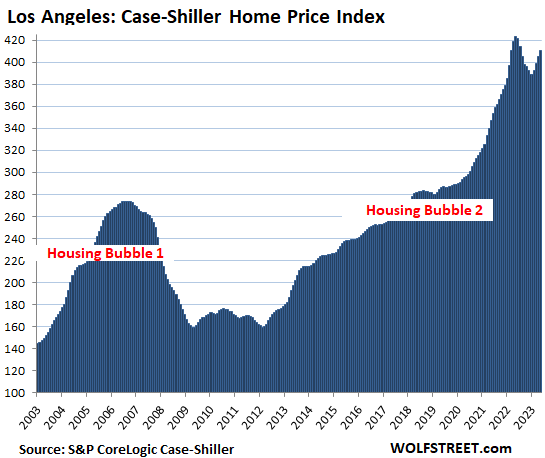
- Los Angeles: -3.1%
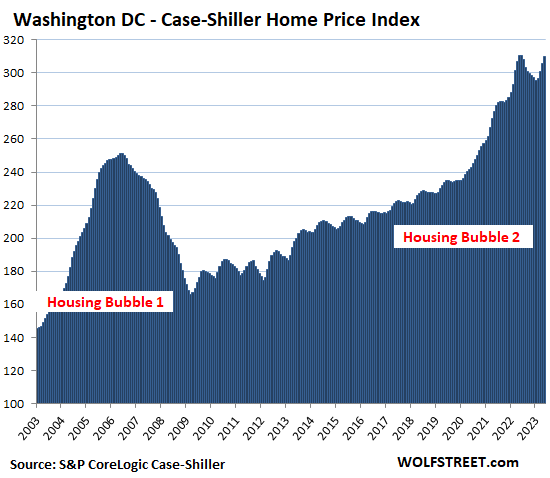
- Washington DC: -0.1%
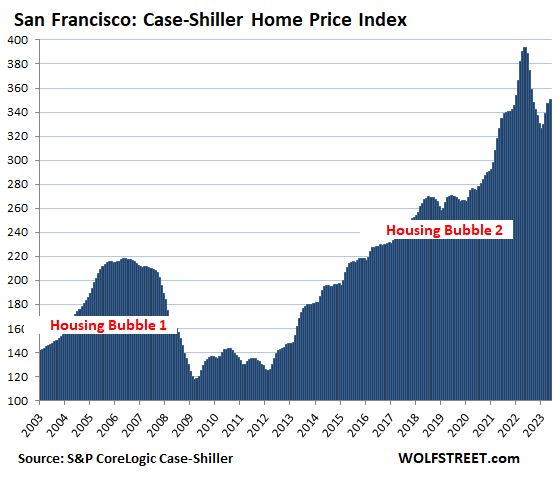
The most splendid housing bubbles by metro.
Seattle metro:
- Month to month: +1.9%.
- From the peak in May 2022: -11.3%.
- Year over year: -11.3%.
The San Francisco Bay Area:
- Month to month: +1.0%.
- From the peak in May 2022: -11.0%.
- Year over year: -11.0%.
This was the 7th month in a row of year-over-year declines. The San Francisco Housing Bubble of single-family houses in its full glory.
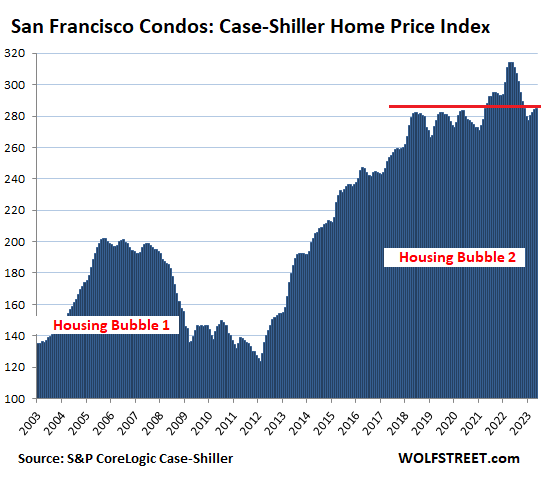
Condos in the San Francisco Bay Area have danced to a different drummer: They’re just a hair above where they’d first been in May 2018:
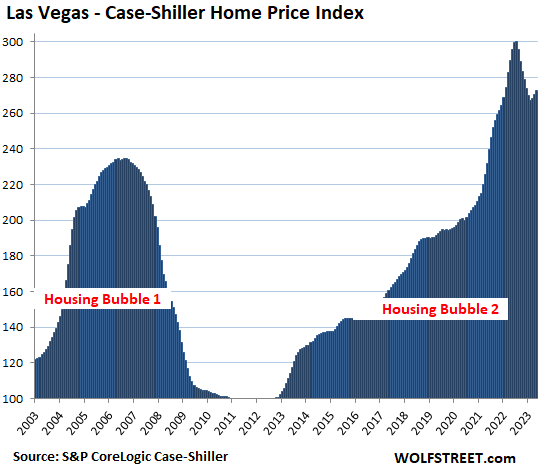
Las Vegas metro:
- Month to month: +0.9%.
- From the peak in July 2022: -9.1%.
- Year over year: -7.8%
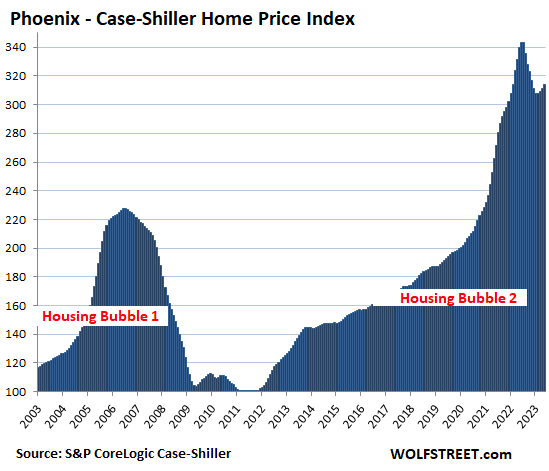
Phoenix metro:
- Month to month: +0.9%.
- From the peak in June: -8.6%.
- Year over year: -7.6%
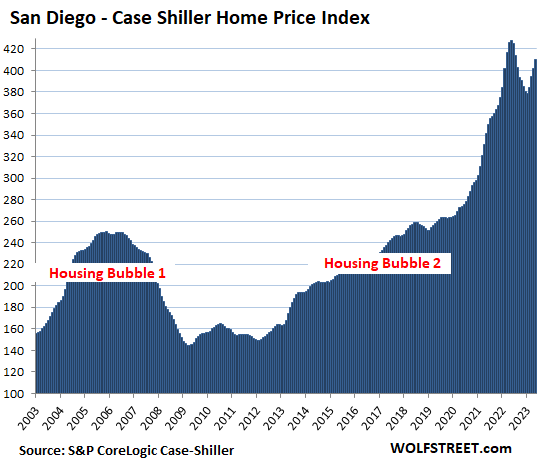
San Diego metro:
- Month to month: +1.9%.
- From the peak in May 2022: -4.2%.
- Year over year: -4.2%.
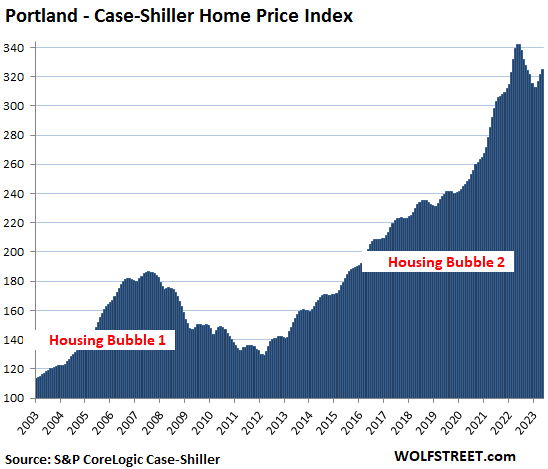
Portland metro:
- Month to month: +1.0%.
- From the peak in May 2022: -5.1%.
- Year over year: -5.1%.
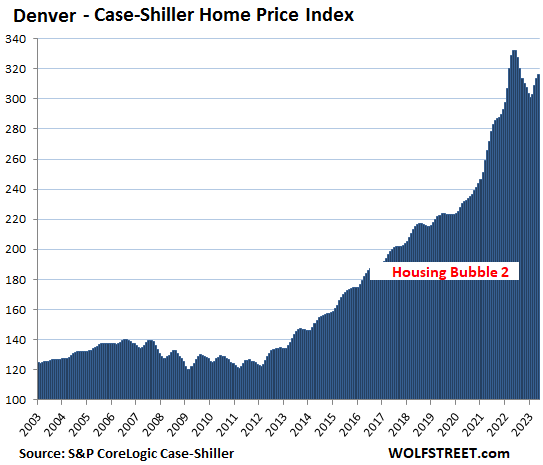
Denver metro:
- Month to month: +0.7%.
- From the peak in May 2022: -4.9%.
- Year over year: -4.9%.
Los Angeles metro:
- Month to month: +1.2%.
- From the peak in May 2022: -3.1%.
- Year over year: -3.1%.
Dallas metro:
- Month to month: +1.6%.
- From the peak in June 2022: -4.8%.
- Year over year: -3.8%
Washington D.C. metro:
- Month to month: +1.5%.
- From the peak in June 2022: -0.1%.
- Year over year: -0.1%
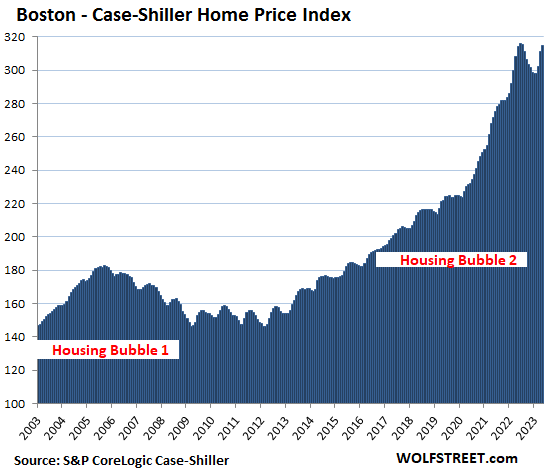
Boston metro:
- Month to month: +1.2%.
- From the peak in June 2022: -0.4%.
- Year over year: +0.2%
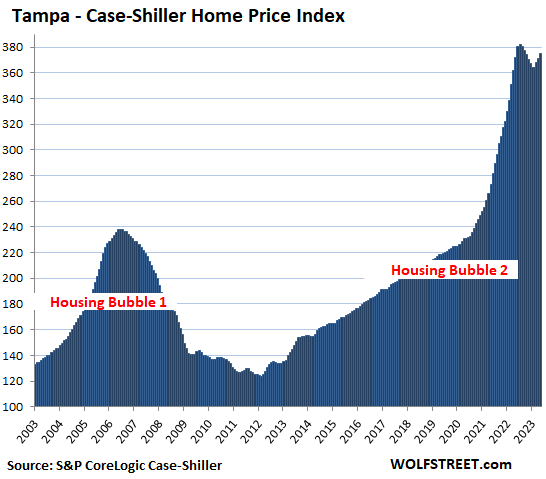
Tampa metro:
- Month to month: +1.0%.
- From peak in July 2022: -2.0%
- Year over year: +2.4%
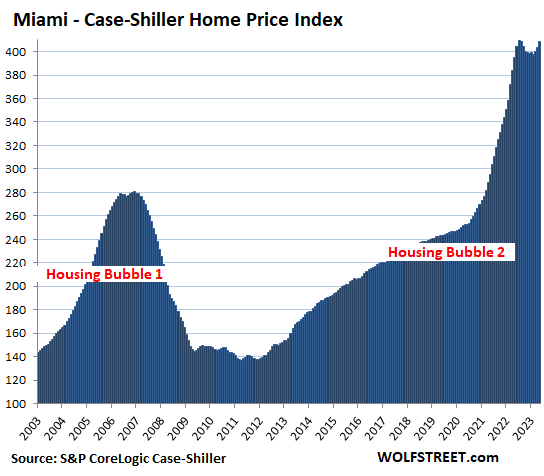
Miami metro:
- Month to month: +1.0%
- From peak in July 2022: -0.2%
- Year over year: +0.7%
New York metro:
- Month to month: 1.9%.
- Reached new high in May
- Year over year: +3.5%
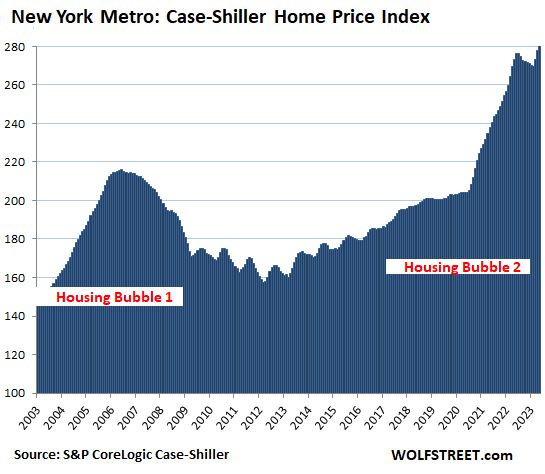
The Case-Shiller indices were set at 100 for the year 2000. The Los Angeles index value of 410 today is up by 310% since 2000. This makes Los Angeles the #1 most Splendid Housing Bubble in terms of price increases since 2000. San Diego is a rounding error behind, and Miami is a hair behind.
The remaining six markets in the Case Shiller index – Chicago, Charlotte, Minneapolis, Atlanta, Detroit, and Cleveland – have experienced far less house price inflation since 2000, and don’t qualify for this list of the Most Splendid Housing Bubbles.
Methodology. The Case-Shiller Index uses the “sales pairs” method, comparing sales in the current month to when the same houses sold previously. The price changes are weighted based on how long ago the prior sale occurred, and adjustments are made for home improvements and other factors (methodology). This “sales pairs” method makes the Case-Shiller index a more reliable indicator than median price indices, but it lags months behind.
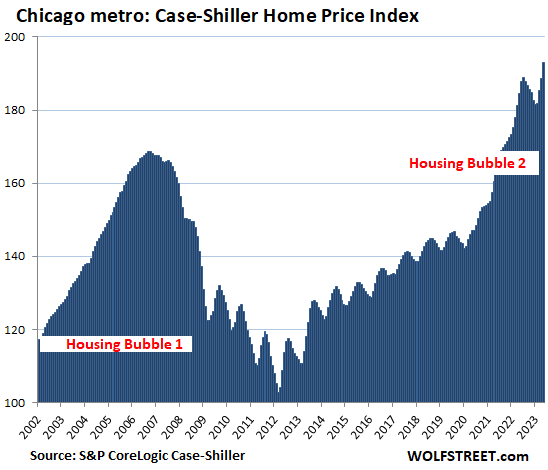
And Chicago anyway. The index rose 2.3% in May from April and reached a new high, but is up “only” by 93% since 2000 — “only” if compared to the low end of the Most Splendid Housing Bubbles, the New York metro, which is up 180% since 2000, while the high end, Los Angeles, is up 310%:
Enjoy reading WOLF STREET and want to support it? You can donate. I appreciate it immensely. Click on the mug to find out how:

![]()
Around 25% of the residential real estate markets have totally dried up and prices will just continue falling along with demands this year and in the years ahead as prices revert to their means.
Prices revert to their means??
…pricing is always a meanie to someone…
may we all find a better day.
“It’s tough to make predictions, especially about the future.” Yogi Berra
The question is when this well predicted housing crash could happen. Few things happen when the majority predict them to. All the individual city charts look like Housing Bubble 3.0 is starting.
Predicting the future timing and direction of any moving object is a difficult if not impossible.
Wolf,
Thanks.
I have one basic doubt/question about case shiller index interpretation. Is it growing index over time i.e. is it supposed to increase? My understanding is it needs to stay at 100.
As I understand the CS index, 100 is the reference level for year 2000, such that all subsequent numbers are relative to year 2000. For example, the high for Seattle last year was over 400, meaning that a home that sold in year 2000 for $100,000 would have sold for over $400,000 at the peak last year.
theshenami nailed it. The index was set at 100 for the dollar-prices tabulated in January 2000. This was done for each city, and for the overall indices. So, when these dollar prices double (+100%), the index shows “200.” When prices triple (+200%), the index shows “300.”
Thanks theshenami and Wolf.
what is the reasonable growth rate. wondering why 2008 was considered a bubble. In 2008 index only doubled in most cities.
Could I follow up on this? I’m wondering if the index is adjusted to account for inflation, along with the other things which I understand it is adjusted for? I’m assuming the answer is probably “no,” because one purpose of the index is to reveal the existence of inflation that might not otherwise be obvious — and adjusting for inflation would hide this effect. But that’s just a guess on my part.
Steve Anderson,
You understood correctly. The Case-Shiller index IS an inflation index, of house price inflation. By using the sales-pairs method, it compares how many dollars it takes to buy the same house over time, which is what inflation indices measure. It’s conceptually wrong to adjust one inflation index by another inflation index, such as adjusting CPI by the PCE price index, or adjusting PPI by CPI, or adjusting wage inflation by CPI, etc. People do it because it’s easy to do, you can adjust anything for anything, even if it makes no sense at all.
There is one exceptional use that makes sense: to show how house-price inflation outran wage inflation. So you could adjust the Case-Shiller index by an index of median wages, but you’d have to do it at the local level, such as Miami CS index v. Miami median wage index.
Measures of “affordability” also throw mortgage rates, insurance, and property taxes into the mix of wages and prices.
For Steve Anderson, I regard the index as illustrating raw inflation itself, in housing prices. Possibly you consider a relationship ratio between Shilling and CPI. I think CPI is designed to appear low.
So we have had inflation.
They just took the one good banks lend against most.
The one good people can’t live without.
The one good that is the most expensive to ordinary people.
Then they called it an asset and said there was no inflation.
Shame on every journalist who just took their measure of inflation *for twenty years*, without one thinking for themselves.
georgist,
Silly stuff. There are lots of different kinds of inflation. Consumer-Price Inflation is covered by several indices that track “consumable” goods and services. Then there are various kinds of asset-price inflation. Home-price inflation falls into that category. Homes are not consumables but assets. There is wholesale inflation, wage inflation, producer cost inflation… Only a moron would put inflation of “assets” into an inflation measure “consumables.”
I think I heard today that average sell price for GM vehicles this quarter is about $52,000 plus median new house is $400,000 plus. Fed stable prices means things have went up about 20X in my life time of 67 years.
Pack of cigs 1972 $0.25, today $12.00 our governments are protecting us or perhaps just taxing us
Letro,
They should be $100 per each cigarette. Maybe that would have helped my baby sister to quit smoking 30 years ago, and she wouldn’t now have such a miserable life with all kinds of severe health problems, including cancer.
Price stability is fed speak for keeping wages down.. Now does it make sense? If they keep prices stable you won’t ask for a raise..If they only inflate at 2% you don’t notice the loss in buying power for 50 years..2×50=100%. eventually the gig is up but in the mean time their stealing our wealth 2% at a time & using price stability to keep us from getting ahead.
Did your commensurate income go up the same amount?
1.02^50 is 2.69.
In 50 years, a steady rate of 2% price inflation means 169% higher prices, or about a 63% loss in purchasing power.
Old,
More like dollar went down 20 times
Official inflation over the past 67 years is 1,022% per the BLS inflation calculator… so they went up10x not 20x
It’s also 81% since 2000, Case Schiller’s base year
This basically shows how dollar has lost 75 percent of its value from 2000 due to currency devaluation aka housing inflation in this case.
Long term, I see this trend going up and up ie dollar slowly losing its value.
Coming here is like entering a bizarro world, Just read this story this morning: “Home prices cement a rebound with 4 straight months of growth” and needed to see what the reality was. Thanks for the actual data and interpretation.
We heard this all spring, and we will hear the opposite for the rest of the year as prices “collapse in free fall!!!” only to magically stop in Feb and rise again in the spring. YOY comparisons are what show the real change without the seasonal noise.
YOY without taking into account volume isn’t necessarily that helpful either. Sales volume is down substantially because many buyers can’t or won’t pay February 2022 bubble prices at 7% mortgage rates.
The desire of buyers to pay bubble prices is reflected less in volume (since thats also controlled by how many sellers exist) and more in days on market and listings that close under list price. Days are market are up from the peak but still pretty insanely low. Outside of the metros being bled dry by WFH there is still a smaller pool of buyers to greet the smaller pool of sellers, by in large.
But on the other hand, the house price is just 1% lower than the peak in June 2022. From this perspective, you can say that the price is really strong. If it goes up a little more then the house price is new record high.
Thanks for sharing these data in a clean and simple format, unlike the actual raw data from S&P which is very messy to sift through. It is painstakingly clear from these summaries that the market is headed south, debunking all the usual nonsense we hear from the housing cheerleaders:
“This time is different”: sure the conditions/environment change over time, but human behavior is always the same
“Golden handcuffs”: as Wolf explained to many commenters before, these sub-3% mortgage holders remove both supply AND demand simultaneously. Both sides shrinking about the same rate, mortgage applications shrinking just as fast as inventory, if not faster
“It’s all because of low inventory”: see above, plus all the vacant and AirBNB properties bloating the shadow inventory
Talking to my two friends this weekend, you would think the market is on the way to recovery or already in full recovery mode in SoCal (especially around Culver City and San Diego area) Both own a house around there and neither think the market will tank or drop at all in SoCal and it will just go back up by next year. Then again both also think interest rate will drop soon and demand for SoCal will be nuts all over again which justify further home price increase. By the look of things around here, I would suspect most SoCaler think the same way, and sadly prices around here still justify their thinking despite what potentially is to come…
In a conversation like this, I now reside to staying quiet, since I am not a homeowner so what do I know? Also tired of citing stats, data, and historical trends just to convince others otherwise. In their view, I am simply too stupid to have missed out and didn’t buy before Covid or back in 2012, or just too poor…who knows in the long run maybe they are right, I guess the only consolation price is at least my money is making enough return from Tbill to pay my rent, unlike this last last 5 to 6yrs in near 0 rate environment.
What happened with zero interest rates and massive QE will not happen again anytime soon. If it happens again, it will be after a massive collapse in asset prices, but it will be too late.
This era of insanity was an anomaly that occurs once or never in an individual’s lifetime. Without such anomalies, markets cannot stay at these insane levels for long.
Juliab – could be kinda rough sledding if you’ve only one lifetime, though…
may we all find a better day.
Sledders should know that after going down the slope without effort, there will come a time when they will have to make an effort to get back up the hill for another descent.
That’s how it is in life, nothing is free and easy
We shall see. If you could peer into it’s closet, you’d see that insanity wears many different jackets for different seasons…
LA City has pretty strong rent control, as I recall. CA State has rent control, maximum increase per year is 5% plus inflation, but no more than 10% per year. So renting is not too bad in CA if you have rent control and your apartment is tolerable. Better than buying a house at current crazy prices, pretty much anywhere in the country now. As I mentioned, lots of buyers are on the sidelines. I put the cash I might use to buy a house into 4 to 6 month T-bills, getting about 5.5%. They more than pay the rent.
After 40 years of home ownership and a move to a new city (Tucson where the prices are still crazy; some 60% up in 3 years), I decided to be a renter of a home. Cheap considering I don’t pay for real estate taxes, maintenance etc. The only consideration for home ownership is future gains which at this 12 year zirp inflated price may not be possible in the future.
Another Tucsonan here. I bought my house at the tail end of Housing Bubble 1.0. And, no, I didn’t overpay. I house-hunted for a year and a half and finally found the Arizona Slim Ranch.
And I can corroborate that crazy price observation. Oh, can I ever.
Yet another Tucsonan, who did nicely after Bubble 1.0. Now casting about for a summer home at a more temperate elevation to escape brutal summers, but no way I will shell out 400k for a miner’s shack in Bisbee.
Even as a homeowner that just sold his home and bought a new one (move in 9/1), I am keeping my head down and “thinning the cabbage” as I have nothing to add other than my own experience here on the north side of Houston, TX which is not in the charts or even a desirable place to live.
When those same doofuses start plying you with housing crash anecdotes, that’s your cue to start shopping.
Jesus, I feel like you stole these words from my mouth. I no longer have the arguement, and feel completely like a second class transient. Sympatico!
“In a conversation like this, I now reside to staying quiet, since I am not a homeowner so what do I know? Also tired of citing stats, data, and historical trends just to convince others otherwise. In their view, I am simply too stupid to have missed out and didn’t buy before Covid or back in 2012, or just too poor…who knows in the long run maybe they are right”
Looks like month to month housing prices are up 1% to 2% in all markets. As noted in Wolf’s earlier articles, could be that 3% golden mortgage rate has eliminated a big chunk of normal supply. Not a good time to be a realtor, or a buyer.
Or a mortgage lender.
Schiller says it is just seasonal. But if you look at Wolf’s blue bar charts, I don’t see much seasonality in the past.
funny I looked at the chart for that very reason, to me it is right there, spring bumps with exceptions of plandemic and gfc.
(Not that I would be able to spot it w/o first being told where to look…:-)
William Leake,
There is lots of seasonality. Just look at the wavy lines before 2020. They’re not in all metros but in many. The money-printing boom during the pandemic upended seasonality not just in housing but in just about everything else, including highly seasonal retail sales. So look at before 2020.
But now, after the huge spike, everything is exaggerated and so much bigger, the ups (now) and downs (post June 2022):
Seattle
San Francisco
San Diego
Portland
Denver
Los Angeles
Dallas
Washington DC
Boston
New York
Chicago
I sort of see wavy lines in some areas, but not very pronounced in a lot. Look at Las Vegas, Phoenix, Tampa, Miami. Almost nothing. Maybe the metros with no real seasons, don’t have seasonality. But Wolf is probably right, the current exaggerated “seasonality” is sort of unusual.
The “soft landing” will fix all of the red in Wolf’s charts! /s
…a soft landing right on to a X-large whoopee cushion
William, you noticed what I noticed. I mainly look at the San Francisco region and as I see Wolf’s SF Case-Shiller Home Price Index, I do not see the kind of uptick in the index we are seeing today compared to the previous bubble decline. I commented in September of last year that the current decline would be less severe than the last crisis because it is a story of decreasing housing demand due to a significant decrease in affordability caused by a dramatic rise in mortgage rates, unlike the last crisis that was a dramatic increase in housing supply along with decreased housing demand. I considered it possible that the current drop in housing demand would push housing supply down once builders reacted and slowed down construction and homeowners would only sell in emergency situations at lower prices. This seems to be happening as Wolf’s recent article talks about a 20 to 25% reduction in both sellers and buyers. So this uptick in the index makes sense as I believe that there will be see-saw action on price for the time being, as the % reduction in supply and demand fluctuates between favoring the supply side and the demand side while we wait to see the results of the rate increases on inflation and the impact this has on mortgage rates. I also stated that watching rent increases caused by inflation would be important as this would help put a floor on housing demand. I looked up a Fred chart for rent of primary residence in the SF Bay Area and the % change per year has gone up from 2.3% in Sept 2022 to 6.1% in June 2023, a significant increase that puts upward pressure on the buyer side and helps prop up demand.
Finally one of the most important metrics currently is the mortgage rate. I looked up the 30 year fixed mortgage on Fred and it was 6.29% on Sept 22 2022 and 6.78% as of July 20th 2023. Relatively stable when compared to the jump we had from the 2-3% range, but an increase nonetheless that puts downward pressure on demand and unusually also on supply since sellers aren’t motivated to sell and lose their 2-3% fixed mortgage rates as stated by Wolf, a factor I missed the last time I commented on housing. Bottom line, if the FED can get inflation under control and mortgage rates stabilize and at some point start dropping, buyers will jump back into the housing market and we will see the next leg up in housing. Inflation and corresponding FED actions will dictate whether we have already passed the low point in the housing index.
Not so sure about that.
Potential buyers and investors can now earn 5-6% on cash, rather than risk it in the housing market.
There seems to be an excess of supply over demand nationally right now, because home prices are dropping. What happens when the recession hits, unemployment rises, and demand falls further?
In my opinion, there is a significant chance that home prices could fall through the floor. With prices sputtering after a huge rise, caused by a Fed policy error, downside risk is greatly increased.
When the earthquake hits, do you want to be in the open, or locked in a building?
Just like the “job” and “the national unemployment rate” these numbers are interesting.
But, for the most part, not meaningful.
When I was unemployed I didn’t have to solve the nationwide problem. I only had to find ONE job.
The Chicago real estate market, as I imagine all other real estate markets, is extremely location dependent.
We don’t have to buy ALL the condominiums to downsize. We only have to find ONE.
We don’t have to sell ALL the homes in our suburbs. We only have to sell ours. Which, most likely will be a scraper. The land (lot) is almost certainly at least 95% of our home value. At least going by all the tear downs we’ve been seeing.
Still … Wolf’s analysis is ALWAYS first rate. And totally unbiased. He calls it like he sees itband doesn’t have to please anyone other than himself.
Yet another extremely informative post!
My Neighbor who was transferred and had to drop his original asking price $50,000 to move his house finally got a sale close after a couple of fails.
Across the street the several blocks of new builder homes are still empty waiting for buyers. The model home is, polished up and staffed with Realtors@ 8 hours a day 7 days a week but no buyers yet. I think the builder needs to get the price drop message a little more clearly.
It would be useful for commenters with real world info to give us the location they are talking about (city or county and state).
Sorry About That,
Hillsboro Oregon
Hubbert, thanks.
They would be sold in Bend. This market is hotter than the fires that make the air here unsuitable for inhalation.
Still plenty of people willing to leverage up into a volatile housing market, betting on lower interest rates. Half the transactions I see around my neck of the woods are still fix and flip operations. Bunch of lunatics speculating in this market.
The current meme is that we’re at the beginning of a new bull market. Because of course, we all know that the bottom of “bear markets” occur with P/Es over 20…
Some domestic mutual funds per Morningstar have (forward looking) P/Es around 15. But yes I believe the S&P index funds are right at 20.
(I haven’t invested in ETFs yet).
International funds ? P/Es 9.5 to 11 not uncommon. DODFX as just one example.
International funds have lagged domestic funds the last 10 years somewhat substantially.
If I knew when Fed was done raising I’d invest more in bond funds then.
Mutual funds never get mentioned here, they certainly are risky but less volatile than your typical company stock. (Volatility of course != risk but it doesn’t please some people).
Someone will always find opportunity where most see only adversity.
From what I read if you believe the real world examples in these comments , the market for a solid nice house has never been better with prices up and mostly crap inventory.
Just got to know wth you are doing, & a little luck dont hurt either..
Yeah, they’re not adding nearly the value they think they are and outside of asset appreciation from low interest rates they likely would turn a loss on every one of these flips.
One real world example, they bought at 460k in February and spent two months cleaning the place up. They finally got a pending offer for 500k 5 months later. They’ve probably sunk 15-20k in the carrying costs alone. I would be surprised if they made any money on the deal.
Another very nicely renovated house has been sitting on the market since December. A very conservative estimate on the carrying costs of that house that they want 800k for is 4k/month.
If flippers bought the houses with cash and not by financing then carry cost are not nearly an issue.
like i said IF you know wth you are doing.
If you have to finance a speculation, you are doing it wrong…
Yep, all the flippers that bought within the last 12-18 months where I live were not able to sell. They either rent it out or live in it. Just saw a pair of houses that were bought about a year ago by the same guys, one they “finished” about 2 months ago and its yet to sell, the other they just put it on the market last week and its not even finished – lots of work left to do. The tide is clearly going out.
Ehh its location specific. Here in my Midwest city I know about 8 flippers doing 4-8 houses a month. They clear 1m+ a year easily. They’re still selling houses for record per square foot prices. Not to mention the absurd amount they made from years past they should be more than well capitalized for any downturn.
You must know some rookie flippers
Is there anything comparable to the case Schiller for the Canadian market? It’s such a great index
Yes, the Teranet Home Price Index — based on the same “sales pairs” method. I used to use the data. But like the Case-Shiller Index, it’s way behind and misses market turns by three to four months. I switched to the CREA index last year, whose lag is a lot shorter. It uses “benchmark” houses for price comparisons, so comparing the prices of similar houses, which has a similar effect as “sales pairs,” in that it compares apples to apples.
In addition, CREA not only provides index values, but also dollar values, which is more intuitive, and I use the dollar values (Teranet only provides index values).
I checked the Teranet against the CREA, and outside of the much longer lag of the Teranet, the results are very close.
Here is CREA data for March sales (last one I did). 10 days ago, for the June data, price increases already backed off and sales volume dropped sharply. And CREA therefore revised its forecast way down.
https://wolfstreet.com/2023/04/14/the-most-splendid-housing-bubbles-in-canada-spring-selling-season-in-a-housing-bust/
Waiting patiently on the next Canadian edition, Wolf!
All politics (and all real estate) is local. RIGHT around the corner from my little 1350sqft, 3bed, 1bath home a 1918 4,000sqft house went on sale. Last sold in 2010 for $560K. Sold in three days for $1.7M.
Braincramp is right about locality. Wolf can show his charts all day long, but I am looking to downsize, not interest rate sensitive, have an area in mind, and homes in my sq footage go in a matter of days over asking price. Yeah, this is unusual, but I see lots of places in SoCal where it is still frothy, with houses being snapped up in days over asking.
This is not universal as the charts show, and there are houses and areas that I happen to look at that are sitting, but if you have a nice house aimed at the top 10% in an area they want to live, you have no issues selling in this market (or probably any market). I think the pain is all at the entry, low and mid range.
People were tracking outlier sales back in ‘08, too. So, someone overpaid for something…geezus, it happens all the time.
All the “I know a guy” and “my brother-in-law” anecdata in the world doesn’t skew the general trajectory of this led balloon.
In listening to Pulte’s earnings call today, it seems prices for new homes are going to stay higher for longer in spite of 7% mortgage rates. They have maintained gross margins above 29% for the past 3 quarters. In another sign of strength, PHM’s net debt is only 2.6% relative to their equity. It seems like the death of the US housing market is greatly exaggerated. That said, I’m very happy to have a 3% mortgage and a 15% LTV on my house in Florida.
Again, until job losses start.
Home builders have cut prices, and they’re building at lower price points, and they’re buying down mortgage rates, and the median price of a new house has now dropped 16% from the peak and 8% yoy, and is now the same as the median price of a “used” house.
Homebuilders cut prices and incentivize sales because some of their input costs have dropped and the crazy delays have largely vanished. Their volume is up thanks to those price cuts, as some buyers are shifting from used to new.
https://wolfstreet.com/2023/07/20/housing-market-faces-reckoning-price-of-existing-houses-now-the-same-as-price-of-new-houses/
Wolf, I gave this some thought. Builders are propping up the price only on paper.
The price of homes and new homes specifically, should be much lower given the financing buydowns. The fact that new<old in terms of price becomes even more pronounced if you factor in financing buy downs or added free "options".
I am curious how much buy downs actually cost builders and how many new home purchases get a buydown. I'm getting about 5% of loan amount for a 321 buydown, this coming out of builders pocket.
Other thing is they remind me of ARM/interest only loans of 2008, where first few years were a much lower rate. As we move forward, these 321's and 21's may cause an issue if widespread.
Yes, depending on how the buydown is structured, if it has a term of 2 years, it’s an awful lot like those teaser rates, gambling on a big drop in mortgage rates by then.
You can ballpark the cost of the buydown. If they buy down the rate by 2 percentage points for 2 years, on a $500,000 mortgage, the builder faces a cost of roughly $20,000.
The high gross margins means builders can drop prices if inventory isn’t moving, and still make a bunch of money. But this will drag market prices down because real estate is based on the greater fool theorem. Instead, actions like interest rate buydowns make it look like prices are stable even though in practice they are falling, and keep the boogieman of deflation at bay.
40 plus years small business owner/ real estate investment / Contractor.
Not sure how this Bubble will end, should take a long time to find out…
At least a decade????
Bubba, your 40 year experience window is interesting. 40 years ago Tall Paul finished choking off inflation so the US economy could enter a long ( 40 year) period of declining interest rates and financialization. This was the primary driver of increasing housing ( asset) prices over that long period. We knew that period would have to end as you can’t keep reducing interest rates forever. We hit that wall a year or so ago and house prices are starting to reflect that. The gig is up on that period and we are now entering a new era where things might go the other way for 40 years ( or more).
Howdy HC, YEP, my crystal ball shows a long way to go. Lots of ups and downs and hopefully, no more 0% interest rates.
If all goes as expected with seasonality – when we will start to see MoM declines? In October, when the August report drops? I assume June and July will still reflect the Spring selling rebound?
So the NAR’s median price index will react first. It generally peaks in June/July and then drops. We just had June, so we should see some drops later this summer.
The Case-Shiller is about 2 months behind the NAR data.
I suppose there is a lag in time between the decision to not to sell and the struggling of all the market sellers…
There is tons of people living from housing market.
Are they just going to vanish?
The pressure is not there yet for them. For all those that make a life from the housing market…
I really don’t know, but you could not just reduce your sales volume 15-20% each month and still maintain the life you had before… Of course we know that housing market people are careful with money and they had been preparing a plan for this (lol)
I get recently a house in Spain at a 2,5 fixed rate ( not going to happen again soon).
But it takes a lot to get it approved. I mean the realtor put a date for the contract sign. He thought it was closed enough in time but he failed for a month. That’s a lot.
We also had YoY declines in sales volume since January but prices went up by 1% in last month report.
Mortgages are down by more than 20% .
I’m just going to wait five years eating popcorn and seeing it outside the market. ( I went for a cheap condo , just in case recession hits)
Maybe in 5 years we will see a significant drop in prices, when housing market people who lives from volume instead of price drop get some struggling.
Who knows
What is your take on regional differences? They matter, no? The northeast has held out– continuing to show price increase (yoy, beyond seasonal flux). In Boston, can’t build easily and inventory always low, now even more so for reasons you cited. Incomes are high. Still seeing bidding wars, waiving everything here. Hard to compare it to SF which had to contend with tech issues. Thoughts???
Seeing the same thing in central Rhode Island (unsurprisingly) as you are Hawthorne. Decent homes are hitting the market and selling for 15-30k over asking within a week of listing and buyers are waiving inspections just to try and have an attractive offer.
In my searches, I have seen plenty of homes bought 2-3 years ago back on the market with new paint and an expensive price tag, and there’s also plenty of over priced garbage that sits and then gets relisted 10k lower until it sells, but I haven’t seen many affordable budget/starter homes in Kent county that need some work or updating being listed, they seem to have vanished from the market, possibly the 3% mortgage crowd? Decent homes a step up from that or houses at any price in desirable neighborhoods still have packed open houses and are getting multiple offers over asking in a week.
Speculatively, I believe the cost of rentals is rising too quickly in the area and so even at these high prices for a SFH, there’s been plenty of buying pressure as the relative cost to own looks more attractive than renting. I know that’s why I’ve been looking.
The Fed’s interest rate increases haven’t really impacted the economy yet.
You would think home construction would be devastated by a doubling of the mortgage rate, but the higher rates have actually incentivized multi-family construction and construction of homes for rent. Plus, new SFH construction is largely protected by all those fat existing homeowners locked into 3% mortgages. Builders are able to get a larger share of reduced overall SFH transactions, which helps stabilizes builder demand.
Housing is 30% of the economy. It used to be sensitive to interest rate changes, but the Fed allowed people to lock in ultra-low financing for 30-years. Now, the Fed’s interest rate “tool” is dull as a butter knife, especially when considering many people are receiving more interest income, which has the effect of increasing demand.
The Fed’s ST interest rate increases are also having little impact on asset markets, which care more about long-term rates. With long-term rates at only 4%, and inflation still running hot, there is no urgent need to transfer money from stock investments or RE into bonds.
If the Fed really wanted to get serious about inflation, it would do things to increase long-term interest rates. The ST rate is a water pistol. The LT rate is a bazooka.
Yes, the rate setting hasn’t had as much effect imo for the reasons you state plus the amount of cash still out there so not everyone needs a loan as much as in the past. The Fed’s o/n RRP hit another 52wk low today so money still flowing out btw. If the Fed doesn’t surprise markets with hawkish moves tomorrow (i.e. 50bps, uncap Tbill/bond rolloff, or outright sell MBS), I will restart to DCA my take-home into top 50 S&P or something rather than stack more into MMF even though would be 5.3% or whatever. Inflation is becoming entrenched with continued pay raises and that will keep prices up imo (including housing). Small businesses get screwed while big corps can afford it. Fed has been a day late and dollar short for years.
Freddie Mac says we have 3.8 million housing shortage. The National Association of Realtors says it’s more like 7 million.
Bernanke’s “wealth effect” has been confined to the upper income quintiles.
I get so tired of this “shortage” nonsense to pump up prices endlessly. There were 1.097 housing units per household in the US at the end of 2022, which was exactly where it had been in 2001 before Housing Bubble 1, and well above the years 2013 through 2019:
We underbuilt for a decade but it didn’t affect the prices that much before the 2020s craze. It seems that the stock from previous bubble was enough to compensate for that shortage.
Are the “gift from God” rates for 20-25% of mortgages reducing the velocity of sales to the point that the new price dynamic takes longer to manifest?
Spencer,
Here’s some anecdotal information that you can maybe use in conjunction with Wolf’s chart above. Summer of 2017 I bought a home 45 minutes outside of NYC in NY. That woukd be on the low end of the housing units chart Wolf is showing. I paid $220 per SF. I sold the home in 2021 for almost $300 per SF. Per the chart, I should have overpaid for the home in 2017 because there were less units as a whole. Yet, still came out ahead. Each circumstance is different. Each market being very different and in the case of major cities, it’s a complex matter of location location location.
It doesn’t matter what the “experts” say or the “industry giants” say. A lot of people lost a ton of money in the crash of 2008. But some people made a ton of money as well. It’s not always A or B. There is A, B and also the in between. Take a look at tour sources of information. You cited two companies who depend on the housing market. Research other companies and individuals doing research on the topic. Household growth from 2010 to 2020 was the lowest ever recorded in history of recording. Short term rentals/second homes is a variable in the equation of housing units. If those units were to actually hit the market, the number of units for sale woukd explode. Will that happen? I don’t know, I don’t care. What I care about is having liquid assets/cash ready to deploy when the opportunity presents itself, again. It always does, you just have to keep your eyes open and pay attention.
Pull up a graph on house prices since 1900. Nearly no appreciation from 1900 – 1940. House prices started their boom/bust upward trajectory starting around 1970. Wonder what happened.
June, 1913,, beginning of Federal Reserve Bank as a tool to maintain rich folks at the expense of working fools who saved their money, etc.,
$100.00
$3113.36
June, 2023, per the Bureau of Labor Statistics CPI Inflation Calculator.
https://data.bls.gov/cgi-bin/cpicalc.pl?cost1=100.00&year1=191306&year2=202306
Not sure if link works or Wolf allows, but easy to get to a minute ago.
old school-
“House prices started their boom/bust upward trajectory starting around 1970. Wonder what happened.”
I’ll take a stab at that question:
A relatively small Washington agency – the Federal Housing Administration – began in 1934 to subsidize housing by making mortgages more available. Federal mortgage intervention was born, and grew like a weed, as federal agencies tend to do. The whole concept was to steer bankers toward making loans they would not have otherwise made. What could go wrong?
Here’s a short description-
https://www.britannica.com/topic/Federal-Housing-Administration
And now you can qualify for a 1% down mortgage as long as you can prove you make less than 80% of the median income for your area (basically you have to prove that you are at high risk for a default).
What could go wrong?
Old School, I looked up a nominal price chart as I was curious about your observation and noticed that around the time of the GI bill in 1944 is when appreciation for housing took of. I believe what happened was the availability of 20 to 30 year mortgages and lower down payments started around this time, giving a larger group of buyers an opportunity to be part of the housing market, thus pushing demand up. This trend of making the housing market more accessible by lowering down payment requirements, increasing mortgage terms, lowering income requirements, etc. has continued since then and has pushed the appreciation along, like student loans did to the cost of education. There are limits to this, as we saw during the last housing crisis that was fueled by reverse amortization loans and speculation. Now mortgage rates have dramatically jumped, reversing this trend temporarily and you see the resulting price drop in the charts.
Wow, it’s almost like home prices are somehow related to the US moving away from the gold standard or something? Nah, must be coincidence.
We came off the gold standard and then the feds got to determine the value of a dollar.
The Fed’s recent interference in the housing market via mortgage bond purchases was totally unnecessary and reckless. A relative of mine paid over $600k for a small one bedroom condo in Cambridge a year or so ago. Such price is terribly distorted; as Buffett says, price is what you pay but value is what you get. These Fed-sponsored distortions in favor of owners are antithetical to the fundamental right to equal protection of the laws under the Constitution.
Thanks Wolf! Great data and insights. And no, I’m not going to relocate to Cleveland because it’s cheaper there. I love San Diego!
I got the same freaking problem. Lots of people do. That’s why these expensive cities are packed and expensive, LOL.
Any concern re: the the most brilliant state budget bubble? It seems like we are adding more and more entitlements while chasing off actual taxpayers and are highly dependent on capital gains for tax revenue.
Some like sameness, others like variety.
Cleveland will give you variety for instance 60 to 100 inches depending on exactly where in/near Cleveland you live.
No I never lived there.
My neighbor here in Eastern Washington complains so much about all the Californians moving here that I think its an act.
But then he’s a native here and I’m a transplant from all over.
I understand folks in Nashville complain about Californians too. But they complain more about the Northerners.
Understandable resentment… they might view CA folks as having made easy $$ off of home appreciation. Now they get to mimic them, the irony ?
Just a different perspective.
Would be very surprised to see a drop in home prices similar to 2008-9 drop of 50% from the peak or more for many of the charts listed. I do think the lending standards and sub prime allowed many to borrow higher than their incomes could support. Wolf last week had the summary of folks locked into their homes for a long time without some special event. So less selling and less buying and declines that reflect the current situation for much longer.
I have 66 year old friends that would like to sell and downsize and have no mortgage. Their home is not huge, 2200 sq ft small lot in Horseshoe Bay Tx but the areas they want to move to have almost no inventory. New homes in their area sell for 300 a sq ft. The problem is if they shrink to 1500 sq ft and move their used home sale price barely covers the selling costs. So they are locked in.
900 Square Feet is totally adequate for two folks who like each other a lot and occasional visitors.
Just tell your friends to be sure the entry and exit and all the doors are wheel chair friendly or can be made that way within their budget.
Especially if occasional visitor(s) include chairbound.
Took a long time for the residential realities realized that 32 inch wide doors usually permitted much less, about 30.5 is average.
The building stardard for many years [Seattle, etc] has been at least one 36″ entry door. Interior doors okay at 30″.
Speaking from experience — lenders have been shoehorning folks into jumbo loans who were right on or over the ragged edge of what they could reasonably afford for many years now. Maybe it’s not the subprime lending standards of fog-a-mirror-get-a-loan, but not exactly conservative either.
Shrink to 1500ft2.
Raised a family of 4 in such a house.
Never thought it was small.
Living large now….rebuilt after fire…1650ft2 ranch.
Work in home construction. Amazing what people now
consider a ” starter” or retirement home.
1650 ft² was much much more than I as a single person needed. (1986-1996 home).
Tiny homes < 400 ft² a little too small.
But other than really old homes I dont know where 700 to 900 ft² homes get built.
I dont want to buy land and put a manufactured home on it… risky.
Local couple bought land but then the contractors did shoddy work and they ended up spending much more than planned to get it finished right.
A local free paper had a detailed account of it 2 years ago or so.
Not a pleasant read.
I'll continue to rent. My one BR just got upped 8.5% to $895 starting in October.
Rents actually declining in a few cities but not many I suppose.
The last surge in housing prices was caused by a powerful combination of Covid, WFH and ultra low 30 year mortgage rates that were artificially reduced by the Fed. Covid pandemic made people want to move out of apartments into single family homes. WFH or work from home made homes more attractive because many people could use their homes to work from and avoid Covid and their long commutes to the office. The ultra low mortgage rates of as low as 2.75% made homes more affordable.
The decline in prices since last year has been primarily caused by the much higher mortgage rates of approximately 7%. However, there is a very low level of sellers at this time because many homeowners have 3% mortgages and don’t want to lose them by selling their homes. In addition to low supply, the utility of a single family house is still high because of WFH and the fear that another pandemic might start and people feel safer in a SFH.
In summary, home prices remain elevated and may be very slow to decline due to WFH and people wanting to feel safer in another pandemic.
It’s a matter of time when it goes down bigly.
It’d take higher unemployment to trigger this.
High prices, High rates, Wages not keeping up with inflation ==> something has to give in.
That’s the current narrative, but things can change fast.
There are lots of factors that influence housing. Buyer scenarios, seller scenarios, mortgage rates, rent v. buy considerations, investors and cap rates, airbnb demand, demographic changes, RE tax trends, inflation rates, job outlook, shifts in buyer tastes and space requirements, etc.
It would be foolish to think any single factor would drive home prices. While I agree that 50% of existing homeowners are locked in with mortgage rates of 5% or less, it means 50% of sellers are not locked in at a low rate, or have no mortgage at all. Given home prices will be driven at the margin by a small group of motivated buyer/sellers over the next year, you have to be very open minded about the future of home prices.
Once housing trends develop, they tend to continue and accelerate for many years before they subside. Much of the activity in the market is driven by price momentum, which feeds on itself.
What the stock market does also has a big impact… maybe the biggest impact.
Lakewood Ranch FL which has seen prices double since 2019 is showing a few cracks. Local builders are offering 5.5 mortgage with purchase of a spec built home. New prices are still far ahead of resale though.
The key to solving this housing problem is getting the banks to stop lending. That solution was going to happen until the Federal Reserve bought the mortgage backed securities and essentially became the world’s largest mortgage bank. However, political pressure, geopolitical pressure, and a need to sell deficit funding treasuries may finally force the Fed into a corner of choosing funding the government or maintaining the asset value of the elite, the Fed can’t do both forever and still remain the world’s reserve currency.
I continue to see no meaningful SALE (not wish/list) price drops in my area.
From Canada: there are no 30 year mortgages and btw: it looks like however granted them in the US is underwater if they were marked to market.
The vast majority of terms here will be 5 years or less, not sure the average term, but there are lots of variable, meaning they have already doubled. I know a few people with this. Also lots of 1 and 2 year so their turn coming up.
One response if client cries is to extend amortization period. Going to 30 year is old school, now some much longer, but at at some point monthly pay no longer covers interest.
One bank, BMO, is in hot water, or say warmish, with regulator over its mortgage book, to the point that head regulator addressed the bank’s board, after unsatisfactory response from lower levels.
Prob begins when regulator audits small sample of mortgages and finds that in 25% of them, the amount of mort plus heloc exceeds value of prop. Scrutiny begins. Then reg gets anon letter from a bank staffer, saying they are being told to ‘slow walk’ response.
Further, all Big Six were caught off guard by pace of hikes. and so gave out some mortgages that broke even. But apparently BMO was giving mortgages at a loss for a year. These can’t be ‘loss leaders’ to get other biz cuz mortgages are biggest of BMO book, about half, in Big Six.
To be clear, BMO is not in serious trouble like SV etc. The mortgages aren’t ‘hot money’, huge deposits that are yanked when social media creates a bank run.
The Canadian bank system is rock solid, and with only six of any size, they are as profitable as you would expect from a cartel. No one lost a dime in a Canadian bank in the Depression and BMO never missed a dividend.
However, Canada has largest RE bubble of G Seven. Edged out by Oz for RE bubble, but Oz not in that group.
What kind of people would have fear of rate increases at the end of FED rate hike cycle? It makes sense maybe last year when FED just started, but now, does it?
The article implies housing bubble will boom. I myself also look forward to it. It will be the best to now how and why. Lag of monetary policies impact could be the easiest answer. More specific answer will be very appreciated.
I agree with Shiller here, you can see the jumbo mortgage market get a bit tighter each week, I personally know some people who did buy to get in front of it. They didn’t want to wait to have the material stuff they wanted, but now the window is slammed shut because banks won’t even lend to them, plus jumbos now likely headed to 8%.
I saw an article about “middle class” (making $270k) people taking out $7,000 a month mortgages.
The article explains that they’ll just re-fi in a year when rates go down.
I can’t even…
Waiting for the correction is like watching paint dry :/
I just ran a roi calculation on Seattle 360 VS 100. It worked out to 5.6 annualized return. Lower if taxes and insurance are added in. That really doesn’t seem like a drastic bubble to me. That’s much lower than annualized stock returns.
So, four or five areas had a small dip (10% makes little difference in a market of seven-figure homes) and basically nothing everywhere else.
My area in a big Texas metro doubled over the last 15 years and is at maybe 95% of that now. Pretty normal looking. I don’t think homeowners are panicking.
I don’t feel bad for people who missed 3% because any mortgage is crappy and 6% isn’t much crappier than 3%. I feel bad for sticky high prices that lock out most middle class families. HCOL areas need to tumble, but it’s not happening just yet – if ever.