The hangover after the tariff-front-run boom last year.
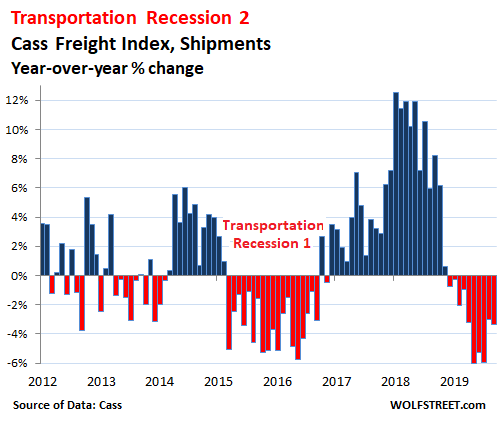
Freight shipments by all modes of transportation – truck, rail, air, and barge – within the US fell 3.4% in September 2019, compared to September last year, according to the Cass Freight Index for Shipments. For the index – which tracks shipment volume of consumer and industrial goods but not of bulk commodities – it was the 10th month in a row of relentless year-over-year declines:
The stacked chart below shows how shipments in 2019 (red line) – though lower than in 2018 (black line) – have remained above all prior years, except for June, when they fell below the pre-2018 record of June 2014 (green line).
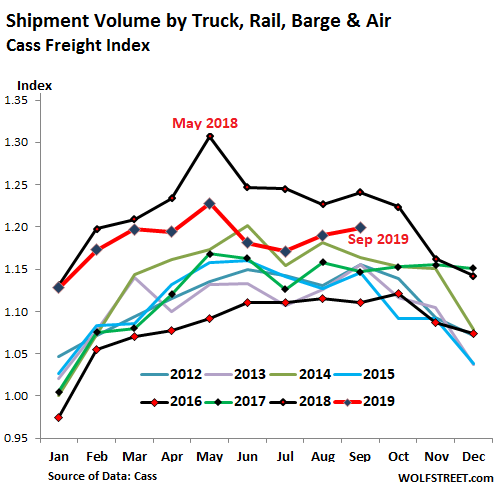
If you squint at the stacked chart just right, you can see that the much sharper-than-seasonal drop-off in November 2018 will make November and December this year and January next year an easier comparison – a sort-of flattening out on a year-over-year basis, but at a lower level.
The Cass Freight Index for shipments is a measure of the goods-based economy. This includes consumer goods; construction materials; products, equipment, and components for manufacturing; supplies and equipment for oil & gas drilling and mining; etc. And this points at the two-track economy at the moment:
Consumers on average – with everyone in one bucket whether they want to or not – went on strike at the end of last year but emerged refreshed in the spring, and they’re working and making money and buying stuff, and powered by hot e-commerce, retail sales rose 4.6% in September year-over-year, according to the Commerce Department. Consumers are doing their part. And these goods have to be shipped.
But the industrial economy has slowed after the surge last year, much of which had been powered by front-running potential and actual tariffs. At the time, companies over-ordered and stuffed their warehouses with goods, and inventories ballooned (all data for August, the latest available):
- Manufacturing production dipped 0.4% year-over-year.
- Industrial production – which includes manufacturing, but also oil & gas drilling, other mining activities, and utilities – fell 0.5% year-over-year.
- Construction spending, all categories combined, fell 1.9%.
Railroads took the brunt of the declines. The number of carloads (commodities, motor vehicles, etc.) fell 7.0% year-over-year in September, according to the Association of American Railroads (AAR). Coal carloads, which have been on a sharp down-trend for a long time, fell 8.7% year-over-year. Carloads of grains fell 15.8%; and crushed stone, sand & gravel fell 7.5%.
The number of containers and trailers (intermodal) that railroads shipped fell 5.9% year-over-year. This segment of the rail business is heavily affected by competition from the trucking industry, where rates have fallen, now that excess capacity is dogging the industry.
The national average spot rates for vans in September fell 14% year-over year to $1.84 per mile, according to DAT. Contract rates for vans fell 9.7% to $2.15 per mile. Flatbed spot rates fell 14% to $2.20 per mile; and contract rates ticked down 5.6% to 2.56 per mile. These lower rates appear to be pulling in some business from railroads.
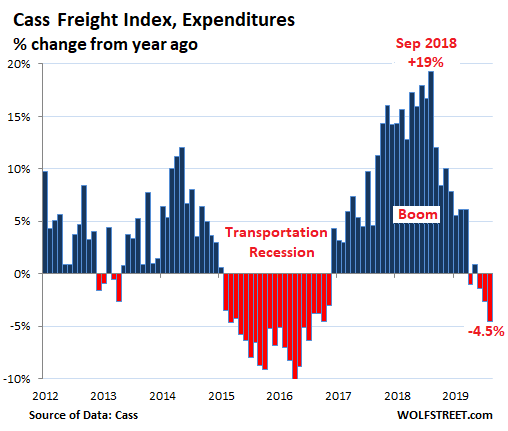
As a result of declining shipments and freight rates that are ticking down, the total amount that shippers such as retailers, wholesalers, and manufacturers spent on freight, including fuel surcharges, by all modes of transportation fell 4.5%, according to the Cass Freight Index for Expenditures.
Despite shipments having dropped for 10 months in a row, total freight spending has dropped only four months in a row, as freight spending had surged to such an extent in 2018 – peaking in September last year with a year-over-year jump of 19% — that increases in spending on freight due to higher freight rates continued into mid-2019, though at a slowing pace. In September, freight spending rose 4.5% from a year ago:
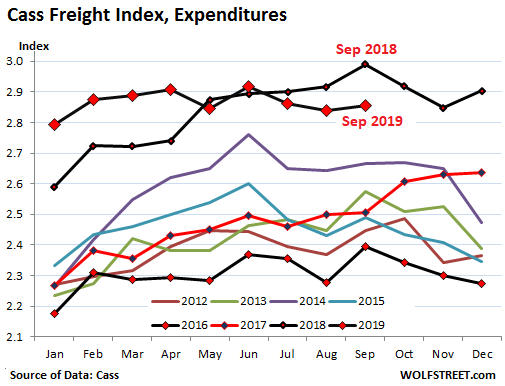
The stacked chart below shows just how much of an outlier 2018 had been, and how early 2019 had been an even bigger outlier that is now getting unwound. The purple line, in third place, was the prior banner year 2014:
Going forward, the freight industry is confronted with the same duality it has seen in recent months: Consumers are buying stuff at a good clip, and e-commerce is booming, and there is no slowdown in sight at the moment – though consumers have been somewhat lackadaisical about buying new vehicles. But the industrial economy and construction are hobbling along near zero-growth levels, just above it or just below it, depending on how the mood swings.
The US-China trade war, falling business confidence, slowdown in China, German exports, and new: the temporary shutdown of Hong Kong’s airport, the largest cargo hub in the world. Read… Global Air Freight Sinks into Longest Recession since 2008
Enjoy reading WOLF STREET and want to support it? You can donate. I appreciate it immensely. Click on the mug to find out how:

![]()
Regarding internal . Freighters article posted last week stated that many more shopping g companies are now using east coast ports. Truck ing freight lanes are much cheaper than west coast . Savannah has seen a record increase along with norfolk, Baltimore . New York New jersey. Philadelphia this year and last alo ne. Meanwhile west coast ports have seen a drop in shipping even with incentives for trucking companies. I even look t ed this very fact out to a outdoorsman from Baltimore and told him where to find the article last Friday and got real nasty with me. Said it was because he and his union buddies do such a great job. Whatever chump. Whatever
I’m betting that he knows the difference between an outdoorsman and a longshoreman. He can probably even write in complete sentences.
I got educated on gdp growth by Hussman. A big part of GDP growth and sales growth occurs due to unemployment rate falling say from 10% to 3.5%. Once the unemployment rate hits 3.5% or so there are not a lot of people to bring back into labor force so GDP and sales are going to have to have a lower trajectory.
From what I remember around half of GDP growth is just the increase in people working, once that is done gdp slows. In recession as unemployment quickly spikes up gdp goes negative real fast and the process starts over. It’s been a long cycle this time.
And still many of the people who were working before the Wall St Banks crashed the economy still haven’t made it back into the workforce. I love economists who talk about the ‘unemployment rate’ without realizing that its a big lie.
Yep. I have seen work by Stockman that actual hours worked is about the same as the last peak in 2008. That info is about a year old but probably not too much different today.
Hussman does sound analysis but he doesn’t seem to realise that he’s basing it on skewed and twisted official numbers, making his conclusions questionable. Of 200 million working age Americans, 100 million haven’t got a job. That doesn’t sound like the full employment 3.5% indicates taking into account a certain number of people at any moment transitioning, training or taking voluntary leave.
Same thing with inflation where Hussman gets totally perplexed that it’s so “low”. Wolf had a great article on this recently drawing a differentiated picture, and shadowstats.com for years has been calculating 8-9% of actual annual inflation for the typical U.S. consumer.
I stopped by a local home center for a few materials and noticed a huge drop in price for lumber and sheathing. 2×8-10ft pine framer fell from $9.65 to $6.95 along with all the other 2by sizes.
4×8-1/2 wafer board was priced down to $6.75. I haven’t seen it priced this low in over ten years.
Please, what area or region ??? Thanks
If you think about the average person in their 50’s they have usually accumulated all the household goods they want. At that age you tend to start paying for lawn services and maintenance services that physically you don’t want to nother with anymore. Anyway, I think an aging society might be more services oriented than goods oriented.
Especially once you figure health care costs. My father probably “spent” 2M+ in health care in 2017-18.
Its so hard to figure out the aging baby boomer thing regarding the economy. As I mentioned I retired at about 50. It was tough and my descressionay income was probably $10 a day for the leanest of years. Anyway that gradually grew to $40 per day. At 62 when social security kicked in it is now about $100 per day which I think is a little above median.
If you are used to being frugal it’s tough to flip spending habits, but I am giving some thought about what I really want to do. I am not a restraunt person as that is about the fastest way to blow $100 per day I know of.
Old-school,
Millennials are a far bigger generation than the boomers. They’re moving into their prime earning and spending years. Generations are a flow. So don’t worry. You spend less, young people spend more. Overall consumer spending is growing just fine.
Yep they are piling up credit card debt like there is no tomorrow.
Because at some point there will be no tomorrow
Millennials who carry debt report owing an average of $27,900 in personal debt.
Despite credit cards being the biggest source of debt for one in four millennials, about 22% don’t know the interest rate they’re being charged. (hahahahahahaha)
https://www.businessinsider.com/millennials-survey-main-debt-credit-cards-not-student-loans-2019-9
‘The survey comprised 503 Gen Zers, 672 millennials, 595 Gen Xers, and 441 baby boomers. On average, millennials who carry debt report owing a total of $27,900 (excluding mortgages), slightly less than baby boomers and about $8,000 less than the average amount Gen Xers owe.’
As should be self evident from the experience of California ( leading the nation in poverty rates) the reason the ‘milllennial generation’ is the largest is due to immigration.
It should be obvious, if politically incorrect to notice, but the expected economic outcome of a Meso-American mestizo immigrants and their children is not going to track the economic outcome of American boomers born in the 1950’s and early 60’s.
There’s so much wrong with this comment, but I’ll just correct one:
Rank State Poverty Rate
1 Mississippi 20.76%
2 New Mexico 20.16%
3 Louisiana 19.03%
4 Kentucky 17.71%
The high poverty rate for CA is based on what the federal govt calls the alternative calculation method (something like that). It mainly takes into account the cost of living.
So, base on that, California does have the largest fraction of its population in poverty.
https://lao.ca.gov/LAOEconTax/Article/Detail/136
California’s Official Poverty Rate Down Slightly, Remains Above Rest of U.S. Last week, the U.S. Census Bureau released updated poverty statistics for states indicating that 16.4 percent of Californians—more than 6 million people—were poor in 2014. This poverty rate is down slightly from the 2013 rate of 16.8 percent, but remains higher than in the rest of the U.S.
It looks like shipping volumes are closer to a seven year high than a seven year low. There is a seasonal downtrend like you pointed out. 2018 produced an exceptionally strong shipping uptrend.
New housing starts were up in a recent report.
David Hall,
The year-over-year charts show this this is NOT a seasonal downtrend (comparing September to September, same season). Stacked charts show that this is NOT a seasonal downtrend, with 2018 shipments above 2019 shipments for the entire year, regardless of what the season is.
Canada supplies approx 28% of the wood used in the US construction industry. If housing is supposedly up, then why has the Canadian export market collapsed and thousands of Cdn workers lost their jobs this quarter, some permenantly?
The imposed tariffs cancel out the advantage of a 75 cent Cdn dollar. The only explanation I can see is a US slowdown, or the fear of a slowdown with US lumber suppliers.
As an aside, this is also a good news story as the rate of timber harvest has been unsustainable here. Bigly. :-) I suspect there will be a big shaking out in our logging industry going forward.
When I was a kid over 60% of BC’s economy was based on forestry. Today, that number is 24%. Here is where it gets scary and it mimics the US. The top contributor to GDP in BC? Financial and RE. #2…Other Services (whatever that means). regards
You should not of used the word “seasonal”. However, your point is well taken.
You are exactly correct. 2018 was a monster shipping year. This year is trending down a bit. No reason for concern.
I never had the option of direct buying from China before with no taxes added on and delivered to the mailbox.
Love some of the gorgeous stuff I am getting in semi-precious and gold plated goods for the last couple of years.
Stocking up on a store or on-line after the big economic tank and China stop sending goods overseas due to much higher costs.
Perhaps I am missing a key portion of the message.
When I look at the graphs for Shipment Volume and Car Freight Index Expenditures, it looks like
2019 is above all past years except for 2018.
Besides showing an obvious slowdown, these graphs suggest that perhaps 2018 may have been exceptional for some specific reasons. It will be interesting to see what the data shows for the rest of the year.
Look forward to insights from all of you.
In the meantime, back to the beach
Sandy Toes,
Yes, you got it. As I explained in the text, 2018 was an outlier, driven by front-running the tariffs, when companies over-ordered and stuffed their warehouses with goods and equipment. I have been documenting this scenario for nearly a year, at first more on a hunch, but now the data has piled up to back it up. This includes trucking companies themselves that over-ordered class-8 trucks in 2018 to meet this demand, thereby creating an historic boom, but orders have now collapsed.
Here’s the most recent story on the collapse of Class-8 truck orders:
https://wolfstreet.com/2019/10/03/as-orders-collapse-heavy-truck-manufacturers-start-layoffs/
Wolf,
I find quality issues change quickly from year to year.
Some quality goods, I cannot get anymore even at a higher price.
So any goods I find, I have about a 6 month window to get the items.
Stuff bought a couple years ago are no longer available.
The items replacing are much poorer quality or smaller than what I recieved before.
Consumer goods is a game of psychology. Mils are more likely to spend on experiences, while previous generations bought “things”. Consumer spending is also a lower income demographic, poor people tend to accumulate more junk. (Saw a homeless woman managing a fleet of shopping carts, at least one full size shipping container worth). We all get a lot poorer, and then the political needle moves, reactionary. Shop till you drop, and shop to beat the terrorists, and a Santa Claus rally. Anachronisms (stocks on Wall St too?).
I suppose the GM strike has some impact on freight shipments.
Also, the first comment by Matt is interesting. Widening and adding a third set of locks to the Panama Canal ( opened summer 2016) did give shippers the capability to divert cargoes from the West to GoM/ East Coast ports. Maybe your shipping commentor, is it MCO1 has some thoughts on this?
The Third Set of Locks project of the Panama Canal was started for one reason alone: to allow the Panamese government to benefit from the growing container and RoRo (vehicle carriers) traffic from Asia to the Eastern Coast of the US.
While the Panama Canal Authority does not release detailed information about destinations, the freshly released FY2019 press release put the the three most important routes passing through the canal in descending order as US East/Gulf Coast-Asia, US East/Gulf Coast-South American West Coast and Europe-South American West Coast.
Also to give an idea of the importance of each kind of trade, the most important categories of goods passing through the canal in FY2019 were containers (126.2 million UMS), bulk freight (76.5 million UMS) and RoRo (53.1 million UMS). While not all containers coming from China and cars coming from Japan head for the US it’s beyond doubt the largest part does.
Intriguingly enough this expansion project was chiefly financed not by China, but by Japan with the State-owned JBIC providing a whooping 34% of financing and Mizuho providing assistance to put the financing deal together.
China either had some kind of tacit agreement in place with Japan or allowed herself to be suckered into the tragicomic Nicaragua Canal: while reportedly the brainchild of (former) billionaire Wang Jing, the Chinese government was supposed to support the project through State-owned China Railway Construction Corporation and XGCM by supplying part of the funds needed, construction equipment and roughly 25% of the needed workforce.
From what I can gather somewhere last year Wang Jing quietly absconded with what remained of his wealth and all Chinese operations tied to the Nicaragua Canal shut down overnight.
Guess all those COSCO container carriers will have to join the queue near Panama instead of receiving preferential treatment.
Wolf – JB Hunt Trucking (JBHT) reports Q3 earnings today after the bell. There has been a recent uptick in the share price, possibly indicating an earnings surprise.
It’s certainly a bellwether for the trucking industry and for freight in general. If it beats will this signal a change in your forecast?
From the general economic standpoint, everything is awesome.. US economy is driven 66% by consumer spending and that is not slowing down..
The home prices are going up and up.. inflation is going up n up..
stock market is going up n up.
It doe snot matter it is because of cheap money.. US can afford to print as much as possible because of dollar hegemony which I don’t see going away for few decades atleast