But apartment rents in 10 other cities surge 10% to 15%.
In the most expensive US markets, apartment rents hit a ceiling some time ago, in some cases four years ago, and have dropped from those highs, as tenants have reached their limit. That this wasn’t a brief fluke, after which rents would surge again in those markets, is becoming increasingly apparent. At the same time, sharp rent increases have moved down to less expensive markets.
In Seattle, the median asking rent for one-bedroom apartments in July fell 3.1% from a year ago to $1,900 and is down 4.5% from the peak in May 2018. The median asking rent for two-bedroom apartments fell 4.1% from a year ago to $2,350, and is down 11.3% from the peak in April 2016.
Clearly, after years of surging rents in Seattle, a ceiling has been hit. At the same time, the phenomenal boom in apartment and condo construction over the past few years has put plenty of supply on the market – though it’s all high-end, and therefore mostly the wrong supply. And those vacant high-end units that need to be filled are putting downward pressure on the entire scale.
In San Francisco, the median asking rent for one-bedroom apartments rose 2.9% in July compared to a year ago, to $3,600. But this was below its old record set nearly four years ago in October 2015 ($3,670). The median asking rent for a two-bedroom apartment ticked up 1.3% year-over-year to $4,790 – also below the October 2015 peak ($5,000).
San Francisco’s are the most ridiculously high rents among large US cities. Locally, it’s considered part of the “Housing Crisis,” which has many aspects, including that 1% of the population is homeless. Despite all the hoopla and the money in San Francisco, rent increases have been smacking into basic market forces starting in late 2015, and those market forces haven’t abated since.
In Los Angeles, the median asking rent for 1-BR apartments fell 4.3% from a year ago to $2,230 and is down nearly 8% from the peak in December last year. 2-BR rents, at $3,190, are down a smidgen from a year ago and down 3.6% from their peak in June 2018.
In San Diego, the median 1-BR rent fell 5.4% from a year ago, to $1,750, and is down 10.3% from the peak in December 2018. And 2-BR rents, at $2,400, are down 4.8% from the peak in October last year. Rents are down similarly in Santa Ana (Orange County) and Long Beach.
In New York City, a vast and diverse market with some of the most expensive neighborhoods in the country, the median asking rent for a one-bedroom apartment peaked over three years ago, in March 2016 ($3,370). In July 2019, the 1-BR median asking rent was $3,050. While up 5.2% from July last year, it was down nearly 10% from the peak over three years ago. The median asking rent for two-bedroom apartments rose 4.9% to $3,450, but was still down 13% from the peak in March 2016.
In terms of serious rent declines at among the most expensive and largest rental markets, Chicago and Honolulu stand out.
In Chicago, a huge market that spans the spectrum, the median asking rent for 1-BR apartments, at $1,470 in July, has plunged 28% from its peak in October 2015. And the median 2-BR rent, at $1,800, has plunged 32% from the peak in September 2015.
In Honolulu, the median rent for 1-BR apartments ($1,590) and for 2-BR apartments ($2,200) have both plunged 25% from their peak in early 2015.
The table below shows the 16 most expensive major rental markets in the US. The shaded area indicates peak rents and the changes since then. Boston and Ft. Lauderdale are the only markets on this list whose median asking rents reached a new highs in July:
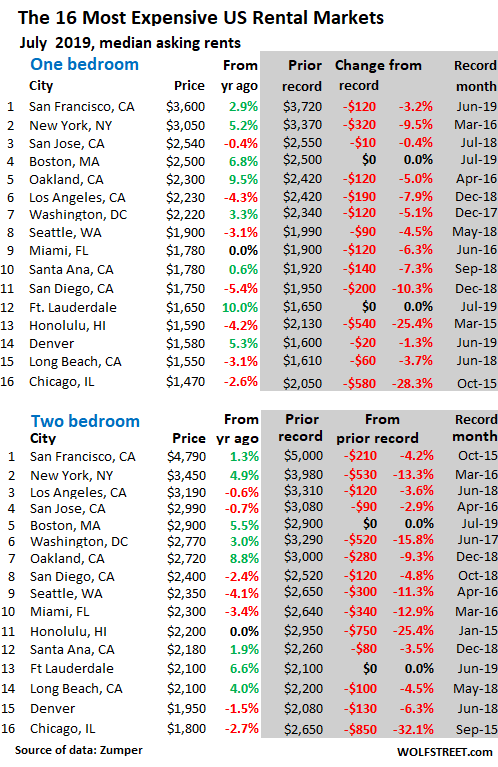
“Asking rent” is the amount advertised in the listing. This is a measure of the current market for people looking to rent. It is not a measure of rents that long-time tenants actually pay. “Median” means: half of the advertised rents are higher, and half are lower.
The data is based on over 1 million active listings in the 100 largest markets that Zumper combs through, including third-party listings from Multiple Listings Service (MLS), of apartments-for-rent in apartment buildings, including new construction. But it excludes single-family houses and condos for rent. It also excludes rooms, efficiency apartments, and apartments with three or more bedrooms. Incentives, such as “one month free,” are also excluded.
The 15 Cities with the largest rent declines:
What was red-hot once is now ice-cold. Here are the 15 cities that in July experienced the largest year-over-year declines in median asking rents for 1-BR apartments. At the top is Nashville, which had been a red-hot rental market until this year when market forces pulled the ripcord. Also note Houston and Dallas on the list — and another formerly red-hot market, Portland:
| City | 1-BR $ | Y/Y % | 2-BR $ | Y/Y % |
| Nashville, TN | 1,170 | -14.6% | 1,350 | -6.9% |
| Baltimore, MD | 1,180 | -14.5% | 1,420 | -15.0% |
| Columbus, OH | 700 | -10.3% | 1,100 | 3.8% |
| Houston, TX | 1,150 | -10.2% | 1,400 | -12.5% |
| Buffalo, NY | 990 | -8.3% | 1,180 | -15.7% |
| Portland, OR | 1,350 | -8.2% | 1,700 | -1.7% |
| Lincoln, NE | 670 | -8.2% | 890 | -7.3% |
| Philadelphia, PA | 1,380 | -8.0% | 1,700 | 0.0% |
| Bakersfield, CA | 730 | -6.4% | 900 | 1.1% |
| Madison, WI | 1,200 | -6.3% | 1,320 | -7.0% |
| Des Moines, IA | 810 | -5.8% | 860 | -7.5% |
| Chesapeake, VA | 990 | -5.7% | 1,220 | 1.7% |
| San Diego, CA | 1,750 | -5.4% | 2,400 | -2.4% |
| Dallas, TX | 1,230 | -5.4% | 1,700 | -4.5% |
| Lexington, KY | 750 | -5.1% | 980 | 4.3% |
The 15 Cities with the biggest rent increases:
But rents are soaring in some of the top 100 major rental markets, with 10 markets experiencing double-digit year-over-year surges in median asking rents for 1-BR apartments. Oakland is on this list, but note that its 1-BR asking rent, despite the surge, is still down 5% from its peak in April 2016, see table above (if your smartphone clips the right side of the table, hold your device in landscape position):
| City | 1-BR $ | Y/Y % | 2-BR $ | Y/Y % |
| Chandler, AZ | 1,210 | 15.2% | 1,460 | 14.1% |
| Scottsdale, AZ | 1,430 | 13.5% | 2,010 | 3.1% |
| Fresno, CA | 1,000 | 12.4% | 1,140 | 0.9% |
| Gilbert, AZ | 1,210 | 12.0% | 1,470 | 9.7% |
| Charlotte, NC | 1,320 | 11.9% | 1,420 | 10.1% |
| Spokane, WA | 850 | 11.8% | 1,000 | 6.4% |
| Glendale, AZ | 860 | 11.7% | 1,100 | 6.8% |
| Syracuse, NY | 970 | 11.5% | 1,050 | -6.3% |
| Indianapolis, IN | 750 | 10.3% | 810 | 0.0% |
| Fort Lauderdale, FL | 1,650 | 10.0% | 2,100 | 6.6% |
| Oakland, CA | 2,300 | 9.5% | 2,720 | 8.8% |
| Providence, RI | 1,500 | 9.5% | 1,580 | 3.9% |
| Sacramento, CA | 1,300 | 8.3% | 1,500 | 6.4% |
| Reno, NV | 910 | 8.3% | 1,310 | 7.4% |
| Tulsa, OK | 660 | 8.2% | 810 | 5.2% |
But the drama gets averaged away on a national basis.
All of these soaring, plunging, and stable rents thrown into the same bucket produce the national averages: with the median asking rent for 1-BR apartments rising 2.1% to a new record of $1,233, and the median asking rent for 2-BR apartments rising 2.2% to a record of $1,477.
The largest 100 Cities, by magnitude of 1-BR rent.
Below is Zumper’s list of the top 100 most expensive major rental markets, sorted by 1-BR asking rents in July, with year-over-year percent changes (Y/Y %). You can use your browser’s search function to find a city. If your smartphone clips the right side of the table, hold your device in landscape position:
| City | 1-BR $ | Y/Y % | 2-BR $ | Y/Y % | |
| 1 | San Francisco, CA | 3,600 | 2.9% | 4,790 | 1.3% |
| 2 | New York, NY | 3,050 | 5.2% | 3,450 | 4.9% |
| 3 | San Jose, CA | 2,540 | -0.4% | 2,990 | -0.7% |
| 4 | Boston, MA | 2,500 | 6.8% | 2,900 | 5.5% |
| 5 | Oakland, CA | 2,300 | 9.5% | 2,720 | 8.8% |
| 6 | Los Angeles, CA | 2,230 | -4.3% | 3,190 | -0.6% |
| 7 | Washington, DC | 2,220 | 3.3% | 2,770 | 3.0% |
| 8 | Seattle, WA | 1,900 | -3.1% | 2,350 | -4.1% |
| 9 | Miami, FL | 1,780 | 0.0% | 2,300 | -3.4% |
| 9 | Santa Ana, CA | 1,780 | 0.6% | 2,180 | 1.9% |
| 11 | San Diego, CA | 1,750 | -5.4% | 2,400 | -2.4% |
| 12 | Anaheim, CA | 1,730 | 3.0% | 2,230 | 5.2% |
| 13 | Fort Lauderdale, FL | 1,650 | 10.0% | 2,100 | 6.6% |
| 14 | Honolulu, HI | 1,590 | -4.2% | 2,200 | 0.0% |
| 15 | Denver, CO | 1,580 | 5.3% | 1,950 | -1.5% |
| 16 | Long Beach, CA | 1,550 | -3.1% | 2,100 | 4.0% |
| 17 | Providence, RI | 1,500 | 9.5% | 1,580 | 3.9% |
| 18 | Chicago, IL | 1,470 | -2.6% | 1,800 | -2.7% |
| 19 | New Orleans, LA | 1,430 | 6.7% | 1,530 | 0.0% |
| 19 | Scottsdale, AZ | 1,430 | 13.5% | 2,010 | 3.1% |
| 21 | Minneapolis, MN | 1,400 | 0.7% | 1,800 | -3.2% |
| 22 | Atlanta, GA | 1,390 | -4.8% | 1,750 | -6.4% |
| 23 | Philadelphia, PA | 1,380 | -8.0% | 1,700 | 0.0% |
| 24 | Portland, OR | 1,350 | -8.2% | 1,700 | -1.7% |
| 25 | Charlotte, NC | 1,320 | 11.9% | 1,420 | 10.1% |
| 26 | Orlando, FL | 1,300 | 4.0% | 1,470 | 2.1% |
| 26 | Sacramento, CA | 1,300 | 8.3% | 1,500 | 6.4% |
| 28 | Dallas, TX | 1,230 | -5.4% | 1,700 | -4.5% |
| 29 | Chandler, AZ | 1,210 | 15.2% | 1,460 | 14.1% |
| 29 | Gilbert, AZ | 1,210 | 12.0% | 1,470 | 9.7% |
| 31 | Austin, TX | 1,200 | 0.8% | 1,540 | 4.1% |
| 31 | Madison, WI | 1,200 | -6.3% | 1,320 | -7.0% |
| 33 | Aurora, CO | 1,190 | 4.4% | 1,500 | 2.7% |
| 34 | Baltimore, MD | 1,180 | -14.5% | 1,420 | -15.0% |
| 35 | Nashville, TN | 1,170 | -14.6% | 1,350 | -6.9% |
| 35 | Plano, TX | 1,170 | -0.8% | 1,630 | 3.8% |
| 37 | Fort Worth, TX | 1,160 | 5.5% | 1,300 | -0.8% |
| 38 | Houston, TX | 1,150 | -10.2% | 1,400 | -12.5% |
| 38 | Newark, NJ | 1,150 | 2.7% | 1,500 | 7.9% |
| 40 | Irving, TX | 1,140 | 0.0% | 1,500 | -2.6% |
| 41 | Henderson, NV | 1,130 | 6.6% | 1,350 | 8.9% |
| 41 | Tampa, FL | 1,130 | -2.6% | 1,320 | -4.3% |
| 43 | Durham, NC | 1,110 | -1.8% | 1,270 | -3.1% |
| 44 | St Petersburg, FL | 1,100 | 5.8% | 1,550 | 3.3% |
| 44 | Virginia Beach, VA | 1,100 | 6.8% | 1,230 | 2.5% |
| 46 | Pittsburgh, PA | 1,080 | -0.9% | 1,300 | -3.0% |
| 46 | Raleigh, NC | 1,080 | 8.0% | 1,200 | 0.8% |
| 48 | Richmond, VA | 1,070 | 1.9% | 1,230 | -1.6% |
| 48 | Salt Lake City, UT | 1,070 | 2.9% | 1,370 | 1.5% |
| 50 | Fresno, CA | 1,000 | 12.4% | 1,140 | 0.9% |
| 50 | Phoenix, AZ | 1,000 | 3.1% | 1,250 | 5.0% |
| 52 | Buffalo, NY | 990 | -8.3% | 1,180 | -15.7% |
| 52 | Chesapeake, VA | 990 | -5.7% | 1,220 | 1.7% |
| 52 | Las Vegas, NV | 990 | 6.5% | 1,150 | 0.0% |
| 55 | Milwaukee, WI | 970 | 6.6% | 1,020 | -8.1% |
| 55 | Syracuse, NY | 970 | 11.5% | 1,050 | -6.3% |
| 57 | Boise, ID | 960 | 2.1% | 1,100 | 12.2% |
| 58 | Kansas City, MO | 950 | 0.0% | 1,070 | -2.7% |
| 59 | Anchorage, AK | 930 | 3.3% | 1,150 | 4.5% |
| 59 | Colorado Springs, CO | 930 | 4.5% | 1,200 | 7.1% |
| 61 | Jacksonville, FL | 920 | -3.2% | 1,050 | -3.7% |
| 62 | Mesa, AZ | 910 | 1.1% | 1,160 | 12.6% |
| 62 | Reno, NV | 910 | 8.3% | 1,310 | 7.4% |
| 64 | Louisville, KY | 900 | 4.7% | 960 | -2.0% |
| 65 | San Antonio, TX | 890 | -2.2% | 1,100 | -5.2% |
| 66 | Glendale, AZ | 860 | 11.7% | 1,100 | 6.8% |
| 67 | Corpus Christi, TX | 850 | -4.5% | 1,070 | 0.0% |
| 67 | Spokane, WA | 850 | 11.8% | 1,000 | 6.4% |
| 69 | Rochester, NY | 840 | 0.0% | 980 | -3.9% |
| 70 | Laredo, TX | 830 | 0.0% | 880 | -11.1% |
| 70 | Omaha, NE | 830 | -2.4% | 1,050 | -4.5% |
| 72 | Arlington, TX | 820 | 1.2% | 1,090 | 0.9% |
| 72 | Baton Rouge, LA | 820 | -1.2% | 910 | 0.0% |
| 74 | Cleveland, OH | 810 | 1.3% | 870 | -3.3% |
| 74 | Des Moines, IA | 810 | -5.8% | 860 | -7.5% |
| 76 | Knoxville, TN | 800 | -3.6% | 900 | -2.2% |
| 76 | Norfolk, VA | 800 | -2.4% | 1,070 | 7.0% |
| 78 | St Louis, MO | 790 | -1.3% | 1,150 | -1.7% |
| 79 | Chattanooga, TN | 780 | 1.3% | 890 | 9.9% |
| 79 | Cincinnati, OH | 780 | -3.7% | 1,120 | 0.9% |
| 81 | Winston Salem, NC | 770 | 1.3% | 830 | -1.2% |
| 82 | Tallahassee, FL | 760 | 4.1% | 880 | 3.5% |
| 83 | Augusta, GA | 750 | 4.2% | 830 | 0.0% |
| 83 | Indianapolis, IN | 750 | 10.3% | 810 | 0.0% |
| 83 | Lexington, KY | 750 | -5.1% | 980 | 4.3% |
| 86 | Bakersfield, CA | 730 | -6.4% | 900 | 1.1% |
| 86 | Greensboro, NC | 730 | 0.0% | 850 | 1.2% |
| 86 | Memphis, TN | 730 | -1.4% | 810 | 3.8% |
| 89 | Albuquerque, NM | 700 | 7.7% | 850 | 1.2% |
| 89 | Columbus, OH | 700 | -10.3% | 1,100 | 3.8% |
| 91 | Oklahoma City, OK | 690 | -2.8% | 890 | 6.0% |
| 92 | Lincoln, NE | 670 | -8.2% | 890 | -7.3% |
| 93 | Tulsa, OK | 660 | 8.2% | 810 | 5.2% |
| 94 | El Paso, TX | 650 | 3.2% | 790 | 3.9% |
| 94 | Shreveport, LA | 650 | 1.6% | 700 | -5.4% |
| 94 | Tucson, AZ | 650 | 3.2% | 890 | 4.7% |
| 97 | Lubbock, TX | 630 | 5.0% | 800 | 2.6% |
| 98 | Detroit, MI | 610 | 1.7% | 690 | 0.0% |
| 98 | Wichita, KS | 610 | 0.0% | 750 | 0.0% |
| 100 | Akron, OH | 550 | -3.5% | 710 | -5.3% |
Seattle House prices fell year-over-year, as did New York and San Francisco Bay Area condo prices. Los Angeles, San Diego ticked up. Denver and Boston jumped to new highs. Las Vegas, Miami, Phoenix are aspiring to the crazy peaks of Housing Bubble 1. Read… The Most Splendid Housing Bubbles in America, July Update: Year-Over-Year Declines Spread to Seattle
Enjoy reading WOLF STREET and want to support it? You can donate. I appreciate it immensely. Click on the mug to find out how:

![]()
What is the government doing, if anything, to help. Please don’t tell me NYC rent control since that just pits landlords vs tenants.
What is the government doing, if anything, to help[?]
They’re keeping interest rates low so the real estate industry can blow bubbles and burst them profitably wherever they please. Fresh pastures, fresh harvests, all have their seasons.
As for renters, well, why shear the flocks when you can fleece them?
Please don’t tell me NYC rent control since that just pits landlords vs tenants.
Moneyed slumlords vs. tenement troglodytes, mopping up operations from the long-lost class war, which apparently continues only because it somehow has some residual nostalgic value for certain members of the patriciate. Those were the days. Still brings a tear to yer eye, don’t it?
Screw the cities,. If you can’t take a leak outside on your own property with your dogs running around barking and a shoulder on the smoker with neighbors liked minded you ain’t living.
Curious what “like minded neighbors” do for money now? Surely can’t be very many jobs around that pay enough, especially to raise kids? And a “smoker” for transport?
Anyway, grew up in such a place. Couldn’t afford a home there now, much less live there, unless a HS pal let me build a small cabin on his land. I would never “own it”. Gave it some thought and some talk years ago. But, I’m pat in my LIHTC senior apts, till rules on net wealth change, and I become part of “mopping up” operations Unamused described so well. Then I’m forced into “luxury” over 55 and net wealth is “mopped up” and rather quickly, and so much for helping nieces, nephew.
I’m also quite spoiled by the perfect weather, both here and up there, not very far away.
What do you suggest government should do?
Wouldn’t it be best it doesn’t try to ‘help’?
Rent control doesn’t remove scarcity, nor reduces demand.
Here is SoCa, they are building new apartments, my city has a state wide quota to meet. In Ca anyway government takes affordable housing seriously, and the rent control bill did not pass first time around, but that pattern is all too familiar.
They just announced a few new major apartment projects here. They’re over near the malls and business centers, so far from the outcry of NIMBYites. But I did notice in the “hills” (ie big fancy estates) signs on the road encouraging “vote no to zoning!”. How about we dispel the myth that apartments = crime. Not that those hills would ever see an apartment building, they’re probably upset at the idea of duplex townhomes encroaching their property.
Sorrynotsorry but if ya wanna live in crowded SoCal, ya gotta live next to someone! Or at least that’s how I’m a’votin!
If there is any sort of housing recession, the current supply could really depress rent prices. HUD took over an APT complex near me and it looks like a real improvement.
I am in awe … So many brand new mega apartment complexes are being built in Socal. They seem to fill up quickly. Just in awe. They are everywhere, especially around John Wayne airport.
Seems that old high density apartment buildings have more vacancy because of the this. The old apartment buildings seem to be taking on more undesirables better the better renters are abandoning old buildings for the new digs. I would be worried about owning a home near an old large apartment building … if you have one of those, sell sell sell before the crime wave wrecks your investment.
Ha, I don’t think a “crime wave” will be coming to Irvine (or any other OC city) any time soon. Even with *dun-dun-dun*….APARTMENTS aging and reducing rents.
people wanting to live with lower rents =/= criminals
But yeah, there are a ton of new developments in that area of OC. Mostly upper end of course. Anaheim and Santa Ana are also seeing considerably more luxury developments. Anytime I talk to Disney employees about it all, they are definitely feeling the pinch in rents. The last guy I talked to said he was moving his family of 5 to Phoenix.
Housing crisis coming to a city near you!
Like I used to tell Lasercraft management, “If you just have to display excess and leisure time, do it out of sight of the industrial shitworkers. That’s what your offices are for”.
I’m pretty sure by “undesirables” is meant anyone not white, anyone without a less than 5 years old car, anyone who comes home wearing overalls, etc.
Trust me, no actual undesirables are going to Irvine, and in fact i’m not sure those who choose to live there can be called desireables, as you have to leave your soul at the city line.
alex in San Jose AKA Digital Detroit
I lived in Irvine for a YEAR and I couldn’t take it. I needed more undesirables in my life.
SoCalJim – New supply will depress rental rates at the high and low end and eventually housing prices. Doesn’t matter if it is high end or low end. If you are sitting on big gains in SoCal or any other hot market, now is time to sell, sell, sell! As if the trade war and that lack of Chinese buyers enough reason to cash in.
Read the new rent tenant law just passed in NYC. Also many Manhattan one bedroom rents went up 6% or more.
I get red hot and ice cold, but WTF is Luke warm? Who or what is Luke?
He’s a Jedi. Still makes no sense, does it?
Well, after the last Jedi, Luke’s body ain’t warm any more. In fact, he doesn’t even have a body.
I missed that, too busy pondering charts? But South Park is on for a long time tonite, so I’ll re-read more carefully mañana.
At usual read speed, I can’t find Luke. Now I’m worried about even more senility.
A brand new apartment complex near me in the Portland burbs opened 5 months ago and based on my unscientific count of cars in the parking lot and street it is still barely 25% full, but they have not dropped the rents yet. They will have to soon.
Don’t get your hopes up. The owners needed the tax write-off. The renters they got are just gravy.
No more interruptions please. Joseph Cotten finally figured it out and Ingrid Bergman is about to tell off Charles Boyer.
Seneca’s Cliff, the asking rents may not have dropped but they are likely offering some nice incentives.
Call and ask, I’d be surprised if you couldn’t negotiate 1 Month’s “Free” rent with a 1 year lease.
Dropping the asking rent is the last resort, it’s the kind of thing that attracts the attention of lenders and investors…
Thanks. Between your and WR comment had “aha” moment. Big player games.
Tom Stone – My luxury building had to slash quoted rental rates 20% this year to find tenants. The analysis suggests only single digit drops in some cities, but if you drill down on the luxury segment, my guess is that rates are down double digits in most metro areas.
A luxury complex near me (in an affluent suburb of Phoenix) had 20% occupancy after 2 years. So in the last 2 months they dropped their asking rents by 1/3. Which means they are now competive, and will likely fill their apartments.
Their 1st floor retail space is a different matter. Still less than 10% occupancy.
There was an article last year in the Arizona Republic that said something like 90% of the new rentals being built in the Phoenix metro were luxury units. The complex across the street from my office in north Tempe starts at $1400/month for a 700 sf 1 bedroom. I’m guessing it’s mostly students at ASU, because I don’t know who would want to pay that much to live in such a run down area.
Senecas Cliff,
A lot of times, it’s better for a new project to keep units vacant rather than cut rents (though they might offer hefty one-time incentives that don’t reflect on rents) because the value of the new property is based on rental income: actual rents of those units that are rented and asking rents of vacant units. The asking rents may never be realized, but they are instrumental in the calculation. So if the developer is trying to sell the property, the last thing they’re going to do is cut rents.
But if the bank takes over the project, slashing rents to fill the units is the first thing the bank will do.
GREATEST overbuild in the history of…… since the last great overbuild, like just ten years ago here in Seattle.
During the last build/crash an insider here in Seattle, which historically has had terrible housing problems, told me there were 10,000 empty units in downtown Seattle ALONE. Most of those were condos, but having been in many of these student housing set ups that they call luxury apartments they have built now, I bet the number is more like 25,000.
See it’s still legal for real estate White Devils to tell you at the entrance to their brand new 875 unit building that they only have one and only one unit to show you.
If we had a true inventory of vacant housing here, the prices would collapse.
We sold our house in Morris County NJ in 6/2018 and moved to the BAY AREA . We rented a 2 bedroom apt in Pleasant Hill Ca for $2625 + ~75 (water) + $50 garbage. After 9 months we moved to Solano County and are paying $2,500 to rent a 2 br condo for $ 2,500 including water and garbage.
My impression is that the market for rentals has weakened slightly.
You’re new to the Bay Area but this is like comparing apples to oranges. So say you’re living in Benicia or Vacaville you’ve now added 30 mins to 1 hr to your commute plus $6 bridge toll.
Most people commute and rents are directly related to the number of bridges one needs to cross to get to work.
The Seattle Times disagrees with you regarding Seattle rental prices having dropped. According to the Times Seattle rents hit an all time record high in June and Seattle is now the most expensive market outside the state of California (yes, Seattle is now more expensive than NYC and DC according to the Times).
Two months of the year the climate here is nice but aside from that you won’t get much for your money. I suffer through 8 months to enjoy pleasant July and August but I wouldn’t pay $80/day for a place to put a bed and shower. I enjoy the money I earn and to be honest while I’m asleep and dreaming I don’t care about the accommodations. People without kids to raise, who piss their money away on overpriced housing, have only themselves to blame. Stop letting yourself get ripped off and take responsibility for your own financial well being.
The housing market is parasitic and predatory, no different then payday lenders, run, don’t walk away.
The Seattle Times author cited Census data. He didn’t say what Census data and didn’t link anything. But there isn’t a lot of choice.
1. The Census data is ENTIRELY different. It does not reflect asking rents, but what tenants are actually paying based on surveys of tenants (this includes factors like rent control in cities where it exists).
2. This data is VERY outdated. The last year for which this data is available is from the 2017 American Community Survey (ACS), published late last year. The 2018 survey will come out in September.
https://factfinder.census.gov/faces/nav/jsf/pages/community_facts.xhtml?src=bkmk
The moron at the Seattle Times who wrote this article conveniently failed to point this out because it didn’t fit his theme.
It’s amazing how the REIC shills have infested the local media and can twist facts to put out these headlines in the hope of supporting their fellow Liars, I mean Realtors(R).
Just like the nausea-inducing Boston Globe articles over the past week. “BuY nOw Or bE PriCEd oUT foREvER”
You have the title wrong. The boston globe title is:
“If you don’t already own a home in Massachusetts, it may be too late”
Never said that was the title, but that was the sentiment. Completely one-way journalism, might as well have had Anthony Lamacchia write it.
Profit motives have “infested” a lot more than even “well educated” realize. If it isn’t your particular specialty, you will most likely get screwed. Can’t know it all. Days of most everyone farming, and in on the Biz, are long gone. A nation of specialist “pieces/cogs” that have nothing in common to say to each other. But ya can talk sports, or whatever else media draws ya to.
“Efficiency of scale” rules! And Corporations are “people”!
And EVERYTHING is getting “better and better”….(albeit for fewer).
Scale of wars is way down historically, due to A-bomb. Peasants should thank Doc Oppenheimer instead of damning him. Because if those birds fly, even the rulers lose “game”.
Why am I suddenly thinking about Hesse, after writing this?
Census data is a poor basis to use for anything. Until the politicians force a true and complete counting of the population (which they will never do) it remains a false baseline.
Multiple news sources report Southern California racking up some of the biggest rent price increases in many years.
Just keep telling yourself that Jim….I think you should buy 10 more “investment” properties then!!!! What the heck you are doing here!!! BUY BUY BUY
Zumper just report this:
Los Angeles: The median rent for a one-bedroom apartment in Los Angeles, California increased by 11.9%.
Google that if you need more data.
SocalJim,
So I did this chart just for you because the other day, when the data came out, I didn’t have time. This is the labor force and employment data from the EDD. Because I’m in a hurry, I don’t have time to get all counties in Southern California, but I got four big ones and added them together. As you can see, there is a substantial out flux of labor force and jobs from the area, with the labor force now back to where it had been in August 2017. So I can see that this might have an impact on rents eventually, maybe not in the manner in which you think:
Your silly data is no match for his convincing anecdotes!
Don’t forget the Timbers’ Neighbor Home Price and Timbers’ Boss Home Price Indices, the most valuable data points we have.
And don’t forget the timbers index (which seems to exist entirely in your own head) was proven accurate and superior to Case Shill out of date data. You seem to selectively forget current Case Shill data exactly confirmed what I stated and threw pie in your embarrassed face.
*Case Shiller, named after Nobel-Prize winning Robert Shiller.
That would be the one that shows Boston’s price growth continuing it’s shrinking march toward near 0% YoY? The Timbers index told me we were going “to the moon Alice”.
There goes your selective memory again:
Wolf’s graphs of Boston home prices from his previous article clearly shows exactly precisely a bump in home prices, at exactly precisely the time timbers index said they they were rising, which you ridiculed as timbers index.
In other words Cash Shill recent data agreed with superior timbers index.
Perhaps you might actually read Wolf articles…for a change?
I hope there isn’t too much pie on that embarrassed face of yours.
sc7,
So, if you’re going to live and die by Case-Shill and reject empirical facts in front of you at the time, at least use the most current data (which confirms the superior timbers index culled form facts in front of timbers face).
Selectively picking old data to show a predetermined out come is…well you figure it out.
As Wolf’s graphs of Case-Shill clearly show, Boston area prices are at all time highs due to sharp upturn in prices at the time the timbers index said it was happening.
Wold even labeled it Bubble 2.
So…with all that pie on your face, which old data sets are you going to use next?
Okay, first, I’m only having a little fun with you about the Timbers index…
But I never said prices aren’t at an all-time high. They are, Case Shiller shows that to be true and it is the go-to for home price indexing. Because it is a moving average, it is slower to respond to changes in the market, but the data it presents is not fake or inaccurate.
When I am talking about Boston area housing trends, I am talking about the rate of price growth, which, as @Wolf points out in his post a few days ago, the rate of YoY growth continues to decelerate. The “jump” in the graph happens at this point every year (as the chart posted is not seasonally adjusted, you can get the SA version on STL FRED), and this year, the jump is the smallest it has been in many years. This seasonal uptick in pricing happens every year, in short because inventory in Boston is never enough for Spring demand, but that demand seems to completely evaporate by the fall. There was an interesting article that showed how some markets are much more seasonal than others (the southeast, for instance, has a much longer active period). You can save 5-10% on market prices in Boston by buying in the middle of one of our dreadful winters, I’ve gotten incredible deals that way. My best investment was a purchase I made in the great blizzard of 2015.
Another set of data from Redfin shows that bidding wars have all but disappeared in Boston, going from over 2/3 of homes in 2018 to now just over 1/8th. The market in Boston is still hot, but is noticeably cooling, even in the face of rates ~100bp lower than this time last year. If rates had remained flat from this time last year (4.75), Boston would almost have assuredly seen flat to negative price growth. That shows just how cooked this market will be when any one chip (interest rates, unemployment) falls out.
I think we agree on more than you think we do, since we both seem to agree this is Bubble 2.0.
I was in Boston for a month … late May to late June. I put a house back up for rent. I was overrun with people who wanted to make offers to buy the place. They outnumbered people who wanted to rent it. I did the right thing and rented it to a single mom with two kids. I just hope they can make the rent … I could have gotten more rent from others … keeping my fingers crossed.
sc7,
Thank you.
However, I disagree with you that the sharp reversal in Boston real estate prices are due to seasonality.
Instead, I suggest they are more to do with the Fed’s U-Turn in Dec. And the graph aligns with Dec closely as being the beginning of an abrupt turn upwards.
Looking at Wolf’s graph which is based on CS, I for one am unable to see how Boston real estate is falling in anyway since Dec. I see only a sharp almost abrupt turn upward to record highs.
I said at the time (several months ago) that I did not agree with CS conclusion that Boston prices were falling, because my eyes saw too many instances of the rather dramatic examples of the exact opposite amongst friends, associates, and neighbors.
timbers,
You said: “However, I disagree with you that the sharp reversal in Boston real estate prices are due to seasonality. Instead, I suggest they are more to do with the Fed’s U-Turn in Dec. And the graph aligns with Dec closely as being the beginning of an abrupt turn upwards.”
So here is the data.
Seasonally, Mays are normally great in Boston. But this year, the 0.5% increase of the Case-Shiller index in May from April was the smallest increase in May from April in any year since the Housing Bust. The data below shows the increases for May from April for each year. Nothing to do with the Fed’s “U-turn” or whatever… just a weakening of the Boston housing market, pure and simple:
2010: 1.6%
2011: 2.6%
2012: 2.4%
2013: 1.7%
2014: 1.1%
2015: 1.6%
2016: 1.4%
2017: 0.7%
2018: 0.8%
2019: 0.5%
@timbers
I definitely agree the fed reversal is a part of it. When mortgage rates were hitting 5% in the fall, the market looked dreadful. Things definitely popped up in March when rates had fallen to 4% or even a touch lower, I sold a property I no longer wanted and got multiple offers above asking. Wasn’t even in a great town.
I think the word “slowing” is better used to describe the market. Bidding wars are less frequent and the YoY gains are slowing. Nothing will fall here unless rates go up (unlikely), or the next recession when unemployment ticks up and kills some demand. There’s also the wildcard of foreign investors selling off in volume that could have a small impact if it happens.
You can definitely see a sharp uptick every April/May/June each year, though. There’s definitely a seasonal effect.
@socaljim
It would be good to know if your property was in boston proper. That’s a whole different equation than the suburbs where some of the stalling is happening.
An another note, I have a bad feeling about the Fed recently.
It seems like Powell has lost control of the Fed. Targeting asset bubbles has completely disappeared from policy considerations (except maybe Boston Fed member). Everything has shifted to…how can the Fed mitigate bad policy?…and the answer is always by making savers and retirees pay for bad policy choices, as if those extremely wealthy corporations in the actual business affected by bad policy must never, ever be allowed to pay any price for bad policy not even one single cent.
sc7….never the less, if you look at the CS graph in Wolf’s previous article, it clearly shows a sharp substantial all time high Boston area real estate prices which includes all the things you mentioned. No matter how you slice & dice it the fact is CS exactly confirmed what I said – Boston prices where going up, not down.
I will take a look at this …
What is the correlation between new housing sales and rental prices?
Can rental prices help spot housing top and start of a slow down?
Rents seem to be stickier than house prices….or should I say they do drop as much?
In 2008 the market price of my rental dropped from 78k to $45k yet I only had to drop my rent from $650 to $600.
Thus the house dropped 42% yet rent dropped about 9%.
I meant rents don’t drop as much
They did in all of Alberta, Canada from 2014 to 2019. Home and condo prices fell about 20 percent. Rents fell the same amount about 20 percent non-inflation adjusted.
For me between 2007 and 2012 price went from 320k to 125k and rent went from 2100 to 1400, so 61% versus 33%
Perhaps the rental market was supported by all the people flushed out of bad mortgages — had to live somewhere.
When 2008 started, I had to drop rents. By 2010, so many people had walked away from homes that the rental demand surged, and rents took off. I was looking at these people … so many walked away from a home even though they never lost their job … I wanted nothing to do with them … I told them no rental from me. If they stiffed their mortgage company while they had a job, they would stiff me. Turned out that was the dumbest financial move they every made … walking away from a house in the middle of a financial panic.
Maybe, maybe not. Consider if they had some cash in the bank, 0% down on their interest-only mortgage, and during that time the IRS had suspended the rule that mortgage debt forgiveness is considered taxable income. It was a chance to dump the debt scott-free. The only thing they lost was their monthly payment which perhaps could retroactively be considered the same as renting.
I don’t fault them on moral grounds. You really think that if a bank could legally walk away from a bad investment with no repercussions, it wouldn’t because moral considerations? Of course not.
Now if their old houses are today worth twice what they owed, then yeah walking away wasn’t the smartest move.
Please continue to never ever refer the big pink elephant in the room – BAILOUTS – while mocking those who walked away from their mortgages.
10 or so years ago a poster Mish’s site had a twist on this. Not only not pay the mortgage to the TBTF Bailout Beauty, but also take out the maximum HELOC right before. If I was the prospective landlord I would have no trouble with that; just pay 12 months rent in advance, no concern about security deposit. I wouldn’t cry for the TBTFs, as they created the money out of thin air. Oh, Mish encouraged the guy to do it !
Shiloh1, the law limits how much you can take when the lease starts. While the amount varies from state to state, in general, you are looking at first, last, and 1mo security for an unfurnished place. 12months up front is a landlords dream, but it is against the law.
Still trying to wrap my head around a interest rate cut during ATHs in the stock market, housing prices while we are at a 50 year low in unemployment and wages are rising.
My cynical side says they gave in to Trump’s pressure campaign because they don’t want him to succeed in pinning the blame on them for the next downturn.
With tariffs on China supposedly increasing August 1st interest rates should be increasing as inflation in America picks up. Higher inflation and lower interest rates will certainly wipe the middle class out a lot faster. I don’t see wages gains increasing anywhere near the true inflation rate.
ru82:
I suspect that even with the stock markets’ ATH’s that there is going to be a much more “slowdown” in the economy by late 2020. That coupled with so much “marginal paper” circulating involved in so many financial deals any further decline in the economy will dictate the “refinancing” of that paper and lower interest rates will be accommodating. We witnessed what would happen when the FED raised the interest rates in a small way last December; the “markets” tanked. That is how fragile our basics are now.
For me the stats and article show just one thing. Having to pay these obscene rents indicates one of the final death spikes for any chance of regular working folks sharing the “Dream”. How is anyone supposed to get ahead paying 20-30K plus expenses, per year, off your net? Not everyone works in a high tech cubicle with stock options.
From the man who invented Trickle Down: “America is a shining city upon a hill whose beacon light guides freedom-loving people everywhere”.
Forgot to add: ….”and where the cost of renting, healthcare, and credit card interest rates ensures the fate of millions will remain forever in servitude”.
A little dated, but even more appropriate:
“It’s not just low-income Americans who struggle to pay their rent every month, or find an affordable place to live when they move. New research from Harvard says that even renters with annual incomes of $45,000 face unaffordable rents in many cities, with potentially far-reaching effects.”
https://www.nbcnews.com/business/economy/its-not-just-poor-who-cant-make-rent-n478501
Just like the hilarious Gerald Celente on YT calls it “slavelandia”.
If I remember right, some wise ass s-disturber like maybe Will Rodgers usually gets credit for “Trickle Down”. No Biggie. “Horse and Sparrow” was used quite openly in Gilded Age, with exact same meaning, just like (gag, choke,”NOBEL”) winner Uncle Milty F’s “supply side econ”. Moron # 1 Ronnie just did as told, he acted, and seemed overjoyed to no longer be “B” rated actor, ex-Union man (double loser), but finally a real All American WINNER! (of course on behalf of the people)
Anyway, thoroughly enjoyed the entire human shelter investor debate, and do let me know when y’all get to dine with bigger league Kushners, Trumps, or maybe even the much bigger “winners” on our little ball in space.
There is an effect to all this…
Look at Deutsche Bank as an example…
Several weeks ago they come out with a truly massive round of layoffs. The internets were plastered with pictures of highly-paid financial workers in NY, London and Hong Kong carrying out boxes and clutching onto their “separation envelopes”.
In the meantime, no layoffs announced so far at their huge Jacksonville, FL offices. In fact, they have a slew of wanted jobs there still posted.
I have no doubt that the fact that, as per the chart above, rents in Jacksonville are less than a third what they are in NYC goes a long way in explaining how the layoffs are playing out geographically-wise.
Baltimore is -15%. Which is weird since the MSM have assured me Baltimore is the most amazing city in the world.
Was only there at bus station on way to DC in 67-68, so I can’t help you solve your dilemma. Hope you have other sources of info to help you.
Central Banks world wide are inflating their currencies to oblivion, it’s a simple as that (albeit the effects are complicated). It’s happened in the past, even when the currency was PMs, such as gold, and it’s happening again now. You may not believe it but then I doubt most Roman Soldiers did either, until it was too late. Centralised control is proving itself to be unreliable, untrustworthy. Not just CBs but governments too. So, it’s just as well some, in fact many, are working on plan B ;-)
It might be interesting to see single-family and multi-family permit data as an overlay on future housing bubble bar graphs. While not directly related to price/rent inflation/declines it would provide other insights.
For example, dozens of 200-400 unit multi-family projects are under construction in Greater Dallas with more already approved, funded and ready to break ground. The developers used pro forma rent projections based on data now two to four years old – typical planning time for apartment design, financing, permitting and construction. With YOY declines in rent showing up and you just poured the first slab on a two year project…
And, (hypothetical) 57% of annual sales of regional building materials company “X” are made for new construction of residential housing. The largest home-builder customer starts half the number of homes YOY…
I know these things happen every bubble bust cycle but it’s nice to look ahead.