Chicago, Dallas-Fort Worth, Atlanta, Minneapolis, Charlotte, Detroit, Cleveland.
In the 20 US housing markets covered by the CoreLogic Case-Shiller Home Price Index, there are some that form “The Most Splendid Housing Bubbles in America.” And there are some where home prices have not yet reached these splendid levels, or never experienced Housing Bubble 1 and are still crushed, or skipped Housing Bubble 1 and Housing Bust 1 but are now fully embroiled in Housing Bubble 2. So here we go.
Chicago:
Single-family house prices in the vast and diverse Chicago metro ticked up 0.6% in March from February, according to the CoreLogic Case-Shiller Home Price Index released on Tuesday. This was only about half of the seasonal gain in March last year of 1.1%, a phenomenon also seen in the Most Splendid Housing Bubbles, where seasonal gains in March were a lot weaker than in March last year. This whittled down the year-over-year gain to just 1.8%:
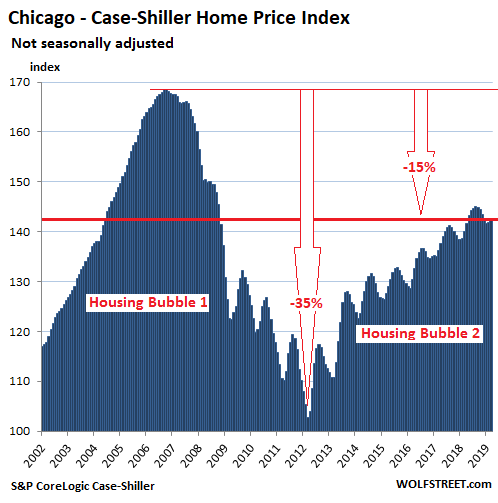
Chicago has had a steamy Housing Bubble 1. The Core-Logic Case-Shiller Home Price Index was set at 100 for January 2000 for all cities it covers; Chicago’s index value of 169 in July 2006 means single-family house prices have soared 69% in the six-and-a-half years from January 2000. Then the market crashed, with the index for houses plunging 35%. Since then, prices have risen, but are still 15% below their crazy levels of 2006.
The index is a rolling three-month average; yesterday’s release tracks closings that were entered into public records in January, February, and March.
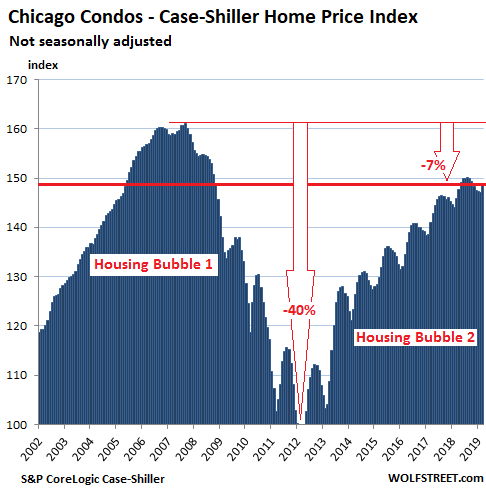
Condo prices are more volatile than houses, plunging faster and more deeply than house prices, and if lucky, rising faster than house prices. In Chicago’s case, condo prices plunged 40% during Housing Bust 1, according to Case-Shiller data. Since then, they have surged but remain 7% below the crazy peak of Housing Bubble 1.
In March, Chicago condo prices rose 1.2% from February, same seasonal increase as in March last year. This left the year-over-year increase steady at 2.1%:
The charts on this list are all on the same scale with the vertical axis of the Case-Shiller values ranging from 100 to 175. This fits Chicago’s Housing Bubble 1 and shows the remaining charts on this list in the same light – including Detroit’s and Cleveland’s, with chilling effects. The only exception is the Dallas-Fort Worth metro, whose price surges have shot beyond that upper limit.
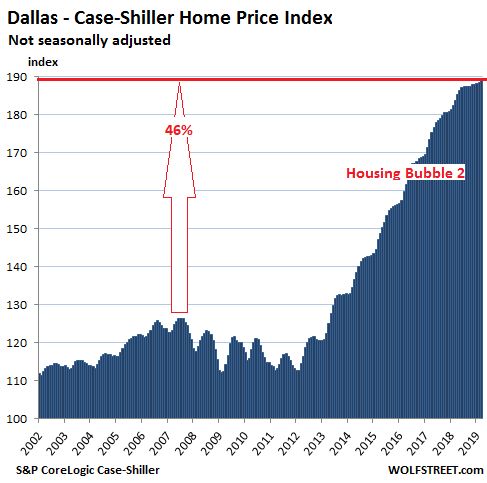
Dallas-Fort Worth:
The Dallas-Fort Worth metro skipped most of Housing Bubble 1 to the great frustration of homeowners and speculators in the area, and then it skipped most of Housing Bust 1, but then it made up for it. From the prior peak in June 2007, the Case-Shiller Home Price Index has surged 49%, in relentless up-moves – though those moves started to slow mid-2018. In March, the index ticked up 0.3% from February, less than half the seasonal uptick in March last year of 0.7%. This trimmed down the year-over-year gain to 3.0%, the slowest since April 2012:
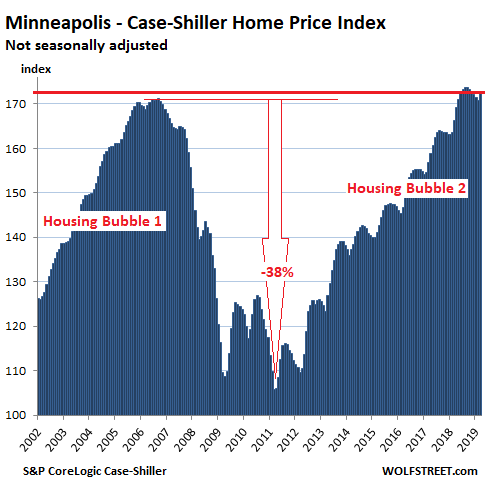
Minneapolis:
The Case-Shiller index for the Minneapolis metro rose 1.1% in March from February, also less than the seasonal gain in March last year of 1.7%. This whittled down the year-over-year gain to 3.7%, the slowest since September 2015 (it was 6.1% in March last year). In June 2018, the index had first surpassed its prior peak of September 2006. The chart is on the same scale as Chicago’s:
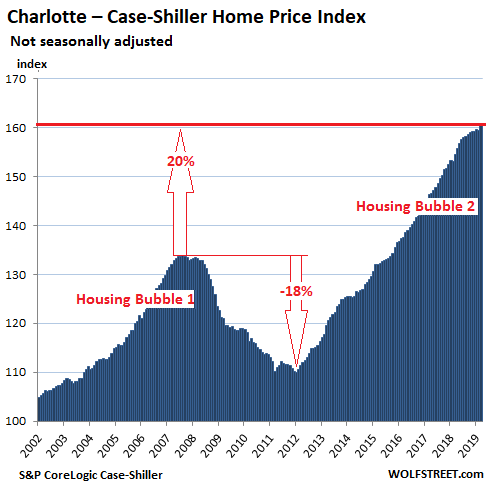
Charlotte:
House prices in the Charlotte metro rose 0.8% in March, to a new record, according to the Case-Shiller index, but that gain too was smaller than the seasonal gain in March last year of 1.0%, which trimmed down the year-over-year gain to 4.0%, the slowest since February 2016:
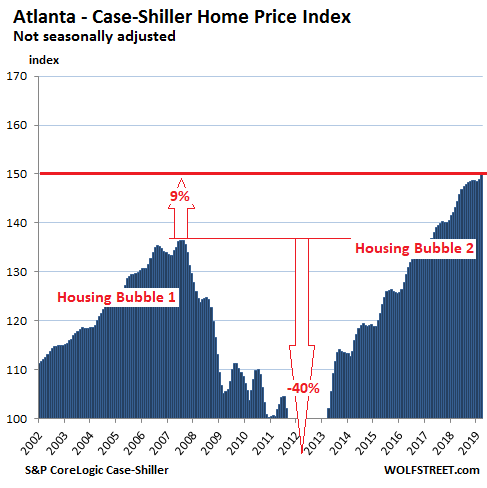
Atlanta:
In the Atlanta metro, home prices rose 0.7% in March from February to a new high, but that gain that too was below the seasonal gain in March last year of 0.8%. This trimmed down the year-over-year gain in March to 4.7%, the slowest since April 2012.
The chart for Atlanta’s index is on the same scale as Chicago’s. Note the larger amount of white space, and the 40% plunge to levels not seen since 1996, bottoming out at 82.5 in March 2012. Prices have shot higher since then, with the index at nearly 150 in March, indicating that prices have risen 50% since January 2000:
Detroit:
House prices the Detroit metro ticked up 0.4% in March from February, less than half the seasonal gain in March last year of 1.0%. This trimmed down the year-over-year gain to 3.3%, the thinnest since January 2015 (in March last year, the year-over-year gain was 7.7%). The index remains 3% below its record in December 2005. The chart is on the same scale as Chicago’s:
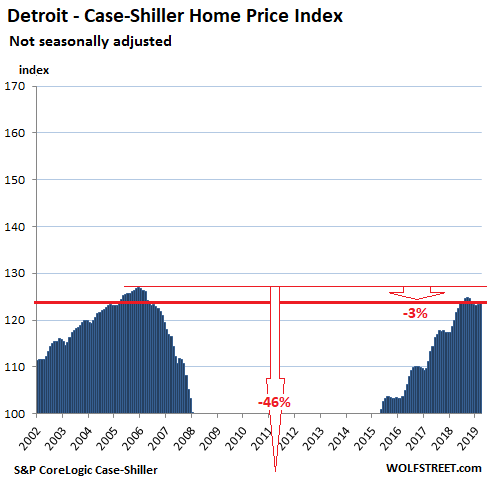
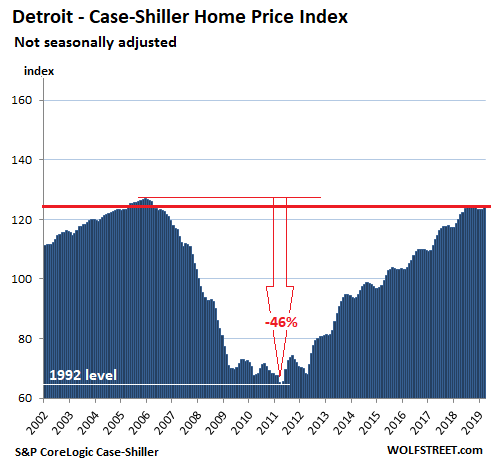
During Housing Bust 1, which coincided with Detroit’s relentless process toward bankruptcy, the Case-Shiller index plunged 46% to levels not seen since 1992, proving that even a weak housing market can get a lot weaker. From the low point in April 2011, the index has surged 92%, but it has still not set a new record. The chart below puts Detroit’s housing market on a scale of its own:
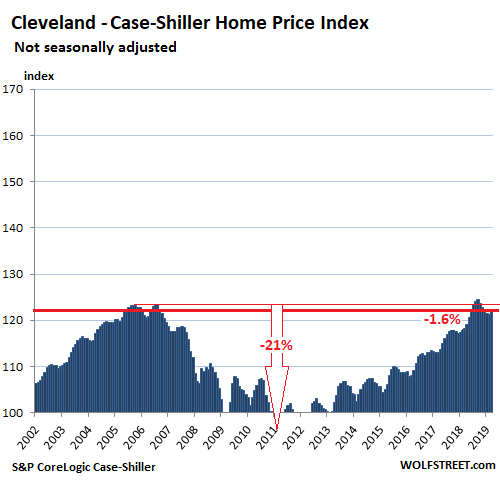
Cleveland:
In the Cleveland metro, the weakest housing market in the 20-City Case-Shiller index, house prices rose 0.9% in March from February, and 3.5% year-over-year, but remain 1.7% below June 2018; and 1.6% below their previous peak in 2006.
With an index value of 122.3, the index indicates that home prices have risen 22.3% since January 2000. The national Housing Bubble 1, the national Housing Bust 1, and the national Housing Bubble 2 have left skid marks on Cleveland though home prices in Cleveland are far from being in any kind of bubble. The chart is on the same scale as Chicago’s:
The Case-Shiller methodology is based on “sales pairs,” tracking the sales price of a house in the current month to the prior transaction of the same house. The index in effect tracks how many more (or fewer) dollars it takes to buy the same house, and thus it tracks the purchasing power of the dollar with regards to houses. When a house doubles in price, it didn’t get twice as big. It just got older. What changed was the purchasing power of the dollar with regards to that house. In other words, these charts are a measure of house-price inflation.
In New York, San Francisco, SoCal, and Seattle year-over-year home price gains shrink to near zero. Las Vegas is flat for 6th month in a row. Miami & Phoenix eke out post-Housing Bust highs. Read… The Most Splendid Housing Bubbles in America: Seasonal Upticks Too Small
Enjoy reading WOLF STREET and want to support it? You can donate. I appreciate it immensely. Click on the mug to find out how:

![]()
Would it be possible for you to publish all of these splendid and less splendid bubbles charts inflation adjusted (net of housing, of course)?
The dollar has lost a fair amount of value since 2002, and it will help us judge the relative size of the bubbles…
I don’t know how many millions of times I have to repeat this: These charts ARE an index of inflation, namely home price inflation, because the Case-Shiller tracks the price of the same house as it’s sold over time. These charts ARE a measure of the purchasing power of the dollar. That’s really all they are.
It’s senseless to adjust consumer price inflation for home price inflation, or vice versa. Just get used to it: a house didn’t get twice as big when it doubles in price. It just got older. What changed is the purchasing power of the dollar with regards to home prices.
Nonetheless knowing how much of the inflation of home prices is related to the overall decrease of what a dollar will buy is useful. Which may explain why case shiller publishes those numbers.
Here yo go. Another great blog:
https://www.calculatedriskblog.com/2019/05/real-house-prices-and-price-to-rent.html?m=1
ceewilly,
There is always somebody who has to post a link to a chart that throws the very different housing markets of Dallas, Miami, Detroit, Cleveland, etc. into one bucket, averages them out, and then reduces the result by the price increases in health care, tuition, TVs, cars, and haircuts, to show that there is no housing bubble in San Francisco.
This is nuts.
I spend all this time show with two dozen charts, spread over two articles, how there is NO national housing market, only local housing markets, and how vastly they differ – for example, Miami’s huge Housing Bubble 1 v. Dallas, which skipped Housing Bubble 1 v. Cleveland.
Then I explain how home-price changes are a form of inflation, namely “home price inflation,” meaning the loss of purchasing power of the dollar.
And then there’s you, who skips all this, and insists on obscuring the loss of purchasing power of the dollar with regards to homes in a local market by home price changes in other very different markets, and then reduce the result mathematically by unrelated price changes of health care, etc. (consumer price inflation).
The type of chart you linked – and all charts like it – is designed from get-go to jumble together unrelated data with the purpose of misinforming. It’s the often cited, mechanically produced, logical-sounding basic math on a spreadsheet that is easy to do but that pollutes your thinking.
If you want to check “affordability,” use local household incomes and local home prices — that makes sense because it tells you how local home prices relate to local incomes and whether they’re “affordable” or not.
Jonas has a good point. What is the “real” increase in value vs. the “nominal” increase in value? Yes, house price inflation is baked in, but how much does it exceed the general inflation (CPI) as b.s.-laden as it is? In other words, was investing in a house better than gold, or stocks, a pair of pajamas or bonds over that period?
Your point that the house is basically unchanged, or better, should have lost value (through depreciation of the house as a physical asset), but has instead increased in value is true. You’re also right that the price has “inflated”. But how much greater has it inflated vs. the CPI…
In regards to wolf’s rant on my link….Wow this guy is very defensive. Need some tissues? Diapers?
I find both local and national data useful, along with cpi adjusted and nominal. Shoot me.
Not arguing with the overall point Wolf makes sense. It did get older, but could have also gotten more scarce (valuable) based on population increase vs supply, particularly in city cores, no? Does that matter in the inflation question? Not a rhetorical question genuine ask.
Rory,
For a different perspective, “affordability” I think is a good measure. This tracks household incomes, mortgage rates and other costs, and home prices — all specific to the particular market.
The three main variables are incomes, mortgage rates, and home prices. And they can move in different directions. For example, dropping mortgage rates increase “affordability.” But they tend to push home prices which then decreases affordability.
The California Association of Realtors releases quarterly data on affordability per county. San Francisco is by far the least affordable county in CA. During Housing Bust 1, it become more affordable, but was still an outlier.
Alleluia and pass the ketchup. New Zealand Realestate Institute has finally admitted NZ is now a BUYERS market. This comes DESPITE the second highest year of immigration.
I sold my house 18 months ago and have been regularly attending auctions watching as not one single sale occurred at auction. However the agents assured us this was just a blip.
Four days ago, at opens homes, two agents, at different properties, told us it is now a buyers market. Then the Realeatate institute went public to say the same.
Makes you wonder if word had come down from head office that not enough money is coming in so time to flip from the side of the seller to the side of the buyer. Amazing what happens when it starts to hurt the companies bottom line.
Now we are seeing regular articles about falling house prices. I know personally from two friends that their bank mortgage pre approvals have been terminated. Banks now require more deposit and PROOF the purchaser can pay even if rates rise to 6%. No more relying on the ever increasing value of the property.
I have just read an article here that the NZ Treasury (like US FED) is very concerned about the indebtedness of NZ farmers. They want to bring in a system of mandatory negotiations between the banks and indebted farmers before the bank can fore close. This is worrying lenders who may not be able to recoup their investment.
Also interesting to read that house prices in Hong Kong are falling for the first time since 2009. Have we reached an inflection point where people have realized that you actually have to pay off your mortgage not rely on the value of your house rising to get you out of debt.
Times are about to get very interesting. All this as our economy is slowing a lot faster than predicted.
Flying Kiwi….I’m an ex-pat kiwi in the US and look at friends and family back there and the ridiculous prices they have paid for their homes. I tell them they are crazy….but everyone has been in on the property bubble there.
>I know personally from two friends that their bank mortgage pre approvals have been terminated.
I’ve been hearing similarly lately. Apparently the gap between signed contracts and actual closings has widened significantly, too. Suggesting many fail to secure financing. I know I’ve seen an unusual number of homes coming back on market near me.
Any reason why Dallas skipped Housing Bubble 1? Lack of scarcity? (but that didn’t affect Atlanta or Charlotte)
I would say “JOBS”.
Back in housing bubble 1, Texas had banking restrictions that are no longer in place. There was a cap on home equity loans which curbed speculation. Imo this policy is the key as to why Texas escaped the 2007 bubble but will not this time around.
Home equity loans in Texas are limited to a maximum of 80% and you can only have 1 at a time.
Rowen,
Dallas is not alone. There are many cities that skipped Housing Bubble 1. The Case Shiller only covers 20 cities. Houston also skipped Housing Bubble 1. But Houston is not in the Case Shiller data because there were problems in getting public records of transactions (this is a whole story of its own, that one of the largest housing markets in the US is not in the Case Shiller index).
This doesn’t answer your question. But it broadens it: Why did some markets have Housing Bubble 1, but others didn’t?
Housing Bubble took place outside of Dallas such as Frisco, Plano, McKinney.
Dallas has relatively unconstrained ability to build whereas a lot of other metro areas are pretty fenced in. The city just keeps growing outward and unlike in many other metro areas, jobs are still strong in the outer rings. This keeps the price down since more can always be built.
I think the generational memory of the late 80’s Savings & Loan scandal and subsequent real estate crash is finally gone.
Amazed that Chicago is not only holding up housing prices but keeps chugging along into housing bubble 2 territory.
Don’t know how they do it.
The place is a perfect storm of insane public unions, ever increasing taxes, rampant crime, bankruptcy, mass exodus of businesses/producers, socialistic regulations/laws and crumbling infrastructure.
Yet according to the Bureau of Labor Statistics, the Chicago metropolitan area has had “…over the year employment increases each month since October 2010.” Even more amazing, between 9.5 & 9.9 million people live there, the 3rd biggest metro area in the country. But it still has a lower crime rate than Indianapolis or Kansas City. And a mere 400 or so major corporations are headquartered there. A diverse economy with a vast public transportation system too.
Yes, a total mystery.
2Banana doesn’t let facts interfere with the conviction that blue states are socialist havens where everything is teetering on collapse, like Venezuela. Ideology ueber alles.
Illinois is an unmitigated disaster, which is why it is one of the few states to *lose* population since 2010.
That said, just because a state is blue (or red) does not make it “teetering on the verge of collapse.”
A city of Chicago’s size should have seen vastly greater home price appreciation. The fact that it has not speaks volumes.
The average person hasn’t thought through the pension and budget crisis in Illinois. I read a legislator there is now proposing a wealth tax to help fill the void. Last year, I heard of a proposed “one-time” RE tax that would be levied in addition to the regular RE tax. Income tax rates, of course, all always going up there.
I seem to recall hearing that the average taxpaying household in Chicago has almost $200k of pension underfunding to pay for in the future.
I know of one wealthy couple that moved from Chicago to Texas to avoid the high taxes.
However, I’m not sure the tax burden in Chicago will be much worse than LA or New York. They all have various budget issues on the horizon.
Yes, a one time RE tax is all they need…….really.
I lived just outside Chicago in 2013, and I walked all over the city. I thought the infrastructure was pretty good overall, the trains, the overall beauty of the area, etc.
What puzzles me are the prices in my current location in Van Nuys (Los Angeles). The infrastructure here is terrible, the area is downright ugly – tent cities, graffiti, high traffic, lack of landscaping, dysfunctional mass transit, etc – with sky high rents that have been climbing at a fast clip for years.
I would argue that both areas are terrible long term investments for housing though, as property taxes are sure to rise in order to bail out the pension funds after yet another decade of low interest rates causes them to woefully underperform.
Its pretty obvious – a plethora of stupid people who have all bought into the giant ponziesque fantasy. I lived in CA through Bubble 1 and am in Hawaii now. Every blue state is packed full of dim bulbs who would never question the authoritarian mindset that is political – and economic – correctness. If they all agree/believe that one can “earn” a massive pension printed out of thin air after a mere 20 years of pushing paper in a less than mediocre fashion, buying into all the other lies is a piece of cake!
The population of Madison county NC is less today than in 1940. In 1940 there was one sheriff and two deputies. Today there are 50+’ and armed to the teeth. Public education complex,also bloated. The point of this relative to housing bubbles are the taxes per unit to support it all. If housing goes bust it’s good night Irene . Currency de-basement has been a double whammy to add to the inability of the young to form households . Going bust is their only terrible hope.For the record Hillbillies don’t do crime sprees., We will shoot one our relatives every now and then.
Nice perspective on government bloat thru the past few decades…same here in Vermont, unfortunately.
Bonnie and Clyde?
Bonnie and Clyde were from Texas thus flat pan billies .Hillbillies nest in areas greater than 1000 ft in elevation and can be found from Maine to Georgia along the spine of Appalachia. We forage on such things as greasy or greasy back beans.Also known for our humor and good nature.
Same trend toward school bloat in Appalachian WV, with stable population, same as NC.
Dr. Doom
Gave me a giggle with the “….Good Night Irene” part!! When out partying we sang that song into oblivion! That’s sure to date you (and me of course)……..”Currency debasement” seems to be the path of all croaking republics…..sooner or later.
The future appears bad for some real estate markets.
Manufactured homes may be built for half the price of slab built homes. There are millions of acres of undeveloped land. People may move in together to reduce expenses.
regarding: “Manufactured homes may be built for half the price of slab built homes.”
This isn’t really correct. Sure, a person can buy a clapped out single-wide mobile for next to nothing, but properly manufactured new modular homes are not cheaper. By the time you build the required ‘code’ foundation for the modular, install the building and roof the structure, and then fix the deficencies, plumbing, electrical, the cost is damn near the same. There are always things wrong with factory homes. Always. Plus, they end up leaking and are full of cheap materials.
The best deal out there is to stay small and simple in design, keep away from the big construction companies, watch the ‘extras’ and add-ons/changes, and avoid the bling. Always wire in 200 amp service for the eventual add on, shop, or Tesla charging station. :-)
The best best deal out there for building is find a retired or close to retired reputable carpenter, and pay cash. This excludes everyone who needs a mortgage because the banks won’t go for it.
As a retired carpenter I just turned down two big projects today. 4 months work, anyway. Cash. I had to look the other way and shuffle my feet while pretending not to hear. I did pass on a name or two, though.
Yes, there are millions of acres of undeveloped land but there are also zoning restrictions and code stipulations in most places. The days of building whatever wherever are pretty much long gone unless you live in a specific non-zoning jurisdiction, (like I do). I just got my property tax assesment today for a 1400 sq ft home, 140′ riverfront (high bank), with a shop, greenhouse, family pub, carport, etc and it came to $940. We have a well and septic system. Oh, house is built to code 20 years back. 50 miles away, in town, my taxes would be $6-8K. Some places mentioned on WS 20K+.
Plus, to live rural you still have to make a living, and that requires a different skill set most folks have never even heard of. Making a living somewhere comes before the housing options.
regards
On one side you support the socialist Cancuck tax structure that “spreads” the wealth, then on the other you admit to working around the system in “cash” to benefit yourself. You’re avoiding your share of the system you purport to support? Why? Because down deep you realize the state has grown so large that it is intrusive and destructive to wealth creation. Yes you’re figuring out a way to use some parts while avoiding others.
Ame here, in Appalachia. Not the least bit ashamed of it.
That’s quite common up here in Canada, and especially in BC. Lots of Lower Mainlanders driving to the US to fill up their tanks rather than pay the high fuel taxes in Canada, but those same people will also happily tell you why Canada is superior because of our “universal healthcare and strong social safety net”, and how it’s totally worth paying more taxes to support those things. Even better when someone else has to pay the tax.
I can’t wait for the next crash, wan’t to buy a home for a decent price again, like 2009
As usual, RE is all about, location, location, location.
As usual, Nicko2’s comments are redundant, redundant, redundant.
Be fab if you could harness your analytical firepower to dissect European cities on same basis as above.
Did some of it for Spain just the other day:
https://wolfstreet.com/2019/05/27/whats-happening-to-spains-imploded-housing-bubble-1-housing-bubble-2/
Most cities are following the same pattern as they have every year. Up a lot then own a little then up a lot then down a little, and so on. Every time the “down a little” happens, bears start high fiving themselves. Looks like we’re ready to do the “up a lot” part again.
In my little neck of the woods, a house was listed for sale a couple of streets away from me. Went under contract in less than 48 hours. It’s smaller than my house, also backs onto a fairly busy road and the asking price was 50% more than what I paid for my house 3 years ago. If this is a sign of a crashing market, I want nothing but crashes from here to eternity.