Core Services CPI produced 2nd outlier. In the past, after two outliers in this very volatile data, the next move was a U-turn.
By Wolf Richter for WOLF STREET.
The Consumer Price Index for June, on a month-to-month basis, was pushed down by plunging gasoline prices, the continued historic plunge in prices of durable goods, led by used vehicles, nearly-flat food-at-home prices, and “core services” prices that rose at the smallest pace since the summer of 2021 in what looks like an outlier move of which we have seen already many in both directions.
On a year-over-year basis, in summary:
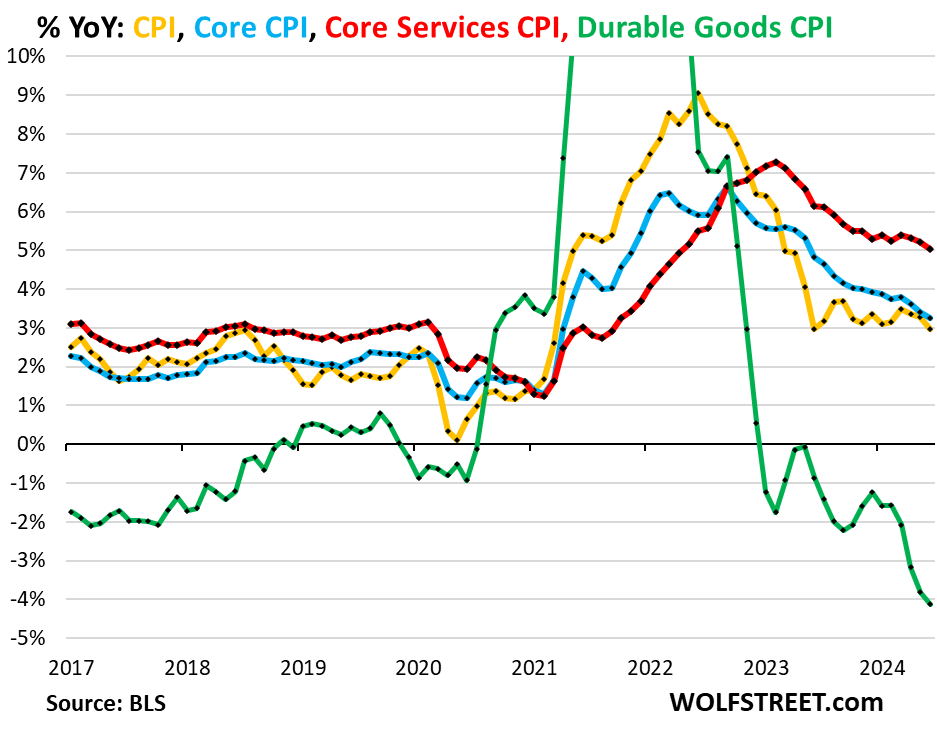
Core services CPI (red line in the chart above) increased by 5.0% year-over-year in June, according to the Bureau of Labor Statistics today. It has been just above 5% since December 2023 (5.3%) and accounts for nearly 65% of total CPI. It includes all services except energy services.
Durable goods CPI (green) has been falling since mid-2022, led by the plunge in used-vehicle prices, and now the decline in new vehicle prices, along with price drops across other durable goods, such as consumer electronics and furniture. In June, durable goods CPI fell by 4.1% year-over-year, the biggest drop since 2003 – unwinding part of the massive spike during the pandemic.
Core CPI (blue), which excludes food and energy, rose by 3.3% year-over-year, continuing its deceleration, slowed by the historic plunge in durable goods prices.
Overall CPI (yellow) rose by 3.0% year-over-year. It has been in the same narrow range since June 2023 when it also rose by 3.0%. (On a month-to-month basis, CPI dipped 0.06%.)
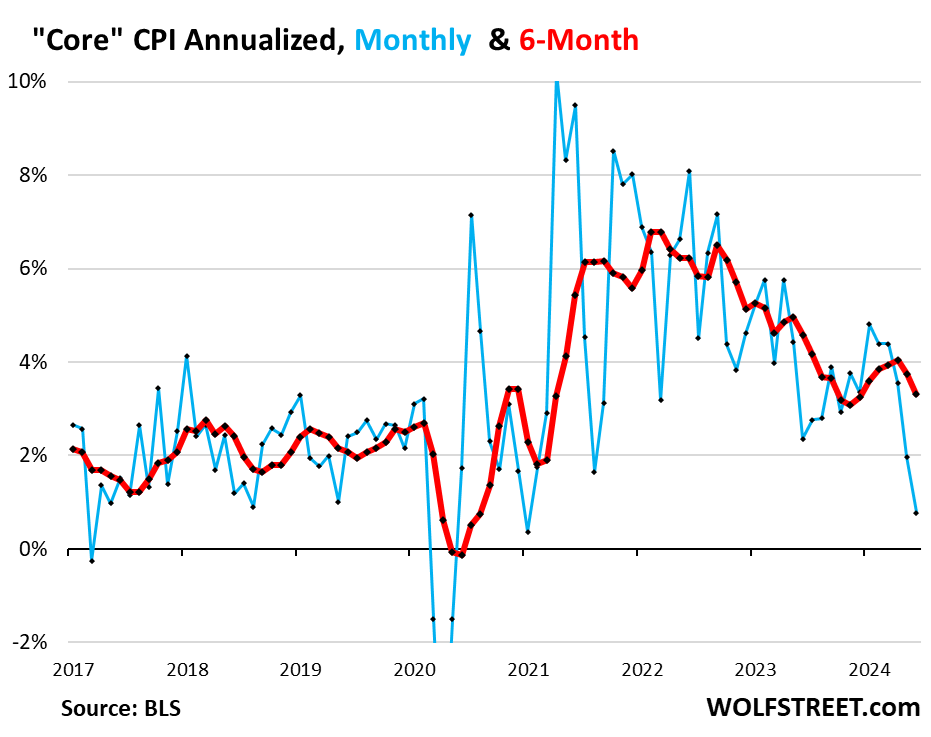
“Core” CPI, month-to-month.
Core CPI rose by 0.06% (= 0.8% annualized) in June from May, the smallest increase since January 2021 (blue line in the chart below). The month-to-month squiggles can be wild, as we can see in the blue line. The June and May values were driven down by the plunge in durable goods and the outlier in services that we’ll get to in a moment.
The six-month core CPI, which irons out most of the month-to-month zigzags, rose by 3.3% annualized, the second deceleration in a row, after five months of accelerations in a row.
“Core services” CPI: 2nd outlier in a row. Will there be a #3 & #4 to make a trend?
Core services CPI increased by 1.6% annualized in June from May (0.13% not annualized), the smallest increase since August 2021, and the second outlier in a row (blue line).
These two big outliers in May and June decelerated the six-month core services CPI to 4.9% annualized, the smallest increase since October 2023 (red).
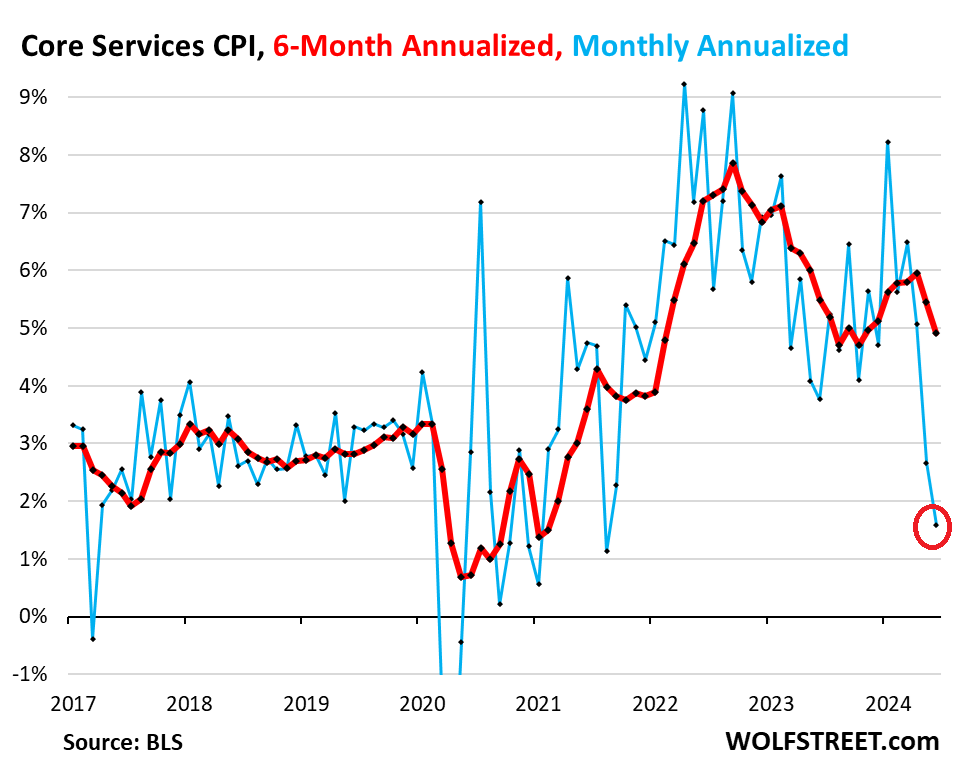
When do outliers become new trends? If there are three “outliers” in a row, they’re not outliers anymore, and if they’re followed by a fourth, then they make a new trend. But in the time span of this chart, there haven’t been more than two outliers in a row, before reverting to trend – in both directions.
By themselves, one or two outliers don’t make a trend. August 2021 was also an outlier, followed by another outlier in September 2021, and then Core services CPI reverted back to trend. But those big outliers in August and September 2021 also decelerated the 6-month reading for a few months. And there were outliers in the opposite direction, such as in July 2020 and in January 2024.
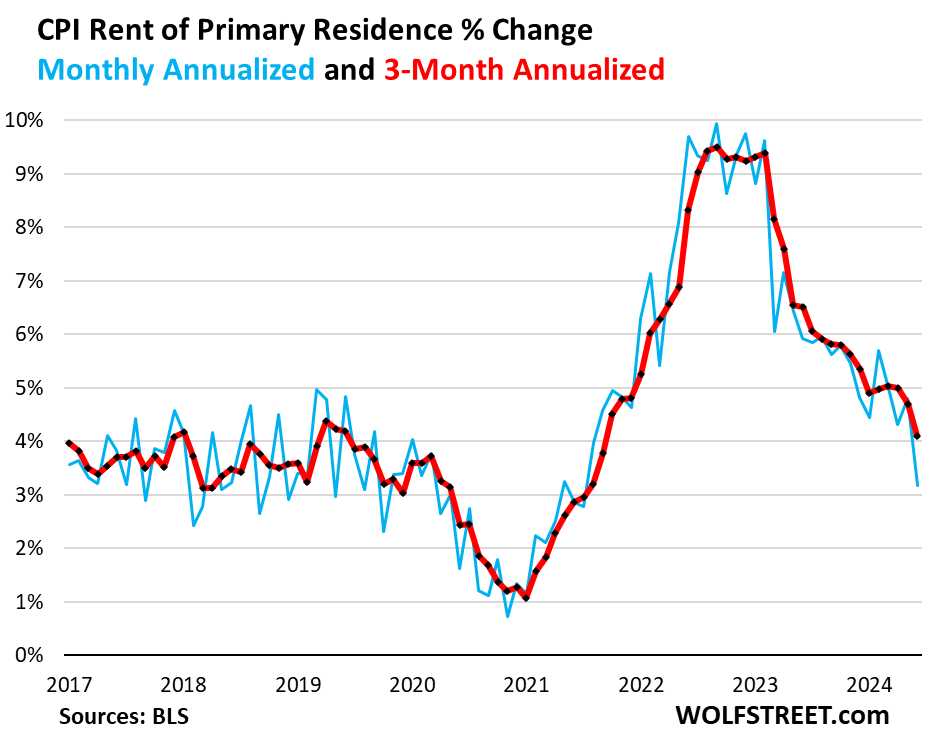
The housing components of core services CPI.
Rent of Primary Residence CPI rose by 3.2% annualized in June from May, the slowest increase since July 2021, following the acceleration in the prior month (blue).
The three-month reading rose by 4.1%, the smallest increase since September 2021.
The Rent CPI accounts for 7.6% of overall CPI. It is based on rents that tenants actually paid, not on asking rents of advertised units for rent. The survey follows the same large group of rental houses and apartments over time and tracks the rents that the current tenants, who come and go, actually paid in these units.
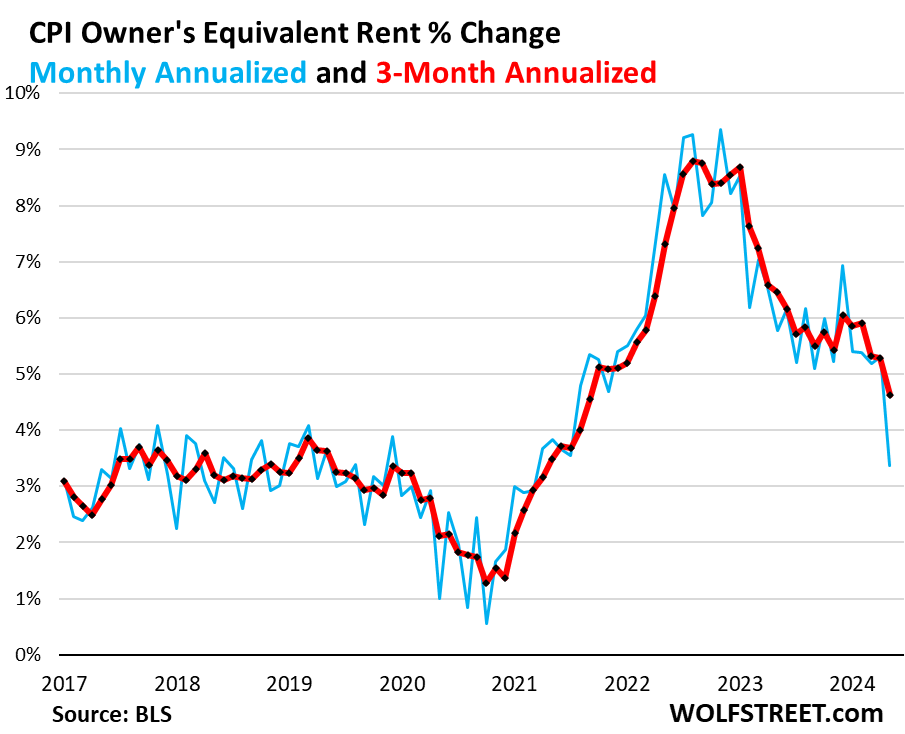
The Owners’ Equivalent of Rent CPI rose by 3.4% annualized in June from May, a big deceleration after the acceleration in the prior month (blue in the chart below).
The three-month OER CPI rose by 4.6% annualized, the smallest increase since September 2021 (red).
The OER index accounts for 26.7% of overall CPI. It estimates inflation of “shelter” as a service for homeowners – as a stand-in for the services that homeowners pay for, such as interest, homeowner’s insurance, HOA fees, maintenance, and property taxes. As an approximation, it is based on what a large group of homeowners estimates their home would rent for, the assumption being that a homeowner would want to recoup their cost increases by raising the rent.
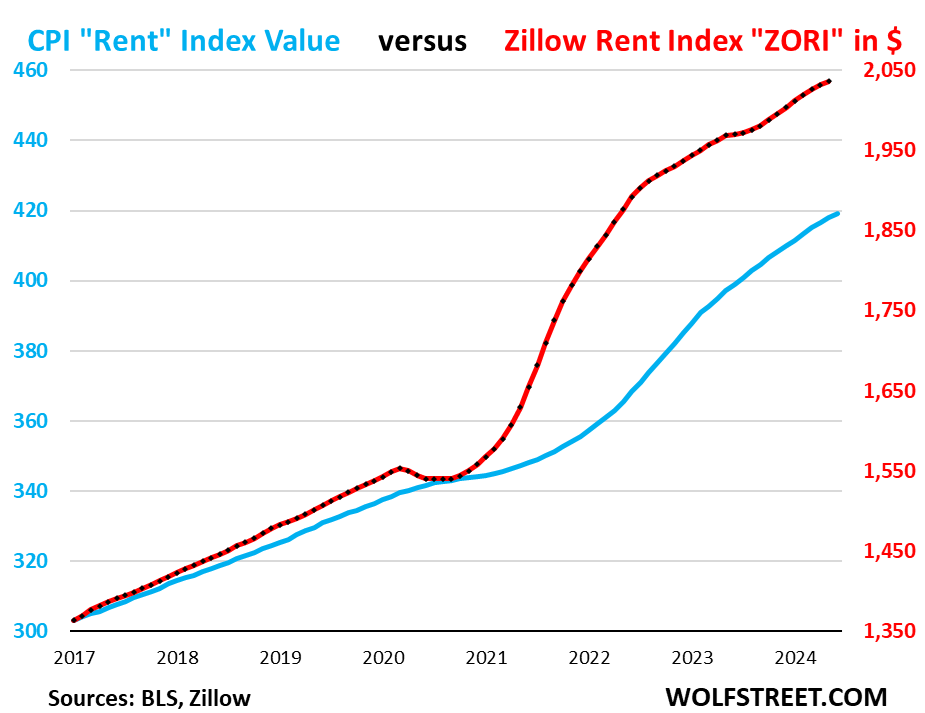
“Asking rents…” The Zillow Observed Rent Index (ZORI) and other private-sector rent indices track “asking rents,” which are advertised rents of vacant units on the market. Because rentals don’t turn over that much, the ZORI’s spike in 2021 through mid-2022 never fully translated into the CPI indices because not many people actually ended up paying those asking rents.
Zillow has not yet released the ZORI for June. For May, the ZORI rose by 0.2% month-to-month, seasonally adjusted, and by 3.4% year-over-year.
The chart shows the CPI Rent of Primary Residence (blue, left scale) as index value, not percentage change; and the ZORI in dollars (red, right scale). The left and right axes are set so that they both increase each by 55% from January 2017. The ZORI was up by 49% from January 2017, and the CPI Rent was up by 38% over the same period.
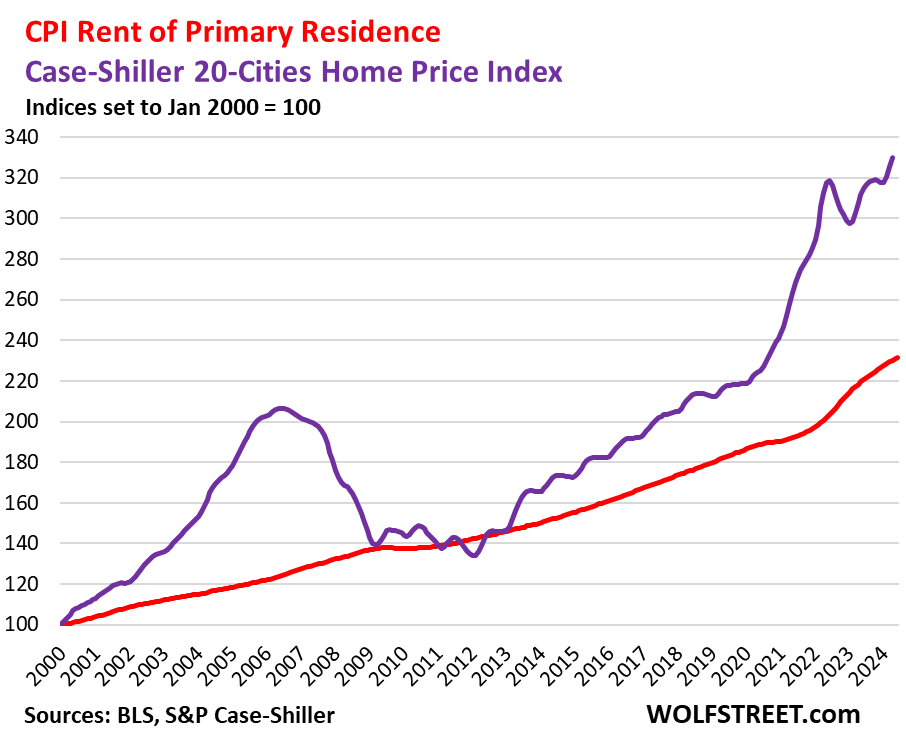
Rent inflation vs. home-price inflation: The red line in the chart below represents the CPI for Rent of Primary Residence as index value. The purple line represents the Case-Shiller 20-Cities Home Price Index (see our “Most Splendid Housing Bubbles in America”). Both indexes are set to 100 for January 2000:
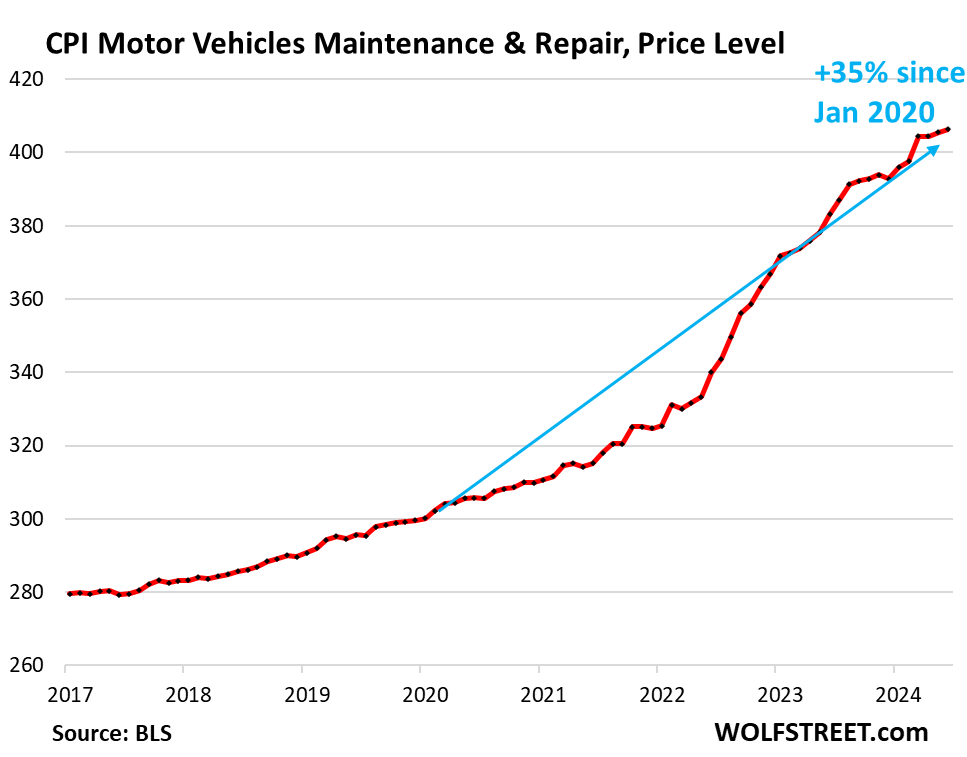
Motor-vehicle maintenance & repair inflation surged because wages of auto-repair technicians surged, and because prices of replacement parts surged. But that spike during the pandemic (+35% since January 2020) is decelerating.
- In June from May annualized: +2.5%
- Year-over-year: +6.0%
- Since January 2020: +35%
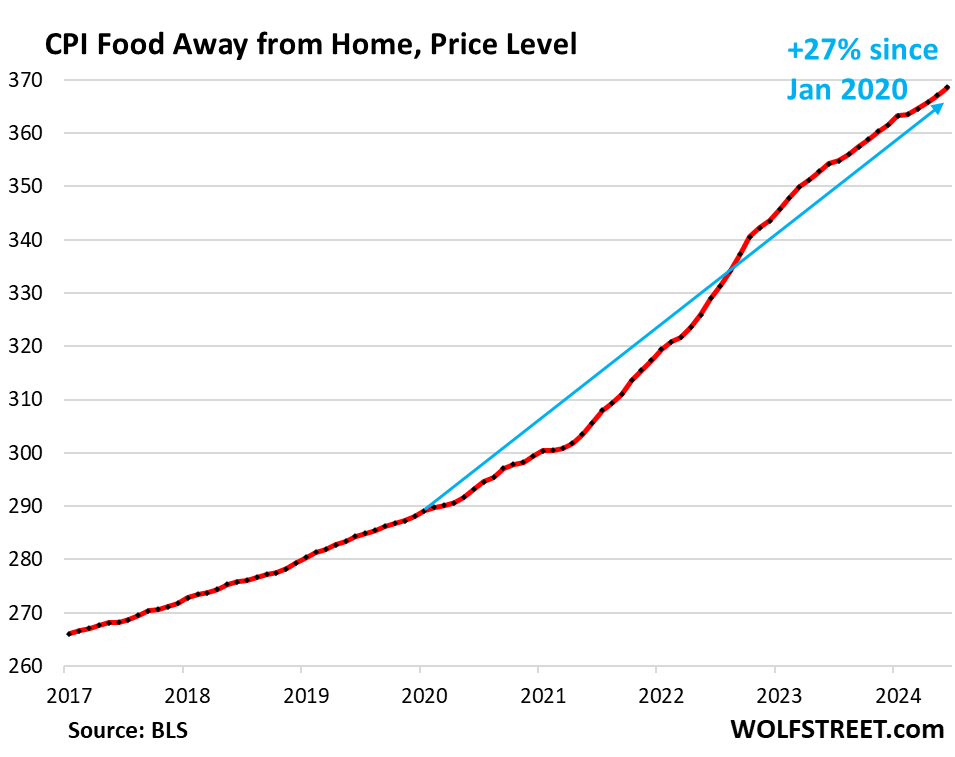
Food away from Home CPI – often called food services – includes full-service and limited-service meals and snacks served away from home, food at cafeterias in schools and work sites, food served at stalls, etc.
- In June from May annualized: +5.1%, fastest increase since January
- Year-over-year: +4.1%, an acceleration
- Since January 2020: +27%.
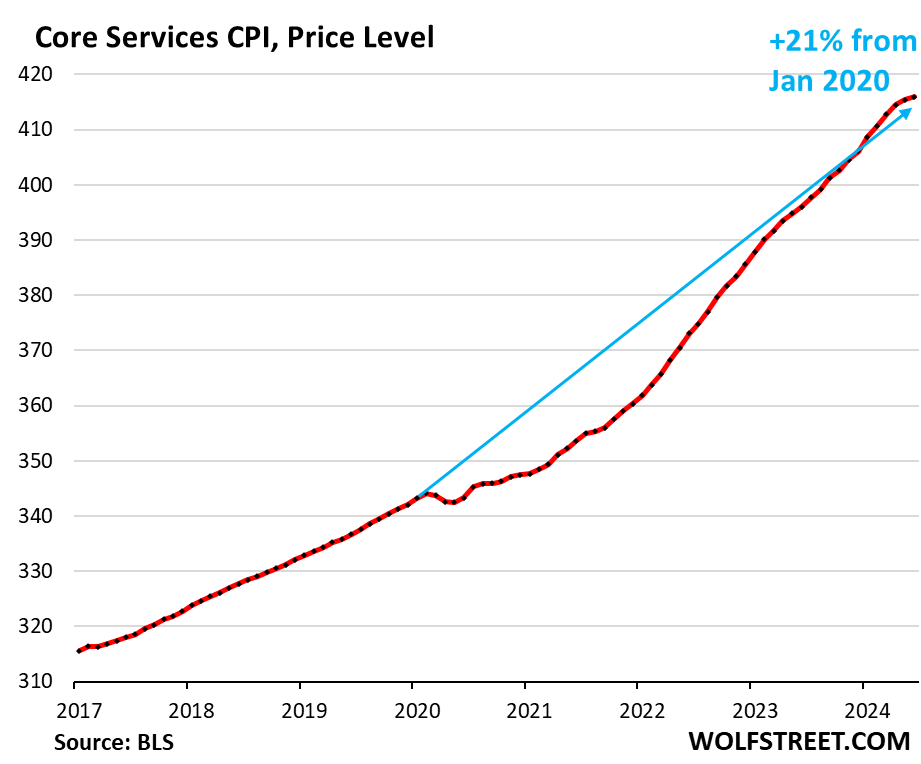
Core services price level. Since January 2020, the core services CPI has increased by 21%.
And it’s spread across services, not just housing. “Super core” services CPI, which excludes rent and OER, increased by 20% over the same period.
The steepness of the curve indicates the rate of inflation.
| Major Services ex. Energy Services | Weight in CPI | MoM | YoY |
| Core Services | 64% | 0.1% | 5.0% |
| Owner’s equivalent of rent | 26.7% | 0.3% | 5.4% |
| Rent of primary residence | 7.6% | 0.3% | 5.1% |
| Medical care services & insurance | 6.5% | 0.2% | 3.3% |
| Food services (food away from home) | 5.3% | 0.4% | 4.1% |
| Education and communication services | 5.0% | 0.0% | 2.3% |
| Motor vehicle insurance | 2.9% | 0.9% | 19.5% |
| Admission, movies, concerts, sports events, club memberships | 1.8% | 0.5% | 6.9% |
| Other personal services (dry-cleaning, haircuts, legal services…) | 1.5% | 0.9% | 4.8% |
| Lodging away from home, incl Hotels, motels | 1.5% | -0.2% | -2.3% |
| Motor vehicle maintenance & repair | 1.2% | 0.2% | 6.0% |
| Public transportation (airline fares, etc.) | 1.2% | -3.2% | -3.8% |
| Water, sewer, trash collection services | 1.1% | 0.2% | 4.6% |
| Video and audio services, cable, streaming | 0.9% | -0.5% | 2.3% |
| Pet services, including veterinary | 0.4% | -0.5% | 5.1% |
| Tenants’ & Household insurance | 0.4% | -0.7% | 3.2% |
| Car and truck rental | 0.1% | 1.3% | -6.3% |
| Postage & delivery services | 0.1% | 0.1% | 3.7% |
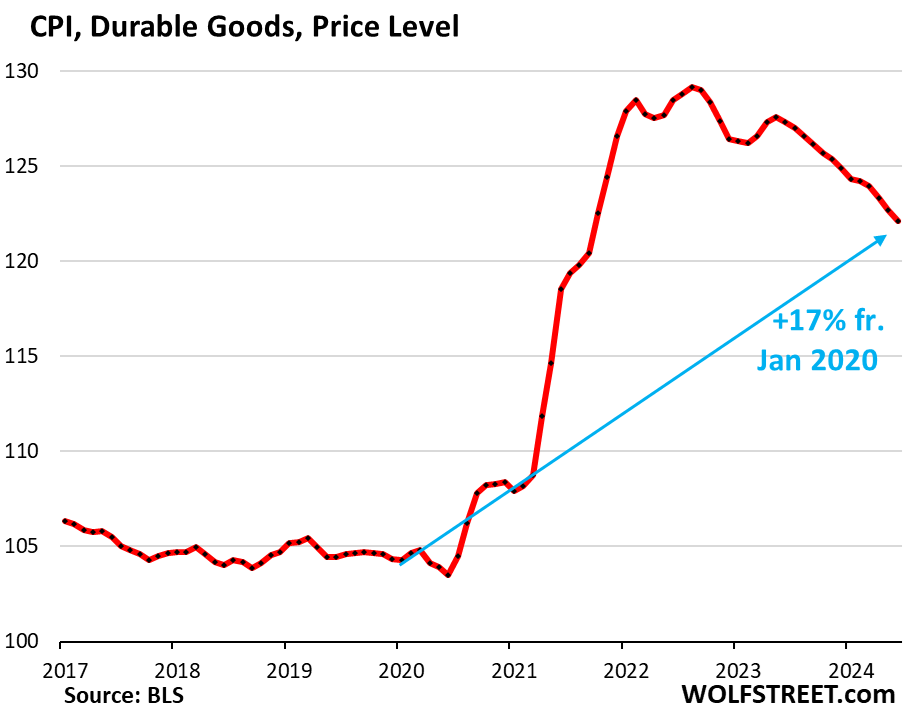
Durable goods CPI.
The durable goods CPI fell by 5.9% annualized (-0.50% not annualized) in June from May, and by 4.1% year-over-year, the biggest drop since 2003.
New and used vehicles dominate this index. Other goods included are information technology products (computers, smartphones, home network equipment, etc.), appliances, furniture, fixtures, etc. All categories have been experiencing price declines starting in late 2022, after the ridiculous price spike during the pandemic.
From January 2020 to the peak in August 2022, durable goods prices spiked by 23.8%. Since then, they have dropped by 7.0%, having unwound less than one-third (29%) of the pandemic spike. Compared to January 2020, the index is still up 17%.
| Major durable goods categories | MoM | YoY |
| Durable goods overall | -0.5% | -4.1% |
| New vehicles | -0.2% | -0.9% |
| Used vehicles | -1.5% | -10.1% |
| Information technology (computers, smartphones, etc.) | -0.4% | -8.5% |
| Sporting goods (bicycles, equipment, etc.) | -0.9% | -0.8% |
| Household furnishings (furniture, appliances, floor coverings, tools) | -0.2% | -2.5% |
New vehicles CPI fell 1.9% annualized in June from May (-0.16% not annualized), the sixth month-to-month decline in a row. Year-over-year, the index fell by 0.9%.
After the huge surge and then a long plateau, prices are now finally declining, as inventories of new vehicles have built up, approaching glut conditions at many dealers, and automakers are having to offer big incentives and dealers big discounts to move the vehicles.
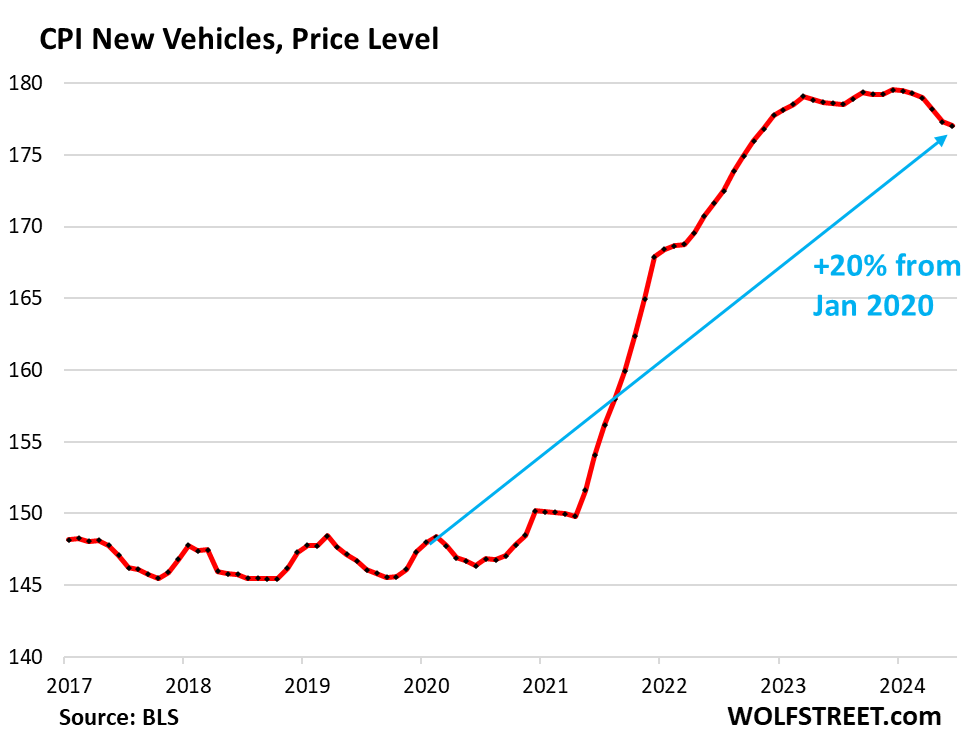
In the years before the pandemic, the new vehicle CPI zigzagged along a flat line, though vehicles were getting more expensive. This is the effect of “hedonic quality adjustments” applied to the CPIs for new and used vehicles and other products (our explanation of hedonic quality adjustments in the CPI).
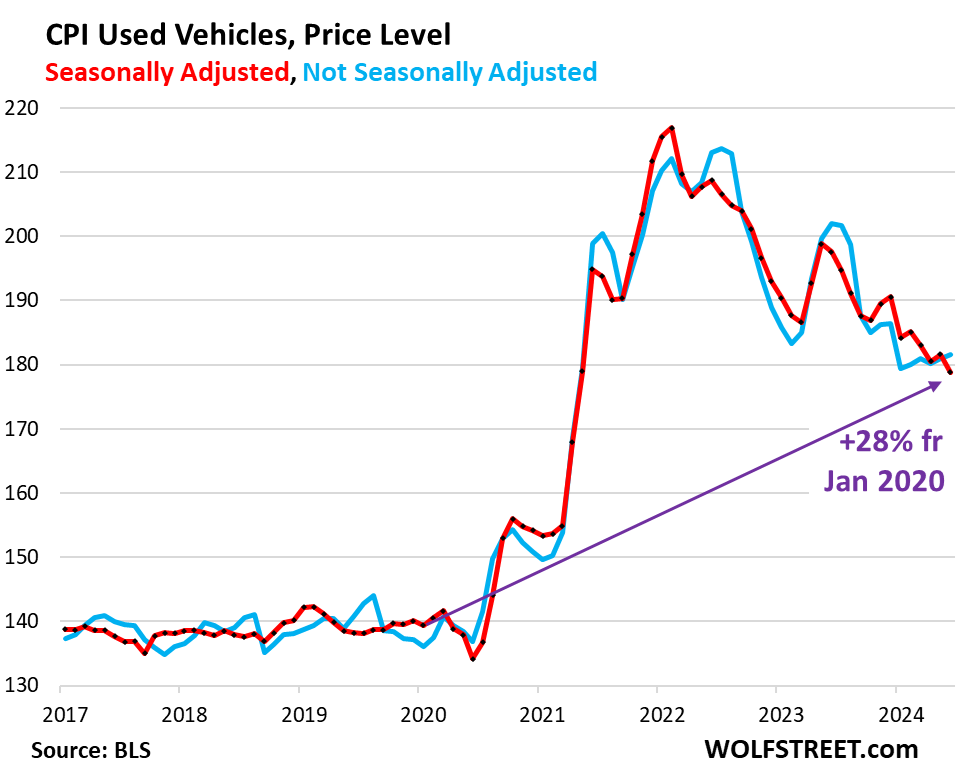
Used vehicle CPI, seasonally adjusted, plunged in June from May by 16.9% annualized (-1.5% not annualized), and by 10.1% year-over-year (red in the chart below).
The 2021 to mid-2022 spike and plunge since then of the used vehicle CPI is confirmed by private-sector data from Manheim, the largest auto auction in the US: wholesale prices of used vehicles are in a similar historic down-spiral.
Not seasonally adjusted, used vehicle prices rose 4.3% annualized in June from May (blue).
Used vehicle CPI has now given up half of the massive spike from January 2020 through January 2022, but is still 28% higher than in January 2020.
Food Inflation.
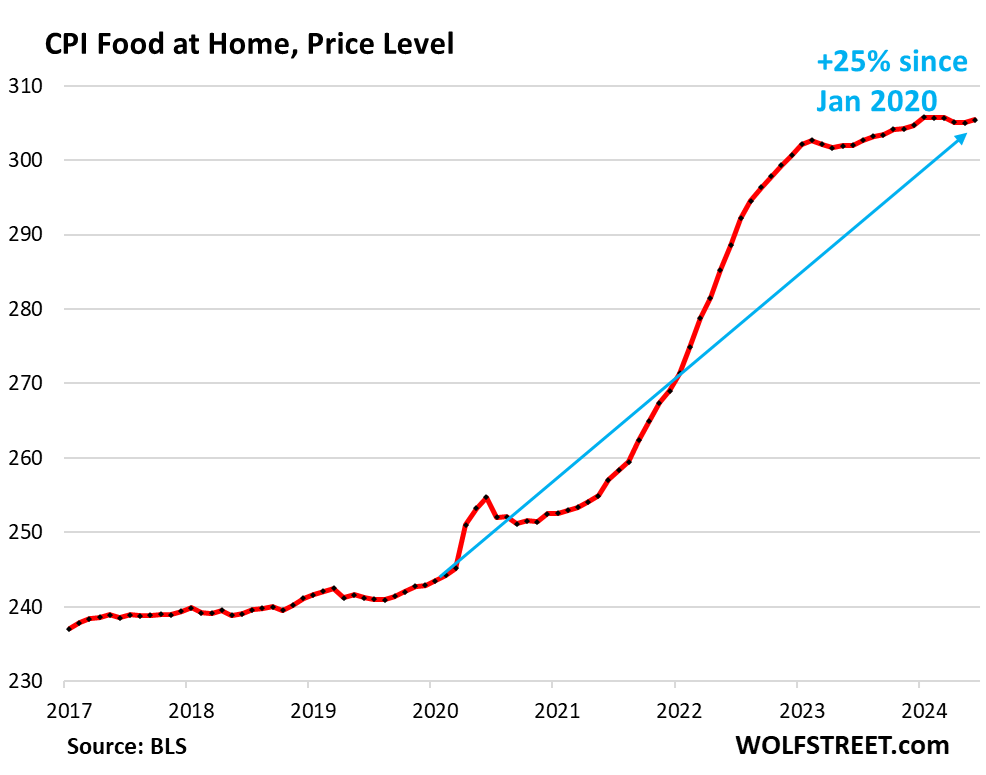
Inflation of “Food at home” – food purchased at stores and markets and eaten off premises – has cooled, barely ticked up in June from May, and was up 1.1% year-over-year, after the spike during the pandemic.
| MoM | YoY | |
| Food at home | 0.1% | 1.1% |
| Cereals, breads, bakery products | -0.1% | 0.5% |
| Beef and veal | 0.1% | 5.1% |
| Pork | -0.5% | 3.8% |
| Poultry | -0.6% | 0.3% |
| Fish and seafood | 0.6% | -1.0% |
| Eggs | 3.5% | 10.2% |
| Dairy and related products | 0.6% | -0.1% |
| Fresh fruits | -0.6% | -1.7% |
| Fresh vegetables | -0.6% | -0.3% |
| Juices and nonalcoholic drinks | 0.1% | 1.5% |
| Coffee, tea, etc. | 0.3% | 0.0% |
| Fats and oils | 1.4% | 4.0% |
| Baby food & formula | 1.7% | 5.6% |
| Alcoholic beverages at home | 0.2% | 1.7% |
The CPI for food at home is up 25% from January 2020. Food inflation has cooled, but not turned negative as in durable goods, and prices continue to rise from very high levels.
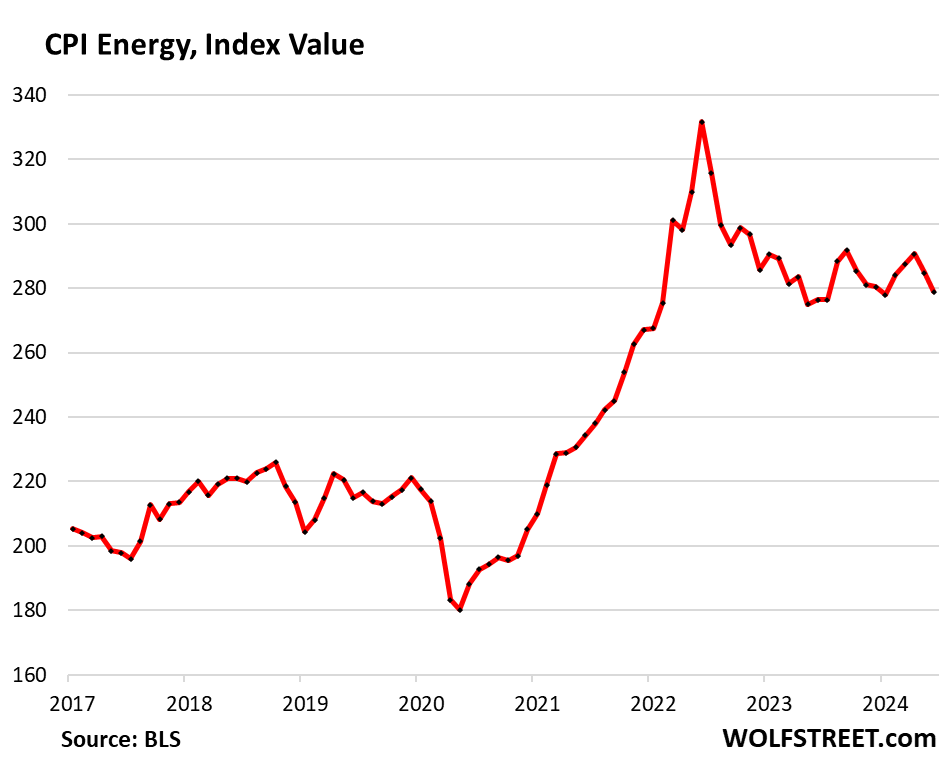
Energy.
The CPI for energy covers energy products and services that consumers buy and pay for directly:
| CPI for Energy, by Category | MoM | YoY |
| Overall Energy CPI | -2.0% | 1.0% |
| Gasoline | -3.8% | -2.5% |
| Electricity service | -0.7% | 4.4% |
| Utility natural gas to home | 2.4% | 3.7% |
| Heating oil, propane, kerosene, firewood | -2.5% | 1.3% |
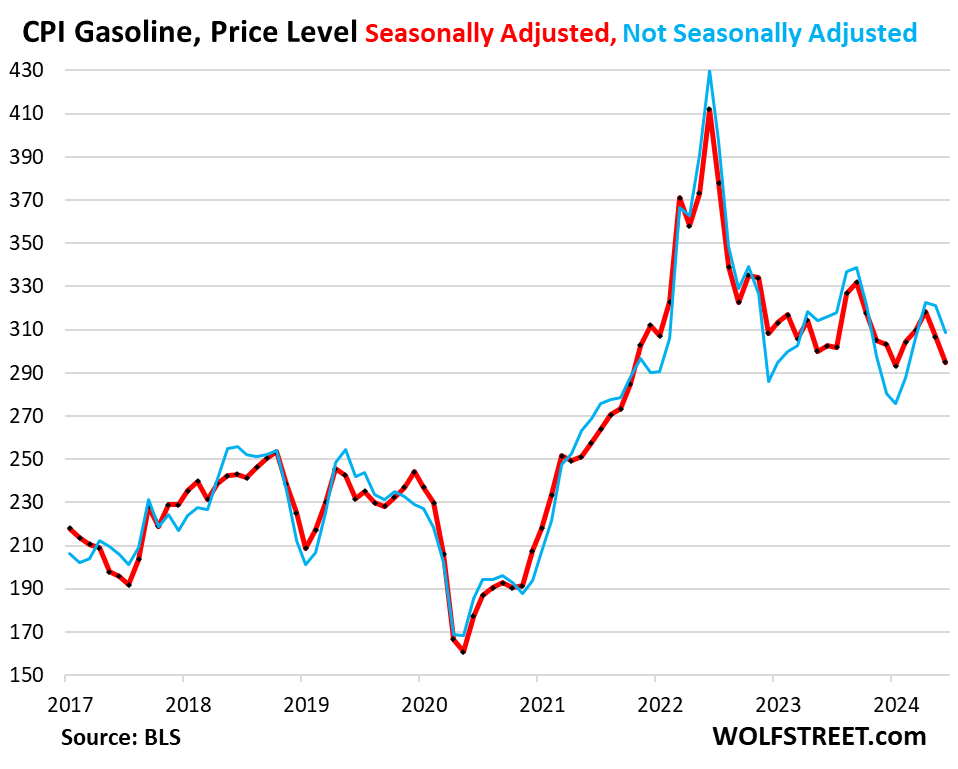
Gasoline prices (account for about half of the energy price index) are very seasonal, with the lowest prices in December or January and the highest prices during driving-season, which started in June. But in June, gasoline prices, not seasonally adjusted, fell (blue). And so seasonally adjusted, prices plunged (red) in June from May. Gasoline prices remain high, but they have come down from the spike that had peaked in June 2022
Enjoy reading WOLF STREET and want to support it? You can donate. I appreciate it immensely. Click on the mug to find out how:

![]()
Crude oil (WTI) increased from $77/barrel on May 31 to $83 by July 1. (Oil prices dipped during the first week of June, but was higher for the rest of the month.)
Yet energy and energy-related categories such as transportation were all down for the month?! Something seems off.
Despite the distinction between headline and core numbers, for the first 5 months of 2024, the monthly direction of oil prices was a good predictor of whether overall inflation numbers came in hot or cold. This month broke the trend. But it’s unclear the BLS used the full month of data.
There was a sell-off today in tech stocks, especially in semiconductors. Everyone was expecting that those companies equitie would have rallied today after a CPI that boost market expectations for rate cuts, so the sell-off looked weird at the beginning. However, the durable goods CPI might give an explanation. The most of the CPI decline for the durable category, was in vehicles and information technology, which signals that the demand is continuing to weaken for EVs, smartphones, PCs and othe consumer electronics goods and appliances, not bottoming as wall street likes to picture it, actually the decline is accelerating. The majority of semiconductor companies does not produce semiconductors for the huge data centers, but for those EVs, appliances and consumer electronics goods. I belive that is becoming evident for the market, how unrational and asymmetric is the current capital allocation.
small cap rotation, shorts and hedges are too short here and if RUT 2K gets over 2164 it has chance to breakout much higher…
they have been in purgatory for 26 months…
Cd just wait for the earnings release of those small cap companies in the RUS 2k and you will see how it will break in new highs. There is no rotation from mega cap in small cap.
B2321
The Old Market rules still apply: Buy on expectation, Sell on fact. At the moment with so much floating cash available it is buy everything all the time, but I suspect we will see largely sideways movement until earnings catch up with prices.
Historian, it’s not only the available liquidity that is fueling the markets, it’s the assurance that FED has given to the market that is suppressing fear and fueling risk appetite. And what I mean with assurance is the evident FED’s tendency to support the market, and their lack of decisiveness to fight inflation, which has been more than evident in Powell’s narrative. Regarding buying everything, we’ll, that’s not true, just compare the equal weight S&P 500 with the market cap weight version. And there is nor earnings support coming for the small caps, you keep talking about it every quarter, but it’s not happening and it won’t happen. There is no rotation to small caps!!
1. Gasoline and WTI are not joined at the hip. Weekly gasoline storage levels are fairly high, ended June with 231 million barrels, about 10 million barrels higher than a year ago (EPA data). This is one of the reasons the EPA cited for lower gasoline prices this summer.
2. Every energy category except gasoline rose yoy in June.
Wolf, good summary. I would think the release of 100 million gallons of gas by the Biden administration had an effect on the gasoline price. From the AP on May 21, 2024: “The Biden administration said Tuesday it is releasing 1 million barrels of gasoline from a Northeast reserve established after Superstorm Sandy in a bid to lower prices at the pump this summer.
The sale, from storage sites in New Jersey and Maine, will be allocated in increments of 100,000 barrels at a time. The approach will create a competitive bidding process that ensures gasoline can flow into local retailers ahead of the July 4 holiday and sold at competitive prices, the Energy Department said.”
And that reserve is gone…. We will never have another storm that would affect things the way Sandy did….UGH! What could possibly go wrong?!
remember to help us peasants have nice 4th
joey emptied the SPR
when higher oil starts going thru to truckers
then higher prices will be baked in – 10%+
btw my diesel repair guy said he’s raising hourly from $175 to $200+
Why are you people now complaining about lower gasoline prices??? What’s wrong with lower gasoline prices???
You can’t store gasoline forever like crude oil.
WGH – true dat…(would assume there is an ongoing certain aging/distribution/replacement volume scheme of the whole, though…).
may we all find a better day.
Howdy Folks. 2024 CPI. 3.1 3.2 3.5 3.4 3.3 3.0
Just about everywhere else, you would think inflation is over, its party time…… Thanks again Lone Wolf………..
The Federal Reserve targets the PCE, not the CPI.
Howdy Jackson. One Govern ment umbrella.
CPI has had too many revisions and quirks messing with the trends, PCE shows a much more gradual decrease rather than the bumpy CPI ride.
The PCE index is hugely volatile, and also gets revised. Here are PCE price indices for “core services,” durable goods, and the Fed-favored “core PCE,” month-to-month and 6-month annualized, for May. It’s hard to make any kinds of decisions based on the month-to-month readings.
https://wolfstreet.com/2024/06/28/feds-wait-and-see-on-rate-cuts-makes-sense-amid-whiplash-data-still-worst-6-month-core-pce-inflation-since-mid-2023-but-freak-plunge-in-durable-goods/
Till the next one shoots up to 9.
Everyone is like “what the…??”
Haha
And there was much rejoicing!!!!!!
yeah
Mostly still bad and in no way suggests a rate cut is needed anytime soon. I don’t care what wall street wants.
Now FED officials are now stating that rate cuts are justified. We went from “soft landing” to “no landing,” and now they are going to cut rates during the biggest economic everything bubble in the history of mankind. These people are the most dangerous economic terrorists in world history, and they need to be rode out of town on a rail.
“Now FED officials are now stating…”
That’s incorrect. Correct:
1. “Daly stated…
2. “With the information we have received today… I see it as likely that some policy adjustment will be warranted.”
But she didn’t say when.
BTW, CPI went from 9% in mid-2022 to 3% now. The Fed’s policy rates are still at 5.25-5.5%.
At the end of July Wolf comes the first cut. Everything has been arranged for since March. Government spending decreased, Government hiring decreased, QT slowed down, everything is in position for the cut.
Celebrating 3% inflation, especially after such horrific inflation of nearly double digits, is sick. Further, cutting rates while it’s still high is diabolical. This 2% “target” is a sham. The FED is a sham.
DC
“Celebrating 3% inflation….is sick”
Especially since it’s above the inflation target of 2%. And the CPI is a bu__ sh__ metric anyway, not remotely reliable or meaningful, IMO, to anyone except wall street. This country’s economy is a crime scene.
The Fed isn’t “celebrating 3% inflation,” that’s just bullshit. But policy rates are far higher than inflation, and no one knows where inflation will head next, but if heads “sustainably” toward 2% from here, it makes sense to cut. If we get a couple of bad readings over the next couple of months, that’s a different story, and the Fed has constantly discussed that and warned about that.
No matter what the Fed reports for inflation the reality is inflation can not be less than what the government is emitting as credit each year. Currently just federal deficits are >6% of GDP per year. It may look lower at times, but it will be higher again.
Misemeout you are right, but Wolf and others don’t want to accept it, they refuse to see the reality. The white house is planning to inject a cumulative of $600 B for the next 3 months, and the government hiring will significantly increase, most probably at an average of 70k increase in payrolls per month. Add to the overall calculation a rate cut, just to push higher the market and asset price, and we will see the labor market and the economy turning into a furnace. So cheer up people, we are going to whiteness the American exceptionalism at full power, at least for a couple of month, after that brace yourself.
In the Volcker era the second wave of inflation was much higher than the first because of the same reason they cut too early. Remember back in the 70’s the correct inflation figures were fact but today the figures are fiction all based on a redefining of the CPI and inflation indexes.
Here comes Johnny…I mean rate cut. Maybe WS will get their wish, not 6 cuts at least..
I’ll have to pour one for my Tbill return…will take a slight hit on those fixed income return..
Everybody is partying around here, even while the aftermath of Hurricane Beryl is being cleaned up (Houston).
Restaurants are packed (the open ones), gas stations are running out of fuel, and big box stores are full. Now that the durable goods inflation is under control. it’s party time! New cars (Big Trucks) everywhere!!
FED: Just keep those rates above 5% so my invested retirement funds are making some money!
I don’t recommend celebrating prematurely. If the CPI continues to fall in a clear trend, that’s one thing. But the last time there was entrenched inflation, there were periods when it would go down and then come back up. It’s not clear yet if inflation has been vanquished. Of course, Wall Street is already claiming victory so they can start a new round of rate cut mania.
Head Fakes incoming… Stay Tuned.
How does this translate to ppi tomorrow
It doesn’t. If anything, it would be the other way around, with PPI being an input for FUTURE changes in the CPI as producers pass on the prices they pay, in theory.
Also note: Some PPI elements are included in the PCE Price index that the Fed is looking at (but not in the CPI). So the PPI details give clues in which direction core PCE is going to move.
Mortgage rate down to 6.85% today. Is this the beginning of Rate Cut Mania 2.0?
blip
The 10-year yield already bounded back to 4.22% currently, from 4.17% earlier today when mortgage rates for the day were priced. That’s only 3 basis points below where it had been for a big part of the second half of June.
Then tomorrow we should see the 30 year mortgage bounce back toward the low-7s range that it’s been in for quite a while.
Well, it was 6.99% yesterday. It was 6.97% a month ago. And in between for a day, it was 7.29%. So any bounce wouldn’t be 100% back to 6.99% on first try. It might go to 6.91% tomorrow, and then try again next week. If you look at the chart, it’s very jagged from day to day, with big daily ups and downs constantly.
Nope, no bounce today. Went down a little bit further, to 6.82%, despite the hotter PPI.
its running right into the 100 week sma and will not breach it for a while, folks are dreaming if they think its going to run much higher
111.20 on /ZN weekly will be solid resistance..
Everything I’m seeing shows over 7 still.
Mortgage News Daily is the least laggy publicly available source (that I know of) for average mortgage rates.
Which components caused the CPI to go negative on a month over month basis in June? Gasoline, fuel oil & used vehicles? How much do these components make up of overall CPI?
Thanks!
Motor fuel, including gasoline = 3.8% of total CPI
Used vehicles = 1.9% of total CPI
New vehicles = 3.6% of total CPI
That’s nearly 10% of total CPI, and they all dropped bigly MoM
Wolf – two questions. Where do you take the durable goods data from? I’m reading the component table here -> https://www.bls.gov/news.release/cpi.nr0.htm and can clearly see the new & used vehicle data which you referenced. Is “durable goods” a stand-in for a line named otherwise in the table referenced?
Second, is there any relationship between energy/durable goods and services inflation? For instance could goods or energy prices rising feed or take away from services prices somehow? I’ve understood the link between wages and spending much better after reading your coverage and that’s where the question stems from. Thanks x2
1. https://www.bls.gov/data/
Look for the column “Data Finder” and the line “All urban consumers,” and where they meet, click on the pink rectangle “Data finder”
But the BLS Data Finder appears to be down right now. I just tried it to walk through it so I can give you step by step instructions, but the page of the Data Finder doesn’t load. Not sure what the problem is. Maybe try it tomorrow.
The Data Finder gives you access (normally) to a huge trove and detailed downloadable data series, and of combinations, such as durable goods or core services, etc.
2. You’d think there is a good connection between energy and services/goods inflation. But it’s not that simple because prices are set by the market, no matter what the costs for the producer are. For example, airline ticket prices. For airlines, fuel is a big part of the operating expense. So fuel prices matter a lot. But maybe ticket prices fell a lot due to competitive pressures, while fuel prices do their own thing. Airlines, like all big fuel users, try to hedge their exposure to fuel-price swings, and Delta even has its own refinery, which complicates the connection between fuel prices and ticket prices. There is nothing simple and direct about prices.
If I buy a new build home that nominally has a 7% mortgage but as part of the closing incentives has a rate buy-down to let’s say 5.5%, is my mortgage reported as a 7% or 5.5% mortgage in surveys and wherever else this data gets captured?
Have been curious, since you’ve written on the subject, as to how many people in the US are actually taking on /have taken on 6-7% mortgages since the FED started QT. In other countries that transmission is almost immediate but obviously in the States the only immediate impact has been the volume of transactions since rates are fixed for 30 years.
My guess is they will report the calculated APR that is on the loan document, which will factor in the 5.5% partial rate since that will only be for a short period like what happens around here.
In my new development, they are buying down to 5.99% and the APR is stated as 6.94% over the life of the loan.
As the Federal Reserve said years ago, inflation was merely transitory.
hmm..yeah everything is transitory with long enough timeline…WWII, Great Depression, aftermath of 9/11….etc.
However, the timeline that Pow Pow meant, inflation was anything but transitory and they could’ve prevent it from happening in the first place if they started earlier not drive rates close to 0 along with MBS purchase…etc
If you statement is meant to be sarcastic then try adding /s
Had they not discarded the transitory narrative and raised rates aggressively, inflation would almost surely be much higher than it is now.
Good lord. Get over it! The models at the time said, based on historical data, that inflation was likely transitory. They were wrong, as models sometimes are. They’ve admitted it was wrong. They’ve changed the models to reflect new data.
Now the models are better but you know what… They’ll still be wrong to some degree. Prediction is not as accurate as hindsight. Just accept it. The models are still correct more often than not.
So get off your high horse. YOU certainly couldn’t do better at predicting these things.
Imho over-reliance on computer models is an issue in many industries (not just finance).
As Wolf says, low interest rates turned brains into mush.
Core Services CPI won’t make it down to 3% any time soon. There is an off chance it might reach that level by end of 2025, but I wouldn’t bank on it. In fact, I expect Core Services CPI to head back up as the current Tax Cut and Jobs Act (TCJA) tax provisions get closer to their sunset in 2026. The 20% QBI income deduction will disappear, and I expect many small businesses will try and make up for that loss with higher prices.
You can’t really expect Congress to let TCJA expire, c’mon. There is nobody left with a spine to inflict that “pain” on anyone. Your cries of woe will be echoed and amplified by every media outlet into a deafening roar as that approaches. I haven’t given that any thought, but if you can provide an example of Congress doing anything that was painful but for our own good, I’m willing to reconsider.
The problem is that TCJA is economically painful, no matter what they decide to do with it. It’s truly “damned if you do and damned if you don’t” legislation.
I believe the TCJA expires. In that case it will need to be renewed by the House of Reps and passed by the Senate and signed by the President. I don’t see this happening with with Biden or Harris.
Maybe if a “grand deal” is made with Trump where he gives Democrats in the Senate a number of priorities on their “wish list.”
I am assuming it will expire and planning for it.
Did small businesses cut prices 20% when the QBI was passed? I don’t recall seeing that, but I could be wrong.
The most suspect piece of this ongoing “wall street rate cut mania” is the amount of cuts to make it actually matter.
6 cuts? Cool 3-4 percent r* rate and higher ten year and lower asset prices.
Only way we can justify these prices is near zero rates and there’s no way we go back to that without getting more inflation.
It’s been 3 years and people are still running need segments on how to beat inflation… Mind set has changed for sure.
The Truflation daily real-time tracker today has US inflation down to 1.8% (July). Well below the 2% level. US inflation looks back under control.
Truflation is one of the worst measures out there, bordering on braindead. They use for example, “asking rents”, but no one pays current asking rents — those are the rents that landlords want on their vacant units that renters have ignored so far. Same with new and used vehicles. They don’t look at actual transaction prices, they have no idea about actual transaction prices. Their bot scans the ads that car dealers put on the internet of vehicles that they haven’t sold yet. Truflation is unadulterated bullshit to please the masses.
Wolf, please don’t feed the government troll bots. Truflation, LOL, pure propaganda.
Wolf,
Is there a mathematical definition of what makes an outlier, or is it a visual interpretation based on the graph?
1. Yes, sorta.
2. Yes, also.
In the land of CPIs, there are versions that eliminate the outliers via different methods, including by using a median instead of a weighted average, and by using “trim” CPIs where for example the outer 16% on both sides of the spectrum get cut off.
In real estate, outliers are often considered the outer 25%. For example, Zillow uses this approach of cutting off the outer 25% for some of its home price indices, to come up with a price index for a “typical house” in that local market.
The Cleveland Fed runs a version of CPI using the same data of CPI but eliminates the outliers in the basket of goods and services. It does it in two ways, using the median instead of a weighted average (“Median CPI”) and then trimming 16% off the outer edges of the price movements (“Trimmed CPI”). The Cleveland Fed Median CPI rose +4.1% YOY and +0.19% (2.4% annualized) MoM
https://www.clevelandfed.org/indicators-and-data/median-cpi
Click on the chart to enlarge:
“Consumer Price Index for June, on a month-to-month basis, was pushed down by plunging gasoline prices.” This whole gasoline price thing started in the 1970s with the Arab oil embargo and the the Iranian issue with its odd even license plate gas days. No one burns so much gasoline that it would make a dent in real inflation; i.e , housing and food (food removed because of “volatility ” another lol). With grade school mathematics we take the typical 12,000 miles a year most car insurance defaults to, with a 20 miles to the gallon. That is 12,000/ 20 = 600 gallons. A $2 a gallon change is $1,200 a year; about an order of magnitude less than the housing costs that the Federal Reserve MBS purchases caused.
$2 a gallon? Where? Now on earth?
The average price in the US for regular = $3.50
Average miles per year per vehicle = 14,500 miles.
But 20 mpg may be low today for an average. Lets use 24 mpg city and highway combined.
So 14,500 miles divided by 24 miles per gallon = 604 gallons times $3.50 = $2,114 per year for gas. That’s a lot of bucks for gas, for a one-car households. Double that if it’s two-car households. That’s why people freak out when gas prices go to $5 a gallon. So if you make $35,000 a year, that $2,114 = 6% of your income. Don’t tell these people that gasoline doesn’t matter, unless they have an EV or don’t drive.
Speaking of outliers: There are people for whom gas prices don’t matter much. I drive a compact SUV I bought in April 2017 which now has 29,400 miles on the odometer – 4055 miles/year. MPG of this vehicle: 28 MPG. Gallons burned per yr: 145 gallons, @ $3.50/gal,
$ 508.
Income $50K/Yr. Gasoline expense = 1% of income. My way of life simply avoids much of the economic travail most folks suffer.
Note that he said “$2 a gallon CHANGE” .
Point being that gas price changes don’t impact anyone as much as changes in housing and food prices.
Most people spend a lot more on housing and food than on gasoline, so small price changes there hurt budgets a lot more than even relatively large gasoline price changes.
On the other hand, you gotta get to work, so you gotta buy gas. You can trade down on food or housing costs, but it’s hard to trade down on getting to your source of income.
He did say a $2 change (either way I suppose). But to Wolf’s point if it’s over 5% of a person’s income, adding that $2/ gal is over a 50% increase, ranging closer to 10% of overall income for the lowest earners.
Remember, the US economy operates in a very low tax energy environment compared to most other countries. For example, Canada (where I live) produces over 2X its’ domestic energy needs, obviously a bit more than energy self sufficient. But the oil companies produce the oil….not the country….and the oil companies are controlled from the US. The Cdn Govt just does the taxing and environmental regulation. Energy is a cash cow here for workers in the field and for all levels of Govt…..plus there is an additional federal carbon tax attempting to push down excess consumption , to produce efficiencies, and it also redistributes wealth as energy inflation affects the poor much more than the wealthy. Big users pay more tax. Poor people get rebates.
Costs to consumers: Where I live regular is $1.78 per litre or approx $6.60 per us gallon. If you purchased with a US dollar it would be $4.95 per US gallon, call it an even 5 bucks. Does it affect much? Well, everything seems more expensive as imbedded energy costs permeate every aspect of modern life. However, the roads are still packed, tourists are everywhere, motorhomes and trailers are clogging the roads and campgrounds, and huge boats towed by massive PUs are common. Personal conclusion: I think the slack is still being taken up by the cheap debt mindset. Everything has been bought ‘on time’ in the last 10 years or so. Plus, most of these toys and vehicles, and most important many of our “spending habits” all originated in the 0% environment of recent past.
7% interest rates are historically normal. 3% inflation is bullshit criminal, imho. It is not a one off, it compounds itself. Just Googled the question: How many mortgages are up for renewal in Canada in 2024?
Answer: “Why is 2024 significant? Again, data suggests a whopping 80% of Canadian mortgages are up for renewal in 2024, translating to $250 billion in outstanding loans.Mar 15, 2024” Other sites say 50%, but the number is significant, regardless. I’m looking for a massive price reduction in housing asking prices up here, and/or a very visible decline in other activity to fill the gaps if housing does stay high. I went through this in the 80s. The rubber band stretches and stretches until it suddenly snaps.
But since the 80s….I’m another debt free Bubba. You get hurt from inflation you either learn and adjust, or you get chewed up and spit out. If they reduce rates by much the pain will only be delayed until another inflation resurgence.
GOOD summary Paul, and I thank you for being at least somewhat ”thorough” or as much as possible for anyone not insider connected to the GUV MINT, especially in Canada these days from what I read on other sites.
Bureaucracies, once established, have been clearly and thoroughly vetted to be clear that they make their main and basic duty to maintain themselves.
Time and enough to disgorge as many as possible such groups,,, [[ OLIGARCHYS in fact] of the unelected and really and truly NOT NEEDED by WE the People, bureaucracies,,,
And, to be clear, I am NOT a fan of ANY candidate for POTUS!
I’ll say it again, inflation is going to get worse, not better. “Higher for longer”…
…much longer. Wave one of inflation came ashore, the second wave will hit during the election. Wolf data more than supports this, so does history.
Hedge accordingly.
I was thinking this CPI could be down vs fcst based on gasoline prices. In June the federal government sold 1 million bbls of gasoline they had been storing for over a decade in case of another Sandy type storm were to occur. Sandy hit in the area where many NE refineries are located. Devastated local gasoline available during Sandy aftermath . This insurance is has bee ln sold which was both a plus to the fed government funds and a short term glut on gasoline until that inventory is used .
Why rate cut mania on wallstreet and in the press?
The thing worse than inflation is deflation and depression. That’s the thing that makes them sweat.
Nah, there has been no depression in my lifetime and only a few quarters of mild deflation, and I wasn’t born yesterday. The core PCE price index, which the Fed favors, has NEVER been negative (deflation) year-over-year in its entire history going back to 1960. A long bout of deflation – with the core PCE price index negative year-over-year for a while – is the least-likely scenario in the US. But there has been lots of inflation at every twist and turn, sometimes stunning amounts of inflation and sometimes moderate amounts. The deflation mongers just deploy this fearmongering to extort lower interest rates from the Fed. It has been the same BS for decades.
PPI just came out hot.
Wolf –
Do you typically see durable goods fall off first as these are the purchases that can be delayed allowing you to continue living your current lifestyle without making any other sacrifices? When they start to become mandatory, e.g. your car will no longer run, you have to cut back in other areas to balance your budget.
Durable goods had a huge price spike due to the shortages and consumers’ unwillingness to walk away when someone was trying to rip them off, and so they got ripped off, loaded up with free money and nothing else to do during the pandemic, thereby giving retailers and manufactures HUGE profit margins. Now, consumers have woken up and started paying attention again. It is perfectly logical that prices of durable goods revert to trend. But that’s largely unrelated to inflation in services that has taken on a life of its own.
For sure. The furniture commercials on tv during the pandemic had eye popping prices. Then when things opened up there were huge price drops, any excuse to say big sale, and rebates.
So obviously gouging those checks from Uncle Sam, it was almost funny.
This is probably nothing but this past Tuesday paid $3.74 for regular gas. Around here, it has been fluctuating between a low of around $3.32 to $3.79 with the higher prices being the more recent. Daily ups and downs but over time, its up. Doubt if it has a lot of down side at this point but that is just me guessing.
Most americans income is far less than 100k. They need a full blown depression and price declines just to survive.
There is and never will be mass unenployment for people with practical skills or willing to sweat.
They outnumber us and they will win in the long run.
I just have to laugh at those buying tbills at 5 percent! I would rather have a van full of good used tupperware. It sells and 500 percent is easy.
Someone I know and dearly love, buys estates and lockers as a hobby. 5 percent, why bother?
Do a chart of all americans yearly income and study it.
A fifty percent decline in housing would not be enough and would not crash the economy. If anything it would be great for the economy and banking.
They just announced on fox, that the white house is looking at national rent control. Can a federal tax on extra homes be far away?
“They need a full blown depression and price declines just to survive.”
That’s BS. They’d all lose their jobs and what income they have. What they need is pay increases and promotions and better jobs.
“I would rather have a van full of good used tupperware. It sells and 500 percent is easy.”
Awesome! Tupperare is going to need every one of your dollars that you can spare. It’s on the verge of filing for bankruptcy.
“They just announced on fox,…”
Bullshit headlines to be spread by morons. The proposal would apply rent control only to subsidized housing units that receive funding from the Low-Income Housing Tax Credit, which is the federal affordable housing program. Under the new rule, the annual rent increases in these eligible subsidized units shouldn’t exceed 10%, according to the National Housing Law Project.
Just in time for July, August,Sept. numbers to drop too. Your SS cola depends on it. The house always wins!
Bernanke in his book: “The Courage to Act”: “Monetary policy cannot be directed at a single class of assets”. I guess MBS purchases don’t count.
Wolf, would you please post an article, based on your own beliefs, about how even as low as 2% inflation is some how a good thing.
If you’ve already done a piece on this concept, would you kindly point us in its direction?
Your own perception now, not a regurgitation of government dogma.
I doesn’t matter what I think. It’s the system we have. Get used to is.
Oh, believe us, Wolf, we’re used to it by now.
That doesn’t mean that we don’t want to hear your thoughts on the concept of 2% inflation being self-evidently good, as the Fed and a million pundits appear to accept uncritically.
I believe you’ve hinted at your views in the past. Esther George, on her way out, gave a tantalizing hint about her own views, which lead me to suspect that even at the Fed there are private doubts about the joys of 2% inflation.
I listened to an interview with Raoul Pal, who was talking about “exponential assets.” (Blockworks hosted)
He is a macro guy, and he was talking about embracing an 85% selloff (a big crypto guy now too). So, he wasn’t necessarily saying that the market wouldn’t crash….
His main thesis is basically that global governments have to keep liquidity up (which is true to maintain stability). Creating “exponential assets.”
He makes it sound like the money printing hasn’t even begun. Governments are needing to refinance debt, just to keep up with the interest.
Pointing to “leading indicators” and the trueflation number (cited by Wolf to be steaming dung) he maintains the Fed is late to cut already. (We know the Fed is late to every party).
The conclusion is basically that the business cycle has been rescinded and replaced by the refinancing cycle (thank you GFC). It’s become save the people vs. save the system (and most besides Depth Charge see a systemic collapse crushing the people en masse).
Interesting because it is the second person I have heard say that the economy has NOT recovered from the GFC (I agree), and that basically (hold yer breath):
THIS TIME IS DIFFERENT!
We’ve been hearing this BS forever. Nothing new.
Your insights add depth to the discussion.