1 New High. 19 metros below 2022 peaks: Austin, San Francisco, Phoenix, Denver, Salt Lake City, Portland, Seattle, Dallas, Honolulu, Nashville…
By Wolf Richter for WOLF STREET.
Active listings have been surging for months in practically every major market, including in formerly hot markets such as Florida. Sellers are grappling with an unexpected phenomenon: While inventories are piling up, buyers are on strike because prices are too high even though mortgage rates have dropped a bunch over the 10 months through mid-September. Since the rate cut, mortgage rates have risen again but at around 6.6% remain a lot lower than they’d been.
The lower mortgage rates have brought out the sellers, but not the buyers who remain on strike because prices are too high. And so, prices even in markets such as San Diego have started to succumb to gravity.
Down from prior month: Prices of single-family houses, condos, and co-ops sagged in September from August in 26 of the 28 large metros here.
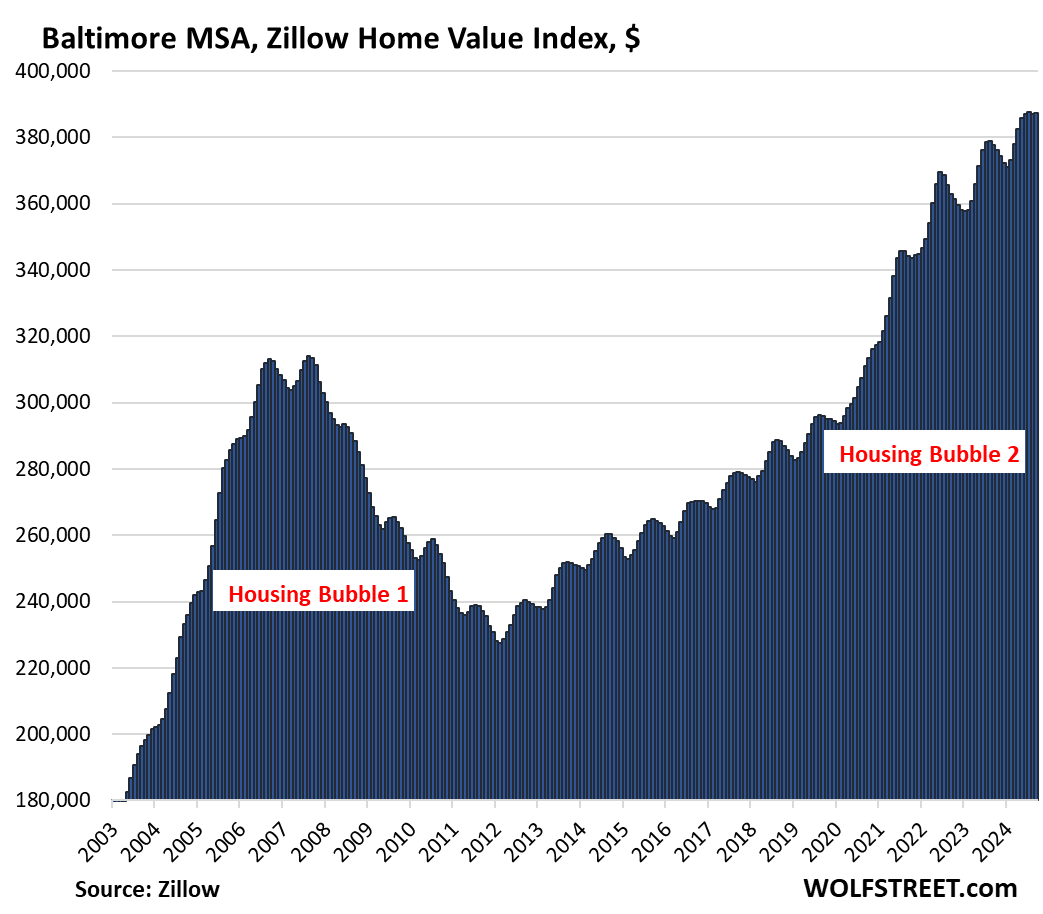
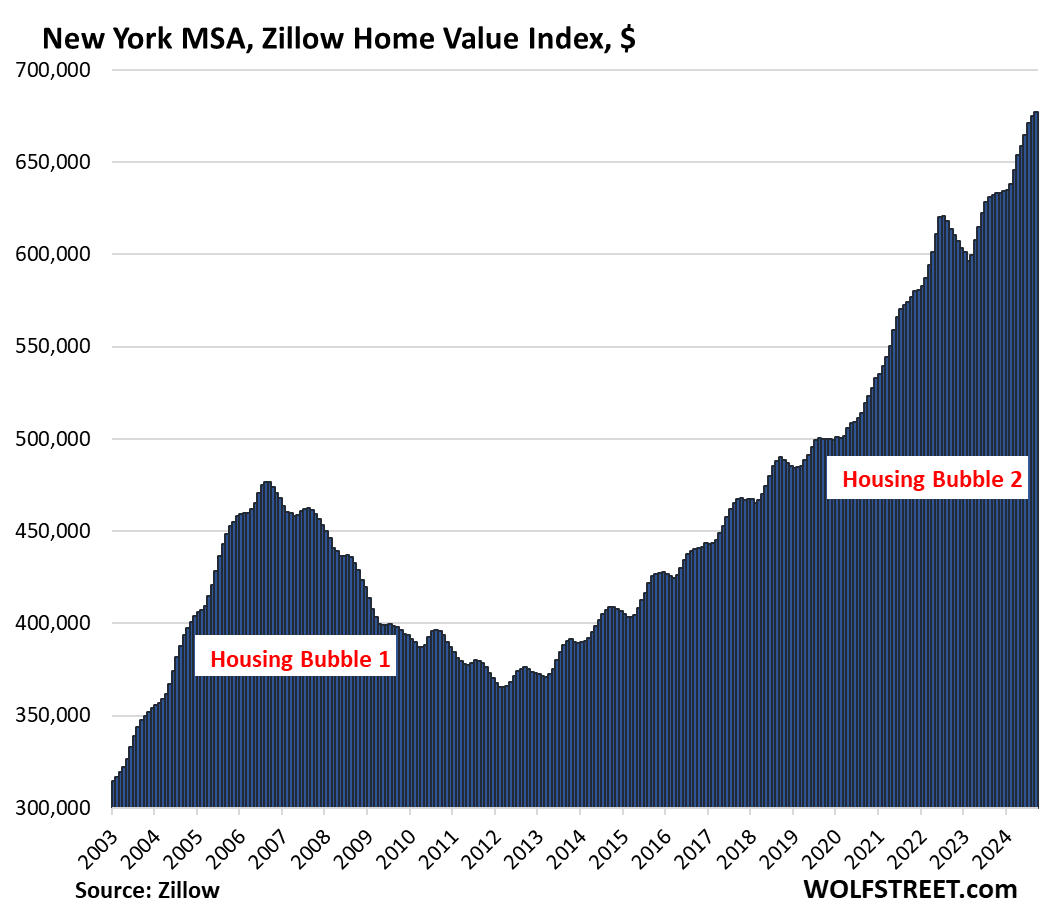
The two exceptions were Baltimore, where prices were unchanged, and the vast New York City metro where prices rose 0.3% to a new high, according to data from the “raw” Zillow Home Value Index (ZHVI).
By Metropolitan Statistical Area (MSA), the top 20 month-to-month price declines:
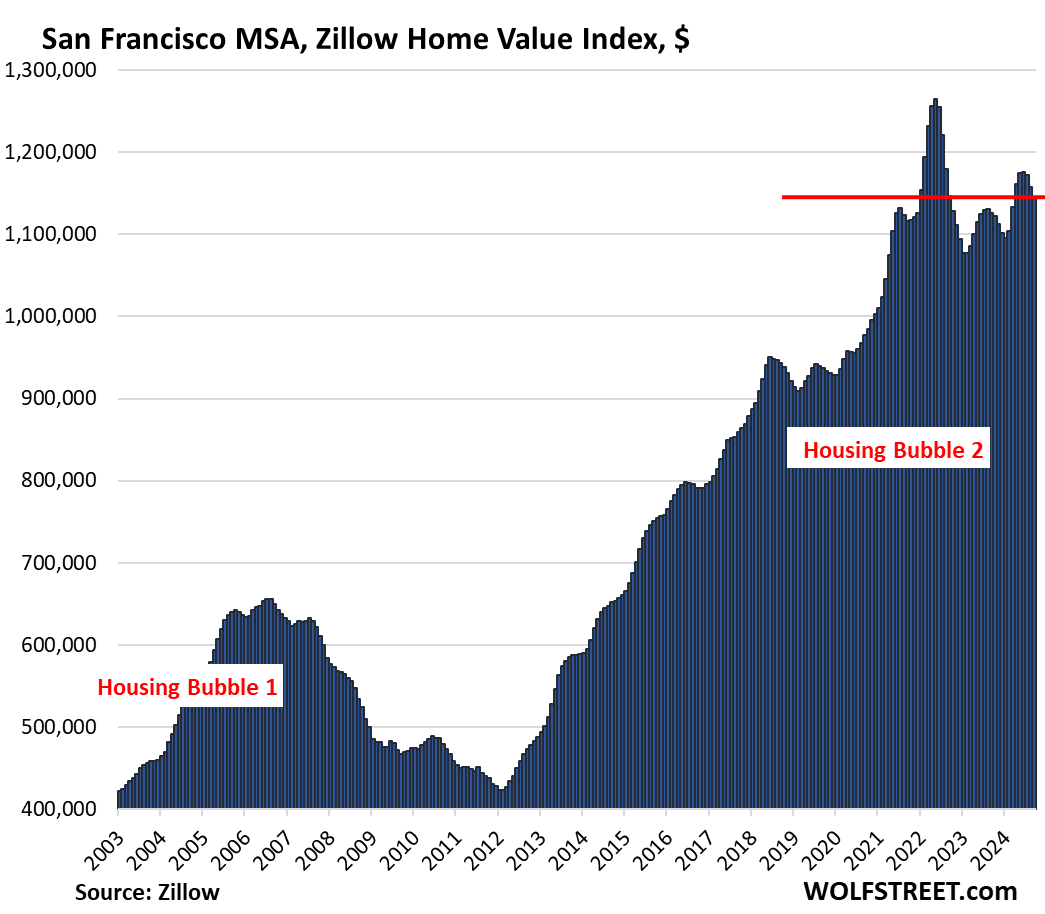
- San Francisco: -1.1%
- San Jose: -0.9%
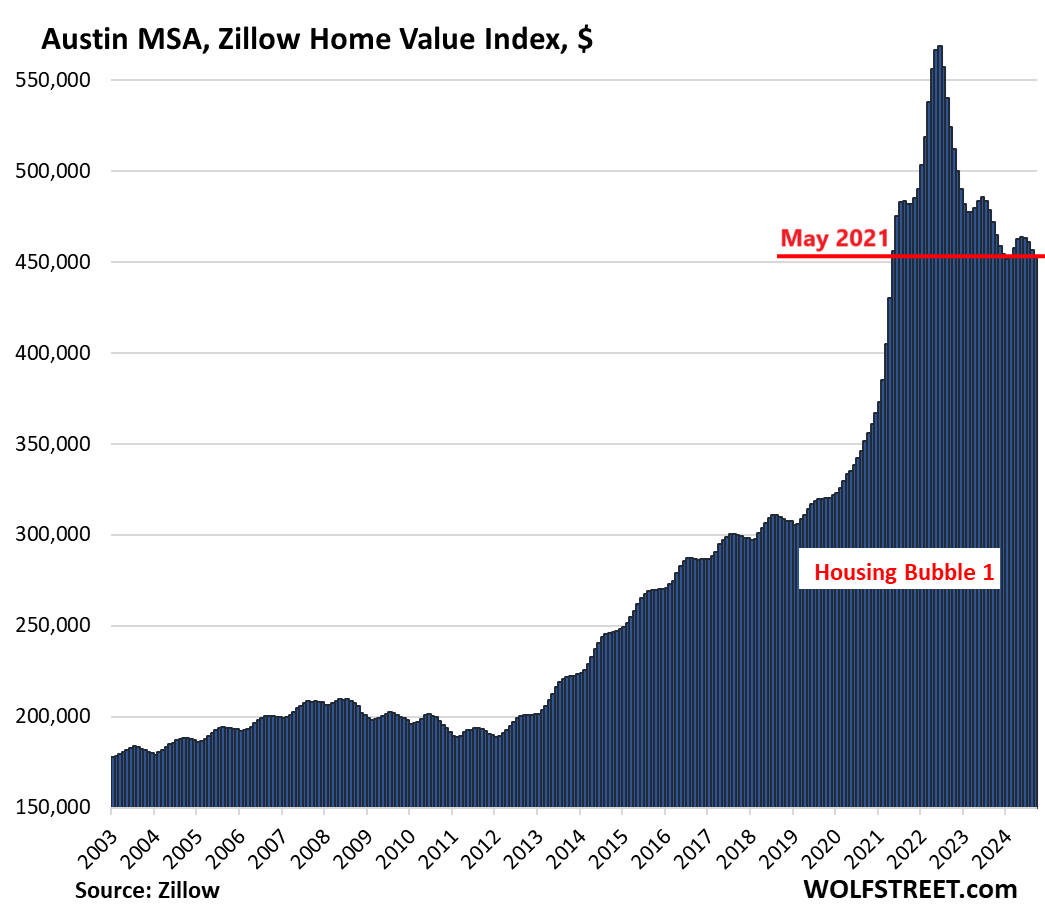
- Austin: -0.8%
- Tampa: -0.7%
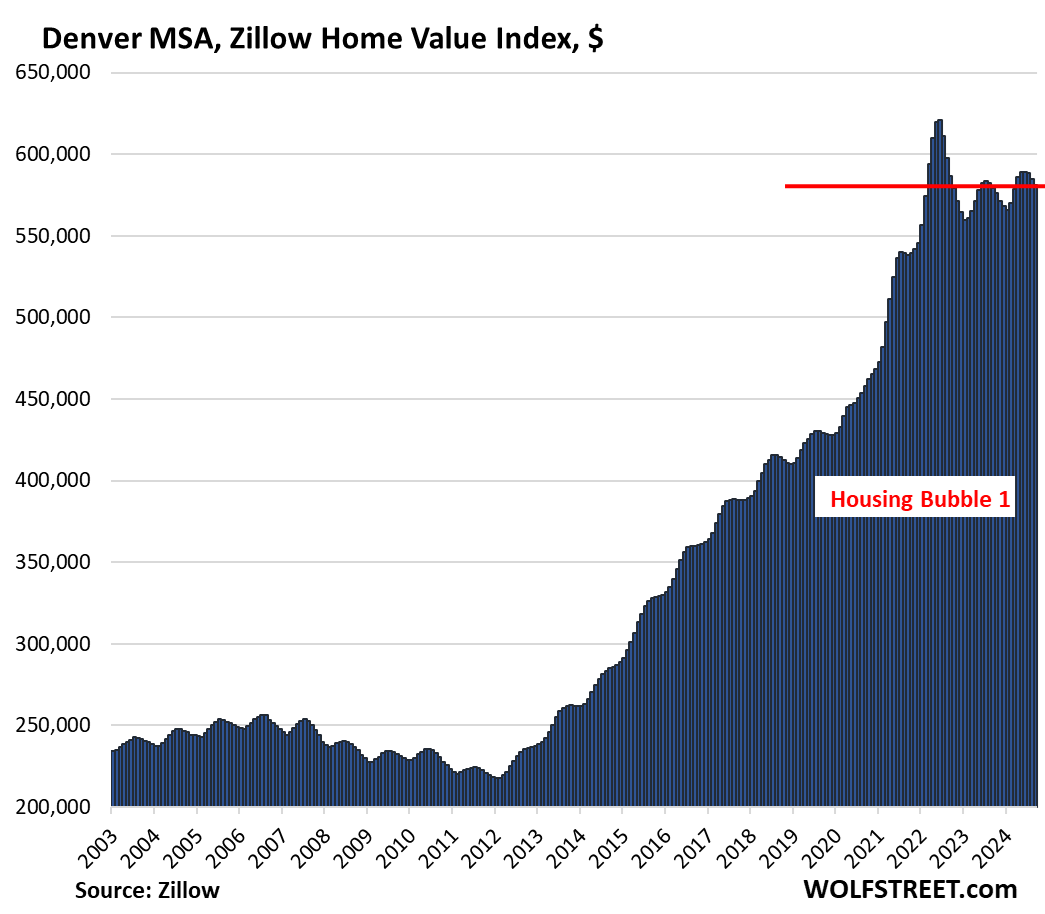
- Denver: -0.6%
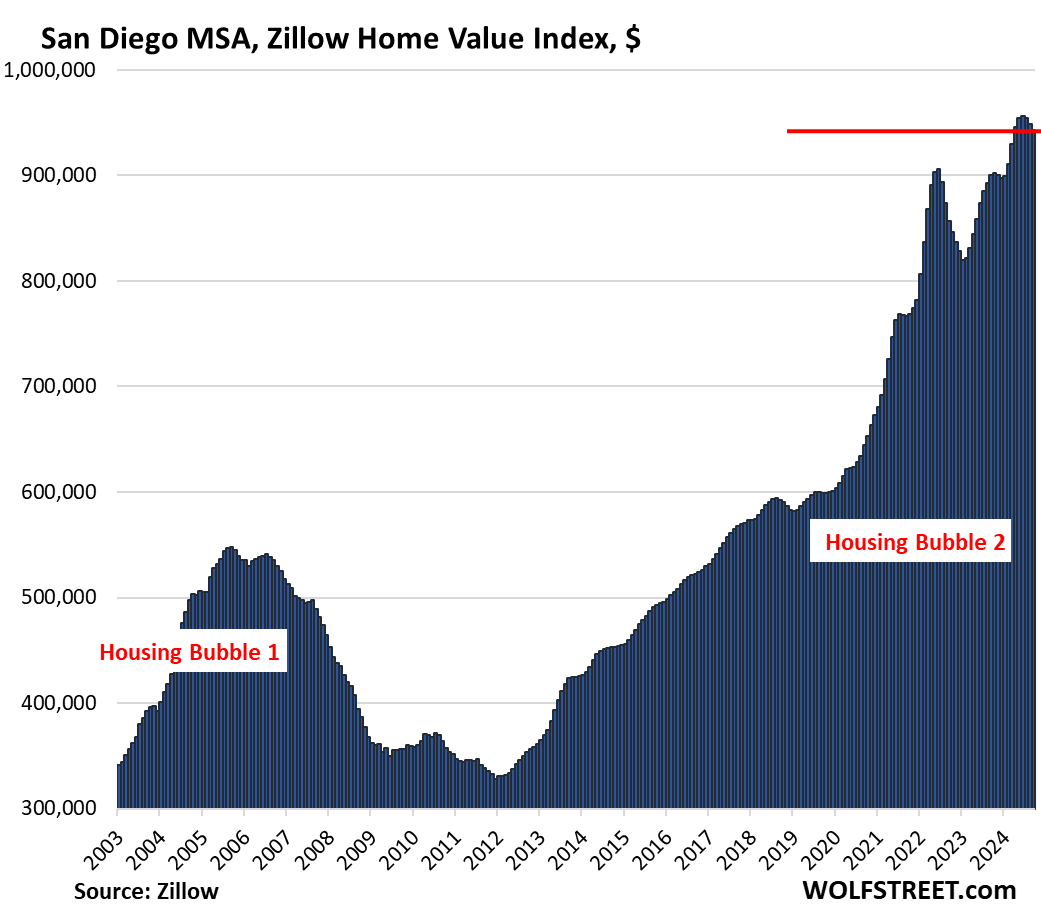
- San Diego: -0.5%
- Sacramento: -0.5%
- Dallas: -0.5%
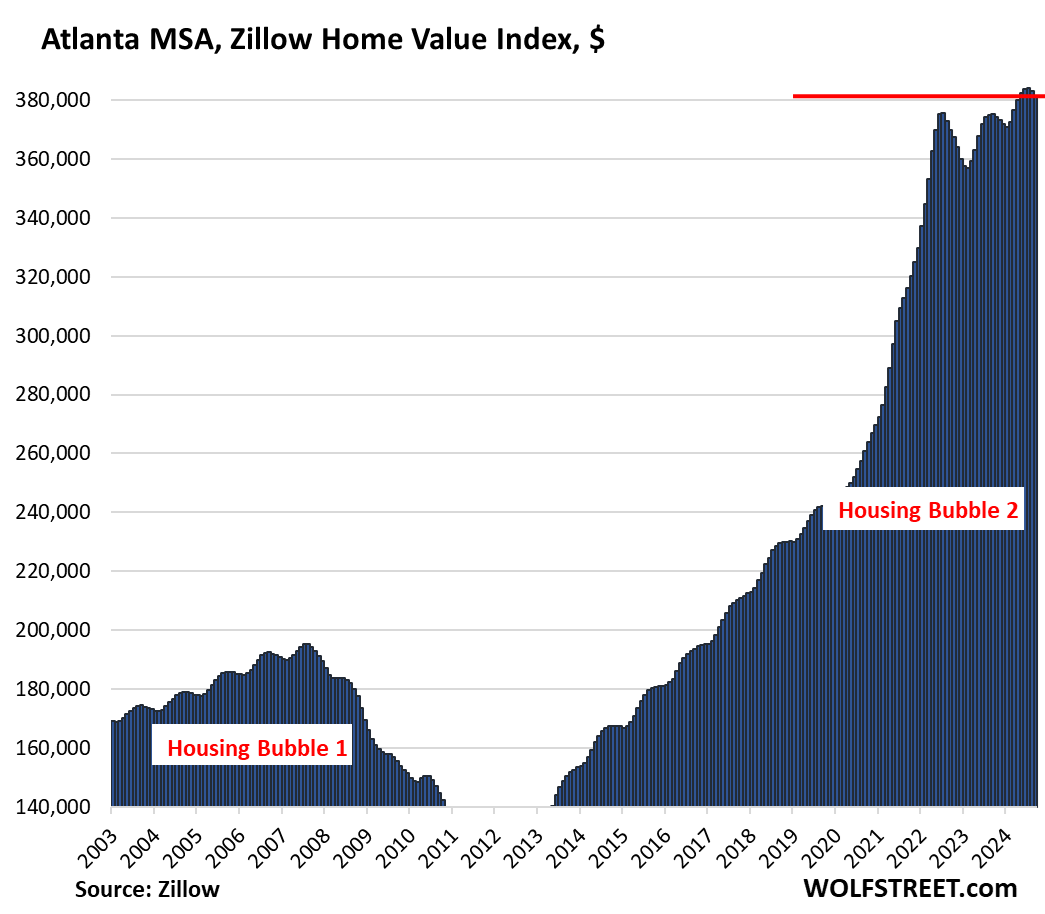
- Atlanta: -0.5%
- Houston: -0.4%
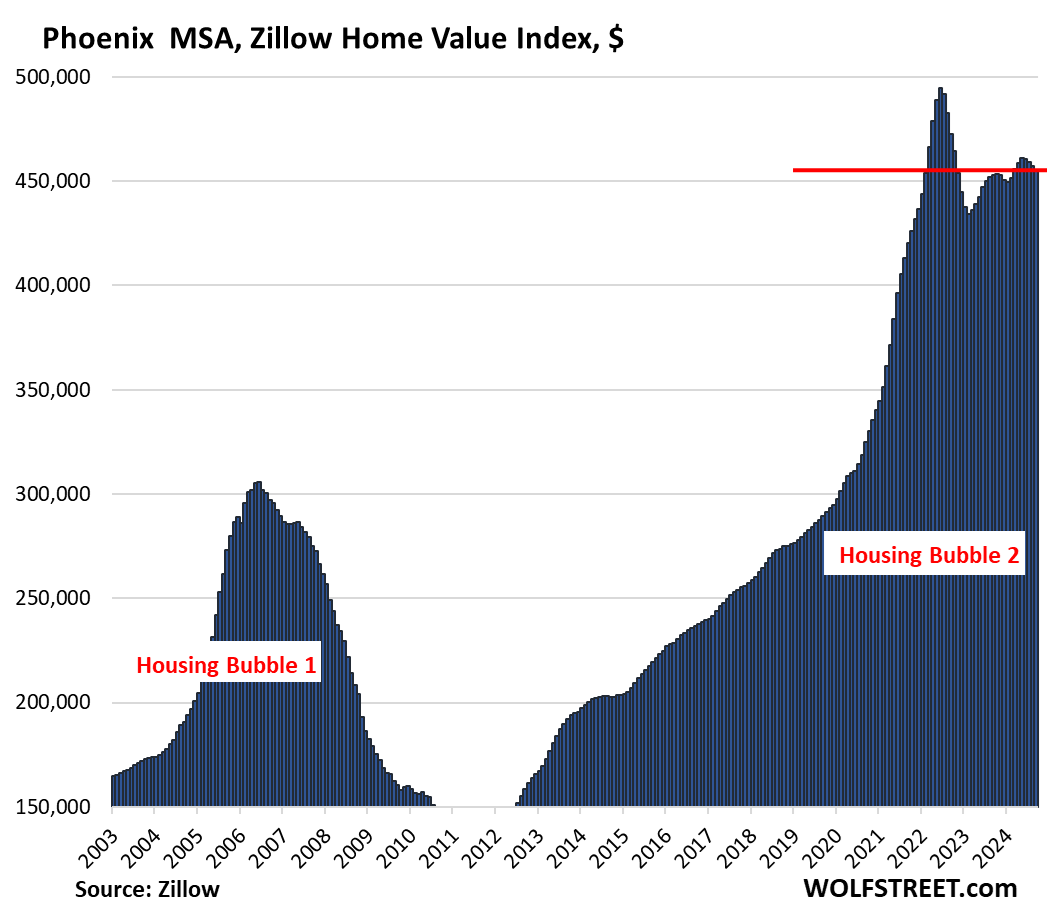
- Phoenix: -0.4%
- Portland: -0.4%
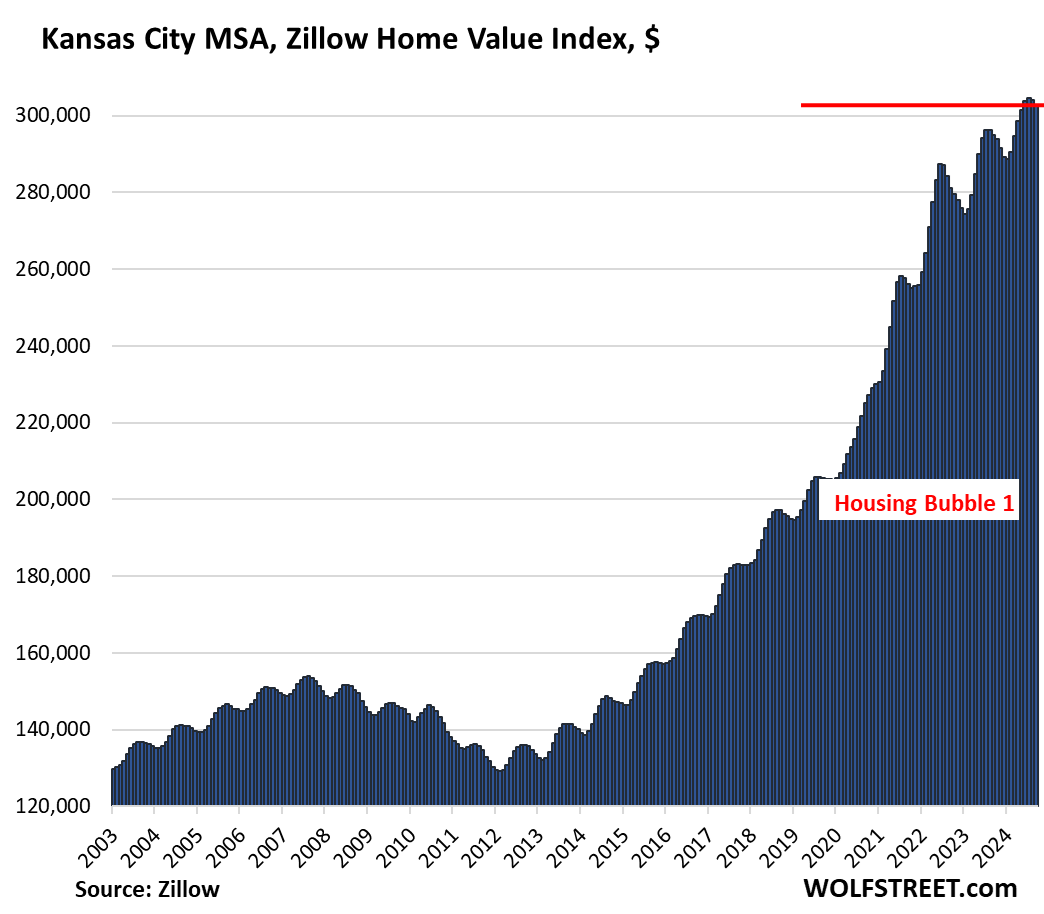
- Kansas City: -0.4%
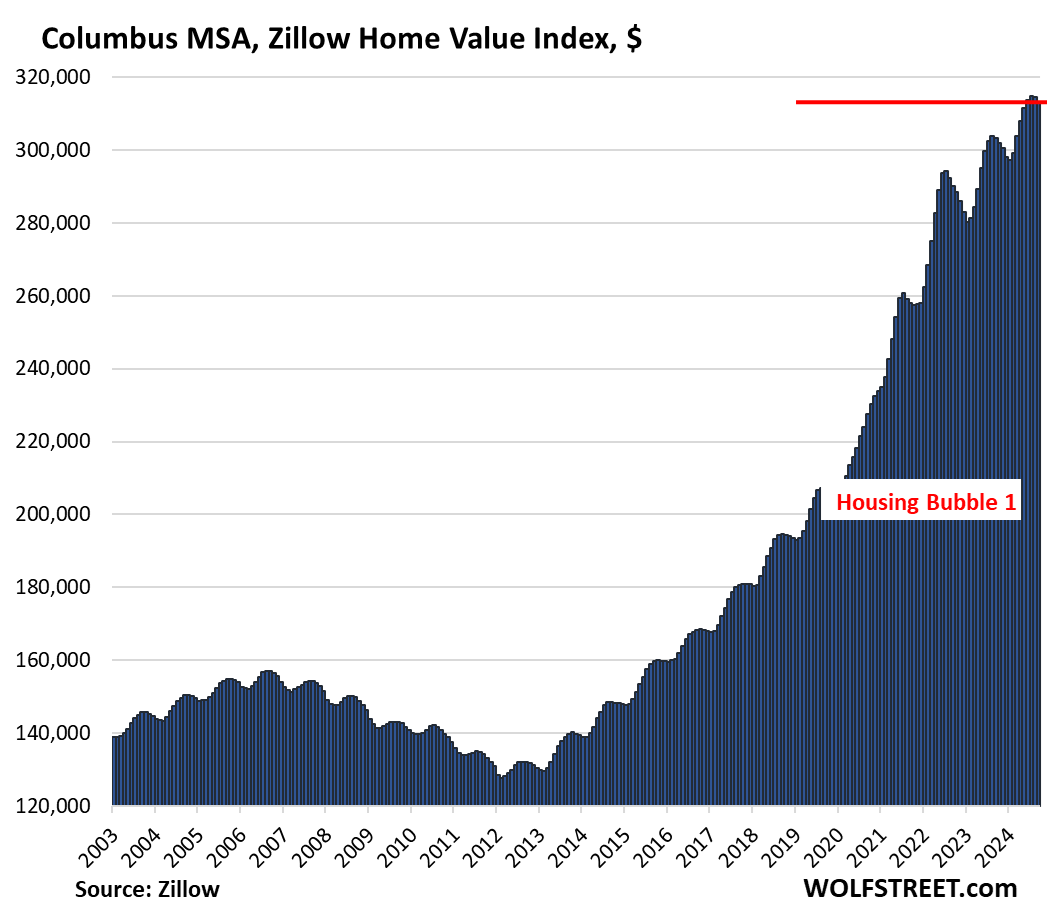
- Columbus: -0.4%
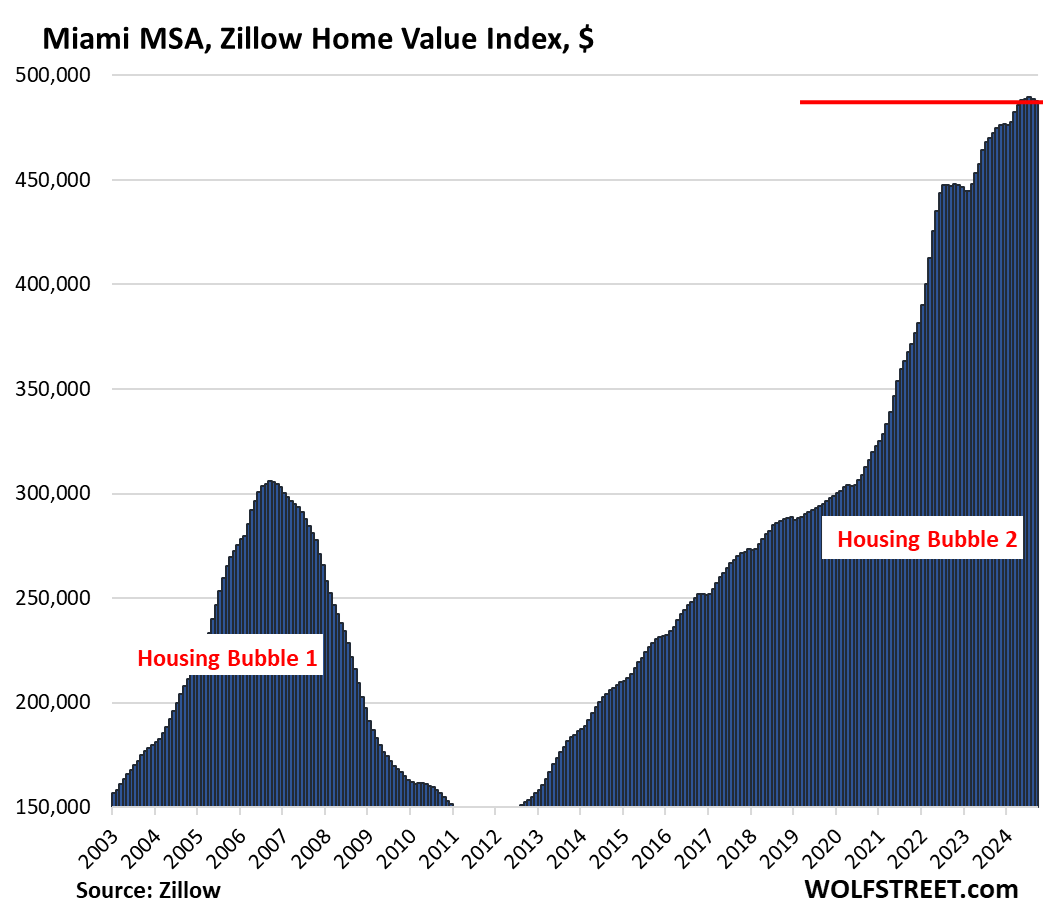
- Miami: -0.3%
- Boston: -0.3%
- Seattle: -0.3%
- Minneapolis: -0.3%
- Charlotte: -0.3%
- Nashville: -0.3%
Down from their 2022 peaks: Home prices in 19 of the 28 MSAs here were down from their peaks in 2022, led by these 10:
- Austin: -20.4%
- San Francisco: -9.4%
- Phoenix: -8.0%
- Denver: -6.4%
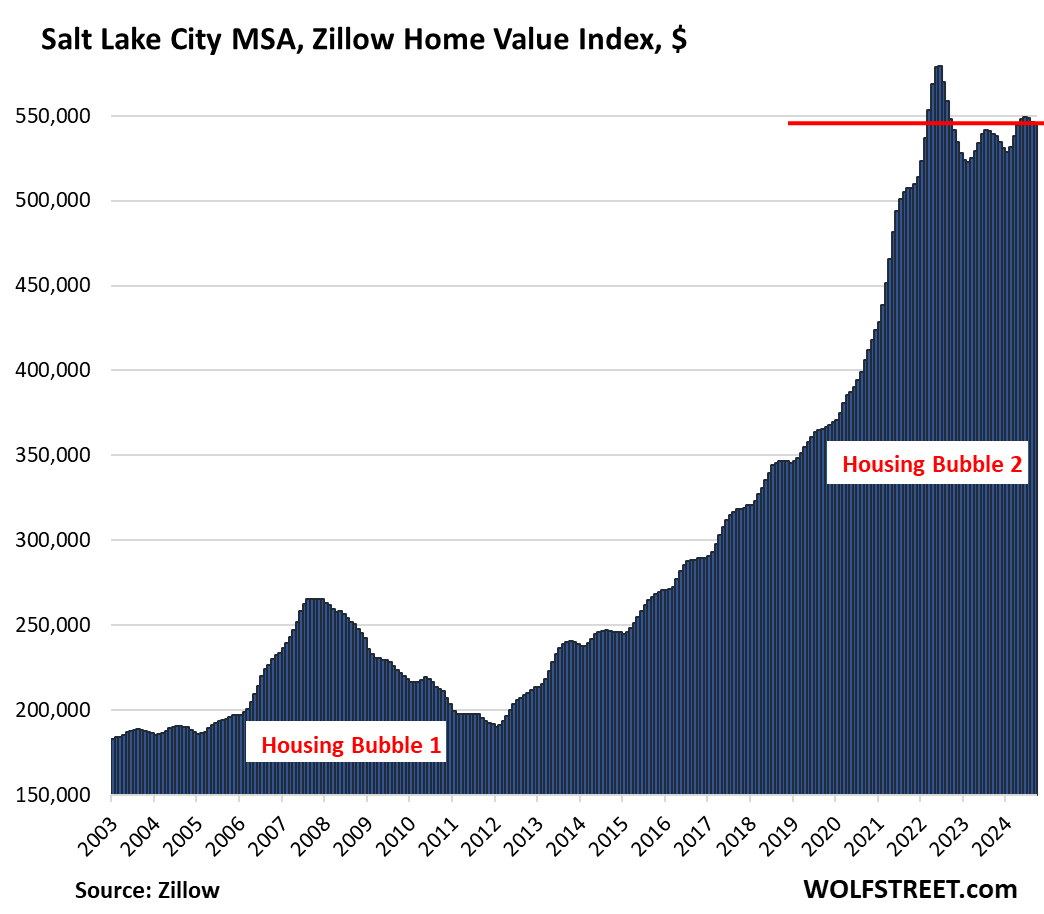
- Salt Lake City: -5.7%
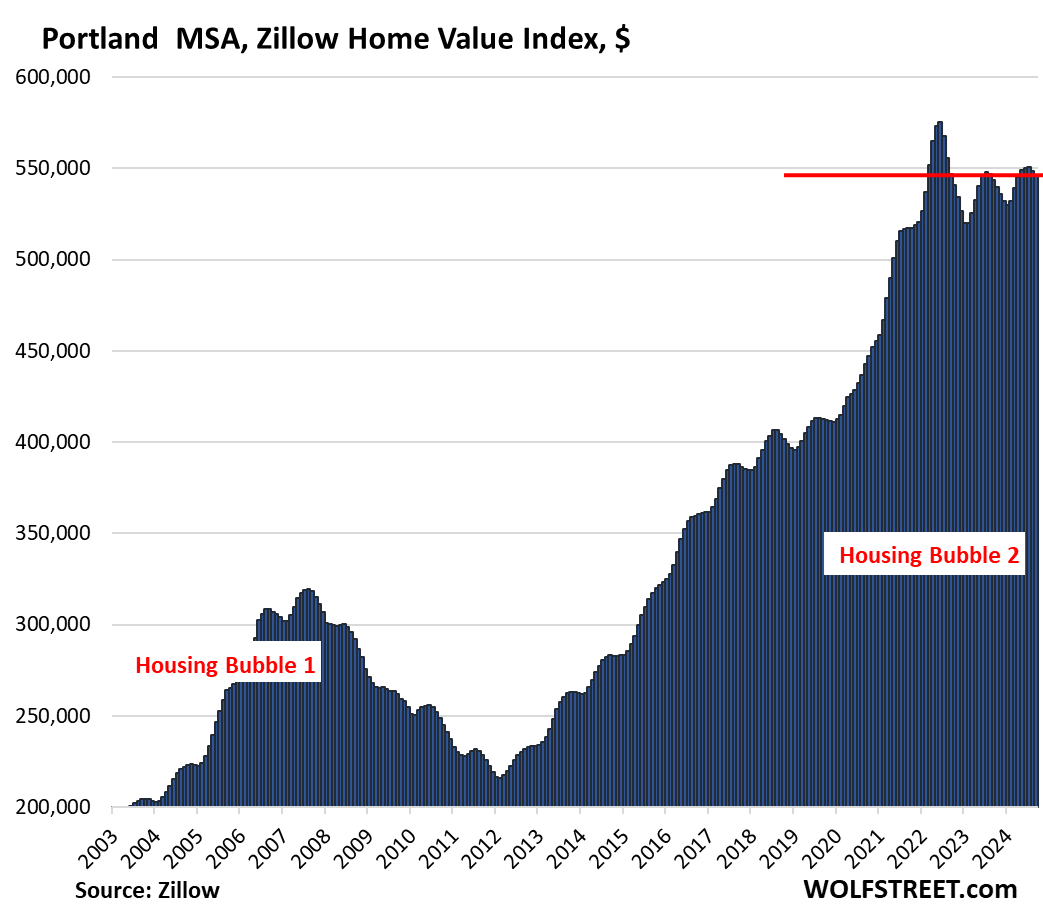
- Portland: -5.1%
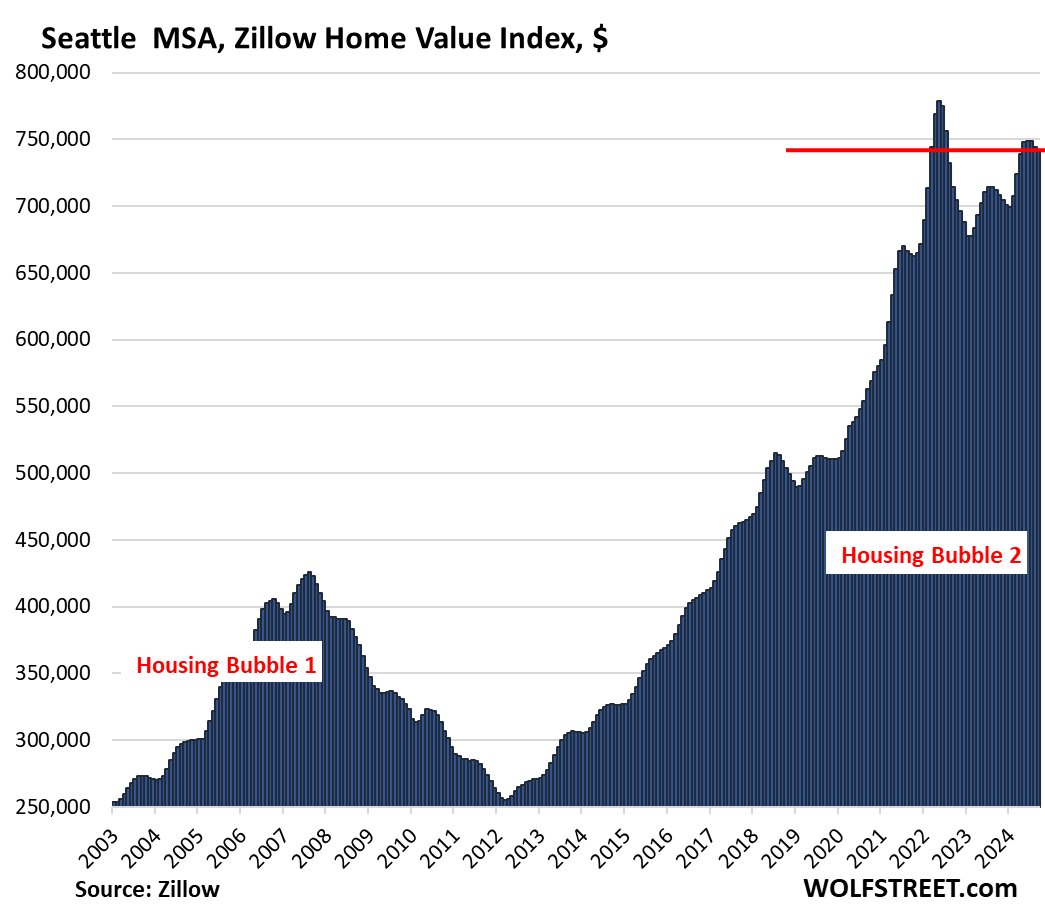
- Seattle: -4.7%
- Dallas: -4.4%
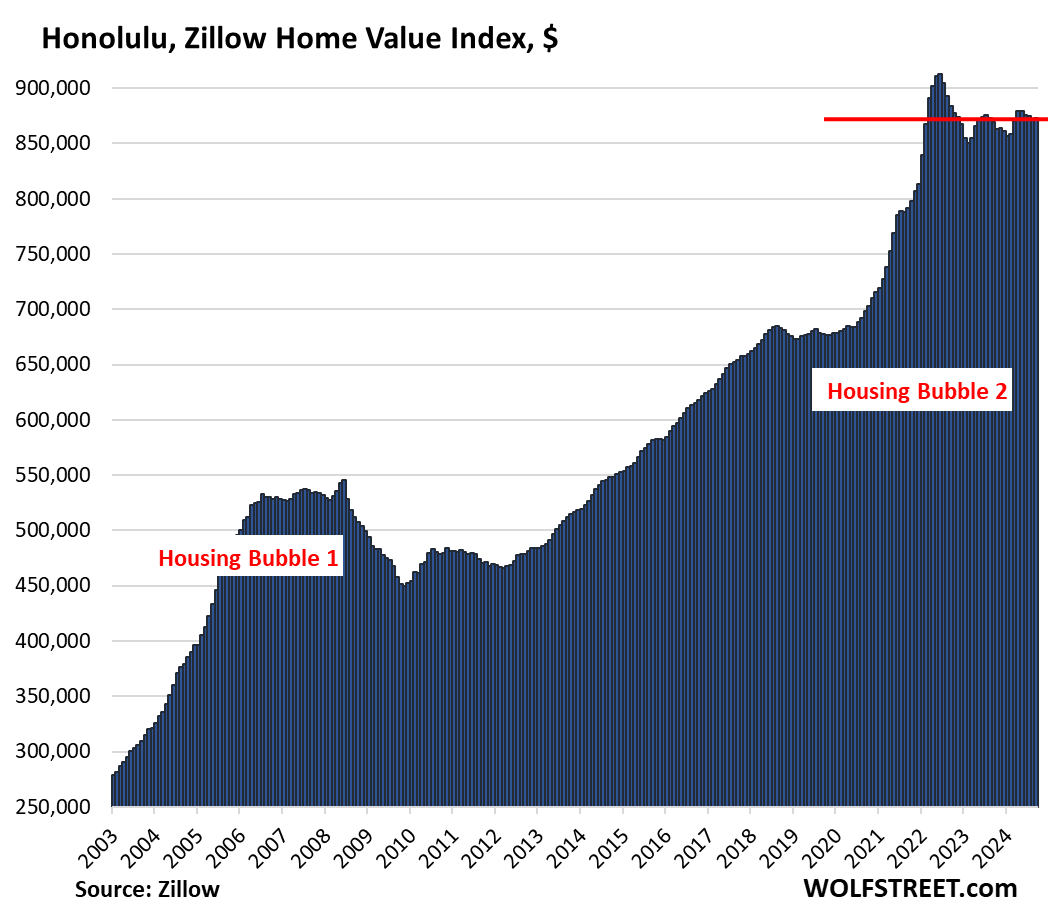
- Honolulu: -4.4%
- Nashville: -2.6%
New highs: Prices in the New York City metro rose to a new high; in Baltimore, they stayed at the new high for the third month in a row.
The 28 Most Splendid Housing Bubbles in America.
| Austin MSA, Home Prices | |||
| From Jun 2022 peak | MoM | YoY | Since 2000 |
| -20.4% | -0.8% | -4.0% | 163% |
The price index has now dropped below where it had been in May 2021.
| San Francisco MSA, Home Prices | |||
| From May 2022 peak | MoM | YoY | Since 2000 |
| -9.4% | -1.1% | 1.7% | 295% |
Methodology: The ZHVI is based on millions of data points in Zillow’s “Database of All Homes,” including from public records (tax data), MLS, brokerages, local Realtor Associations, real-estate agents, and individual households across the US. It includes pricing data for off-market deals and for-sale-by-owner deals. Zillow’s Database of All Homes also has sales-pairs data.
| Phoenix MSA, Home Prices | |||
| From Jun 2022 peak | MoM | YoY | Since 2000 |
| -8.0% | -0.4% | 0.5% | 224% |
To qualify for this list, the market must be one of the largest Metropolitan Statistical Areas (MSA) by population, and it must have a current ZHVI of over $300,000. The metros of New Orleans, Oklahoma City, Tulsa, Cincinnati, Pittsburgh, etc. don’t qualify because their ZHVI is below $300,000, though they too had huge runups of home prices in recent years.
| Denver MSA, Home Prices | |||
| From Jun 2022 peak | MoM | YoY | Since 2000 |
| -6.4% | -0.6% | 0.3% | 215% |
| Salt Lake City MSA, Home Prices | |||
| From July 2022 peak | MoM | YoY | Since 2000 |
| -5.7% | -0.1% | 1.3% | 214% |
| Portland MSA, Home Prices | |||
| From May 2022 peak | MoM | YoY | Since 2000 |
| -5.1% | -0.4% | 0.5% | 220% |
We started this series in 2017 to document visually and metro-by-metro the massive surge in home prices triggered by years of interest rate repression and QE by the Fed. But since 2022, we have much higher mortgage rates and QT, and the dynamics have changed.
We explained here why we switched to the “raw” ZHVI after years of using the Case-Shiller Home Price Index.
| Honolulu, Home Prices | |||
| From Jun 2022 peak | MoM | YoY | Since 2000 |
| -4.4% | 0.1% | 0.4% | 282% |
| Seattle MSA, Home Prices | |||
| From May 2022 peak | MoM | YoY | Since 2000 |
| -4.7% | -0.3% | 4.3% | 240% |
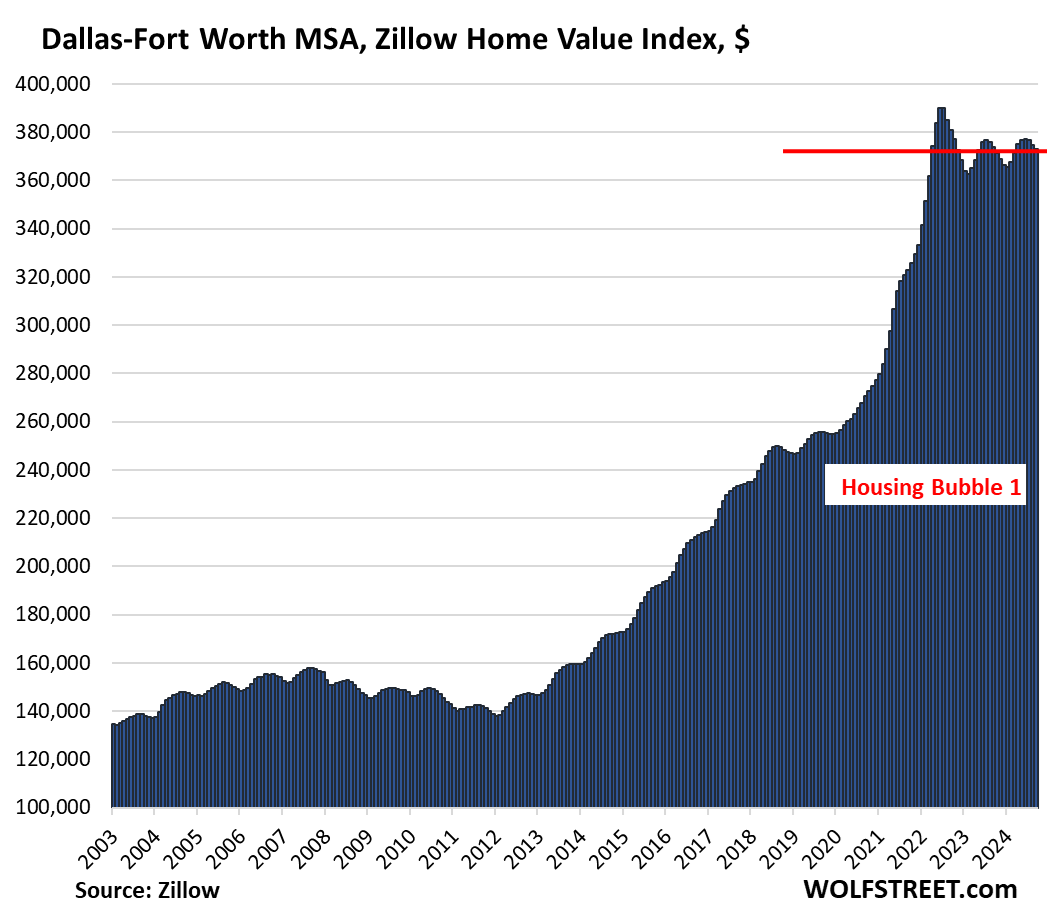
| Dallas-Fort Worth MSA, Home Prices | |||
| From Jun 2022 peak | MoM | YoY | Since 2000 |
| -4.4% | -0.5% | -0.3% | 198% |
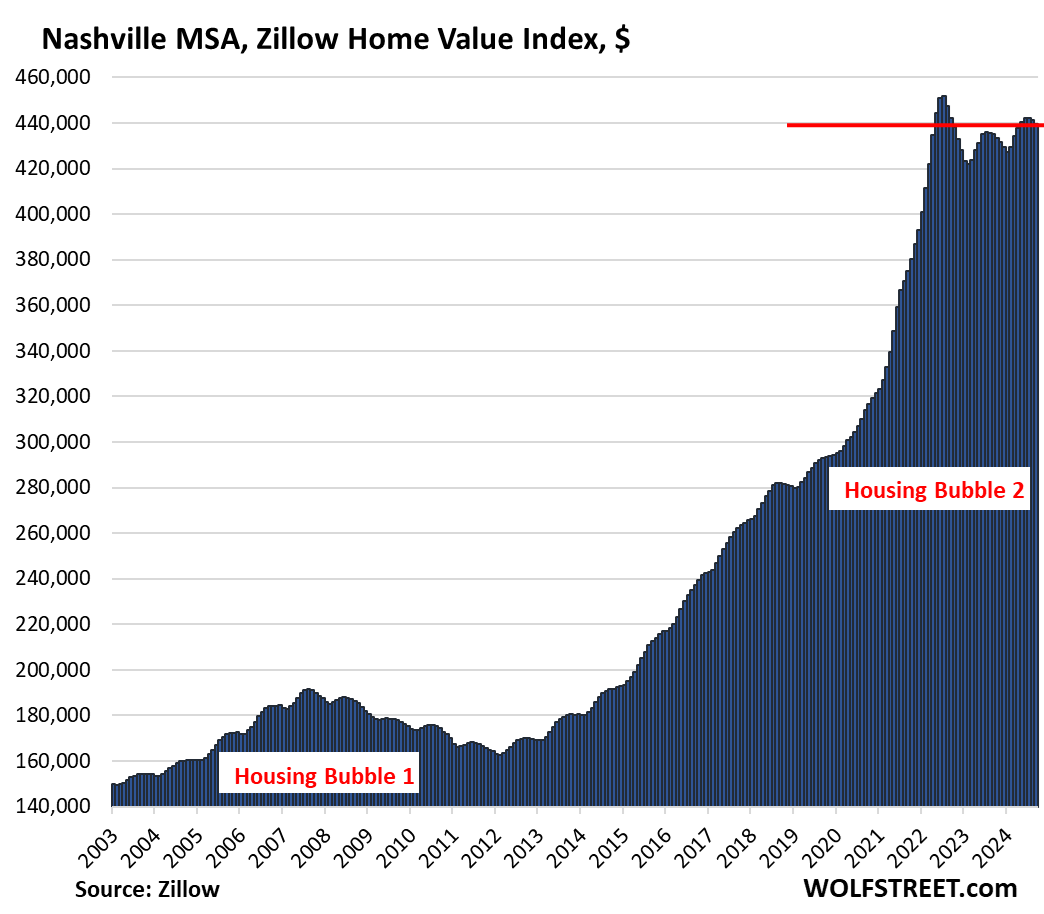
| Nashville MSA, Home Prices | |||
| From July 2022 peak | MoM | YoY | Since 2000 |
| -2.6% | -0.3% | 1.1% | 219% |
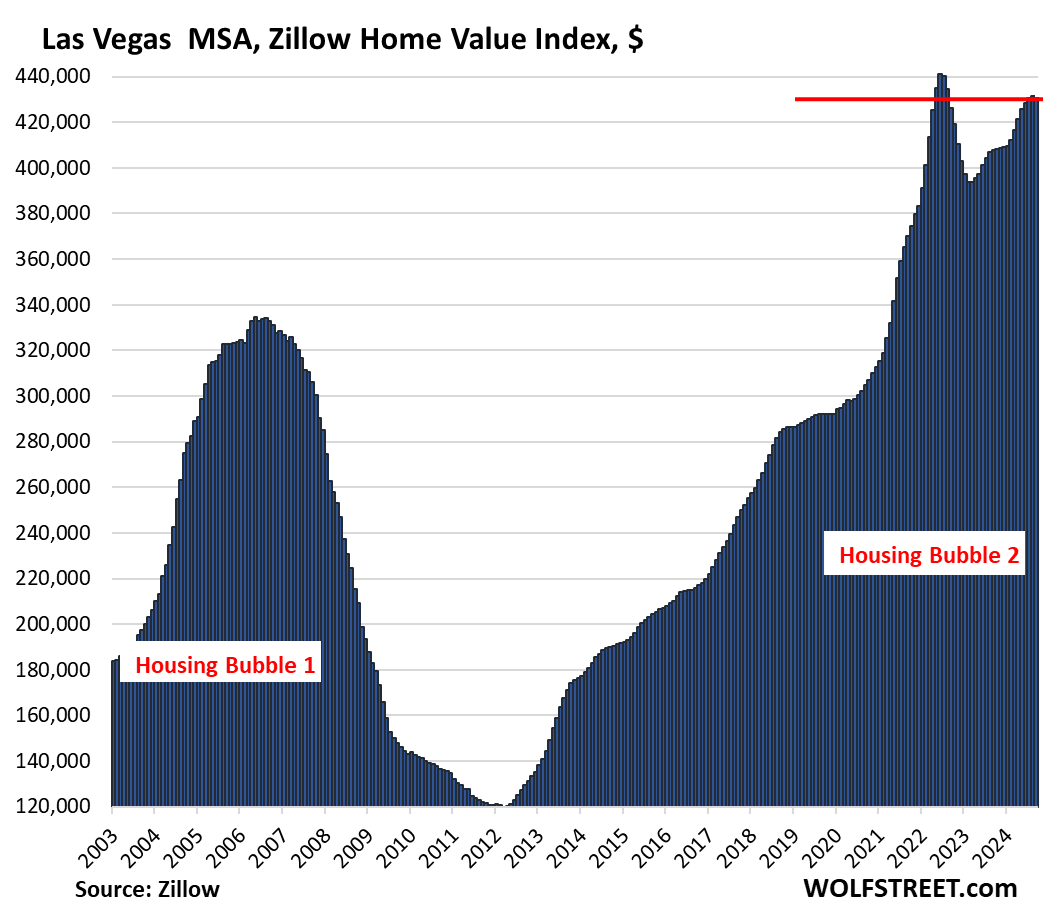
| Las Vegas MSA, Home Prices | |||
| From June 2022 peak | MoM | YoY | Since 2000 |
| -2.2% | -0.1% | 5.7% | 179% |
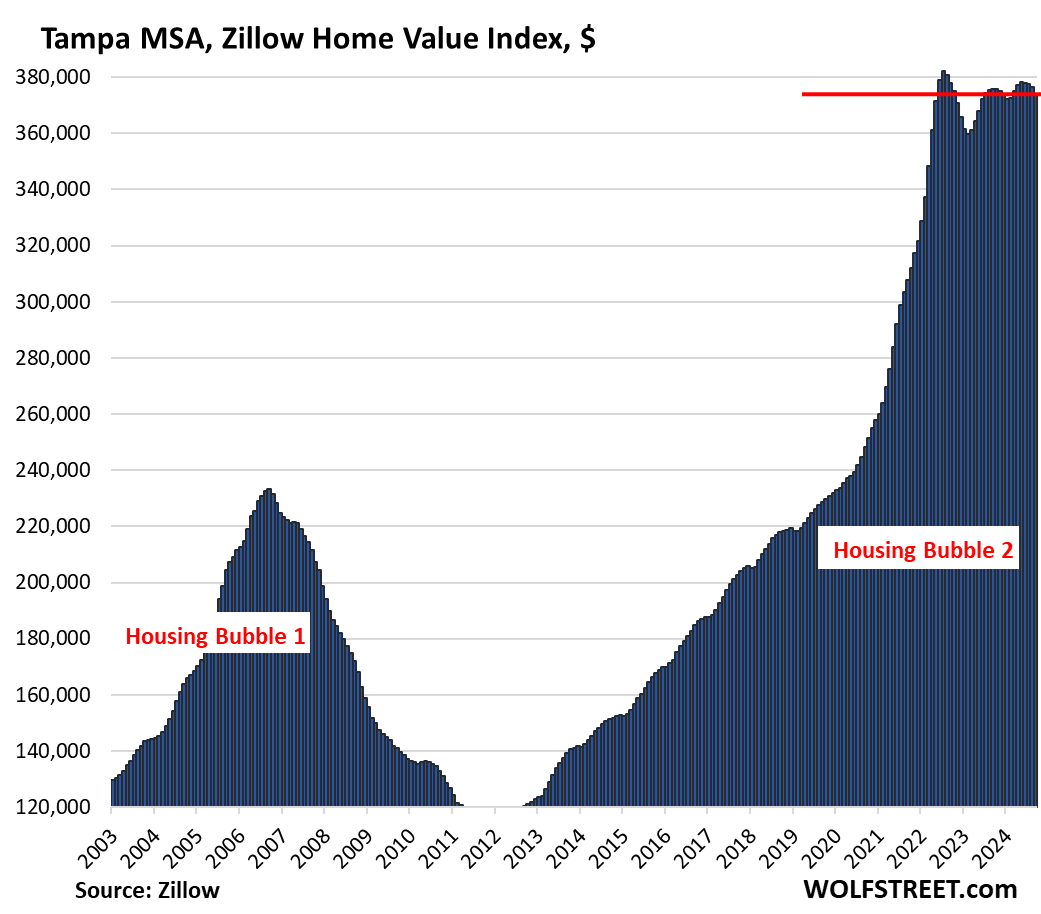
| Tampa MSA, Home Prices | |||
| From Jul 2022 peak | MoM | YoY | Since 2000 |
| -2.3% | -0.4% | -0.3% | 216% |
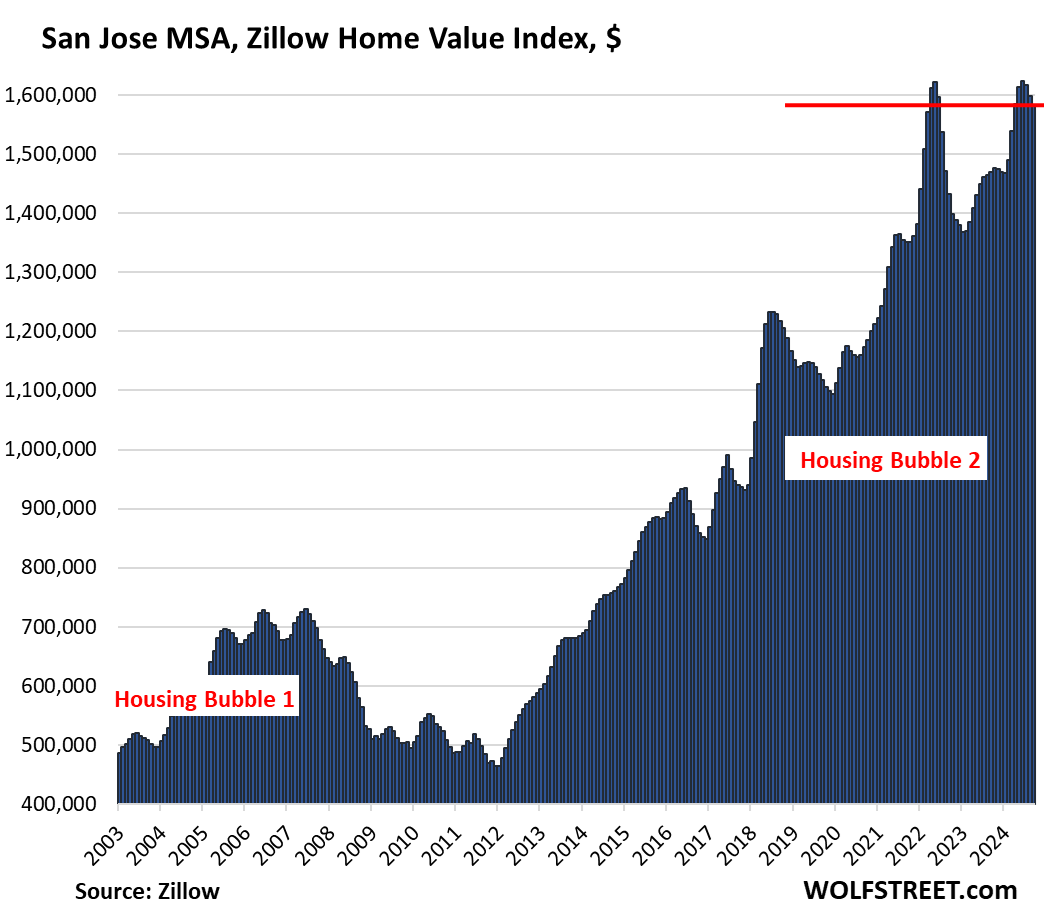
| San Jose MSA, Home Prices | |||
| From May 2022 peak | MoM | YoY | Since 2000 |
| -2.4% | -0.9% | 7.8% | 336% |
If these charts look funny, in an absurd sort of way, the way housing market charts should never ever look, it’s because this housing market has been whipped into crazy distortions by the Fed’s monetary policies that then U-turned in 2022, including nearly $2 trillion in QT by now.
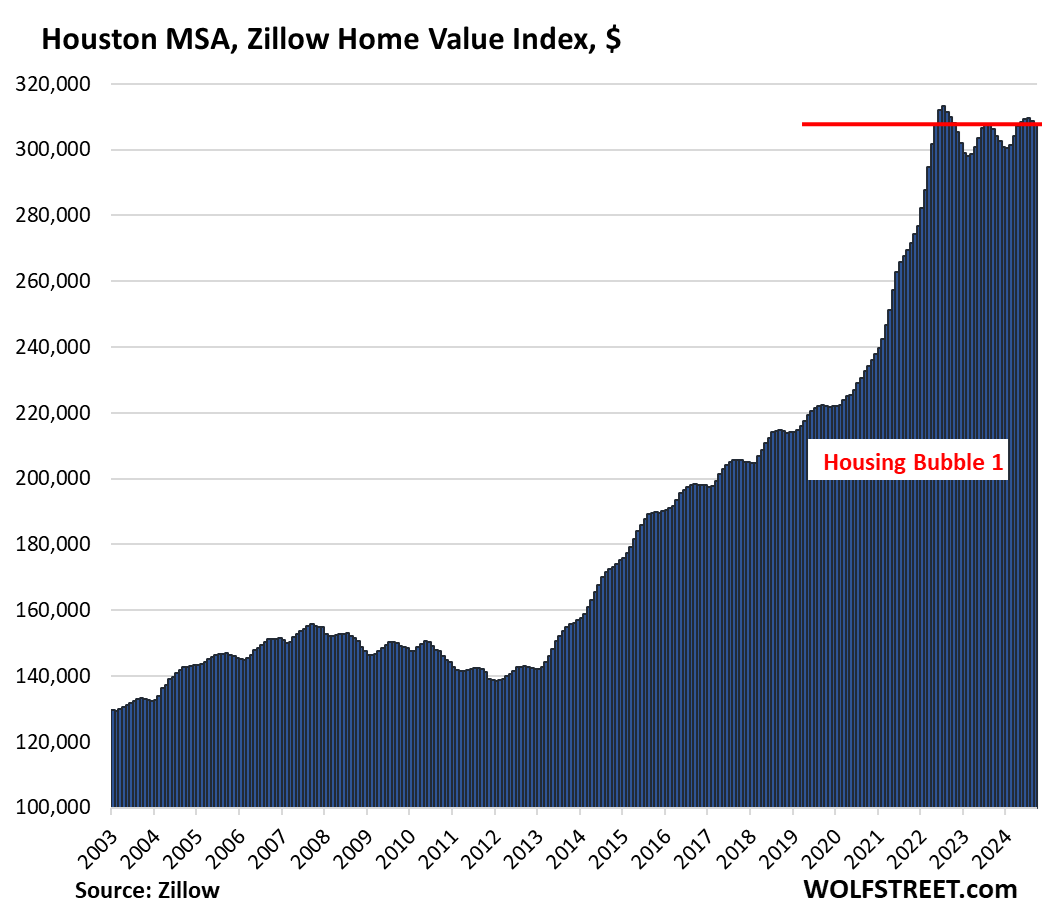
| Houston MSA, Home Prices | |||
| From Jul 2022 peak | MoM | YoY | Since 2000 |
| -1.9% | -0.4% | 0.4% | 154% |
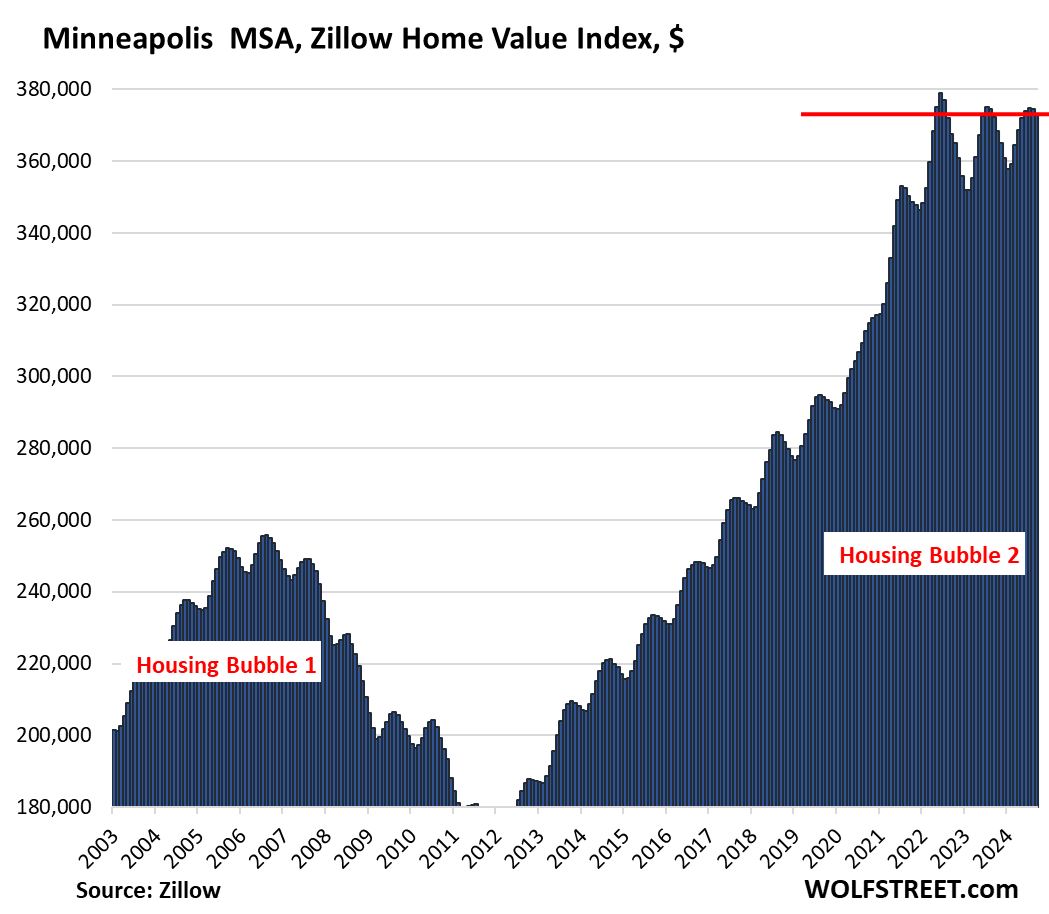
| Minneapolis MSA, Home Prices | |||
| From May 2022 peak | MoM | YoY | Since 2000 |
| -1.5% | -0.3% | 0.2% | 159% |
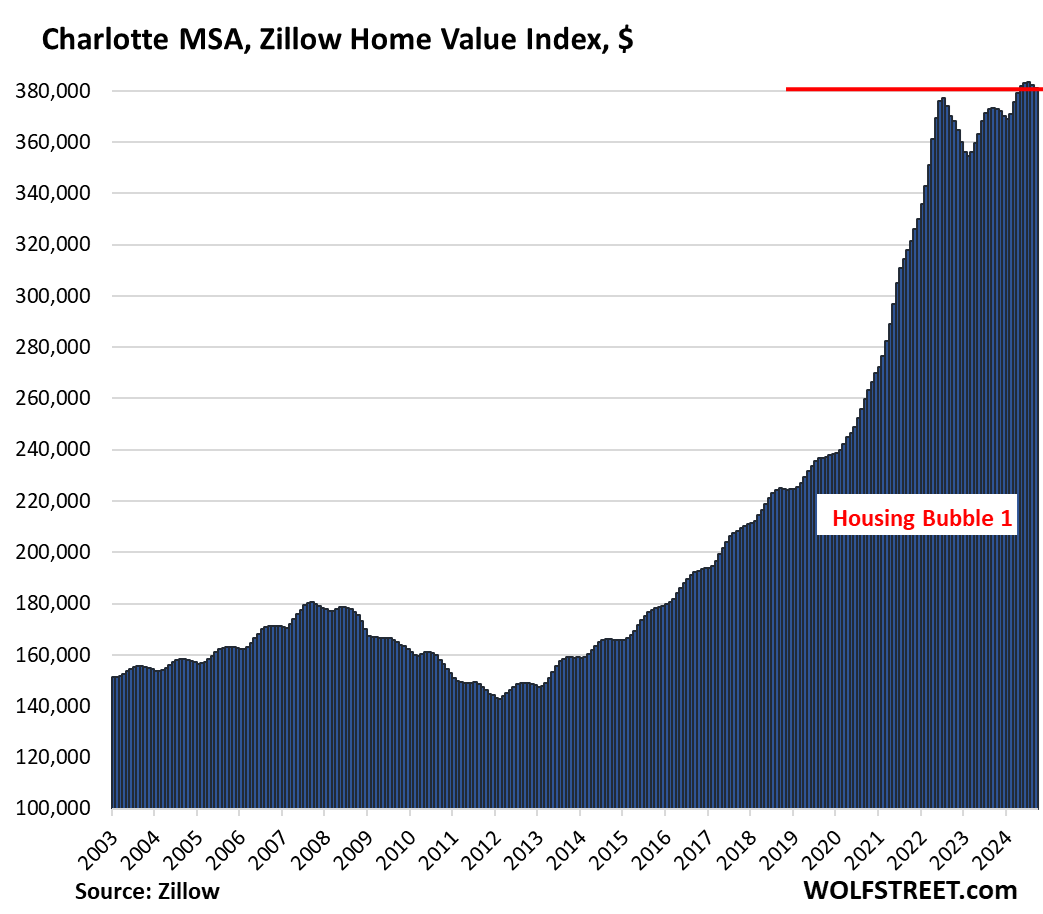
| Charlotte MSA, Home Prices | |||
| MoM | YoY | Since 2000 | |
| -0.3% | 2.1% | 172.6% | |
| San Diego MSA, Home Prices | ||
| MoM | YoY | Since 2000 |
| -0.5% | 4.8% | 338% |
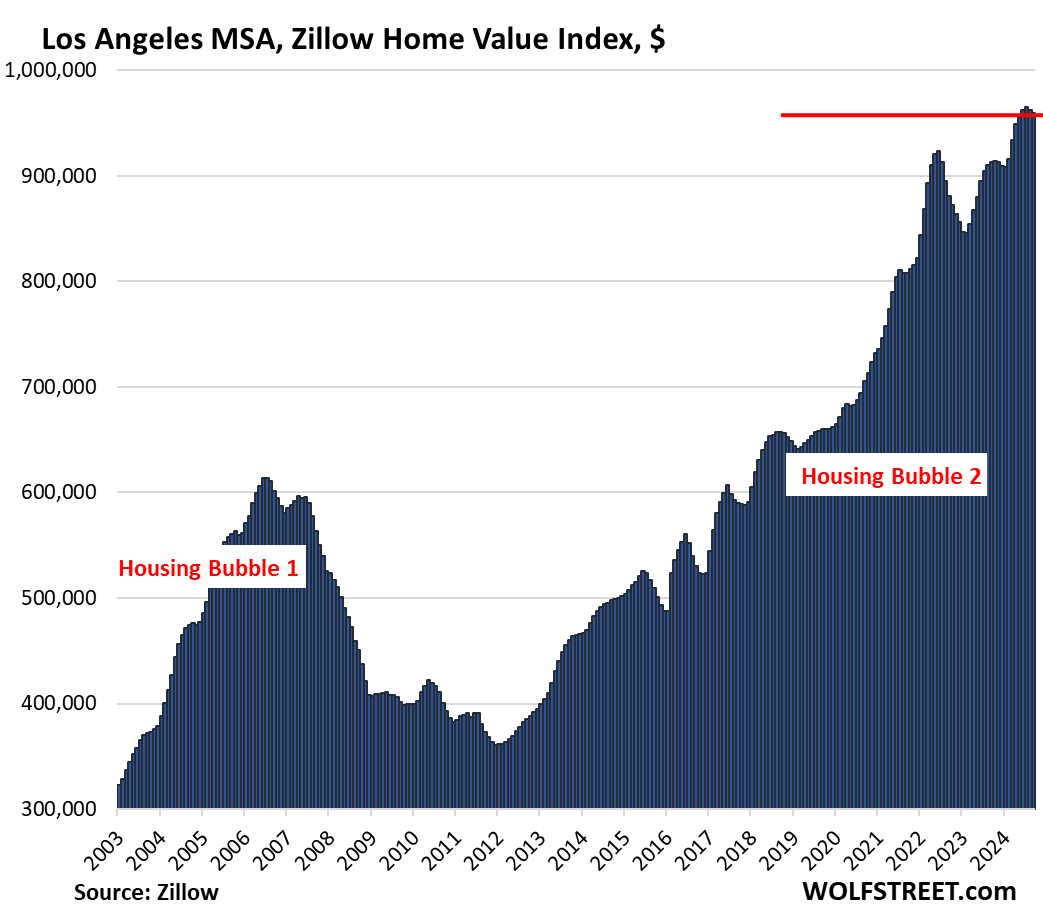
| Los Angeles MSA, Home Prices | ||
| MoM | YoY | Since 2000 |
| -0.3% | 5.1% | 332% |
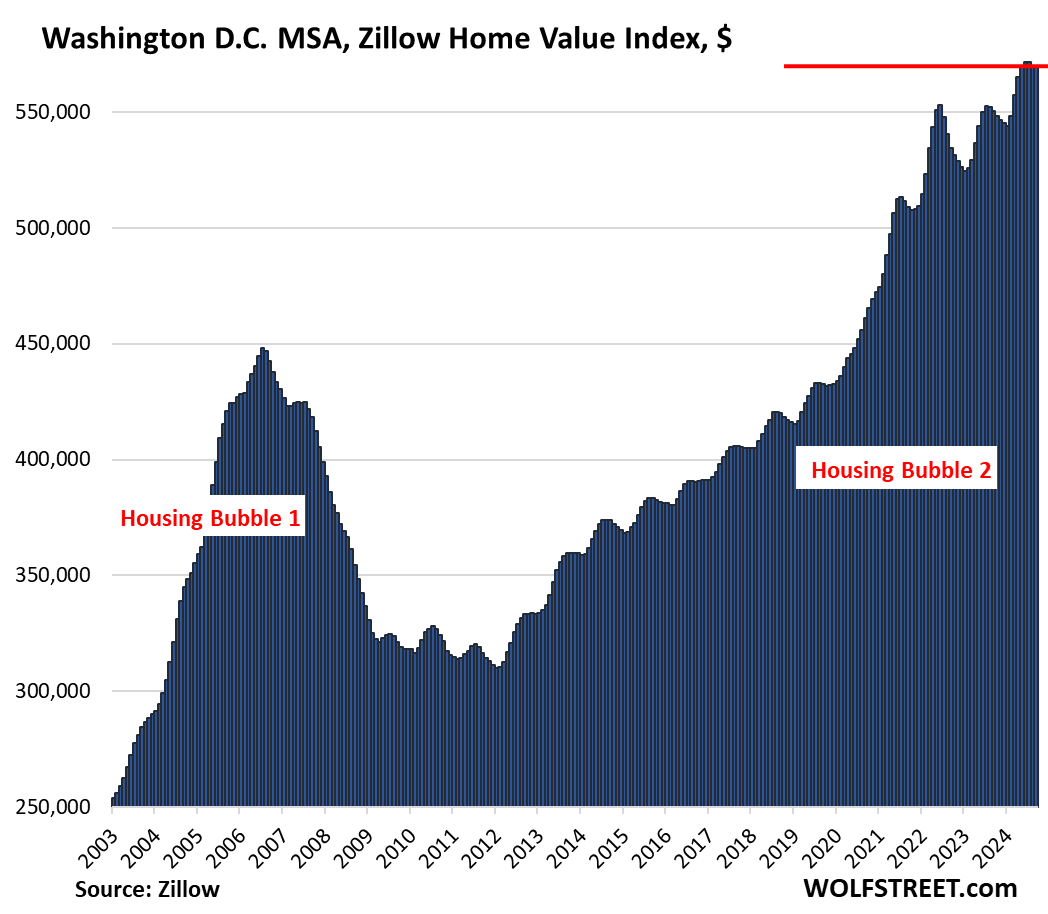
| Washington D.C. MSA, Home Prices | |||
| MoM | YoY | Since 2000 | |
| 0.0% | 3.5% | 215% | |
| Baltimore MSA, Home Prices | |||
| MoM | YoY | Since 2000 | |
| 0.0% | 2.5% | 175% | |
| Miami MSA, Home Prices | ||
| MoM | YoY | Since 2000 |
| -0.3% | 3.2% | 335.0% |
| Atlanta MSA, Home Prices | ||
| MoM | YoY | Since 2000 |
| -0.5% | 1.6% | 166% |
| Kansas City MSA, Home Prices | ||
| MoM | YoY | Since 2000 |
| -0.4% | 2.7% | 178% |
| Columbus MSA, Home Prices | ||
| MoM | YoY | Since 2000 |
| -0.4% | 3.2% | 155% |
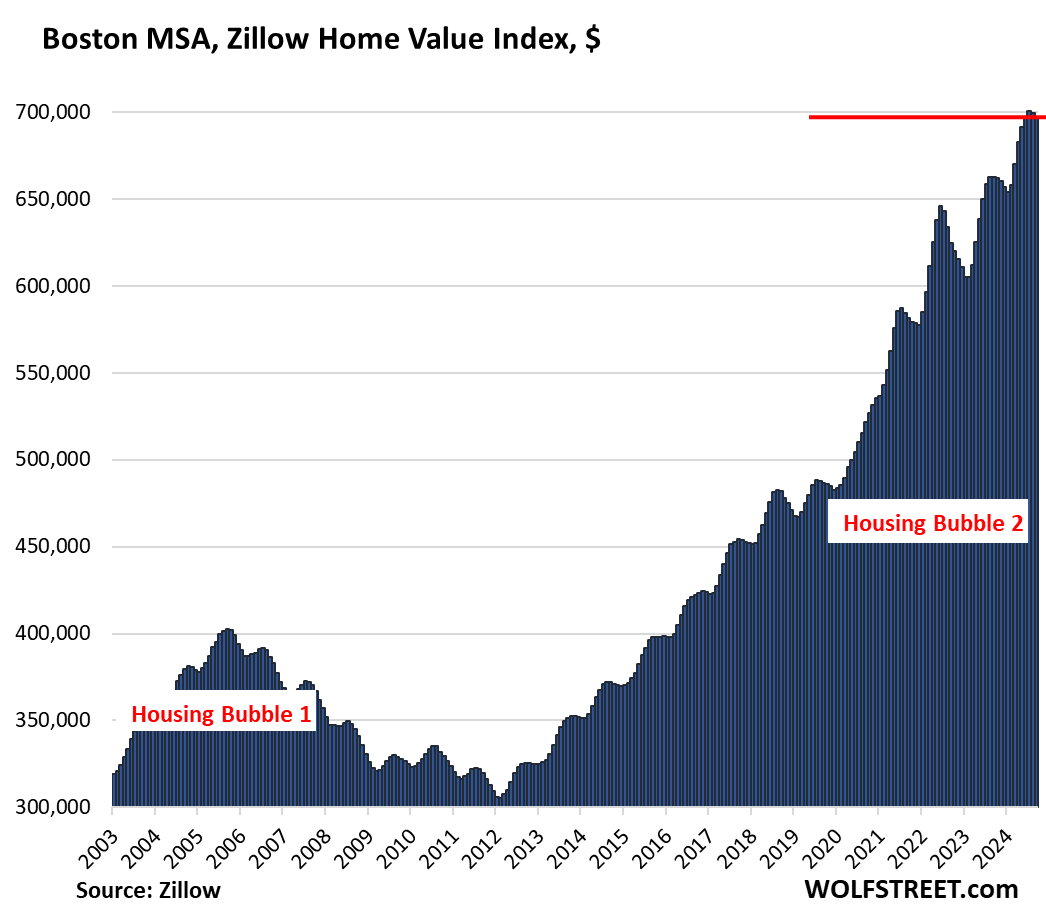
| Boston MSA, Home Prices | ||
| MoM | YoY | Since 2000 |
| -0.3% | 5.2% | 228% |
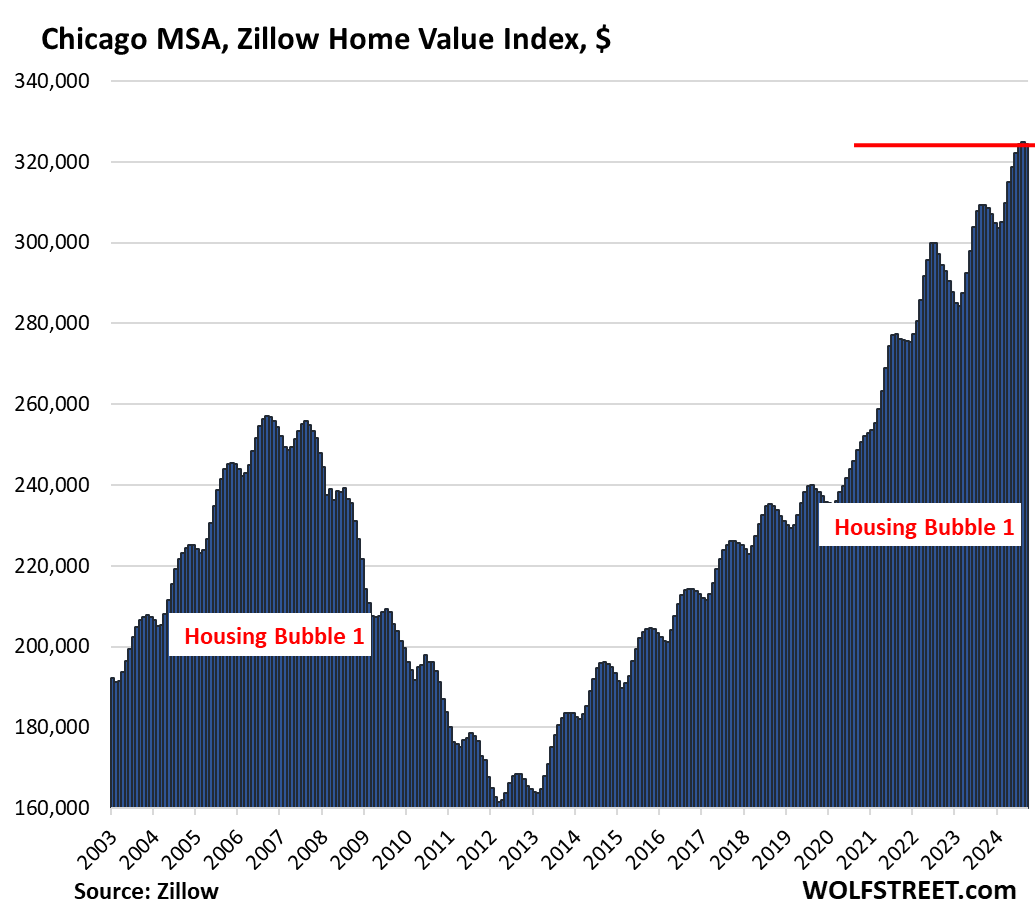
| Chicago MSA, Home Prices | ||
| MoM | YoY | Since 2000 |
| -0.2% | 4.9% | 114% |
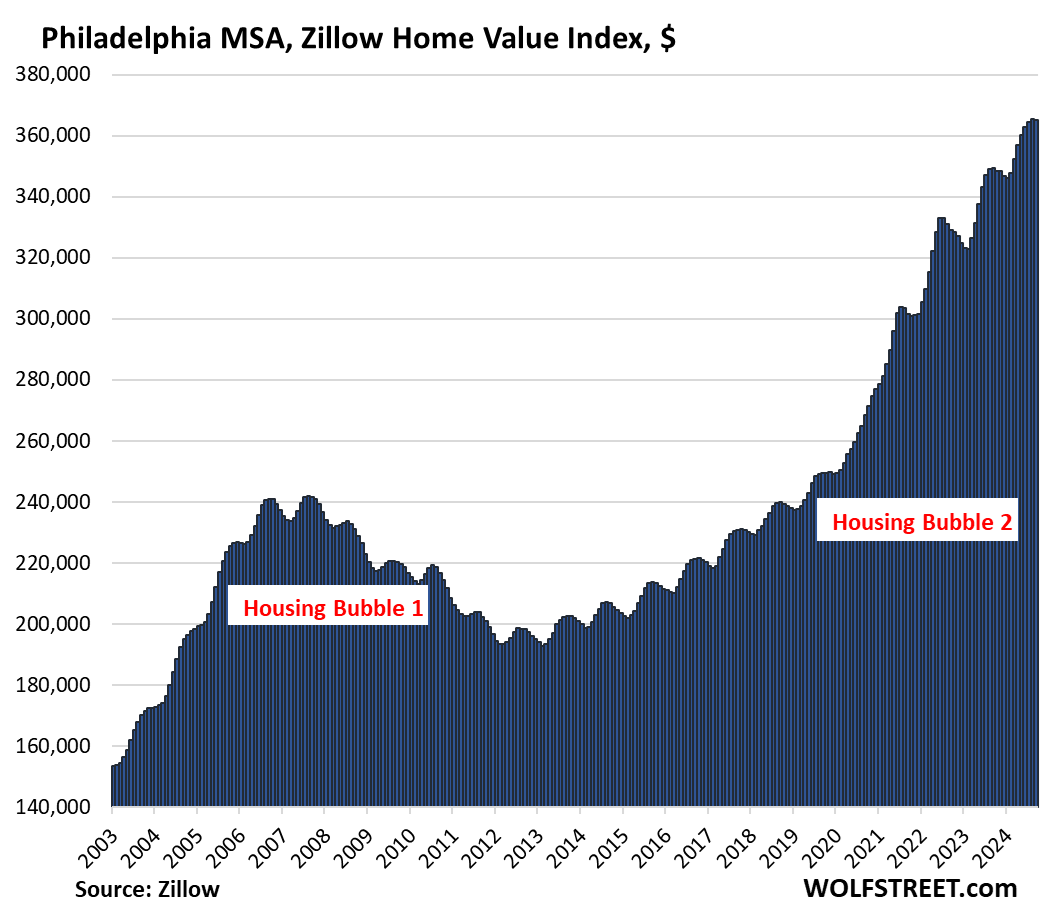
| Philadelphia MSA, Home Prices | ||
| MoM | YoY | Since 2000 |
| -0.1% | 4.5% | 202% |
| New York MSA, Home Prices | ||
| MoM | YoY | Since 2000 |
| 0.3% | 7.1% | 212% |
Enjoy reading WOLF STREET and want to support it? You can donate. I appreciate it immensely. Click on the mug to find out how:

![]()
Just mentioning LA & San Diego, I know one reader here is going to be stoked.
That’ll be me I guess and stoked? Not yet and not even close, these drop is the definition of watching paint dry…at least it’s dripping down, that’s if hopefully by Spring season, it doesn’t shoots back up again. Wake me up when we start getting some momentum like we saw 2021 to 2022 drop…-0.5% drop in SD is hardly cause for celebration and RE market take time, although in all fairness, the insanity that shot up surely didn’t take as long as conventional wisdom…once in a lifetime event perhaps..
That’s cool, either way it goes, unless it will unwind back to fundamentals in 3 years, I mentally are checking out of the housing market…will observe at a distant with contempt, disdain and amusement as a spectator to the circus.
There you are.
I feel you man, it’s not as bad in Phx but it ain’t great.
Patience will pay off for us.
Regression to the mean is a rule in numbers that cannot be escaped.
But there are two curves involved that may have different rates of mean reversion: (1) house prices, and (2) one’s own lifespan. Someday is nice to hope for, but as Keynes said, mashed with Fight Club, in the long run, the lifespan curve reverts to zero. Whereas we’re less sure when the house price curve might be reverting, and to where.
“…wherever you go, there you are…”
-Buckaroo Banzai
may we all find a better day.
I couldn’t have said it better, I’m in the exact same boat.
CA has such a property tax scam. One house can be paying next to nothing bc they bought it back in the day and the next house $10-15k. Yes its great if you bought in (were alive) back in the day but what about everyone else?
Ummm, that’s how the world works. Your neighbor bought his car/boat/RV when rates were lower. Is that unfair? Your other neighbor went to college in the 80s and graduated with no debt. Is that unfair?
JS, I do not think you understand the CA real estate tax system. Different than everywhere else
My car and boat taxes aren’t expected to fund schools and local infrastructure.
Do you expect your income taxes to be lower just because you’re older?
That isn’t at all how it works in any other state. Everywhere else you pay the same property tax.
The vast waves of arrivals in CA meant huge new burdens on all resources. Middle class people here would be taxed out onto the street, to pay for costs incurred due to newbies. Hence the law that has so many in a twist.
Generally speaking in a free market system, arriving first at anywhere or anything does confer a premium. That is the reward for intelligence and resourcefulness. Arriving late has costs, and should.
The people with the real advantage in CA bought multi-unit apartments before the tax reform, and the RE prices surged. They have pure cash-generating machines. I see them, retired blissfully with very expensive workout gear and all day to play. I think there is an inter-generational break there too.
Arguably a fairer system would have everyone paying the same rate regardless of when they purchased their home. The current system has a bias toward those who have owned longer. In essence a transfer of the tax burden toward the younger demographic, giving a break to the older demographic.
Organize and vote. Get some representation.
If you can afford to pay today’s prices, you can afford today’s taxes. Working class people used to be able to afford homes. Their real income has come nowhere close to keeping up with the power couples and tech people with inflated salaries driving up home prices everywhere. So the solution is to tax them out of their homes?
Exactly. Bruce wants grandma on SS to be paying the same property tax as the idiots who bought a $500K house for over $1M. And as if CA’s mostly terrible (and shrinking) public school system would somehow be better if grandma started eating dog food and “paying her fair share”.
@JS, that problem can be addressed by a senior tax exemption. You can’t have people next door paying one quarter just because they bought 20 years earlier. People move all the time for all kinds of reasons, including an increased cost of living. This is a zero sum game, older people paying less means younger people paying more.
disagree with all of you. taxes don’t have to be a percentage of sale price. in other words, as values go up, there’s no rule that municipalities should collect more money.
someone who has a house worth $500k should pay the same taxes as someone else who has a house worth $500k.
that means under this proposed change, grandma’s taxes would go up, but not to the level of the people who bought for $1 million. They’d all normalize.
If prop 13 didn’t exist and property values increased, the owner may not be able to pay the property taxes and would be displaced. However, this indicates their property is worth extremely more than when they purchased it and they could sell and make a windfall, move somewhere they could afford and have plenty of money left over. This is how they purchased the property to start with, in a location they could afford. I don’t remember being born and guaranteed anything and wouldn’t expect it to be such. However, this debate is largely dependant upon whether you are currently a homeowner or a renter. Homeowners love getting locked into a low tax rate for perpetuity, including the passing down of savings to their offspring creating “generational wealth”. Renters on the other hand generally think it’s massively unfair as they’re left out of the equation. It should be noted how much less tax is generated in the current model and how innately unfair it is to first time buyers whose tax bill could be in 10x more expensive then their neighbor in a comparable house. If you’re bored read about the Bridge’s home in Malibu passed down from generation to generation. Take a step back and access whether you think it’s fair or not considering taxes paid have a purpose in our society, from schools, healthcare, roads, maintenance…https://www.latimes.com/politics/la-pol-ca-california-property-taxes-elites-201808-htmlstory.html
@Sure Thing (or anyone else interested in CA Property tax) can Google Prop 19 2020 (that passed two years after the LA Times article Sure Think linked to) that eliminated almost all the generational passing of low property tax basis. P.S. State and Local governemt in CA a giant “money furnace” that would spend every single penny if we eliminated Prop 13 and gave them more cash. I just went to the Transparent Califoirnia site that lists government pay by city (listing actual names and job titles) and there are MORE than 500 people in just San Francisco that have total pay of MORE than a Quarter Million a year and there are loads of people that make millions a year doing business with the city of SF (less than that if you net out the hundreds of thousands in bribes that they kick back calling them “perfectly legal campaign contributions”)…
This is also why there is a major traffic problem. Retirees don’t leave because of their tax situation and workers are forced to commute from further and further out.
Many of you are missing a key thing….who says property should be taxed on its value anyway?
For those who think the Prop 13 long term owners are getting off easy, consider that they have had annual increases of around 2%. Roughly inflation. Sounds fair to me. It’s irrelevant that property has risen faster than inflation.
AND don’t forget, most have additional bond assessments added.
“Scam”, hilarious.
I promise you that us actual property owners are quite comfortable and happy woth the property tax structure.
You can plan for annual increases, and it’s orderly. Compare it to Texas with huge property tax hikes that were multi thousands of dollars jumps for people.
Boston sellers are deluded . Changing prices all over the place In multiple directions.
Old expensive to maintain used houses some over 100 years old. No sane person would buy one at these prices .
Most millennial couples making 250k-300k combined are renting and happy about it. No educated person with an ounce of common sense would buy at such inflated prices
You can rent the SAME if not better unit for half the price of owning if not less
The scam is that 60 year olds pay 1,000$ and 29 year olds pay 12,000$ for the house next door. It’s totally inequitable. Of course older property owners like it, the young people are subsidizing their lower taxes.
That’s not the scam. The scam is batshit high prices. If prices were reasonable, today’s buyers would be paying reasonable property taxes, and would be guaranteed reasonable property taxes for as long as they kept the house.
Keep your eye on the ball. That square thing isn’t the ball.
Wrong, Pea Sea. If prices were reasonable, then tax RATES would be jacked up higher, pushing the tax bill up. There’s no way CA would let property owners pay less than the max they’d be willing. Think it through.
You guys have been trained to think that property taxes are Ok and just. They are not! Not in any free society. A home is a basic human need – a place to sleep at night. A property tax is a lean against your property by a 3rd party, and if you don’t pay it, they basically hold a *un to your head, and say ‘Pay up, or lose your property’. That is theft and extortion. If a common thief did it, he’d go to jail. If the local city does it, it’s called property tax. Now, it would be different if a 5% ONE TIME TAX was added when a buyer purchased the home. But a yearly extortion fee? Is that Karl I hear? And the LEVEL of property tax extortion is insane. Think it through a little further, gentlemen.
“Wrong, Pea Sea. If prices were reasonable, then tax RATES would be jacked up higher, pushing the tax bill up. There’s no way CA would let property owners pay less than the max they’d be willing. Think it through.”
You don’t have the faintest idea what you’re talking about. California property taxes by law are capped at a perentage of the assessed property value *at the time of transfer* and can only go up a very small amount yearly after that. That law, colloquially called “Prop 13” after the ballot initiative that birthed it, has been in effect since the late 1970s. That’s about 45 years.
Prices during that time have been up and down, reasonable and barkingly insane. During none of those times, including the recent window between 2010 and 2012 where California real estate was arguably a downright bargain, did the state simply “jack rates higher.” It can’t. By law.
Google exists. You can look things up.
Pea Sea,
I know more than a “faint” idea. I live in CA, property owner, economist. You are thinking statically. Think bigger. A tax rate change is a mere vote away, which would be an easy vote to win were home prices/prop taxes to be a lot lower.
Think of it this way, in your scenario, property taxes would be a lot less than owners would be willing to pay (irrefutable evidence: they pay a lot more already, right now). How long do you think that lasts?
It’s lasted forty-five years, and will last the rest of my and your lifetime. The core of Prop 13–the lifetime protection for primary owner-occupants–is a third rail in California politics. Californians will give that up when you pry it out of their cold dead fingers. This was always the case, but is even more so now that Californians have heard the horror stories from other states during the pandemic megabubble where existing homeowners saw their tax bills skyrocket because their neighbors’ houses had sold for batshit prices. (The dumber aspects of Prop 13–giving tax breaks to landlords, second homes etc.–are less universally beloved and are already being chipped away at by recent initiatives).
By coincidence, I happened to watch a video last night of SD nightlife. What a sleazefest. I thought SD was more upscale considering the housing prices.
Tons of redevelopment and all kinds of hope for the San Diego Gaslamp tourist district happened decades ago. (Once upon a time it was a red light and party district for the sailors of olden days.) Now I wouldn’t go near it at night. It seems to attract sketchy people who perhaps are priced out of the pricey houses, and participating in an “informal economy.” That would also feed on all the young Navy personnel in the area.
San Diego for many, many, many years has been a place where sailors, marines, and college students let loose at night. Granted, the ones who are too young or cheap to drink in San Diego have always gone down to Tijuana, but San Diego itself has always been a party town (and San Diego State a notorious party school).
Call me crazy but this stuff has still got a long way to go to be at all reasonable, unless we make up for it with a good amount of additional inflation (likely).
Societies from the dawn of time have had layers of privilege, with social and propertied layers to match. The USA was the biggest anomaly, peaking around 1970 with not only great wealth, but widely distributed prosperity (and upward mobility). Much of that, I think was (to use a favorite word around here,) transitory. Perhaps tens of millions of people in the USA (and global economy, even more) can no longer efficiently create value? At least, not value relative to what ordinary folks could in the mid-20th century USA. And I don’t think AI will help that one bit. So — a “new reasonable” might not look like the old reasonable? History is dynamic and powerful, and has no particular hard limit causing it to respect our expectations.
“At least, not value relative to what ordinary folks could in the mid-20th century USA.”
Not so much some genis American value creation from 1945-74, as much as most of the rest of the industrialized world having largely destroyed itself in WW 2 and took decades to be comparably competitive again.
America just stepped into that gap.
Since, say, 1970 those competitors re-industrialized and plenty of LDCs industrialized too – result? Much, much, much slower growth in the US post 1970 relative to 1945-70.
Of course, having a god-awful leadership class (public and private) with vested-interest legacy policies didn’t help either.
I think you are pretty close there. The old expectations of value are no longer sufficient. There are plenty of opportunities for wealth creation today, but they are considerably different than the past.
Show up, work hard at factory, go home provides little real value. Anyone can do it and tech has improved efficiency.
Pay is usually commensurate with value. The fact it no longer allows you to raise a family was never the company’s concern.
Very thought provoking. I like this.
Also, perhaps this is why people making little of worth are having masculinity crisis and changing political parties, lashing out so much, etc.
This is (sort of) a joke: need to get the proletariat back under control…
From the charts it looks mostly like seasonal weakness rather than popping of bubble.
Most MSA’s showing Year-over-Year gains, higher highs and higher lows.
Fed didn’t tighten enough?
They’re not seasonal because they’re not aligned 12 months apart. You look at the charts and you see that the last few years were completely bizarre, in terms of price movements, including now. Most of those metros that are up yoy are so because they had a huge short (2-3 months) price spike earlier this year when mortgage rates plunged. There was nothing seasonal about it. And then that fizzled, even as mortgage rates continued to plunge. The YOY gains have been diminishing for months. They already reached zero or negative in some metros. And a big majority of them (19) are below their all-time high in mid-2022.
These are really crazy charts. They’re absurd. Something like this should never happen. You need to look at them!!! To brush this off as “seasonal” is beyond funny.
Sales and demand have COLLAPSED. Sales volume of existing homes in 2024 will likely go down in history as the worst year since 1995 (Fannie Mae), despite population growth over these 30 years! Inventory is surging. These prices are absurd, which is why demand has collapsed. A very small number of sales drove up prices in a few months earlier this year. It was a bizarre brief episode, some leftover buyers suddenly went nuts maybe, and it’s over.
If the bubble pops the Fed will print trillions to blow it right back up. An exercise in futility.
You’re dreaming the QE wet dream.
It’s no longer considered a bubble… it’s now just my fat belly hanging over my pants…..a bunch of flab… To expect the housing market to trim itself back in this porked out economy is dreaming. Itsy bitsy price drops then it’s off to the buffet again.
HT – …also known as: ‘Dunlop’s Disease’s (…as in the belly has done lopped over the belt…).
may we all find…oh, never mind…
Wolf – not a QE wet dream, a QE nightmare. I think a lot of us are pessimistic that the Politicians and the Fed will allow markets to work… i.e. for bad behavior to be punished as deserved. We have seen too many bail outs before. I hope we are wrong.
Yes, I agree with the overall interpretation and expectations. We know the market is inflecting based on all sorts of data. But if we limit the analysis to these sale-price graphs, it’s not so easy to make the case that the market has turned down. However, in a few months one would expect the 2024-2025 lows undercut to the 2023 lows, and then it will be very hard to deny.
Right now feels a bit like late 2005 and early 2006: some regional markets have already rolled over, and the change is obvious to those living through that, while other markets are still ascending and those people are not yet aware of the steamroller ahead.
@Cem most cars put around 50hp per litre of displacement for decades. In 1978 the 2.0L BMW 320i had 101hp and the 3.0L Porsche 911 had 172hp.
Today we have “turbocharged” cars and a 2.0L BMW puts out well over 100hp per Litre and a 3.7L 911 Turbo puts out over 150hp per Litre.
When I was a kid there was a lot less “multi-generational wealth” and it seemed like most people were like me with working class parents and grandparents from “the old country”.
Pretty much every boomer that has owned real estate in the US has done well and most seem to want to help their kids and I think that this wealth transfer has “turbocharged” the housing market (in places where the wealthy want to live).
Google just found that the median list price of a home in the SF Peninsula city where my working class parents bought a $22K home just over 60 years ago is $3 million.
In the early 60’s almost everyone saved up for a down payment and paid off the mortgage over 30 years, Today in this “turbocharged” market few people are saving a down payment and getting $3mm loans with $25K PITI payments in Nor Cal or even to buy the tiny “starter” homes that cost half as much with monthy payments of “only” $12K.
It will.be interesting to watch when “wealth building” homes become money pits…
Austin is the only one where the downturn is profound. The rest seem to be still in a Mexican standoff over the last two years
Late cycle economy. Layoffs will start in the beginning of 2025, after Q4. Last breath of an over leveraged consumer. Data looks decent now until it does NOT on a dime change. Cash is king even though the media likes the brainwash everyone that it is not. The house market needs a big reset.
If I had a quarter for every guy who comes on here with prognostications about upcoming recessions, layoffs, and how we shouldn’t trust the data…
Those everyday is dooms day guys make YouTube fun.
@ JS,
You’d have a large quarter collection, to be sure. And these prognostications are rampant not only on this site but in the mainstream financial media. And regardless of how wrong they are today, they’ll still be back tomorrow with a plausible-sounding new prediction.
As Michael Evans noted years ago, “the problem with macro economic forecasting is that no one can do it.”
The boy who cried recession.
Ciprian
“Last breath of an over leveraged consumer.”
BS. The consumer is NOT overleveraged. The federal government and businesses are overleveraged, but not the consumer. This is why people like you never get the US economy and are always surprised by its growth and the continued strength of consumer spending. You should read some of the articles here:
https://wolfstreet.com/2024/08/06/household-debt-delinquencies-collections-and-bankruptcies-our-drunken-sailors-and-their-debts-in-q2/
It’s very difficult for me because I’m a natural born pessimist and drawn to the doomer cult. It’s made me miss out on a lot of gains, though I’ve done okay in general.
I very much appreciate your counter to that here.
Is BNPL included in that debt?
Yes. But BNPL is tiny compared to the other debt.
Consumer is as good as it has ever been. Because the government soaked up all their debt and then some more.
Spending is up because income and wealth is up. One sectors deficit is another sectors surplus. As long as the government runs huge deficits it is impossible to slow the consumer spending because all deficits eventually show up in the pockets of consumers.
We have postponed the problem to the future. Pullback will be when deficits are reigned in (due to dollar concerns). That also may not be a slow down, it may just be a slower growth because the government will slow down deficits not stop completely.
Remains to be seen how this story ends.
Aaaaaaaaaaaaaaaaaaaaaaaaaaaaaaaaaaaaaaaaaaaaaaany day now
It has been said before: these initial declines do not make current prices good. They only make them less bad. Less bad is still (very) bad, and I continue to believe that buyers at current prices risk “going underwater” on their mortgage loan in the next 1 – 2 years. Certainly possible. The RE price tree will not grow to the sky.
An attitude of high price entitlement still seems to be in effect among some sellers. “My neighbor sold their similar house last year for X, so I should be able to do the same.” Ah, no you should not, but that attitude is still in play. Hopefully it will change if the RE market continues in the current direction.
More like…
My neighbor sold their similar house last month for X, so I should be able to do the same plus ten percent more
@Longtime Listener for the last decade pretty much everyone has been able to “sell their home for more than their neighbor did”. I don’t know if anyone tracks the percentage of home sales from out of the area buyers, but it seems like a lot of the people “overpaying” (accoring to the “locals”) are people moving from another area (the “overpriced” Sacramento area 3,000sf 1.5mm home seems “cheap” to a guy that just sold his 2,000sf Bay Area home) or state ( (the “overpriced” AZ $500K home seems “cheap” to a guy that just sold his $1mm CA home).
Sacramento isn’t mostly 1.5 million 3000 sqft houses. Sure, you can find them but to live in a decent neighborhood like mine you can get 2500sqft or so for 600ish, walking distance to safe (that seems to be the bar these days) and low crime. Still steep compared to the 400 I paid in 2016 but we had a lot of Bay Area transplants with COVID and a couple working for the state of California can swing that. Admittedly there are ridiculous pockets or almost anywhere downtown but plenty to be had and if willing to drop down to 1200-1800 sqft then can do much better. That said, once my son is off on his own will explore either other states or expat options as property and other taxes are brutal. I tend to only sell stock to offset any losses given brutal capital gains. Not being a CA resident is easier said than done however so as long as employed here and have property then here. Sacramento not a terrible place to live however as while summers can be hot, there are plenty of cool escapes, the coast bring the most common. Not the Bay Area for sure but not the cow town from the early days either.
Prices have a long way to drop to be considered as a popped bubble.
But by definition a bubble can pop quickly. An implosion in housing could, I imagine, cause the Fed to massively employ the Fed Put, in this point in history, stress-testing the whole US-centric and dollar-centric financial system. I’m not sure what could induce that pop, but I might go with Dimon and think something geopolitical. San Diego home prices might vary according to incoming missiles to its Navy bases from North Korea.
i think the fed and other central bankers have already blown their qe/printing wad. they do it again, they risk currency collapse.
There will be no currency collapse when all other central banks are printing in concert. They’re just ripping off and impoverishing the masses via inflation.
The benefits of “financialization”…
…rewarding bad behavior and harvesting real wealth for fewer and fewer people. Feudalism 2.0.
LOL! Nothing new under the sun my friend.
Interesting times.
“San Diego home prices might vary according to incoming missiles to its Navy bases from North Korea”
Nah, I am sure if that does happen, RE and NAR will tell you it’s a good time to buy, free up some crazy demand and you get more empty lands to build….those pesky radiation fallout? Minor side effect that should not keep one from buying their dream home.
“Prices have a long way to drop to be considered as a popped bubble.”
Two years–two years!–ago, they were actually doing a great job of dropping. Substantial but not catastrophic downward price movement, enough that nobody could deny it.
Then March 2023 came, a couple of shitty systemically unimportant banks failed, the Fed chickened out (bailed out uninsured depositors and stopped hiking rates), the markets saw the fear in the Fed’s eyes, and house prices shot right back up and stayed there.
And here we are now in late 2024, trying to get excited about ~0.5% price drops from the *new highs* made after the great Fed chicken-out of 2023 that arrested and reversed the welcome price drops of 2022 .
Is there data that reveals the number of homeowners who own multiple homes — by MSA? (For example, I’m guessing that the Florida MSA’s are higher than average for multiple-homeownership?).
Has the trend been upward, and does it show signs of peaking?
What’s the causality between multiple-homeownership and average dwelling price?
Thanks (and apologies if this has been covered before)
Property records are technically public at the county level (accessible in most cases online), but you generally only access the data at a per-address basis. They include the owner name and often times the transaction price.
There are some firms that scrape and aggregate this data into a single table for analysis, but these datasets are generally sold for profit. This is probably what you’d be after, and I’m not sure if you’d be able to find a free version online somewhere. Furthermore, the latency on these public docs can be up to a year depending on county recorder.
You might be able to find some public data on institutional investor trends (from Redfin or similar) but these might not have the cross sections you’re after, and typically just identify “investors” as any owner with “LLC” ,”Trust”, etc. in the name (i.e. not mom and pops)
Thanks, le chase.
Just look into the percentage of empty homes, it’s around 10%.
We also seeing that every individual does not want a 30 year ball and chain strapped to their necks. Younger generations are more into travel and experiences. Hearing folks say they are paying $12-$20K just for basic home insurance in the Florida swamp says it all. Agree that generational wealth recipients will keep the new car, new home,$FOMO and $YOLO social media Look at Me soap opera going. If you are priced out $ you are just priced out. There are cities that got over saturated post COVID, along with places that the 2 and 3 comma kids hold sacred. Most sellers will be defiant or keep prices high as they are priced in with 2% to 3% refinance rates, so there is not mounting pressure to make drastic cuts. As I look at all the new construction and home builders in metro Denver, you would think there is some type of economic boom or windfall going on.
Even taking the interest rate out of the equation: how many people couldn’t even afford to buy their own home that they’re currently in?
Even if I could hypothetically get another 3% mortgage today, I still couldn’t afford to buy my own house.
It’s just going to take time. Flat or -1, 3, 5% a year house prices combined with 3-5% inflation means things will get back to balanced eventually, but the disruption and damage from 2020-2022 was severe. The Fed caused a lot of this with the MBS buying and 2.75% mortgages. It wasn’t a gift to the people who paid far more than the houses were worth and financed cheaply – they can’t get out now without a loss.
Everyone needs to live somewhere. Renters need to decide if sitting and waiting for a year or two is a good idea – while shelling out $2-3k a month. Sellers need to accept today’s prices from today’s buyers with today’s mortgage rates.
Houses are still selling. People come together and agree on a number. If neither the buyer or seller is happy then it’s probably the right number for now. It would be better for everyone if housing was no longer considered an “investment asset” and just faded into the background like it was before around 2005.
As many of us have point out, the Fed NEVER should have touched MBS. Those fuckers should have been allowed to choke and die on the toxic shit they created. The depositors could have been bailed out in accordance with existing FDIC rules etc., but by rewarding this bad behavior The Fed wasn’t simply “putting its finger on the scale”, it was throwing the scale out entirely. No surprise gold is finally calling “bullshit” on everyone/everything.
Interesting times.
+
Houses are too expensive for zoomers and useless for boomers.
The boomers need one floor, no carpet to prevent falling.
The second and the third floors are hard too hard to climb, empty nest, a cost center doing nothing all day. Homeowners have target on their backs. There will be a systemic change in the housing market.
I expect we see a lot of ‘cutting up’ into smaller units and retrofit elevators in those huge homes at some point.
That’s what happened in my hometown. Local industry boomed then collapsed, and the large houses that all the management lived in slowly got converted into 2-4 unit apartments. I saw one particularly egregious one that was converted into 7 1-2br apartments.
I can see a booming cottage industry where no longer “Appropriate” McMansions are cut up into 2-3 Co-Op units.
Next gen people don’t want a 6000′ house nor can they afford. Should boost tax revenue as well.
“The boomers need one floor”
Recently I appealed my city’s re-assessment of my 960sqft ranch. During the hearing, the employee told me that ranches specifically were selling at a premium to other floorplans because retirees looking to downsize prefer one-level living.
Does anyone consider the quality of life in some of these metro areas? I will only speak of SF and Houston as I have lived there.
Neither feels as safe, clean, or family friendly, as they were in the past.
I doubt prices are going down anytime soon as the effects of inflation are here to stay.
I have interest in a place in Dallas. It stays rented even with price increases, but how many new arrivals are living there?
At one time it was a decent small family home on a nice sized lot and decent schools.
Price is only one factor.
Anecdotally, in my town (in the DC MSA, but not very close, physically), it seems like entry level places languish a bit, and maybe are getting slightly less, but we’re still seeing the best properties in the hottest neighborhood commanding big money. This is a trendy place, but I wonder if this phenomenon is happening elsewhere (wealth gap and all). If so, such strange dynamics that will be interesting to watch play out.
Besides that, but intertwined, what happens when these older people with all the money start dying off? If we don’t keep up the population figures (especially if anti-immigrant policy is implemented), will we suddenly have some crazy oversupply of housing?
And, it’s only this modern blip in time where it’s normal for every couple/family/single person to have their own, often very large, house. Used to be families were extended. Life was harder, I guess?
@John H. there is not any good data that shows the number of homeowners that own multiple homes. The classic “is the tax bill sent to the property” is a pretty good way to find the number of “owner occupied” homes (since few rental homes have the tax bill mailed to the peoperty). In the last couple months I have read multiple articles that assume a person “managing” a short term rental is the “owner” of the short term rental. In most (but not all) cases the people “managing” large numbers of short term rentals do not “own” any of them just like the CPA firms and property managers that get dozens of tax bills rarely own any of the properties (My CPA is the “agent for service” for all my LLCs and gets all the tax bills but does not “own” any of the peoperty).
Interesting to compare some of these cities, some are high growth and others are losing population.
In Nash for example, while prices are softening it’s unlikely they’ll crater. One reason is someone from SF (or NY) buys the 1.3 million home in Franklin and rolls in 1mil of equity. What a deal, and they’ll tell you so.
This is happening in what I’ll term “mass quantities” in Nash, Atlanta, Charlotte, FL, Phoenix, etc. By mass quantity I mean pushing the local native population out. So that factor will probably keep those cities from a hard bottom. Austin has also seen this, but Texas property taxes and it “Being Texas” really does affect a number of people.
But this is also my personal gripe – why has the USA given lotto tickets to coastal people? In fact, that lotto and it’s effect is being used politically as we speak, right or wrong to the people who could not participate in the lottery.
some – with respect to the West, a massive segment of the population streamed in from points East over the last century-reckon they brought the ‘tickets’ with them. With the demographic pendulum reportedly changing direction, expect the ‘lotto’, complete with plusses AND minuses to be available in your area, soon…
may we all find a better day.
These charts show what almost two decades of fed manipulation of the mortgage market does.
How does this end? It is very very unlikely mortgage rates go lower than where they are currently. So, buyers can’t afford homes and sellers think 2021 price insanity is the new normal.
Just this week I have started to see a few listings in Denver cut prices to at or below what they were purchased for in 2021. Still not many but 🤞🤞🤞
I think when some of these cities start to hit the 10% drop or more we’ll see a pick up in price declines. Right now most decreases are easy enough to blame on seasonality or rates and people keep thinking they just need to hold out for rate drops and prices will jump again. If there is a pronounced drop that can’t be explained away the race to exits start
If however buyers show up strong in the spring, we get high prices forever
I sent the chart of the Austin declines to a friend of mine who is a realtor in Austin and her response was that the Zillow index is “bullshit” and here’s her logic, “Zillow is not legit because there are a bunch of nondisclosure states Zillow has no access to closing data. So they actually have no idea what homes close at…. so in my opinion all of their documentation is skewed. And also, they’re just using an average of what they’re saying listing prices do not closing prices.”
Last part makes no sense but I think you get the drift. Truth? I think she’s in denial. Realtors always deny reality.
Tell her this verbatim:
“Wolf says you’re an ignorant idiot because you don’t know shit about non-disclosure states such as Texas and about how Zillow gets the data in its “All Homes Data Base.” And you don’t know shit about the data that Realtors associations have.
In Texas, as everywhere, Realtors associations and MLS’s have the transaction prices (since they close the deals), and they use the transaction prices in their statistics. Zillow is a member of these Realtors associations and MLS’s, and gets the transaction price data from them – similar to Case-Shiller with the Realtor associations in the Dallas-Ft. Worth area. What CANNOT be disclosed publicly in Texas is the transaction price of AN INDIVIDUAL HOME. But the summary data of transaction prices can be disclosed publicly, and is disclosed all the time in every index, median prices, etc.
In addition, Zillow is a data-collection company, that’s what it does, it gets data about homes from all sources, not just transaction prices, including from households, county property records (in Texas, those records exclude the transaction price), etc., and including real-time data, and this whole flow of data goes into its “Data Base of All Homes,” from which emerge its indices.
Why would anyone do business with such an ignorant idiot????”
My comment to you, 1stTDinvestor:
This ignorant idiot of a Realtor is exactly why Realtors have such a bad name. Making big-fat commissions off other people buying a home attracts the dumbest shits who sell homes by telling lies, like your friend just did. I hope that the new commission rules will weed out those dumb shits, clean up the profession, and make room for competent brokers.
Love it…by why even bother? Below probably applies to probably 99% of RE agents and for the 1% that truly buy into the narrative…I suggest them join a cult instead.
‘It is difficult to get a man to understand something, when his salary depends on his not understanding it. ‘ -Upton Sinclair
Couldn’t agree more. Thank you for providing such a detailed reply. With people like this, it’s “beliefs” versus “facts.” Just because someone chooses to “believe” something, hell even if millions believe something, it doesn’t change the facts. You can put all the data and facts you want in someone’s face and it doesn’t matter. It’s pretty infuriating at times.
Your friend is an idiot. Several of my children have houses in Austin. It has cratered completely as people wake up and get out of Dodge. Four houses for sale on my daughter’s block in Kyle, Texas. Time on market? 341 days, 235 days, 118 days, 59 days.
Do you know Liberty Hill is taking a hit too? Based on Redfin data, doesn’t look like it. A former co-worker of mine bought there during covid, been riding high since then and so far think she is still way high on value compared to the purchase price…
I like Kyle a lot. Just take Exit 215 and you will find everything you need for the rest of your life without ever getting back on the freeway! But there is so much vacant land that inflated housing prices will asymptotically approach construction costs very quickly…
I like how you adverbized the word asymptote.
I always like to look at shelter costs as a percentage of income. Probably nothing scientific to it but an interesting trend over time. From what I can tell it really hasn’t changed much over the last 40 years, at least at a macro level. Large metro areas are probably the exception in many cases. That, and shelter is just one small aspect of what people need(car, insurance, energy, health care, 5 streaming services plus TV, etc)
What I miss in all these comments is the impact of inflation. As long as tons of non-product backed dollars are handed out (mainly to our expensive public servant class) as effective tax on the productive population, all these price increases are nothing else but an indicator that the dollar isn’t worth a lick anymore.
With some dollar savings, you can earn enough interest to cover a substantial amount of expenses. I dont like deficit spending and high debt and inflation but stocks and RE have seemed to pricey and risky to me for a while.
Even with the concept of higher wages, home prices are way too high — but tell that to someone that bought at all time highs — then plowed tons of cash into upgrades. There’s a very wide divide between insane sellers and patient buyers.
This battle will go on for years, and buyers have the upper hand.
I am looking at the Austin chart and laughing. My landlord asked me to leave when he converted my unit into STR in 2013 and I ended up buying a condo right before prices took off. And then sold at the end of 2021 when my neighbors voted to accept a buyout offer from a developer who demolished the property and is now sitting on a vacant downtown lot with tall grass on it. Better to be lucky than good!
In many areas of the country, nominal housing prices have shot up 3x-4x using 2000 as a baseline (see Wolf’s data). This includes the decline in 2009-2012. Unreal.
However, lest we forget, the nominal return on an investment of $100 in the S&P 500 at the beginning of 2000 would be $503.42, or 500+%.
In essence, your dollar does not buy much house anymore but you could still afford it if you were invested in the stock market the last 25 years. You are out of luck otherwise.
Really good analysis Wolf!
Do you have a way of tracking foreign ownership of SFH homes?
and tracking % of SFH that are AirBnBs?
There is some interesting patterns going on in California
some owners have non-working partners who are registering as a real estate agent (without doing any RE work) and then using their rental SFH to reduce taxes. You can deduct depreciation on the SFH assets apparently if it’s a rental.
in other cases I’m seeing straight up investors from China buying SFH and turning them into rentals… not one or two but hundreds. I was wondering if you had a more systematic way of digging more into this.
The NAR does an annual report of foreign buying of homes in the US overall, and by state. Overall, the share is pretty small. But in specific areas, there can be concentrations.
But foreign buying has collapsed starting in 2018
https://www.nar.realtor/sites/default/files/documents/2024-international-transactions-in-us-residential-real-estate-report-07-17-2024.pdf
@Wolf thanks for the foreign buyer chart Google found that total sales in 2023 was just over 4 millon so it looks like froeign buys are about 1% resident and 1% non resident
@eto tell me more about “partners using real estate to reduce taxes”. I do get to depreciate rental property, but I also have to repair rental property that wears out (it cost over $100K to deal with some leaks around the windows in an aparment this year since we needed to rip off the stucco that had 1% asbests so an “environmental” firm needed to do the work and once the stucco was off we removed what was left of the tar paper and a lot of rotten plywood).
It’s NOT The house prices going up, it’s the purchasing power of your money going down.
I know there’s a lot of other veritables but I think the main one is inflation. The federal government and Federal reserve cannot control themselves. Same thing happened in Venezuela, as they continue to print the stock market continue to go higher but it actually wasn’t going higher it was just the value of the currency was going down or being devalued.
Savers have been decimated, the purchasing power of their money has been stolen and given to borrowers.
@John Daniels The purchsing power of the dollar has been dropping pretty much every day of my life, but in 1960 the median price of a home in America was about $12K, in CA it was about $15K and on the SF Peninsula it was about $20K. Today the median price of a home in America is up to ~$420K (up ~35x) the median price of a home in CA is up to ~$875K (up ~58x) and the median price of a home on the SF Peninsula is ~$1.6mm (up ~80x) the drop in purchasing power is not the “only” reason that home prices have gone up.
Not in zirp but these days, with a decent amount of dollar savings, a person can earn enough interest to cover a substantial amount of their monthly expenses. Hopefully interest rates continue to compensate reasonably for inflation. Yes, house and prices are up with inflation, but part of it is probably speculative bubble valuation also. Yes, I totally disagree with the money printing that happened. I think the govt should continue with QT for treasuries and mbs.
Given the information from this article, along with the recent sharp decline in oil prices, low inflation in Canada, and the ongoing recession in China, wouldn’t these factors impact inflation in the US? Is there still reason to believe that inflation in the US could start rising?
“…could start rising?”
It has started rising, for third month in a row:
https://wolfstreet.com/2024/10/10/beneath-the-skin-of-cpi-inflation-core-cpi-accelerates-for-3rd-month-on-sharp-flip-of-used-vehicle-prices-amid-sticky-services-inflation-gasoline-plunged/
https://wolfstreet.com/2024/10/11/after-large-upward-revisions-core-core-services-ppi-inflation-not-benign-at-all-whole-scenario-changed-for-the-worse/
“Is there still reason to believe that inflation in the US could start rising?”
Here are three reasons:
-Wage growth, strong employment, and consumer spending continue
-Services inflation stubbornly remains well above the Fed’s target
-Gov’t is spending as much as they normally do during wartime
Just got my homeowners insurance statement for the next year
$2,365 11/30/23 This year’s premiums
$2,441 11/30/24 Next year’s premium
$76 increase, 3.2%
Not bad.
We are in a low risk area. Floods, hurricanes, tornados, earthquakes are a rarity here in suburban Maryland.
We seldom have severe weather here. Durachio in 2012, minor earthquake in 2004.
You people who live in Florida may want to consider packing your bags and moving here to the Swamp, to avoid future $10,000/yr homeowners ins.
How much per sqft does your insurance cost each year? That’s the fair way to compare.
I pay $0.85 per sqft per year to insure in southern NH.
Tampa Bay metro area just dodged the big one with Milton, if it’s 40 Miles further north, lots of homes no flood insurance, lots no insurance…Florida might break first depending on 2025 storm season…
A lot of people are stuck. They can afford a mortgage at their pandemic rate but cannot at current rates. To unstick the market, prices have to go down, rates have to go down, or (lol) we need a ton of wage inflation.
Insurance going way up in certain areas because at least the insurance industry believes in global warming is just the cherry on top. History never repeats but this situation sure rhymes with recessions past. Too much financed spending with consumers maxing out their debt & alarming CAPE numbers. Pay down bad debt and/or shore up reserves may be wise.
Of course prices are down month over month… summer is over. Prices and the market always dips after summer ends and comes back in the spring. If you look at the year over year numbers (apples to apples), most markets are up.
BS. You’re confusing this data here with the “median price” from the National Association of Realtors. The median price index drops from July through December due to a seasonal shift in the mix. In the spring more higher-end homes are on the market and sell, thereby shifting the median price up. Then in the fall, there are fewer higher end homes in the mix, and the median price falls. This is no indication of actual prices rising or falling.
But the Zillow data is NOT a median price. Calling these absurd movements seasonal is beyond hilarious.
So that’s the NAR’s median price measure, and it IS seasonal like clockwork:
Even with lower rates, factors such as rising property taxes, homeowners insurance, and maintenance costs can contribute to overall affordability concerns for potential buyers. Overall, while mortgage rates play a significant role in housing affordability, they are just one piece of the puzzle. The interplay between prices, inventory, economic conditions, and buyer sentiment will continue to shape the market dynamics.