The Fed is “behind the curve,” and the bond market is getting very nervous. Treasury yield curve flips from a sag to a hump in the middle as 2-5 year yields spiked.
By Wolf Richter for WOLF STREET.
Longer-term Treasury yields spiked late this week as the second wave of inflation took on more substance with back-to-back inflation reports: CPI inflation soared by 3.8% year-over-year, driven by core services, gasoline, electricity, and food; and the measure that tracks inflation in prices companies pay each other, the Producer Price Index soared by 6.0% year-over-year as the services PPI blew out. Inflation in services is the biggie. Services account for over 60% of the economy, and inflation took off in services.
The 30-year Treasury bond sold at the auction on Wednesday at a yield of 5.046%. In the secondary market, the 30-year bond has traded over 5% from time to time in recent years, but this was the first time since 2007 that the 30-year bond actually sold at auction with a yield above 5%. And in the secondary market, the yield rose following the auction and ended on Friday at 5.12%, the highest since June 2007, having edged past the October 2023 high.
The long end of the Treasury market completely blew off the Fed’s rate cuts, as indicated by the widening gap, now 149 basis points, between the 30-year yield (5.12%) and the Effective Federal Funds Rate (EFFR, blue line) of 3.63%, which the Fed targets with its policy rates.
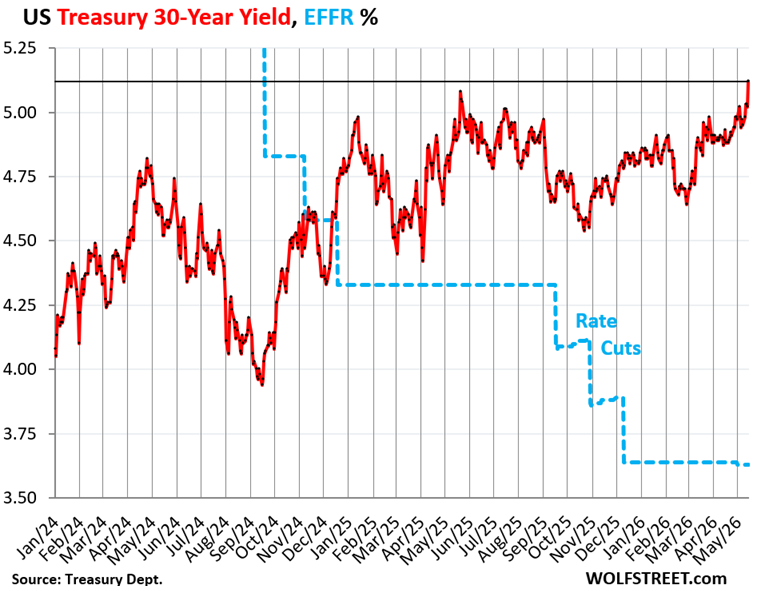
Higher bond yields in the market mean lower bond prices for existing holders.
The bond market is now fretting about a lax Fed that would “look through” the surge of this second wave of inflation for too long and, instead of getting serious about it, would proffer more excuses why no rate hikes were needed at this point. And the bond market is cutting the market price of those securities, which causes yields to rise.
The 10-year Treasury note sold at the auction on Tuesday at a yield of 4.468%. The yield then continued to rise in the secondary market, including by 11 basis points on Friday, to 4.60%, the highest since January 2025.
Longer-term yields reflect the bond market’s views of the future – especially the path of inflation as the second wave takes shape, amid the tsunami of supply of Treasuries to fund the ballooning deficits.
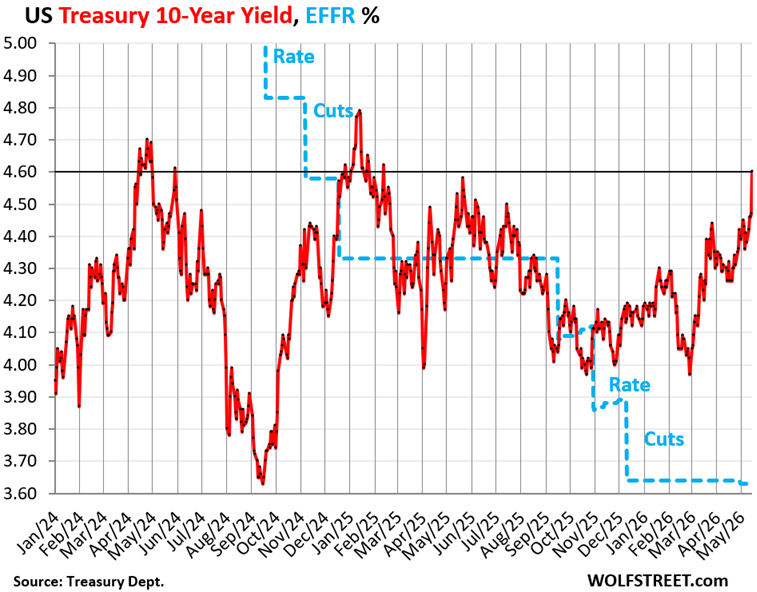
The amount of 10-year Treasury notes outstanding rose by $24 billion this week: The $52 billion of 10-year notes sold at the auction on Tuesday at 4.468% replaced $28 billion in 10-year notes sold at auction in May 2016 at 1.710%, that matured today. So with this week’s auction, the total amount of 10-year notes outstanding rose by $24 billion.
New issues being so much larger than the issues they replace is one of the dynamics by which the total pile of Treasury notes (2 year to 10 year) and Treasury bonds (20 year and 30 year) increases constantly even as the Treasury Department says that it is not further increasing the auction sizes.

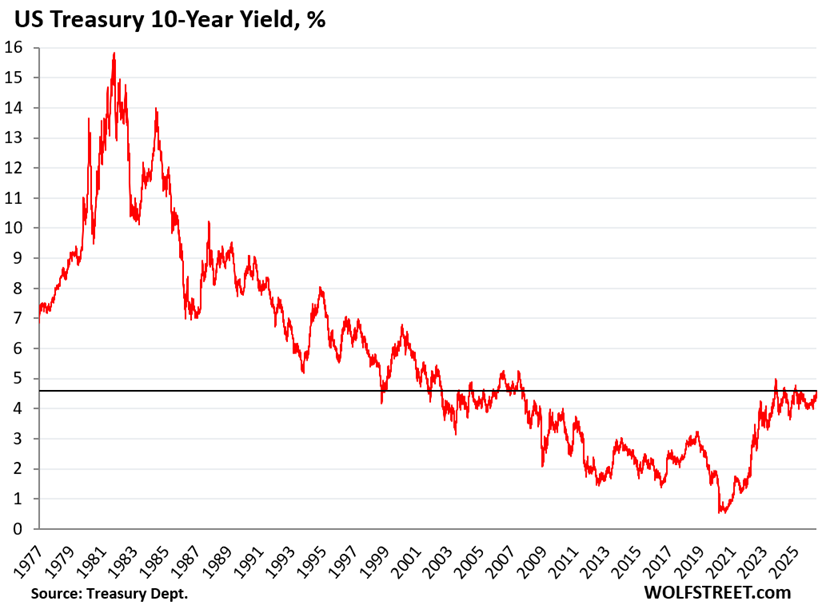
The 40-year bond bull market died in mid-2020, when the 10-year yield bottomed out at 0.5% amid the Fed’s massive interest-rate repression. Since then, as inflation forced the Fed’s hands, it has been a rough ride back to normalcy.
A 10-year yield of 4.6% in a historical context is still relatively low. At this yield, with this potential path of inflation, and with this Fed that wants to sit on its hands to let it happen, 10-year paper looks very unappetizing to this observer, and 30-year paper looks even worse.
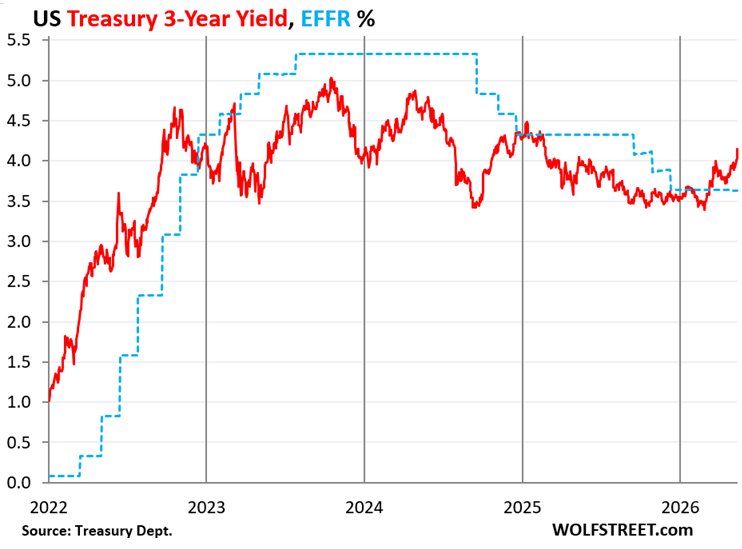
The 3-year Treasury note sold at auction on Monday at a yield of 3.965%. Then the yield spiked, amid the CPI and PPI inflation reports that followed the auction, including by 11 basis points on Friday, and ended at 4.15%.
In the four trading days since the auction, the 3-year yield has shot up by about 20 basis points from the auction yield. This is not fun for the buyers at the auction, and is a sign that the Treasury market is adding to the expectations of multiple rate hikes by the Fed, if not later this year, then next year.
The 3-year yield shows the U-turn in expectations in the market, having spiked by 76 basis points since February 27. The 3-year yield had anticipated the top of the rate hikes and then the rate cuts, and now by having blown through the EFFR is anticipating rate hikes.
Combined, the government sold $155 billion in notes and bonds this week, and all of them dropped in price since their auctions, as yields rose sharply:
| Notes & Bonds | Auction date | Billion $ | Auction yield |
| Notes 3-year | May-11 | 72 | 3.965% |
| Notes 10-year | May-12 | 52 | 4.468% |
| Bonds 30-year | May-13 | 31 | 5.046% |
| Notes & bonds | 155 |
The US government also sold $536 billion of Treasury bills this week, in six auctions, with maturities from 4 weeks to 26 weeks, most of them to replace maturing T-bills.
T-bills and Treasury notes and bonds combined, the government sold in total $691 billion of securities this weak.
| Type | Auction date | Billion $ | High Rate | Investment Rate |
| Bills 4-week | May-14 | 104 | 3.605% | 3.665% |
| Bills 6-week | May-12 | 85 | 3.615% | 3.681% |
| Bills 8-week | May-14 | 99 | 3.610% | 3.681% |
| Bills 13-week | May-11 | 95 | 3.610% | 3.694% |
| Bills 17-week | May-13 | 72 | 3.615% | 3.710% |
| Bills 26-week | May-11 | 82 | 3.615% | 3.733% |
| Bills | 536 |
“High rate” v. “Investment Rate”: The Treasury Department provides two different calculations of the yield at which T-bills were sold at auction: the “high rate” and the “investment rate.”
T-bills are sold at a discount to face value, and at maturity, the holder gets paid face value; the difference is the interest, and there are no coupon interest payments. The “high rate” reflects the yield calculation of that process. To make this discount yield comparable to the yields of coupon securities (2 years to 30 years), the Treasury department re-calculates it as “investment rate.”
The investment rate is higher than the “high rate.” And around the time of the auction, the “investment rate” is close to the “constant maturity yield” published by market index providers to reflect trades in the secondary market.
Inflation has surpassed T-bill yields. Yields of 1 year and less are bracketed by the Fed’s policy rates and expectations of those policy rates over the next few months. The yields of the T-bills sold at auction this week were all below the rate of inflation.
With negative “real” yields, T-bills have become unattractive.
But the 10-year Treasury note with a yield of only 80 basis points above current inflation rates may be even more unattractive because 10 years is a lot of time for a lax Fed to allow inflation to wipe out much of the purchasing power of the principal, while the yield is insufficient to compensate holders for that loss of purchasing power and for other risks. Not with a ten-foot pole at those yields, I’d say.
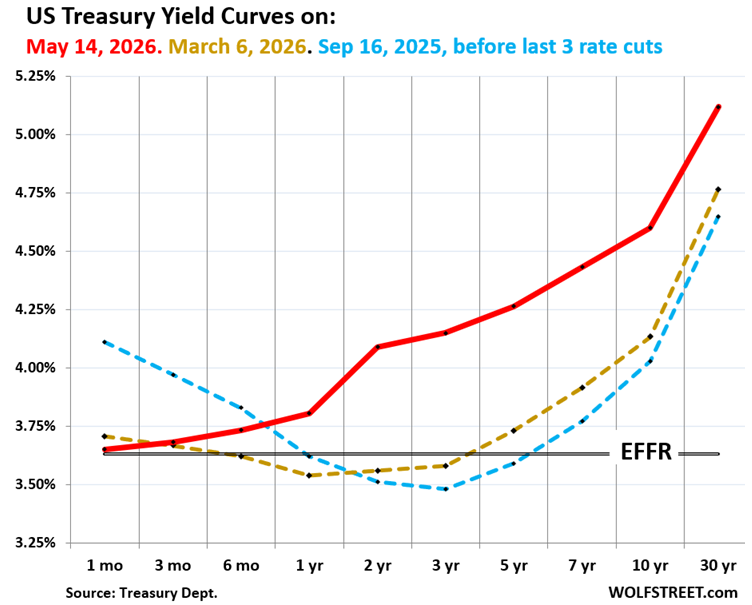
Treasury yield curve: sag in the middle turns into hump.
The chart below shows the yield curve of Treasury yields across the maturity spectrum, from 1 month to 30 years, on three key dates in 2025 and 2026:
- Red: Friday, May 15, 2026.
- Gold: March 6, 2026.
- Blue: September 16, 2025, before the Fed’s last three rate cuts in 2025.
The yield of every maturity has been above the EFFR since mid-March, with the gap dramatically widening for yields of 2 years and longer.
The former sag in the middle – with 1-year through 5-year yields lower than short-term yields – has turned into a hump in the middle, after the yields from 2 years through 5 years spiked.
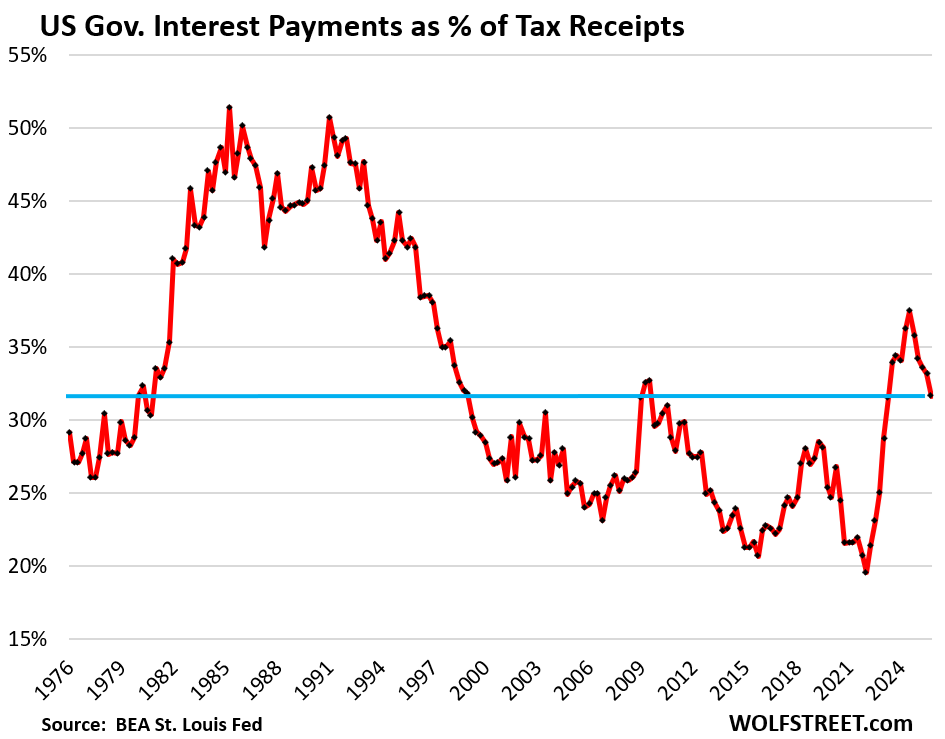
Letting inflation and the economy “run hot” may be the only way of dealing with the ballooning federal debt – that is on an “unsustainable path,” as Powell likes to say – as the hopelessly Drunken Sailors in Washington refuse to do anything other than piling even more debt upon it.
Higher inflation, such as in the 3% to 5% range, and higher nominal economic growth result in higher tax receipts, which make the interest payments easier to deal with, and we already see some of those effects, such as in the portion of tax receipts that get eaten up by interest payments:
Years of higher inflation and higher nominal economic growth also reduce the burden of the existing securities when they mature because they get paid off with devalued dollars.
But for existing bond holders, this inflation would add to their nightmares. And potential bond buyers, facing these treacherous times, would then recalculate their inflation projections and adjust at what yields they would be interested in buying, and those yields would be higher still.
Enjoy reading WOLF STREET and want to support it? You can donate. I appreciate it immensely. Click on the mug to find out how:

![]()
A little “Volcker Shock” and a “Saturday Night Massacre” coming?
When does Warsh start? His confirmation is done, right?
FED is way behind the curve and is injecting liquidity from Dec 2025. We CAN NOT call it QE but this whole Reserve management is BS. If Banks want money borrow it from Discount window or use the SRF. That’s how needs to be. Thats how it was.
Latest Balance sheet shows FED balance sheet has now grown to 6.73T. FED has undone all its QT between April 2025-Dec 2025. So we are back to April 2025 level. Why wont we have ATH in All Stock indices?
Trump’s bogus charges and criticism distracted us from actual issues; Powell led FED’s poor performance in it mandate. Powell got lot of sympathy because Trump’s attacks.
I really hope Warsh takes the charge and starts balance sheet reduction quickly. Stop rollover of MBS into Treasury securities immediately. Sell those MBS.
Lets see if he really can Talk the Talk and Walk The Walk.
The Fed has already reduced the amount of the RMPs starting in mid-April. And as of the announcement yesterday, it further reduces them for the next four weeks. The RMPs were a way to deal with the liquidity drain that the TGA (government checking account at the Fed) poses for the markets around Tax Day. The Treasury Dept is now discussing investing the TGA’s excess cash in the repo market, instead of keeping it at the Fed, which would solve that liquidity drain around Tax Days.
Agree. Need to bring back QT badly to deflate the huge stock market bubble, which is completely out of control, seen in the 500%-1000% stock gain in semiconductor and memory stocks in just one month.
Here we go, as we have read with caution for years. It will be interesting to see how long the equity euphoria continues.
Well, since AI is going to be a deflationary “sure thing” (after the initial inflationary thingy), I guess everyone should load up on 30 year 5% Treasury securities and sit back and watch prices fall as your dollar gains purchasing power.