Home sales in February, as feeble as they were, benefitted from the lowest mortgage rates in years. Those rates are now gone.
By Wolf Richter for WOLF STREET.
Pending home sales, tracking the number of contracts signed in February, ticked up 1.8% on a seasonally adjusted basis from the downwardly revised record low in January, to still rank among a handful of worst months in the data by the National Association of Realtors. The data goes back to mid-2010.
Compared to February 2011, during the Housing Bust and the first February in the data series, pending sales were down by 18%.
Pending home sales compared to the Februarys in prior years (historic data via YCharts):
- 2025: -0.8% (year-over-year)
- 2024: -3.5%
- 2023: -11.3%
- 2022: -31.3%
- 2021: -35.0%
- 2020: -34.9%
- 2019: -29.2%
- 2018: -32.7%.
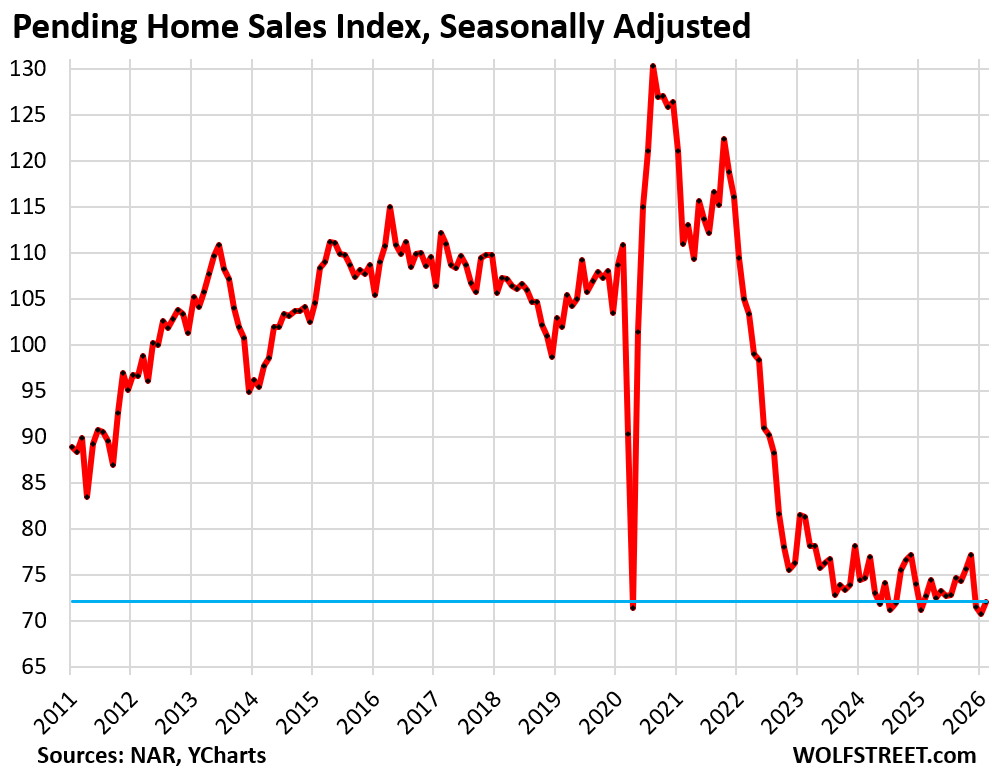
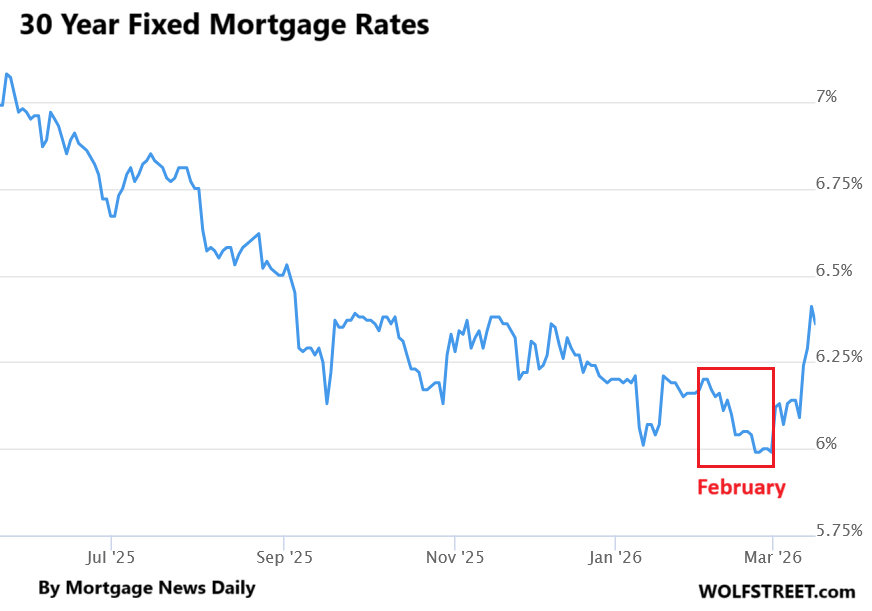
But mortgage rates when these contracts were signed in February were a lot lower than now. The average 30-year fixed mortgage rate even dipped into the upper 5%-range in February, the lowest in over three years. And still, it didn’t do much for home sales.
Now, in March, the average 30-year fixed mortgage rate spiked back into the 6.3% to 6.4% range, the highest since last fall, according to the daily measure by Mortgage News Daily.
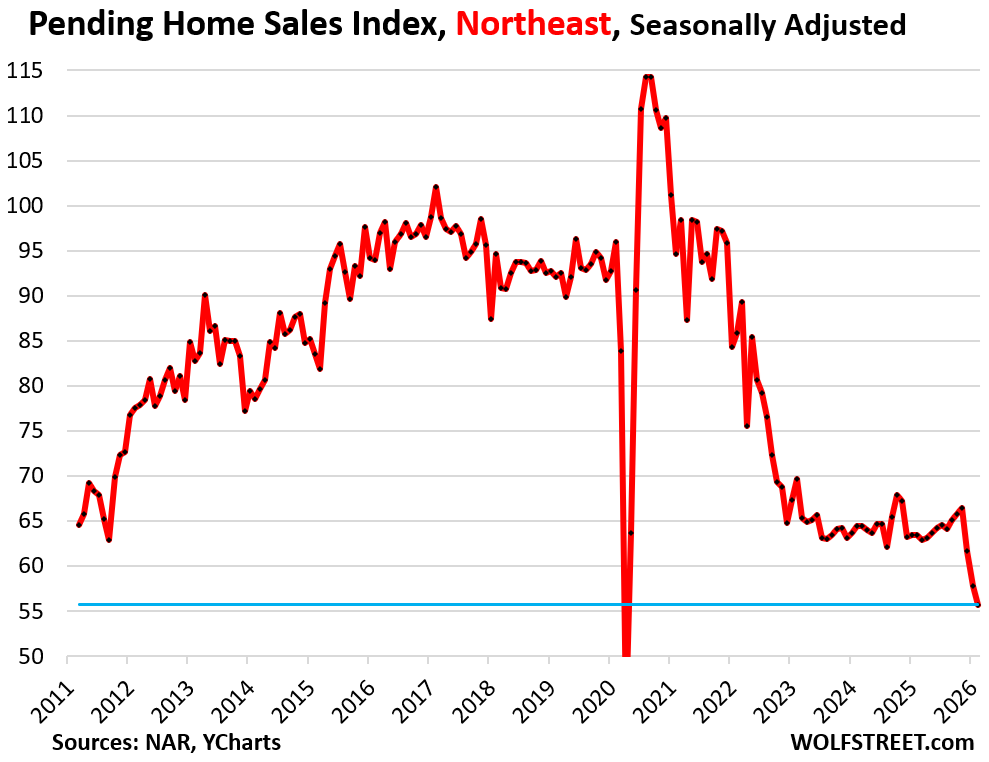
Pending home sales plunged in the Northeast to the second-lowest on record, behind only lockdown March 2020, but rose in the other three regions, seasonally adjusted.
The metric of pending sales tracks contracts that were signed in February but that haven’t closed yet and could still get canceled because buyers cannot afford homeowner’s insurance, or cannot sell their own home, or for other reasons. The rate of cancellations has been running high.
Pending home sales by region.
A map of the four Census Regions is posted in the comments below.
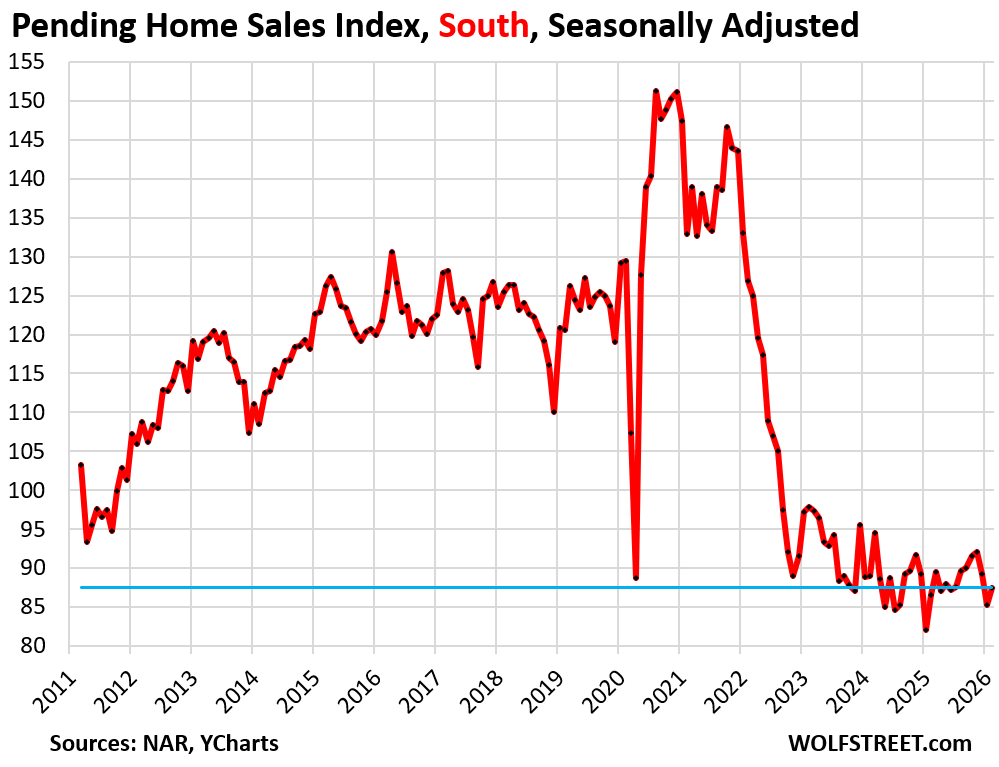
In the South, pending sales rose by 2.7% in February from January, seasonally adjusted, following back-to-back drops in January and December.
Compared to the Februarys of prior years:
- 2025: +1.2% (year-over-year)
- 2024: -1.7%
- 2023: -10.5%
- 2022: -31.0%
- 2021: -34.2%
- 2019: -27.4%.
In the Northeast, pending sales dropped by 3.6% month-to-month, the third steep month-to-month drop in a row, to the second-worst sales on record, behind only lockdown-March 2020.
Compared to the Februarys of prior years:
- 2025: -12.1% (year-over-year)
- 2024: -13.5%
- 2023: -20.1%
- 2022: -35.2%
- 2021: -41.1%
- 2019: -39.5%.
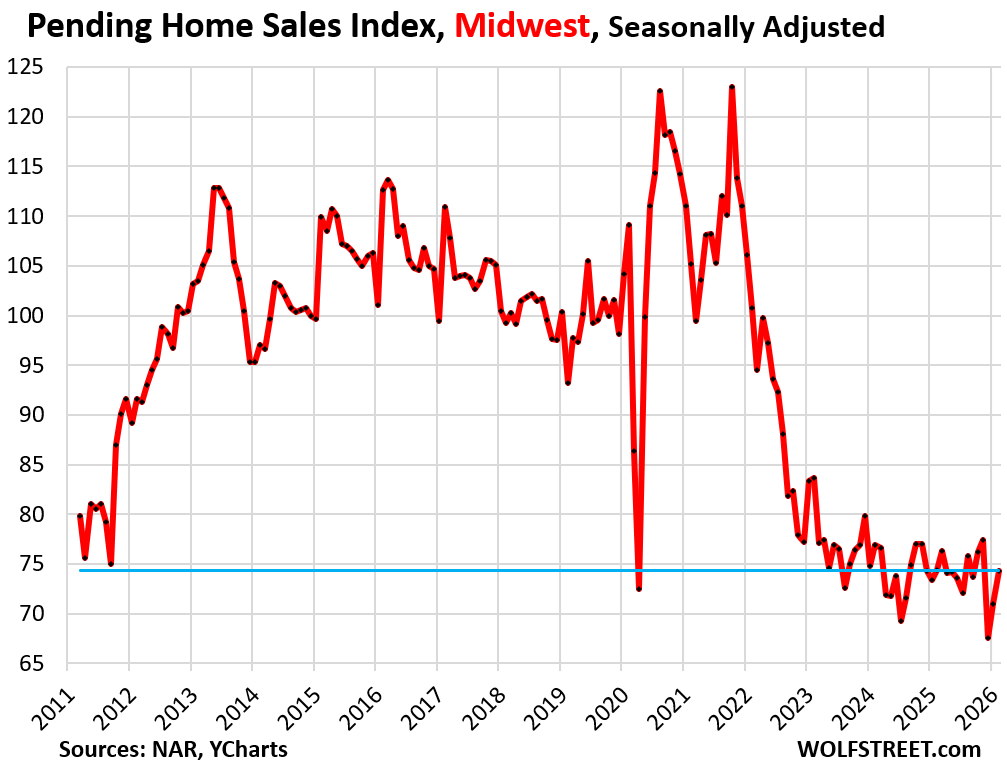
In the Midwest, pending sales rose by 4.6% in February from January, seasonally adjusted, the second increase in a row after the 12.7% plunge in December to a record low in the data going back to mid-2010.
Compared to the Februarys of prior years:
- 2025: -0.1% (year-over-year)
- 2024: -3.4%
- 2023: -11.2%
- 2022: -26.3%
- 2021: -29.4%
- 2019: -20.3%.
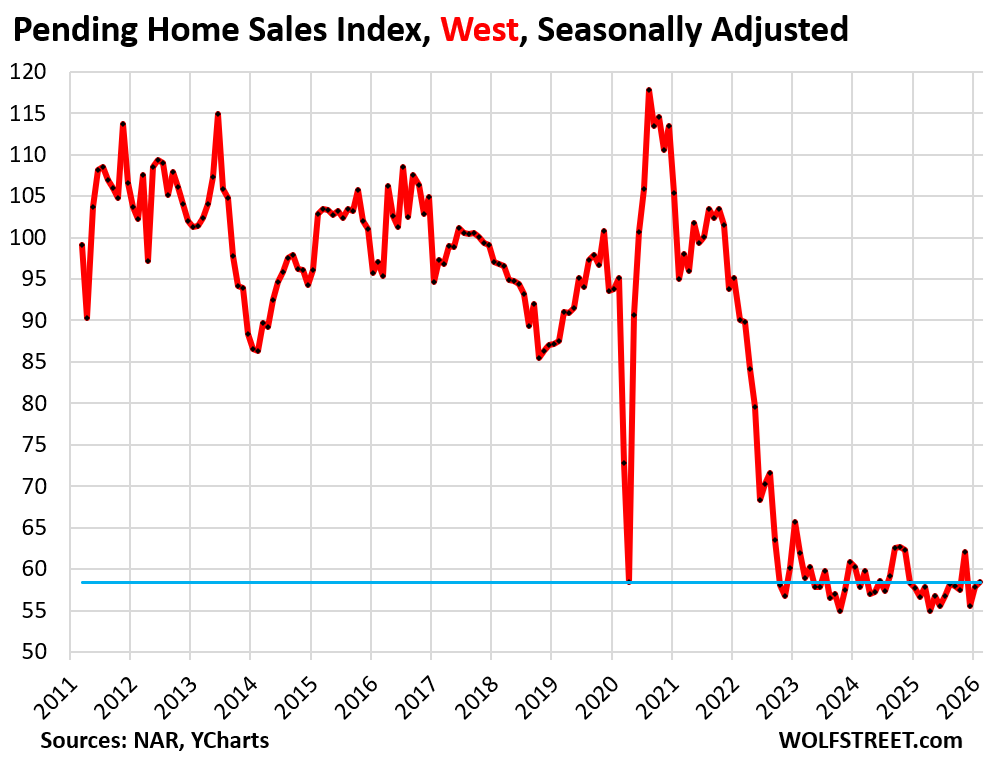
In the West, pending sales inched up by 0.9% in February from January, the second increase after the 10.6% plunge in December, seasonally adjusted.
Compared to the Februarys of prior years:
- 2025: +3.2% (year-over-year)
- 2024: +0.9%
- 2023: -5.8%
- 2022: -35.1%
- 2021: -38.5%
- 2019: -33.3%.
So not surprisingly, the housing resale market remains frozen, hampered by too-high home prices that had exploded during the years of ultra-low mortgage rates thanks to the Fed’s reckless monetary policies at the time; and hampered by the super-low mortgages still out there that prevent many homeowners from moving into a new home because they cannot afford to, or don’t want to, give up their current deal, thereby depressing home sales, and everything that goes along with it, such as moving expenses and buying new stuff for the new home, which has been putting a damper on consumer spending. The housing market is now in the fourth year of this situation.
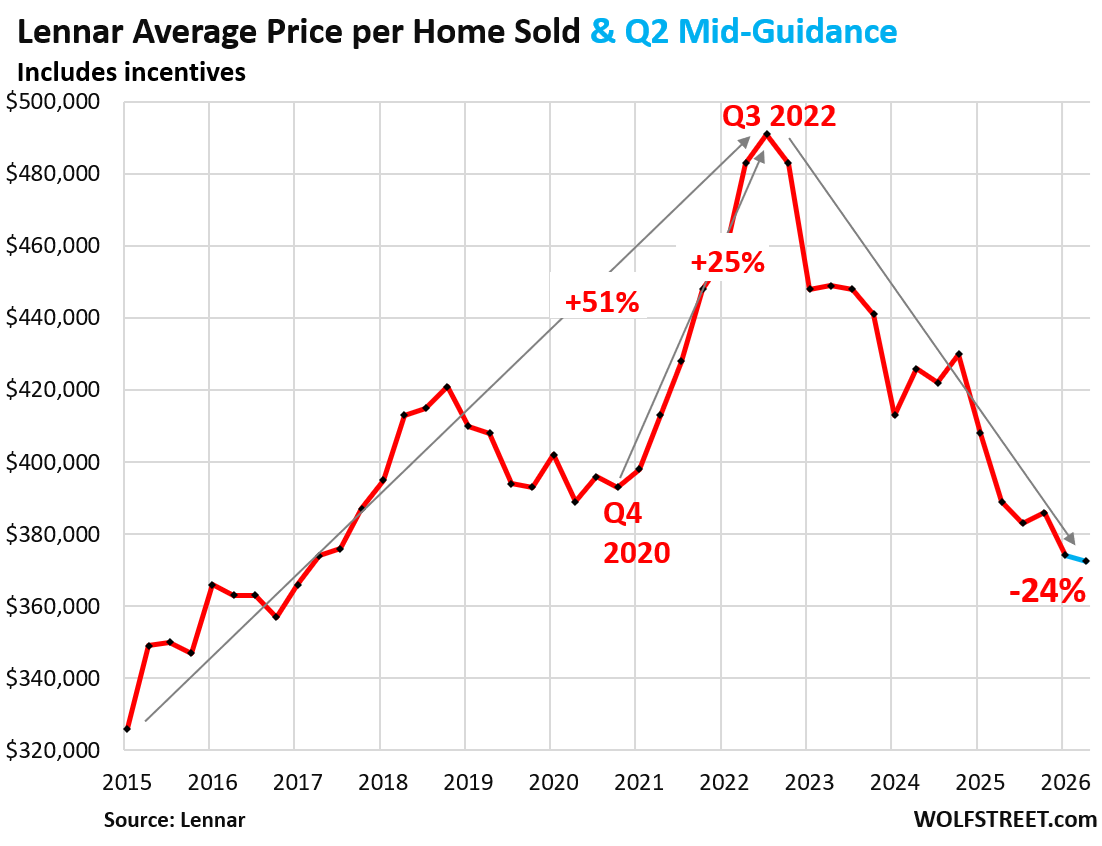
But homebuilders are building and selling at a solid pace. And they’re putting new supply on the market. They’re not frozen.
Lennar’s home sales have surged by 35% compared to the same period in 2022, even as the resale market has plunged over the same period (pending sales -31%). To get there, Lennar cut its average selling price by 24% from the peak in 2022, back to 2017 levels, gunning for the efficiencies of volume to bring down construction costs. Revenues per square foot have dropped, profit margins and profits have plunged, but home sales have surged. “We are adapting to market conditions as they are and not waiting for the market to bounce back,” said Lennar’s CEO during the earnings call [read: What it Takes to Sell Homes in this Market]. Bring on the new supply!
In case you missed it: Supply of Single-Family Homes Surges to Highest for February in 9 Years, Demand Stuck in the Deepfreeze
Enjoy reading WOLF STREET and want to support it? You can donate. I appreciate it immensely. Click on the mug to find out how:

![]()
The four Census Regions of the US:
Thanks for the great article. Mainstream media all touting pending sales rise when the real story is, as you pointed out, they’re down YoY and historically poor going back to great recession.
Hmmmmmm…..,perhaps some folks might consider dropping their prices,nah,the insanity for the near future feel will continue,as will my participation in buyers strike.
MW: Nearly half of new $1M+ mortgages are ARMs: Why rich people are embracing adjustable-rate mortgages now — and whether you should
When rates are already high, ARMs can be a good deal. When rates are low, ARMs are treacherous and can be toxic. The question is where is the line? People definitely think that mortgage rates won’t go much higher, maybe to 7% or 8% at the most, but are much more likely to go lower. That’s the calculus now. In that scenario ARMs are a good deal.
If you have plenty of money (=”rich), which is what that headline says, ARMs don’t pose an existential risk to you. Your mortgage payment will just go up a little if your bet doesn’t work out and the mortgage rate resets higher. You can then just pay off the mortgage.
MW: Mortgage rates are moving higher at a crucial juncture for the housing market
If you want asset prices to fall, then do what Bernanke did, drain reserves for 29 contiguous months.
Insane to see there are still some FOMO diehards out there, lower mortgage rates to only about 6 or 5.5 and they are willing to jump on massively overpriced house “because mortgage rate is lower” narrative…instead of looking at the actual value of the house itself. This is still pretty rampant mindset in SoCal unfortunately…oh well, on the other hand, at least it’s encouraging to see a slight uptick not back all time craziness again so perhaps majority do have some common sense or so priced out, the small reduction (not going bac to 3%) forced their hands..
Canada current mortgages/terms etc
Rate Term Provider
3.89% 5 years Canadian Lender
4.14% 4 years MCAP
4.29% 2 years RBC Royal Bank
4.75% 7 years First National
RE prices Vancouver BC (From CBC press) Very expensive market.
“On the other hand, they’re advising sellers to be more realistic and potentially drop their prices if they aim to complete a property sale this year.
“You would assume with such extreme market conditions — the slowest market conditions that we have seen in the last 20 years, plus record-high inventory levels — you would assume the prices would be crashing,” said Oleg Galyuk, a real estate agent with Royal Pacific Realty.
“But, at the moment, they haven’t really dropped all that drastically,” he added.
And:
Key 2025 Vancouver Real Estate Market Data
Sales Decline: 2025 marked the lowest sales volume in over two decades, nearly 25% below the 10-year average.
Inventory Surge: Active listings rose significantly (up 14.6% by end of 2025), flooding the market with options and reducing buyer urgency.
Price Adjustments: Despite high nominal prices, home prices generally eased across the Lower Mainland, representing a 9.1% drop from the 2022 peak across B.C..
Market Type: The region shifted into a buyers’ market, with over 80% of homes selling below their final asking price [https://dailyhive.com/vancouver/metro-vancouver-home-sales-asking-price-data-2025].
Nothing selling in area where I live (judging by the RE advert signage) except the odd word of mouth private sale. Besides prices being too high, tariff uncertainty and the current war disruptions are producing a wait and see attitude about moving and selling in general.
Inflation rate last month was 1.8%.
Folks I know that are still working are just glad to have a job and are building savings.
Let’s take a vote. Which of the following investors do you think will do better? E.g. reach $1M net worth sooner?
1) Has $100k. Puts it all down on a $750,000 2,700sf tract home built in 2006. Mortgage rate: 6.4%. Mortgage payment: $4700/mo. Insurance: $200. Invests all savings into a 60/40 portfolio in their 401k.
2) Has $100k. Rents an apartment for $2500/mo. Pays no interest, PMI, or insurance. Invests all savings into ex-US stocks (VXUS), Eurobonds, yen bonds, Aussie bonds, and precious metals, maxing out IRA’s.
I vote the guy who sold a tract home for $750K reaches $1M sooner.
But but but……..housing is such a safe bet investment while stock market is all risks…that’s the kind of talking points you will get from older boomer parents or buy at all cost house advocate…
Another way to look at your example, reverse that to 20yrs ago, similar situation but instead of buying bonds and stock, have that same person invest $100K 20 yrs ago into BRK-B, let’s see who comes out ahead now…
The drop in the northeast is stark. The graph indicates seasonally adjusted, so poor weather this past winter isn’t the full picture. Might it be that people are fleeing the northeast? Might it be that new builds are scarce relative to the south and Midwest?
The northeast has gotta get its act together if businesses there want employee mobility. There seems to be extra friction in the northeast, hence the lowest relative home sales compared to other regions.
Are you talking about Massachusetts?
I do see slight price drops in central/western mass,a lot of new signs suburbs around Boston,will see how quickly they do/don’t disappear.
I work on a few homes right now in Millis and the pricing there and getting closer to Boston still insane.
Glad am a N.H. resident.
Your comment doesn’t track. Zillow home price index is still increasing YoY for just about the entire metro- Boston area and Manchester NH has been among the hottest real estate markets in the whole country the last 3 years.
Lack of land in much of metro New England helps keep prices higher and many are “locked in” as Wolf described above.
Boston February Zillow ZHVI of all homes -0.4% YoY. Call it unchanged yoy
Hot off the press:
https://wolfstreet.com/2026/03/17/the-most-splendid-housing-bubbles-in-america-price-drops-gains-in-33-big-expensive-cities-february-2026/
Well I’ll have to say “was up” year over year until now ;)
Let’s hope this market thaws out a bit.
Rick, stated around Boston metro the prices insane,said central/western part of state seeing some drops.
Same with N.H.,near Nashua/Manchester ect. prices same,get away from them and ski resorts seeing some price drops to a point was interested but could not even with 30 acres build a shop/deal breaker for me on one property.
I am the market I seek in N.H. seeing price drops or starting more reasonable pricing.
Since the pending homes sales index is a unfamiliar index, I went to the NAR website to see its definition. I found this tidbit:
“An index of 100 is equal to the average level of contract activity during 2001, which was the first year to be examined. By coincidence, the volume of existing-home sales in 2001 fell within the range of 5.0 to 5.5 million, which is considered normal for the current U.S. population.”
So right now, sales are about 60-80% of the average level of contracts in the year 2001. In 2001, both the population and the number of homes for sale were less than currently. Therefore, these numbers are actually quite a bit worse than at first glance, if I am interpreting the definition correctly.
Perhaps, there is some normalization that I am missing in my musings. It is definitely as strange index.
California here: Even in the central valley, $1 million dollar stick houses are common. You don’t become rich because the money is inflated or because of financial bubbles in food, clothing, shelter, or anything else one needs to survive.
Here’s to hoping “my salary increases to $1MM/ year!”
Even if a Camry is $1.5 MM!?!
When the term “millionaire” was coined, it was in reference to a speculative bubble.