19 Metros below 2022 peaks: Austin -22%, San Francisco -10%, Phoenix -9%, San Antonio -8%, Denver -7%, Salt Lake City -6%, Sacramento -6%, Portland -6%, Dallas -6%, Seattle -5%, Honolulu -5%…
By Wolf Richter for WOLF STREET.
The dynamics in the housing market are now sort of messy: The lowest demand for existing homes since 1995 has led to rapidly rising active listings, as buyers are on strike because prices are too high. Homebuilders have been building single-family houses at breakneck speed, creating the biggest pile of unsold completed houses since 2009, and they’re throwing around massive incentives, including mortgage-rate buydowns, to move the inventory.
Mortgage rates, which have risen on renewed inflation fears since the Fed started cutting rates, are back to the old normal, before the era of QE started in 2008, and Fannie Mae’s CEO said that people should get used to them. To top it off, renting a nice single-family house is now far cheaper than buying an equivalent house after the mindboggling spike in home prices and the now old-normal mortgage rates.
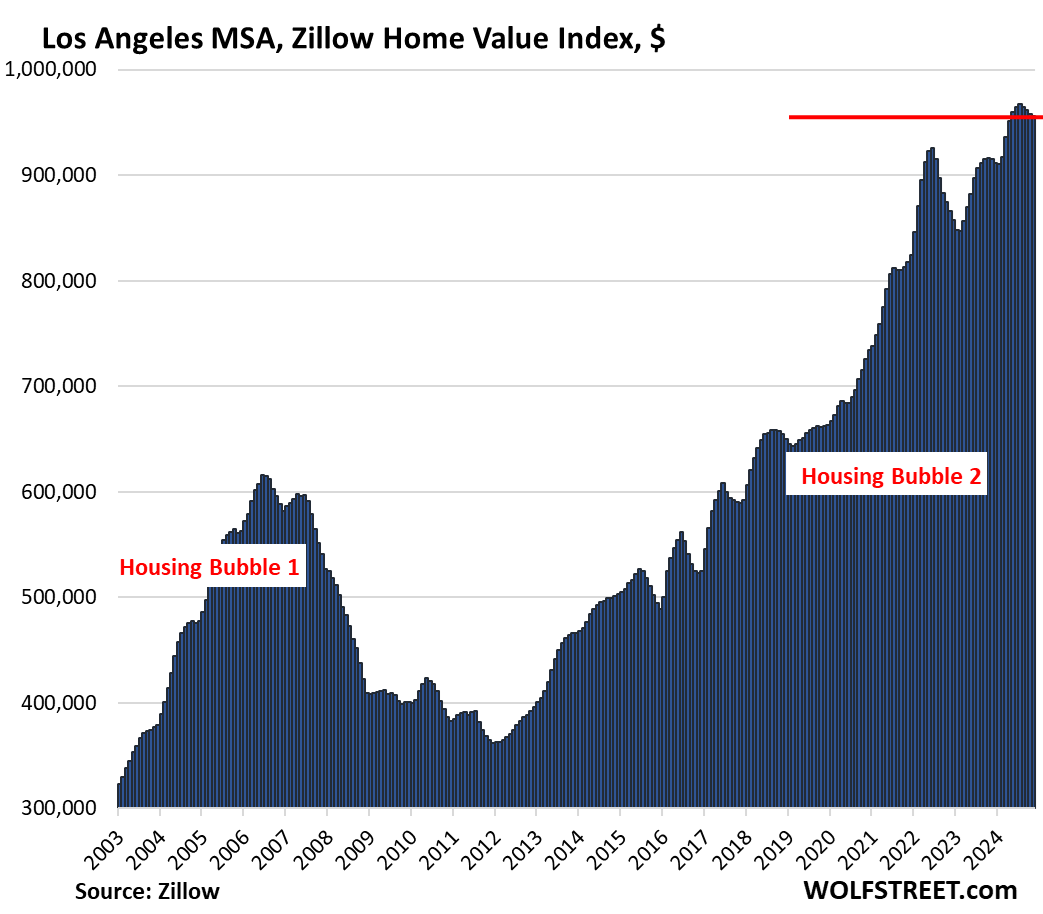
So, prices in many major metropolitan areas, even in San Diego and Los Angles, have started to sag.
Price declines from prior month:
Prices of single-family houses, condos, and co-ops fell in November from October in all 33 of the large metros here.
Some declines are seasonal, or at least in part. But many markets here haven’t had a distinct seasonality in two decades, and therefore their declines cannot be seasonal. Seasonal price changes must happen in a similar way in the same months every year, or they’re not seasonal.
By Metropolitan Statistical Area (MSA), the top month-to-month price declines with drops of -0.3% or bigger:
- Austin, TX: -1.1%
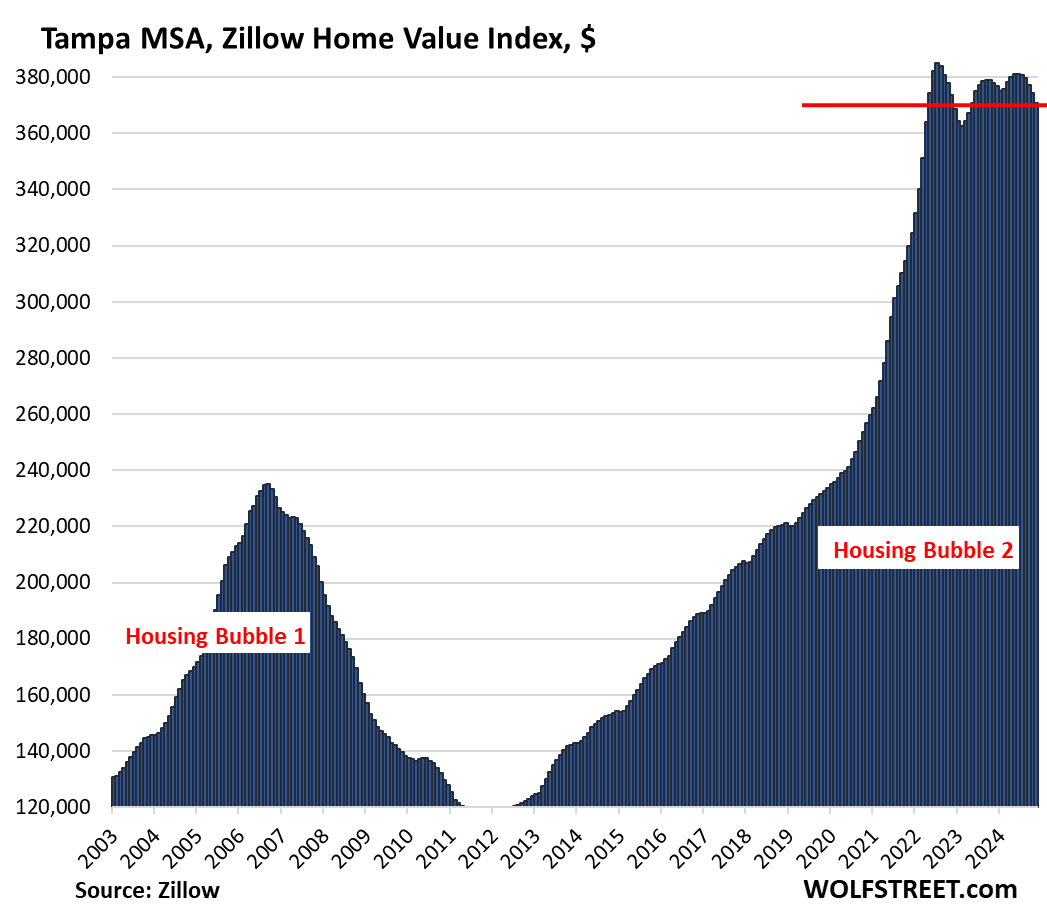
- Tampa, FL: -0.9%
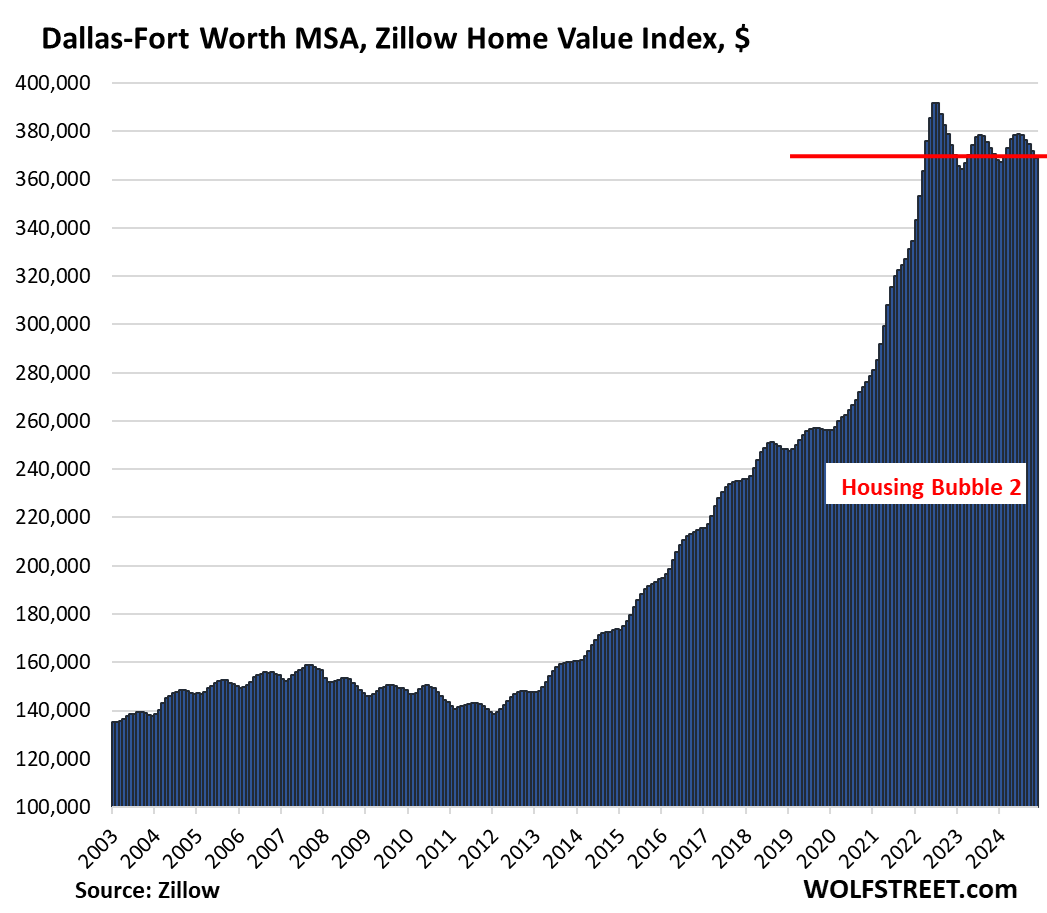
- Dallas, TX: -0.8%
- San Antonio, TX: -0.8%
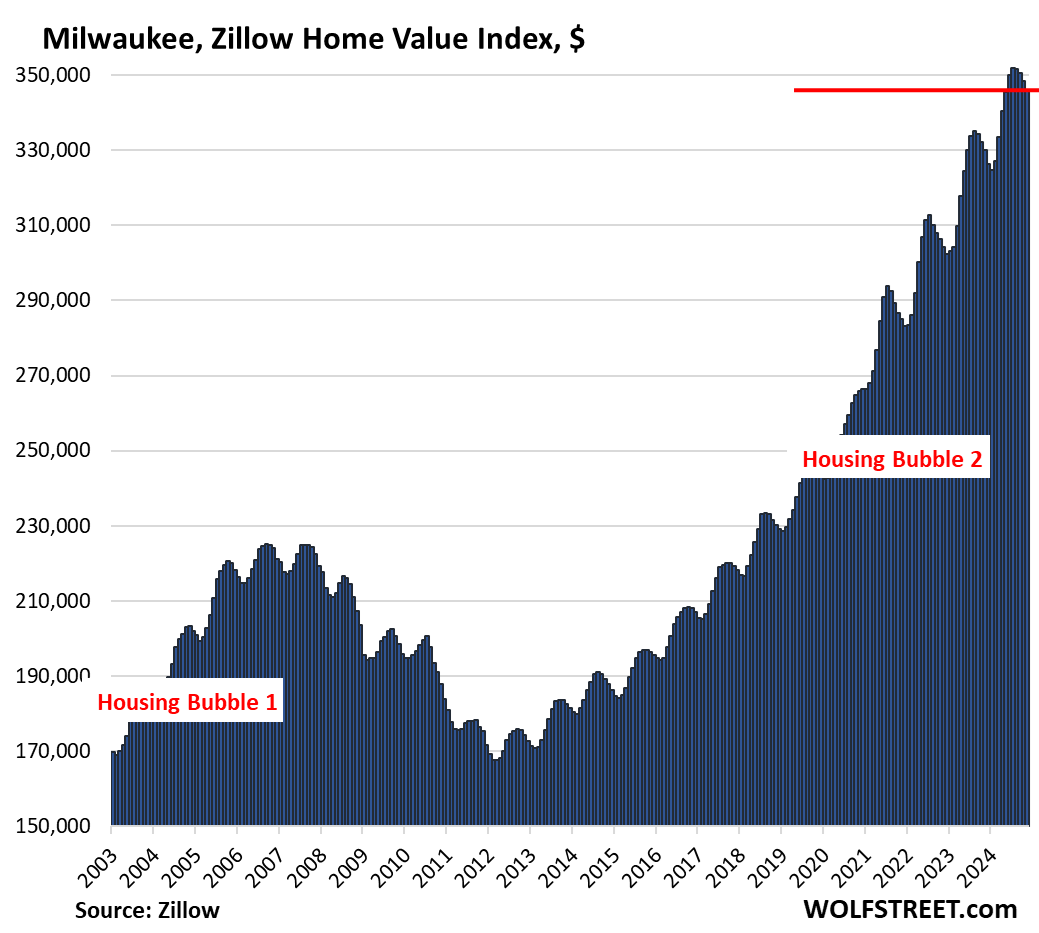
- Milwaukee, WI: -0.7%
- Tucson, AZ: -0.7%
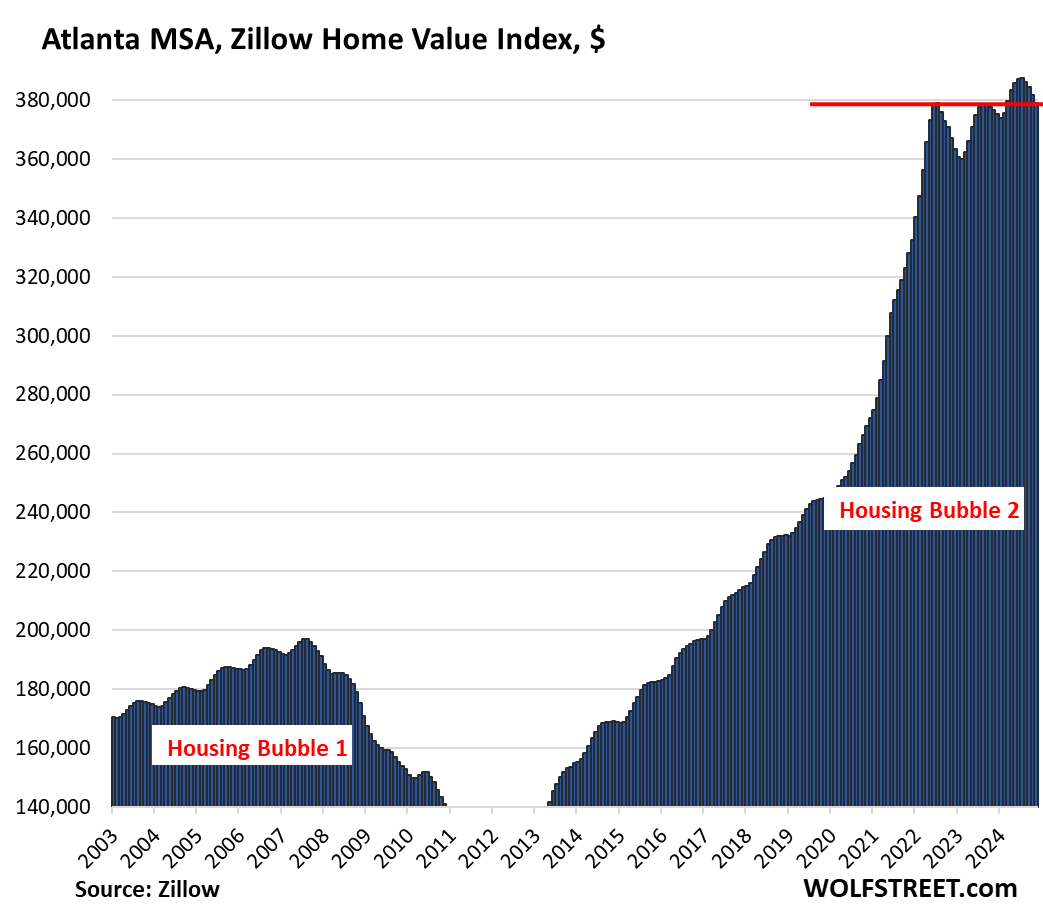
- Atlanta, GA: -0.7%
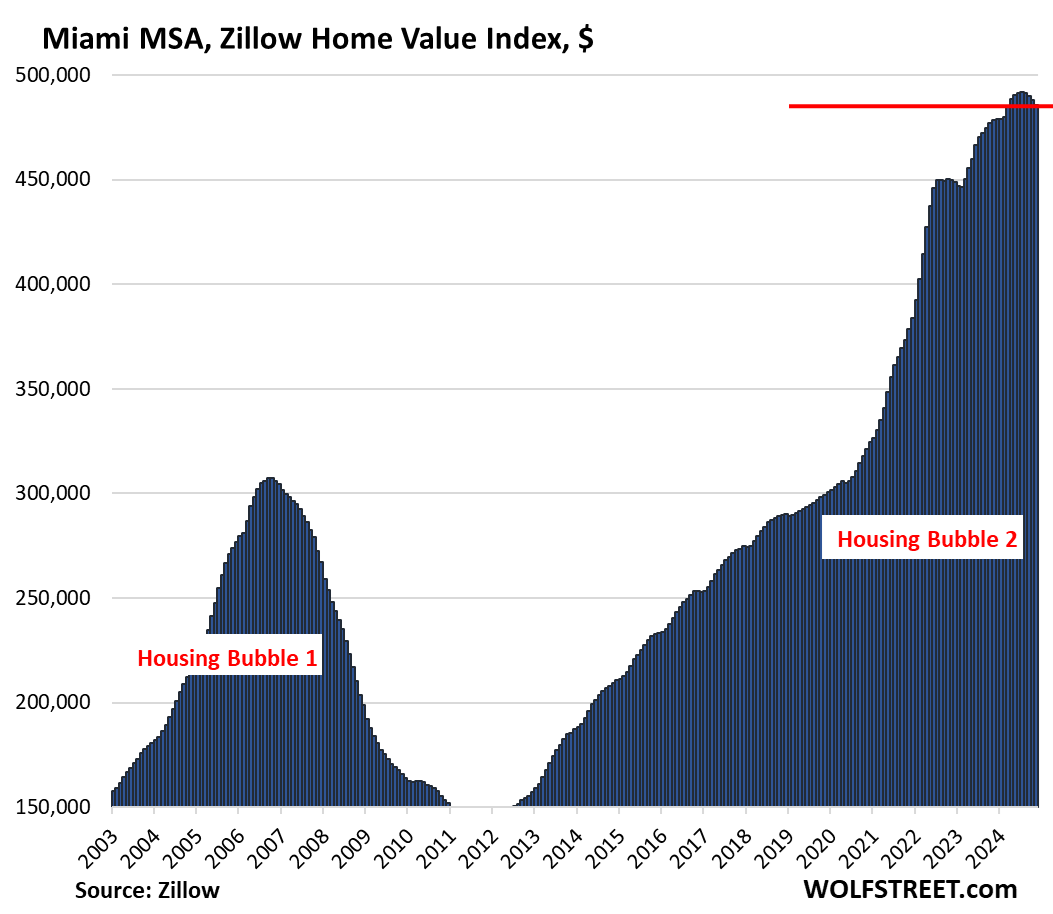
- Miami, FL: -0.6%
- Houston, TX: -0.6%
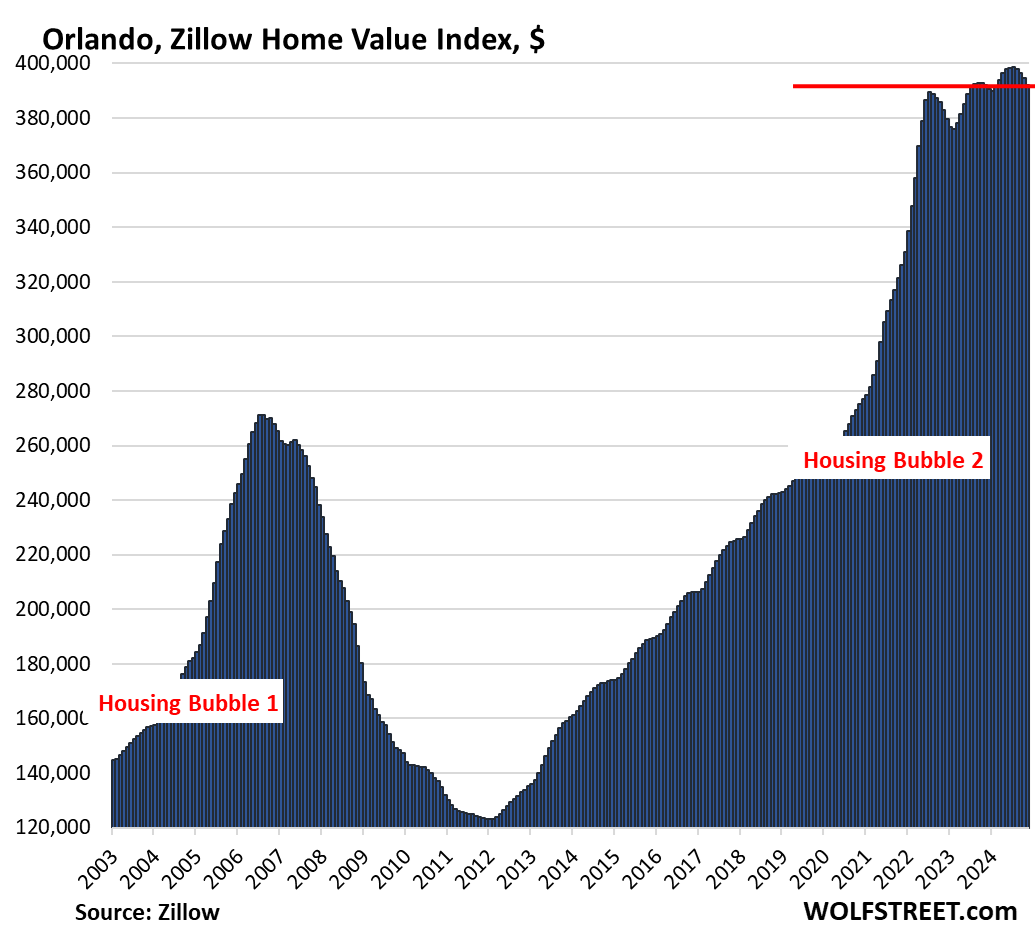
- Orlando, FL: -0.6%
- Raleigh, NC: -0.5%
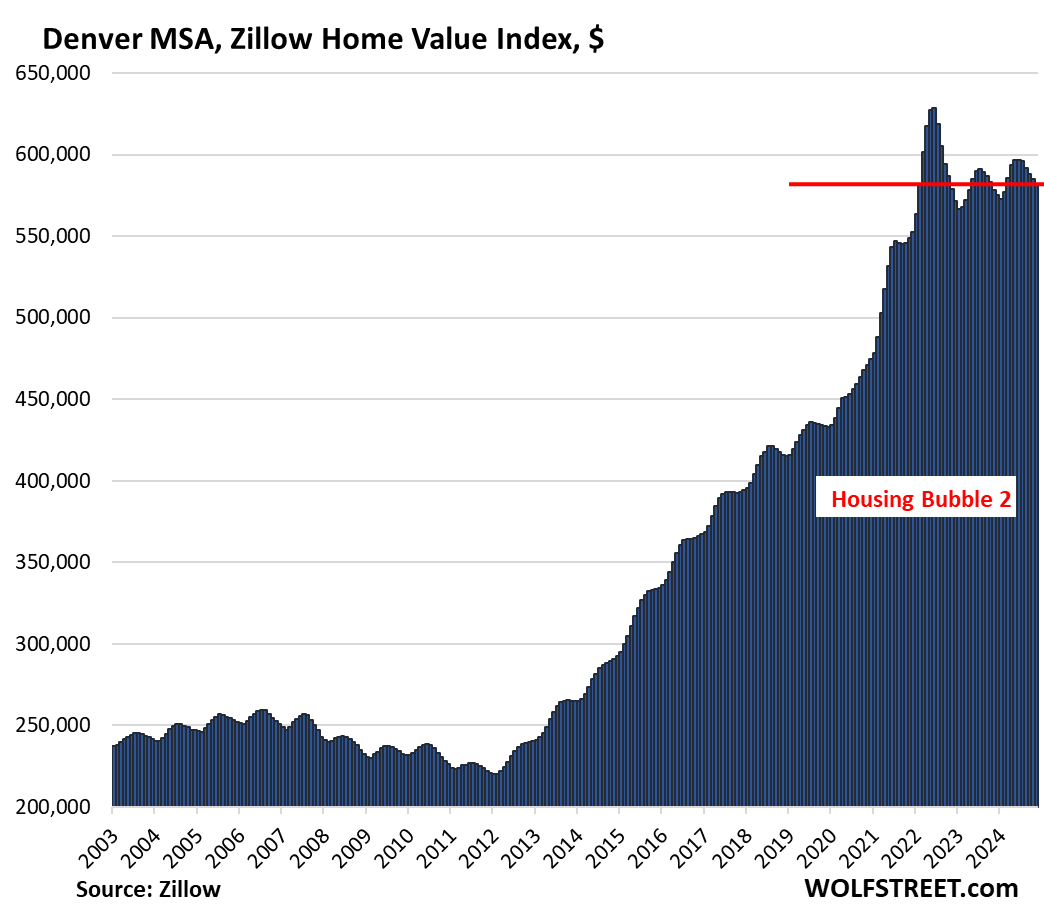
- Denver, CO: -0.5%
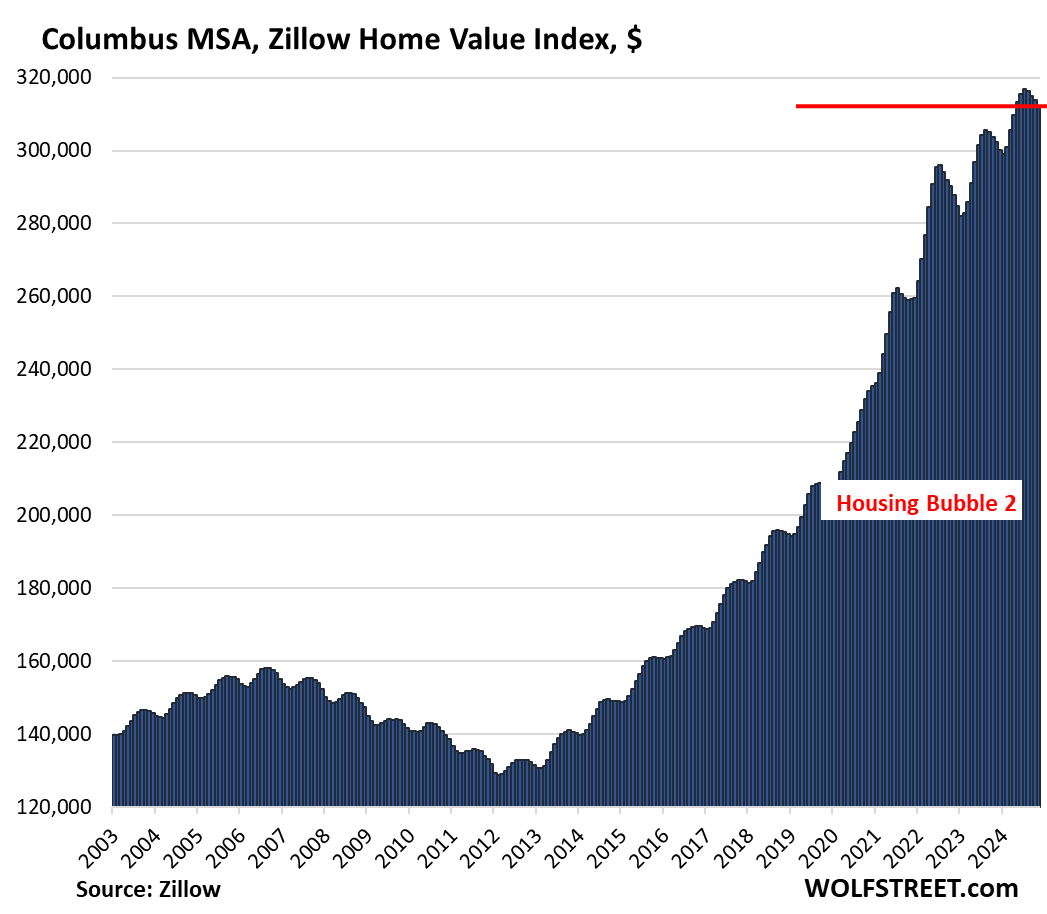
- Columbus, OH: -0.5%
- Phoenix, AZ: -0.5%
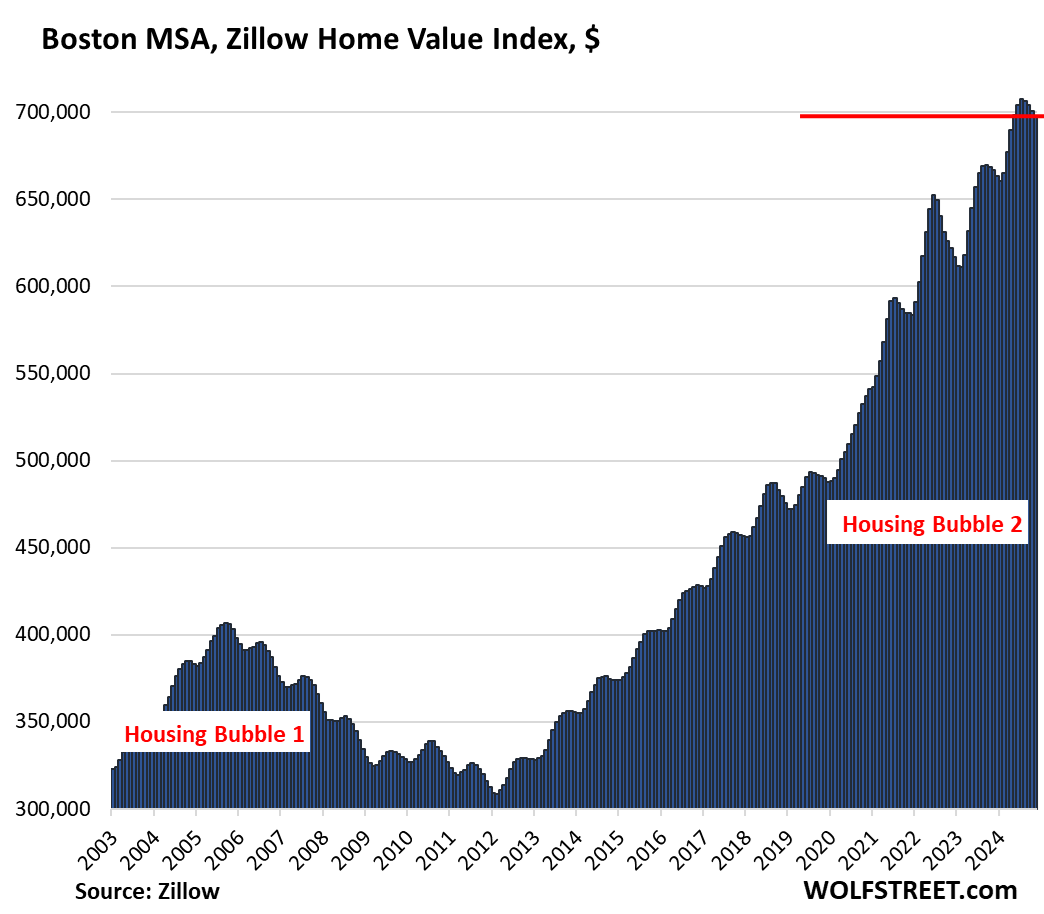
- Boston, MA: -0.4%
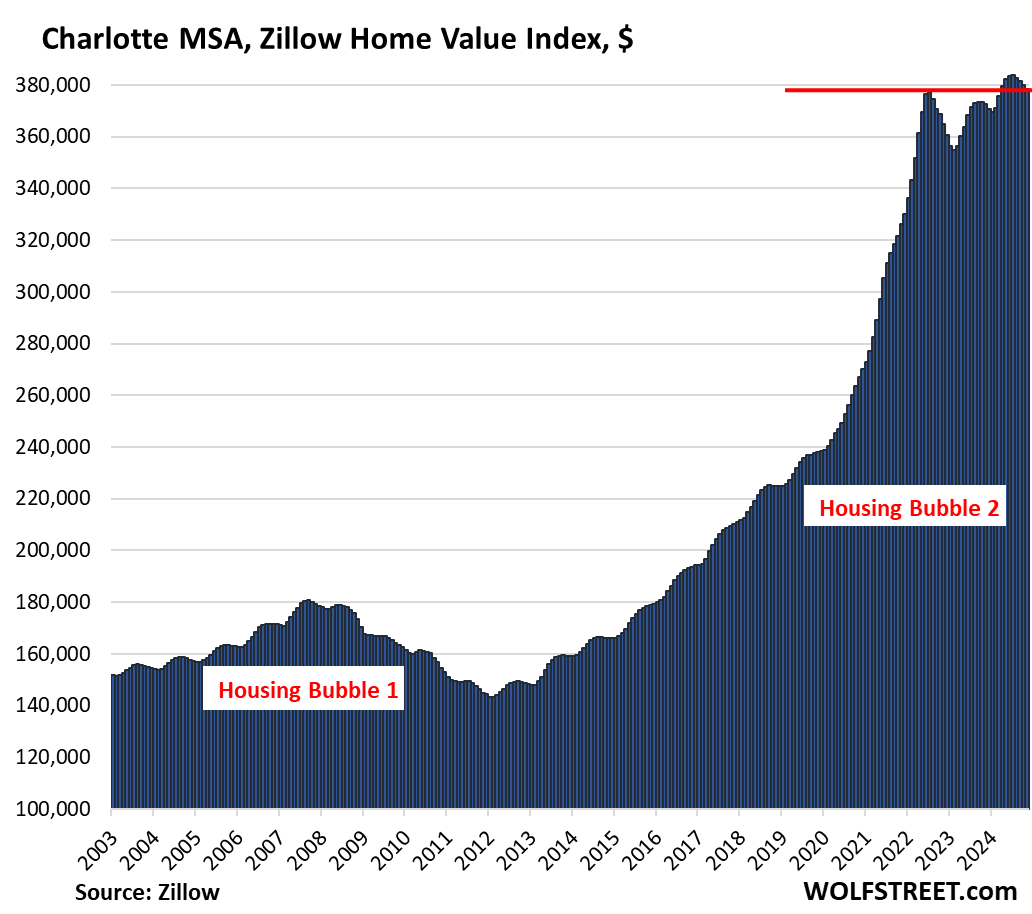
- Charlotte, NC: -0.4%
- Urban Honolulu, HI: -0.4
- San Francisco, CA: -0.3%
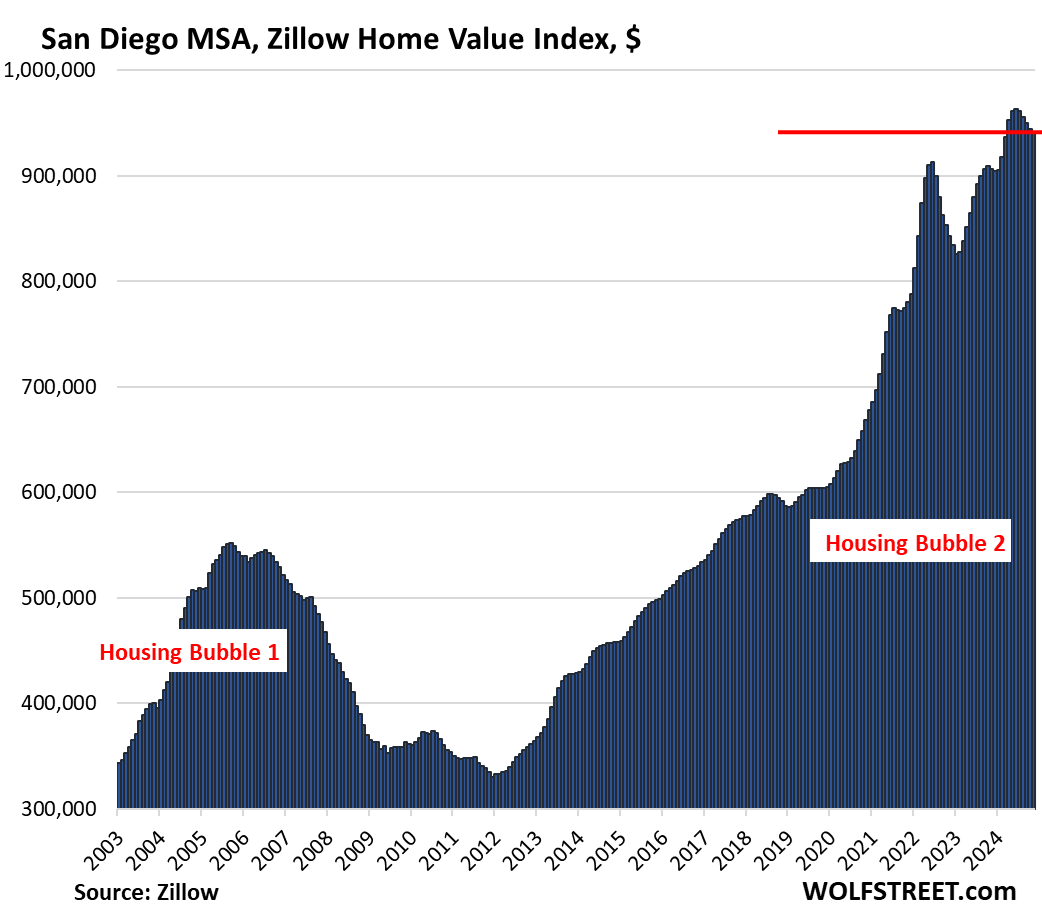
- San Diego, CA: -0.3%
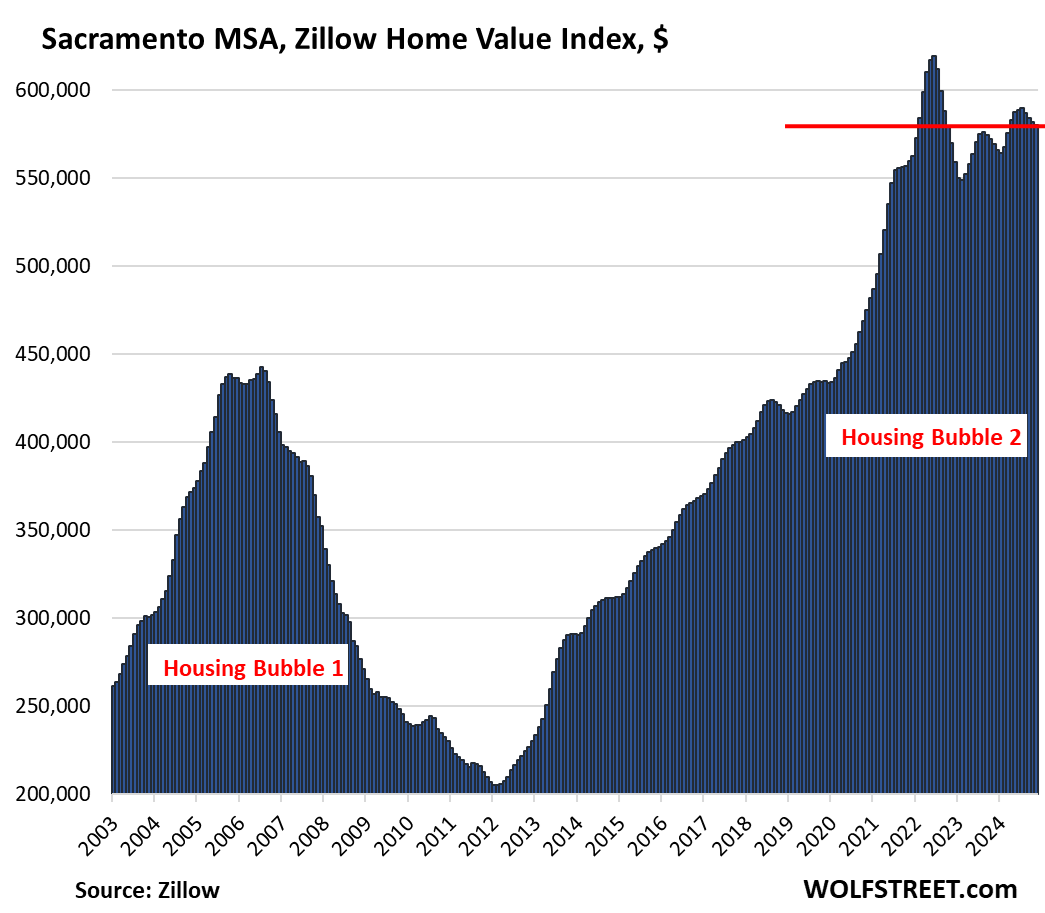
- Sacramento, CA: -0.3%
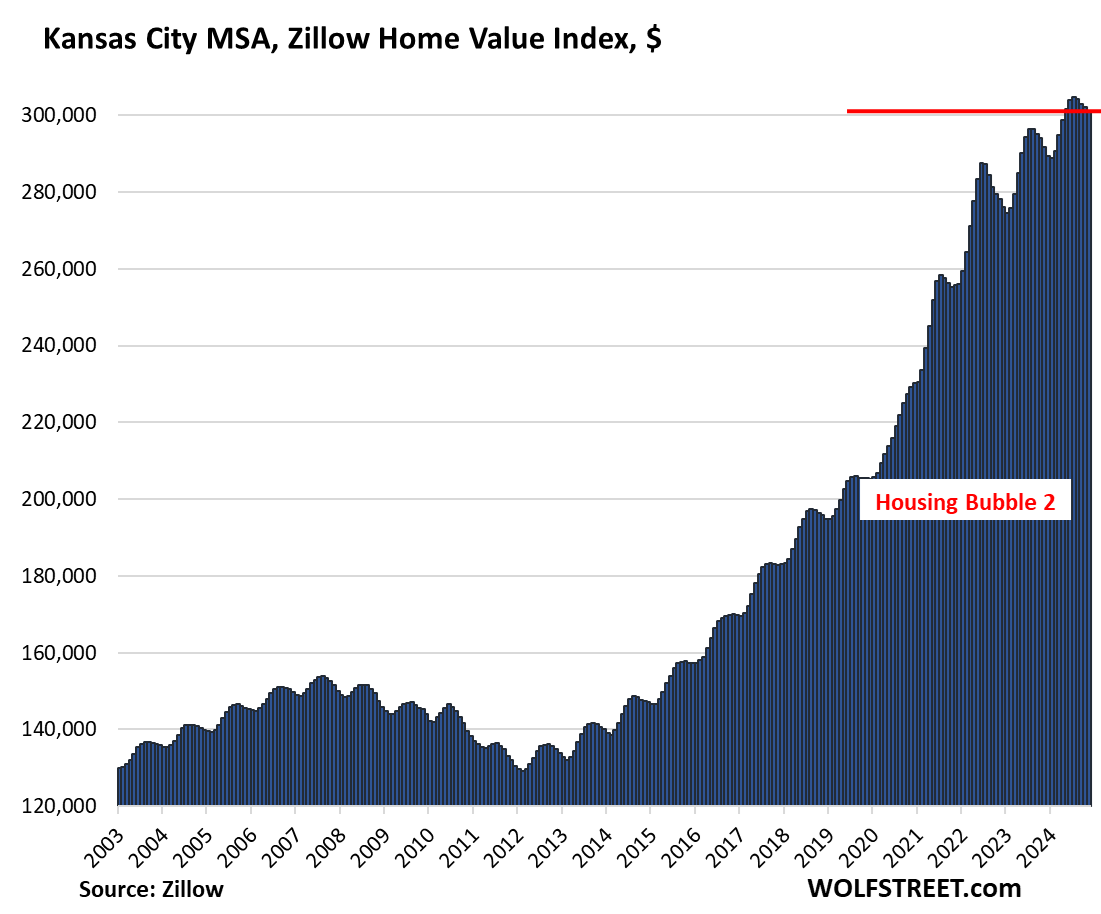
- Kansas City, MO: -0.3%
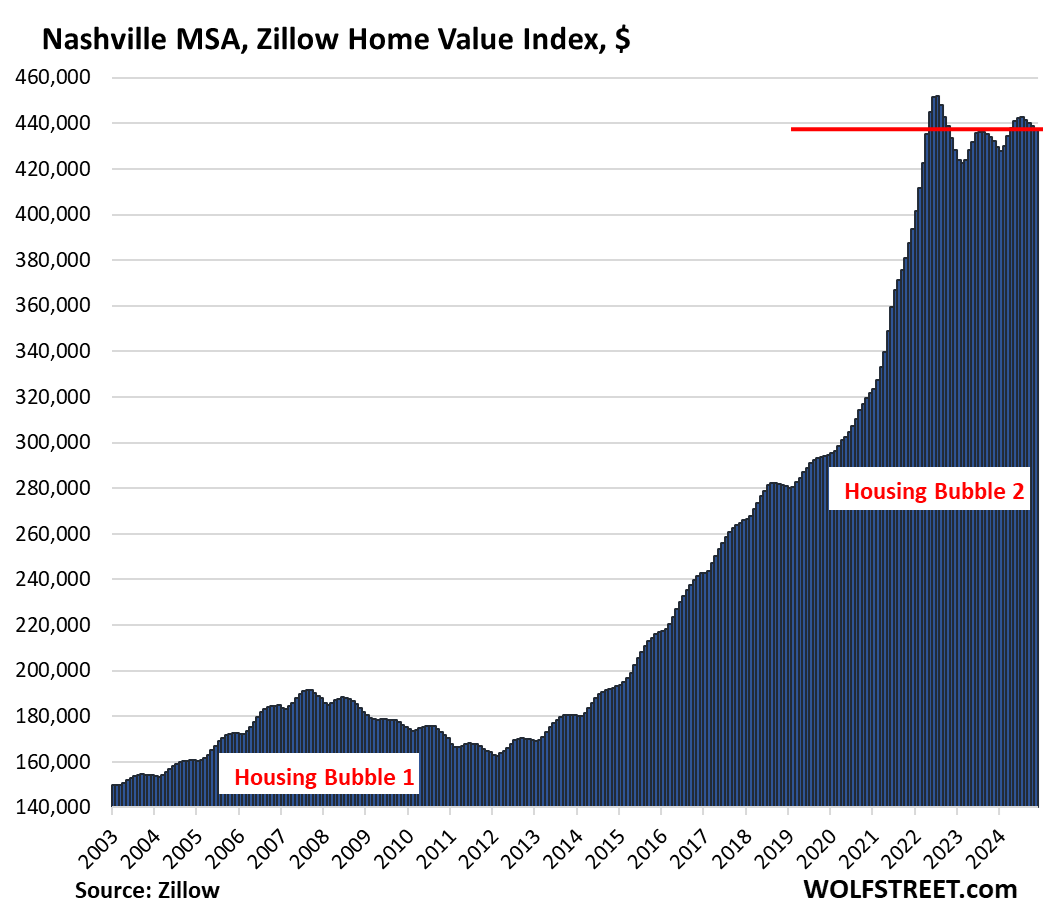
- Nashville, TN: -0.3%
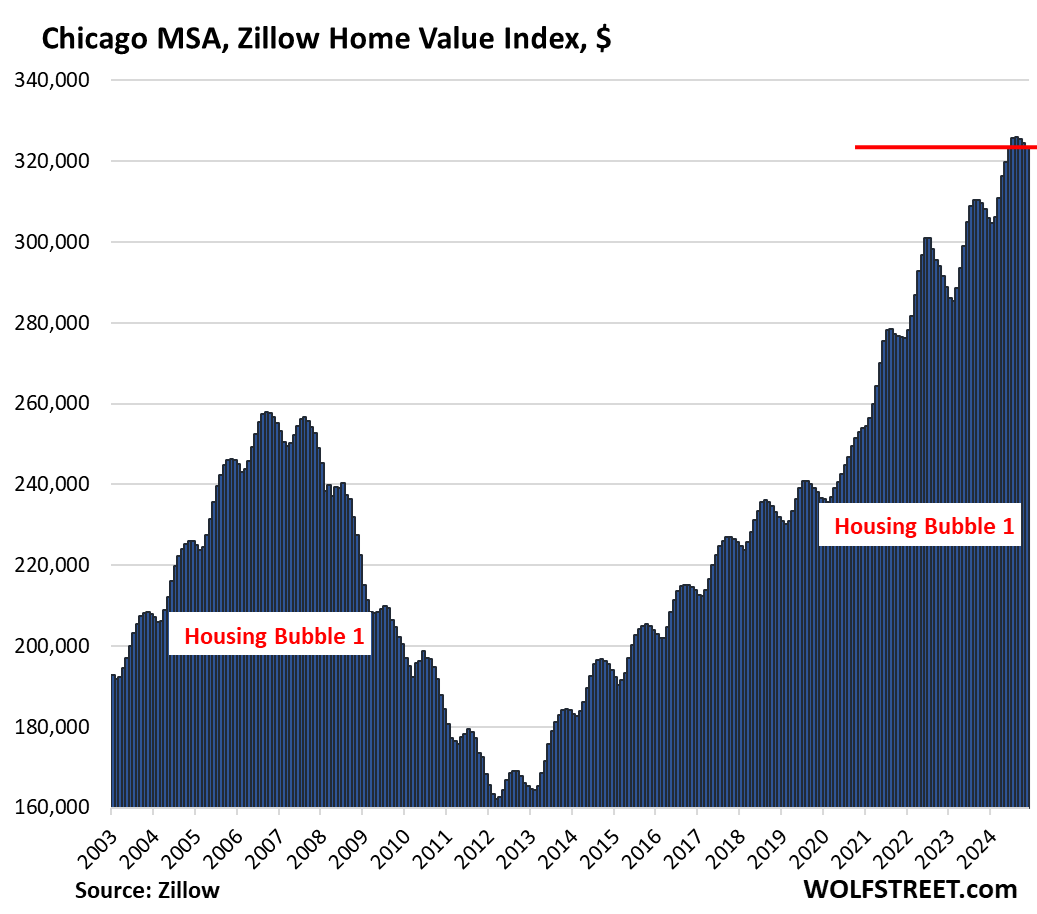
- Chicago, IL: -0.3%
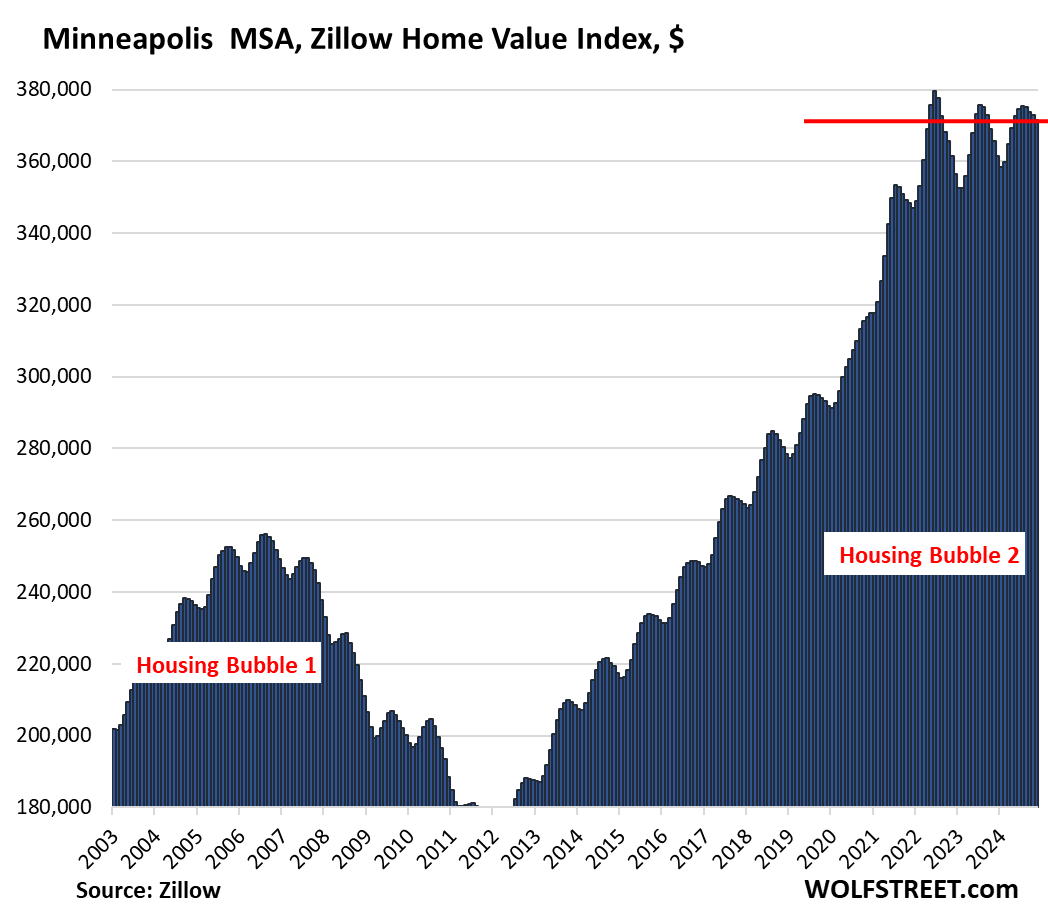
- Minneapolis, MN: -0.3%
- Seattle, WA: -0.3%
Down from their 2022 peaks:
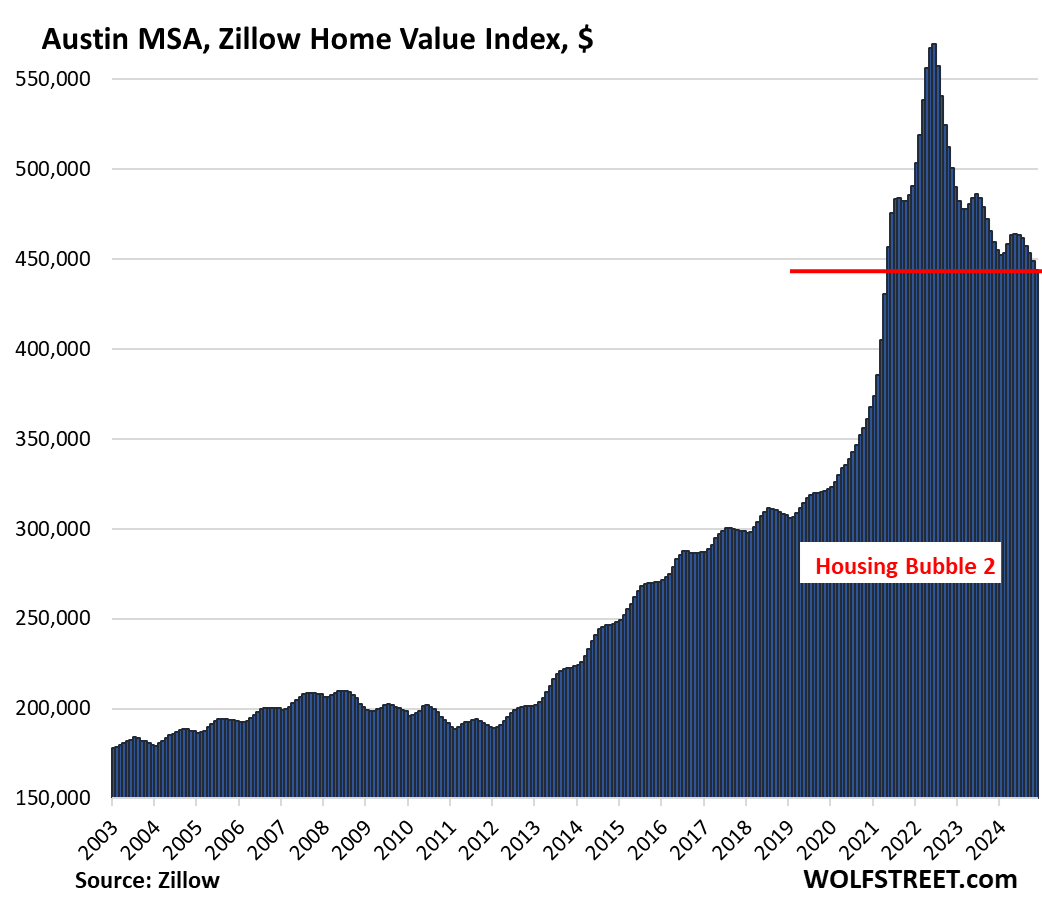
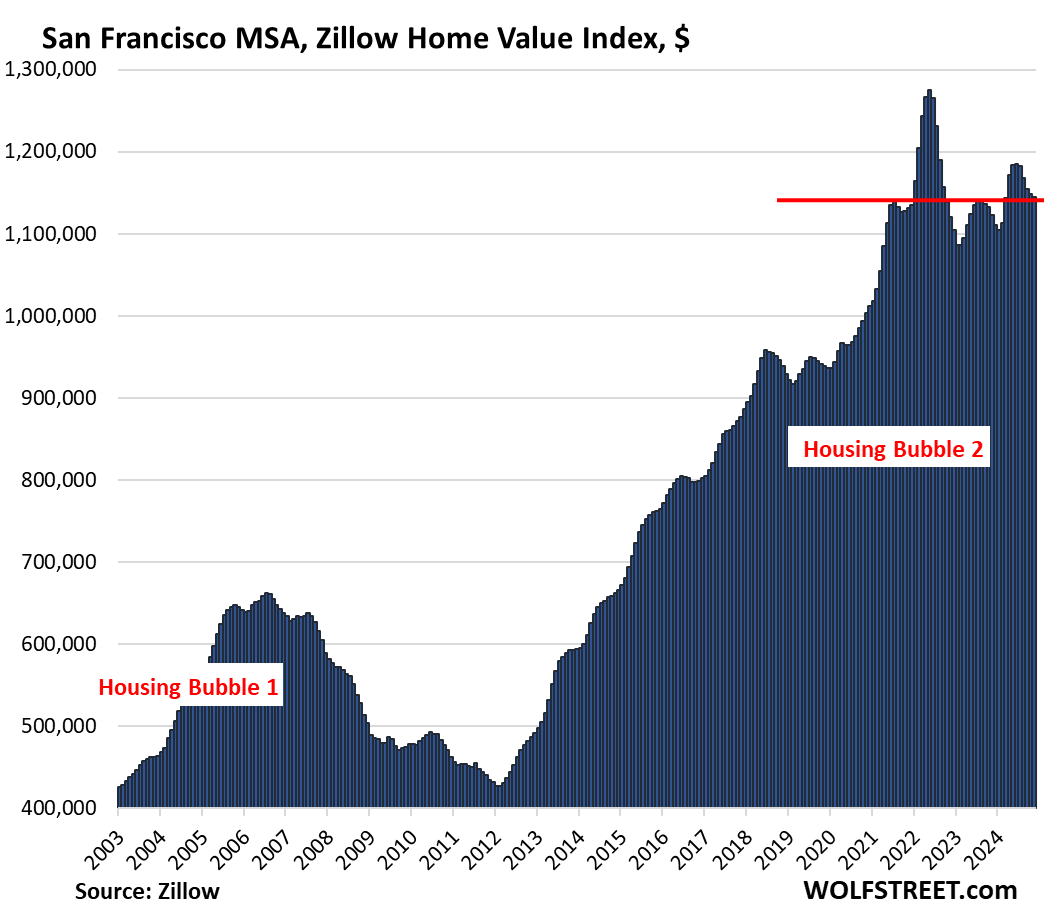
Home prices in 19 of the 33 MSAs here were down from their respective peaks in mid-2022, so about two-and-a-half years ago, two of them by the double digits: Austin and San Francisco:
- Austin: -22.0%
- San Francisco: -10.2%
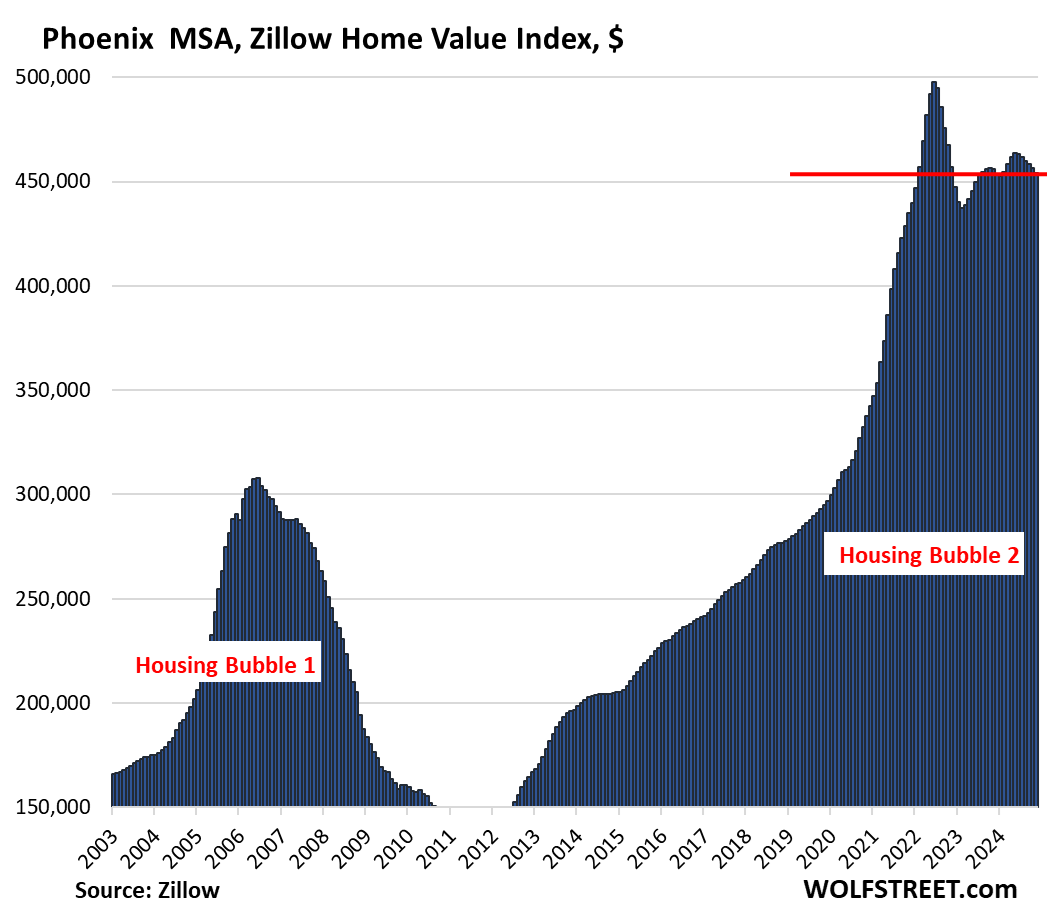
- Phoenix: -8.8%
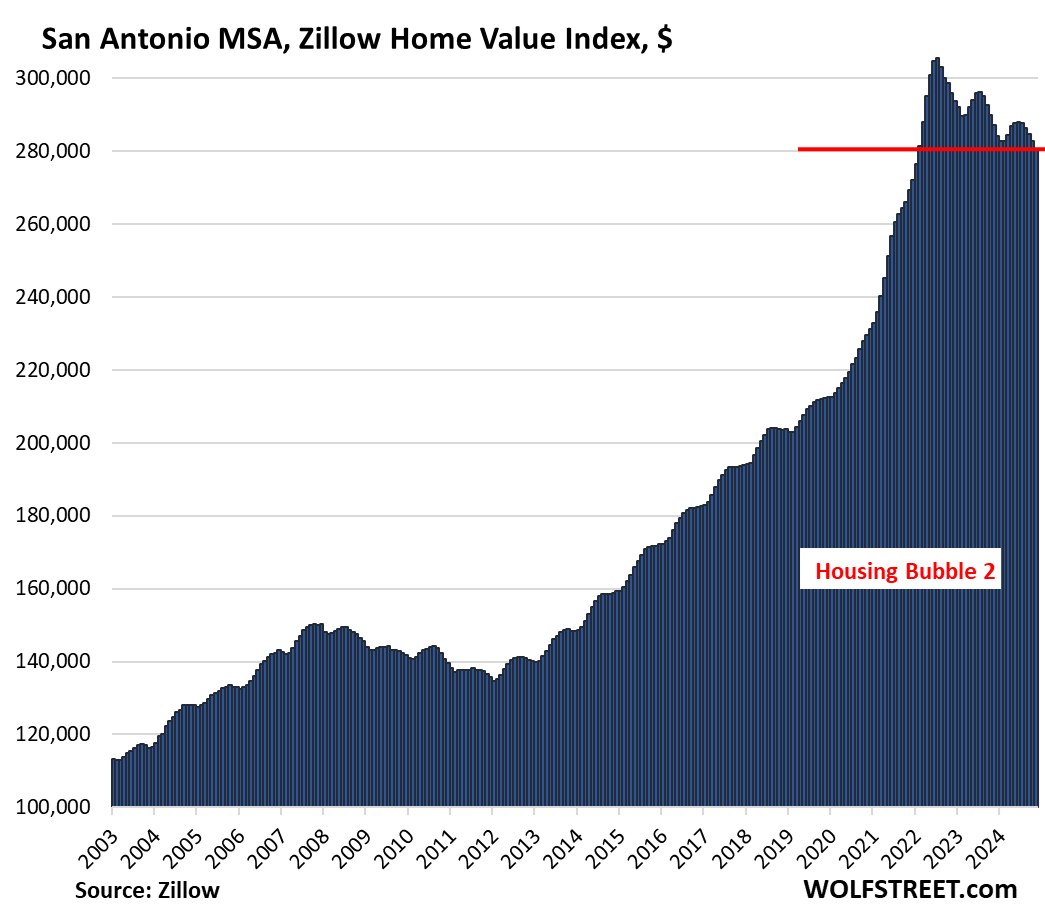
- San Antonio: -8.3%
- Denver: -7.4%
- Sacramento: -6.3%
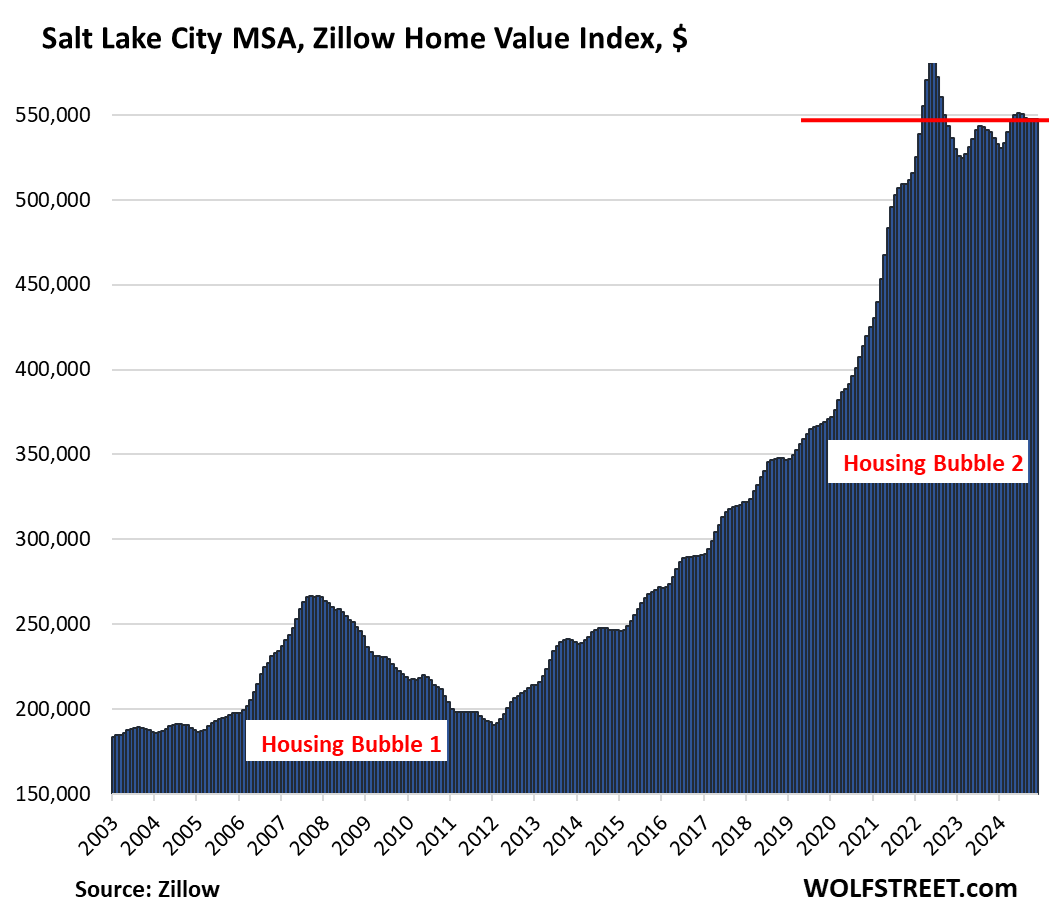
- Salt Lake City: -5.8%
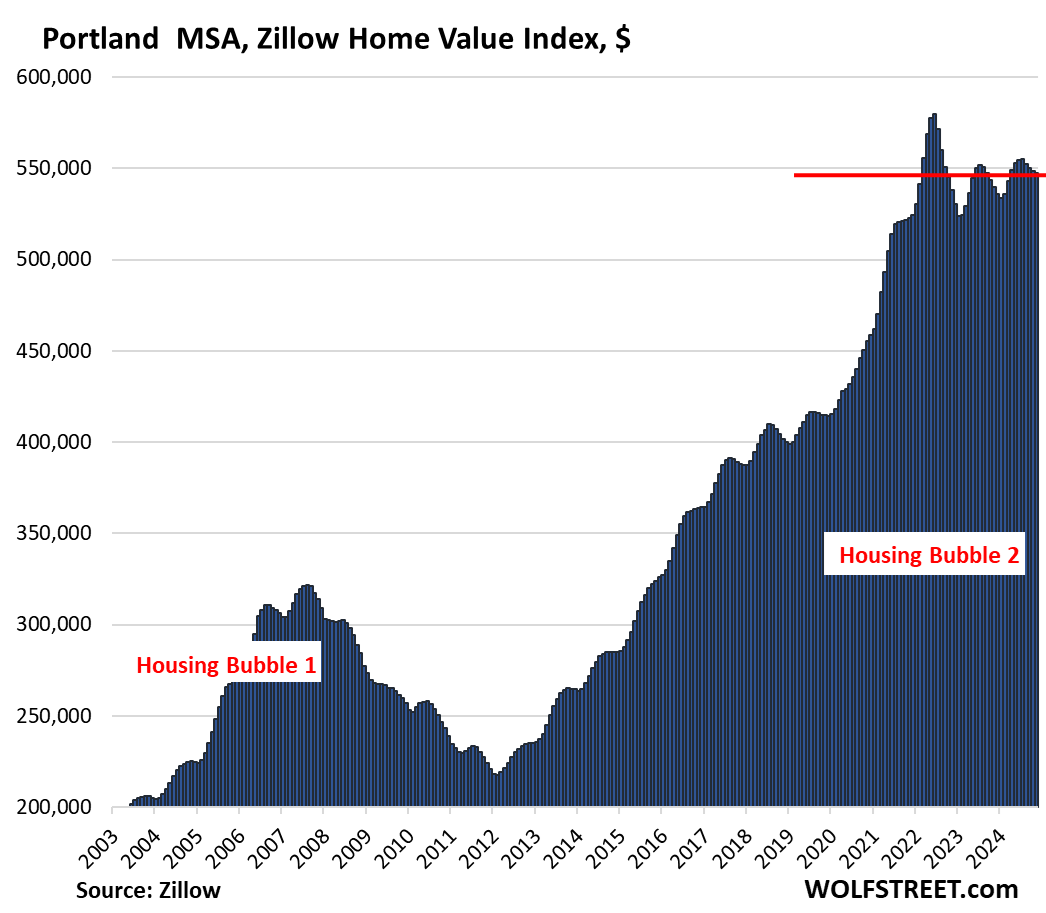
- Portland: -5.6%
- Dallas: -5.8%
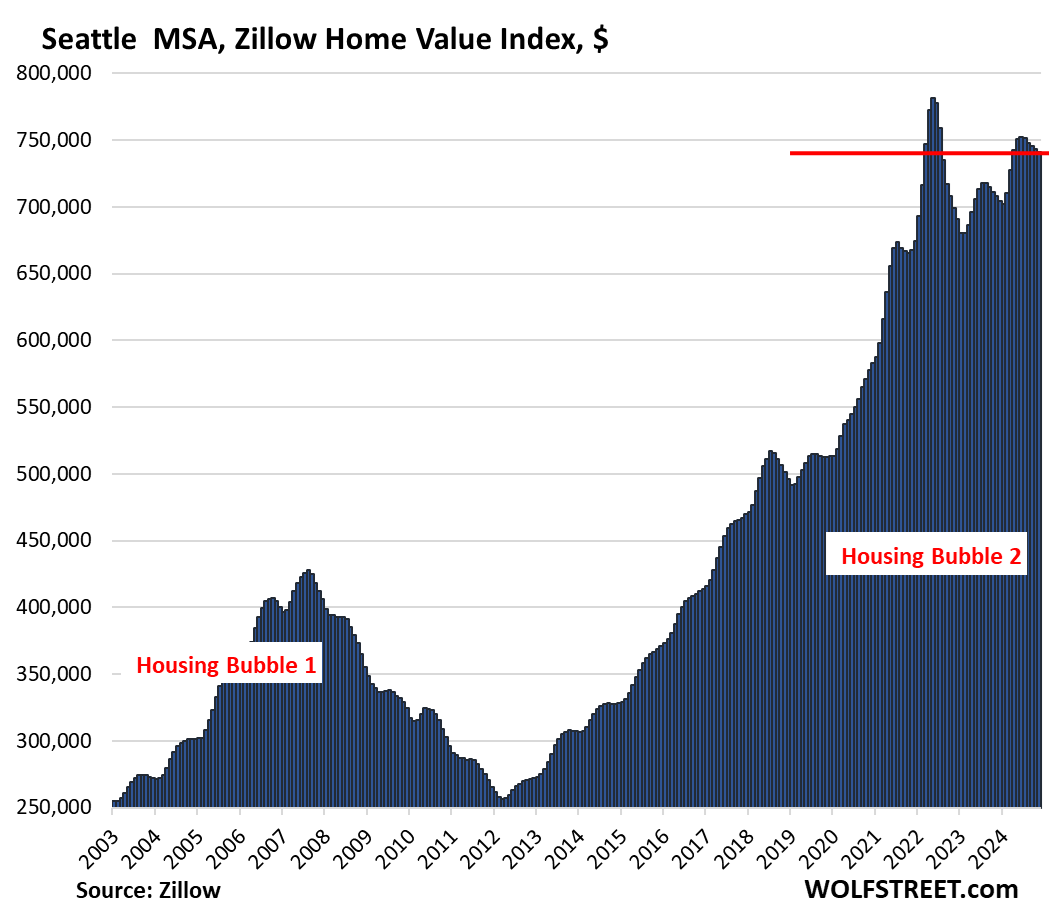
- Seattle: -5.2%
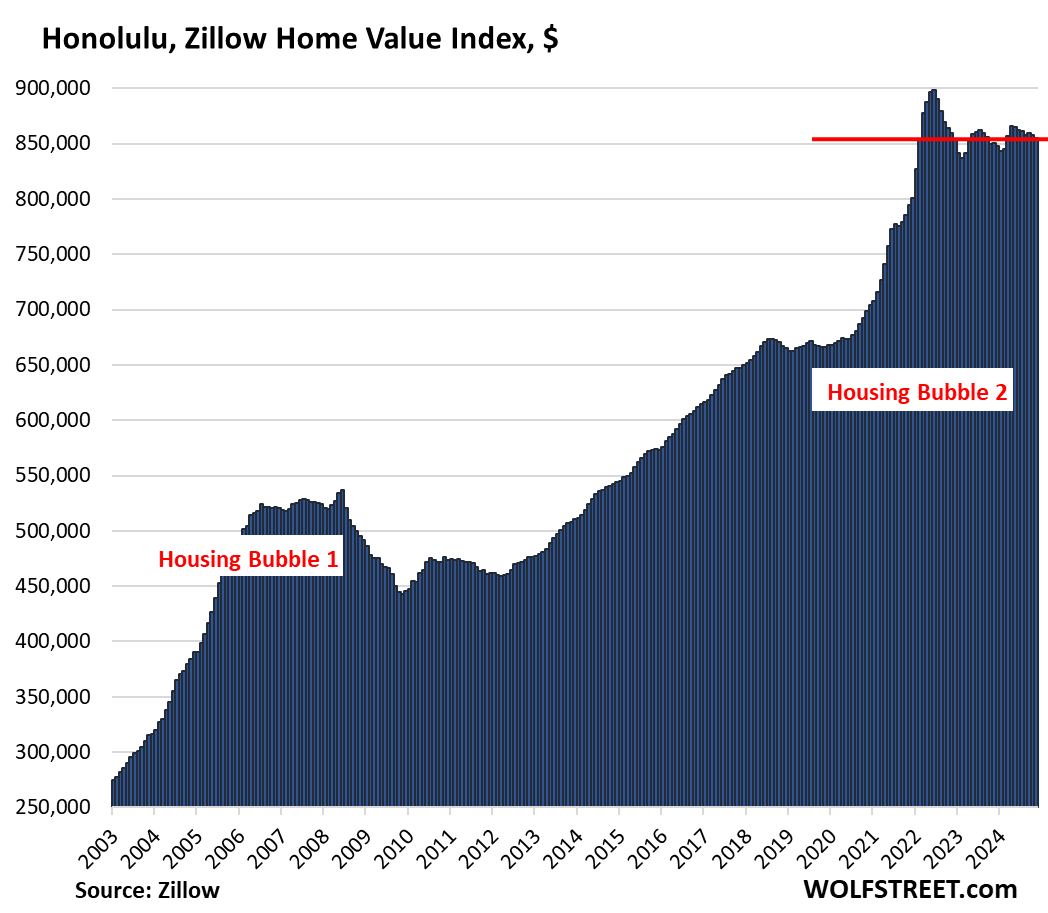
- Honolulu: -4.8%
- Tampa: -3.7%
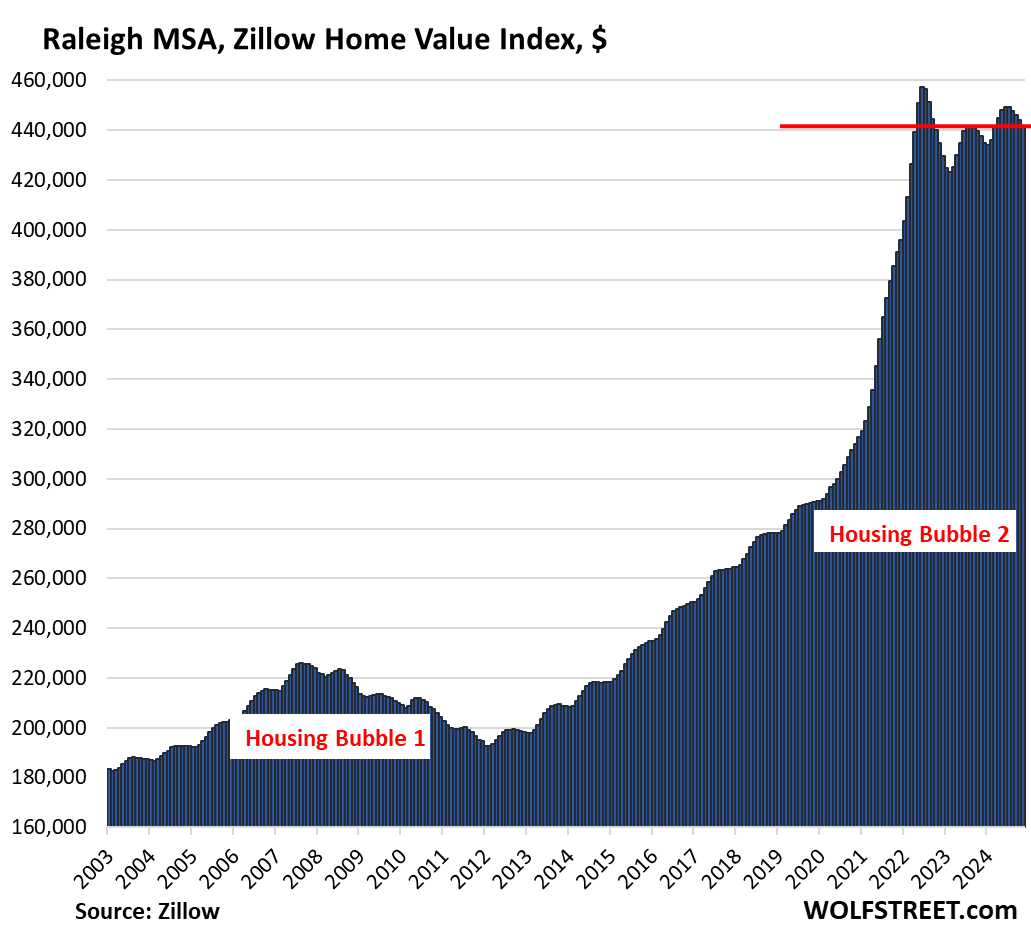
- Raleigh: -3.4%
- Jacksonville: -3.3
- Nashville: -3.2%
- Houston: -3.1%
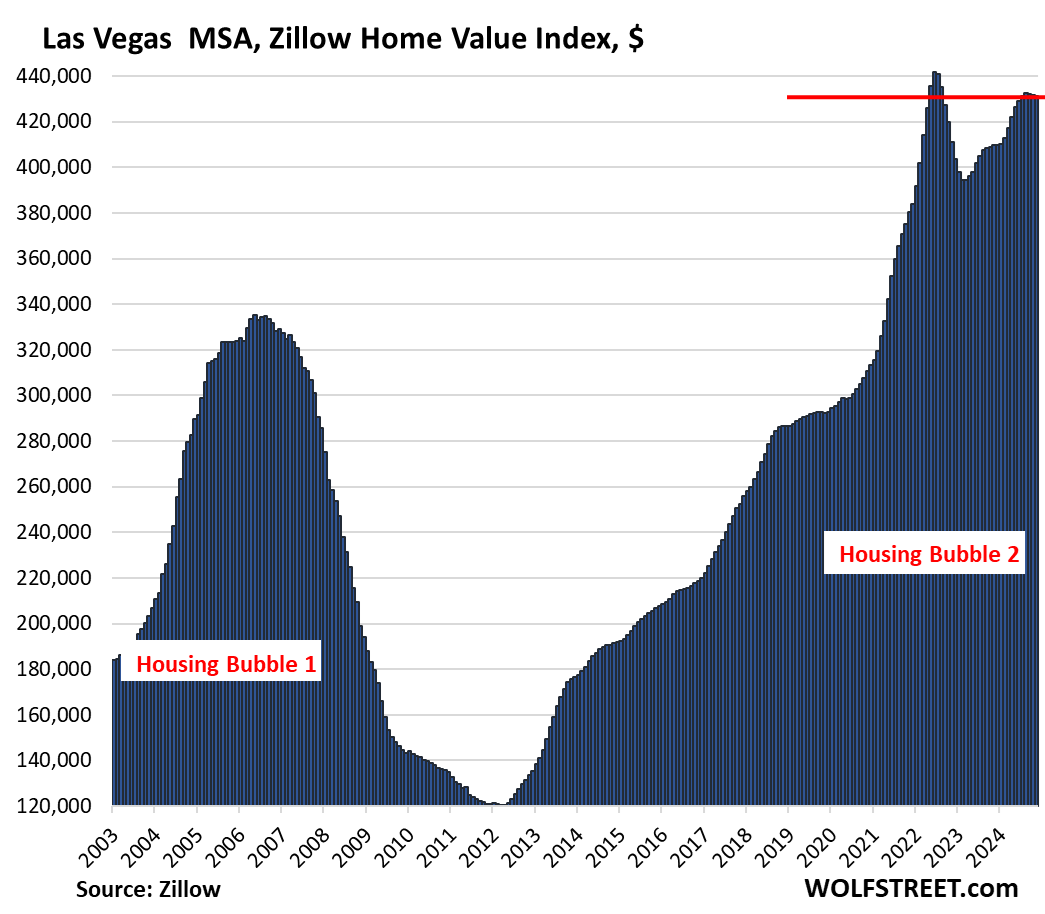
- Las Vegas: -2.4%
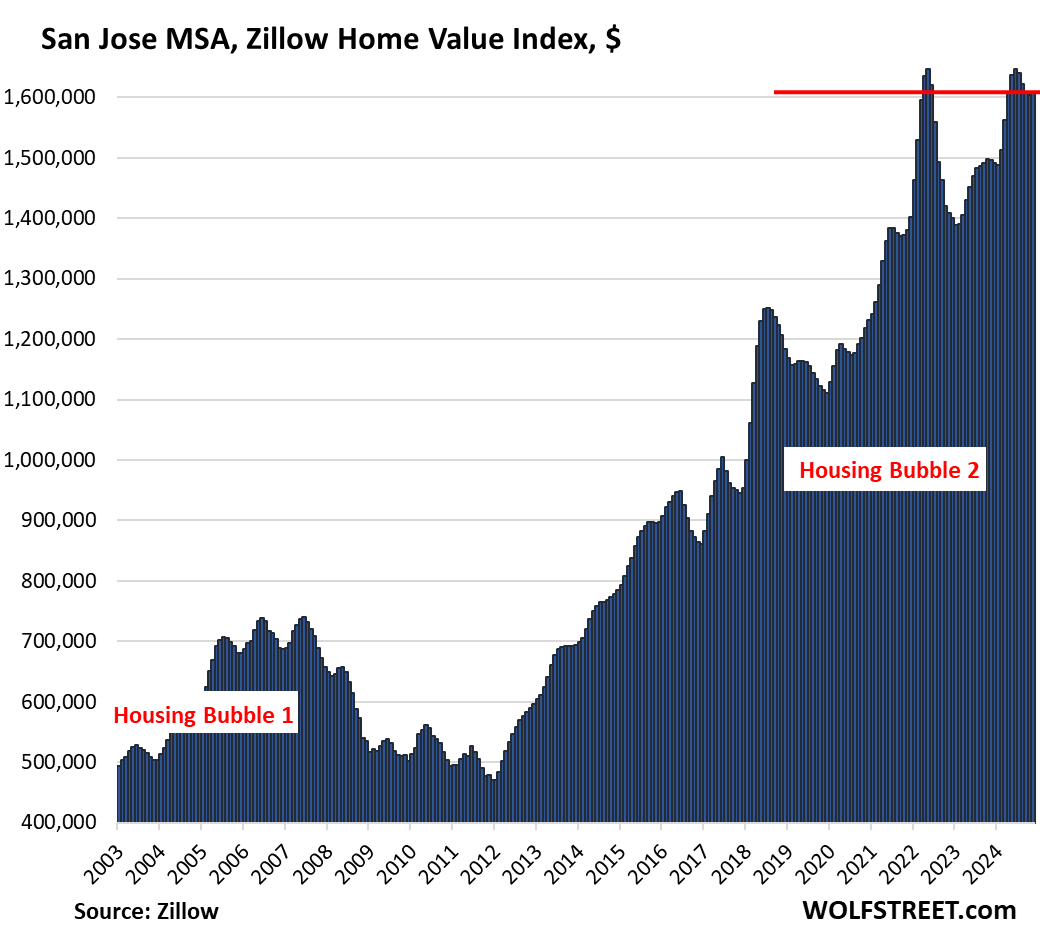
- San Jose: -2.3%
- Minneapolis: -2.1%
No New highs in November:
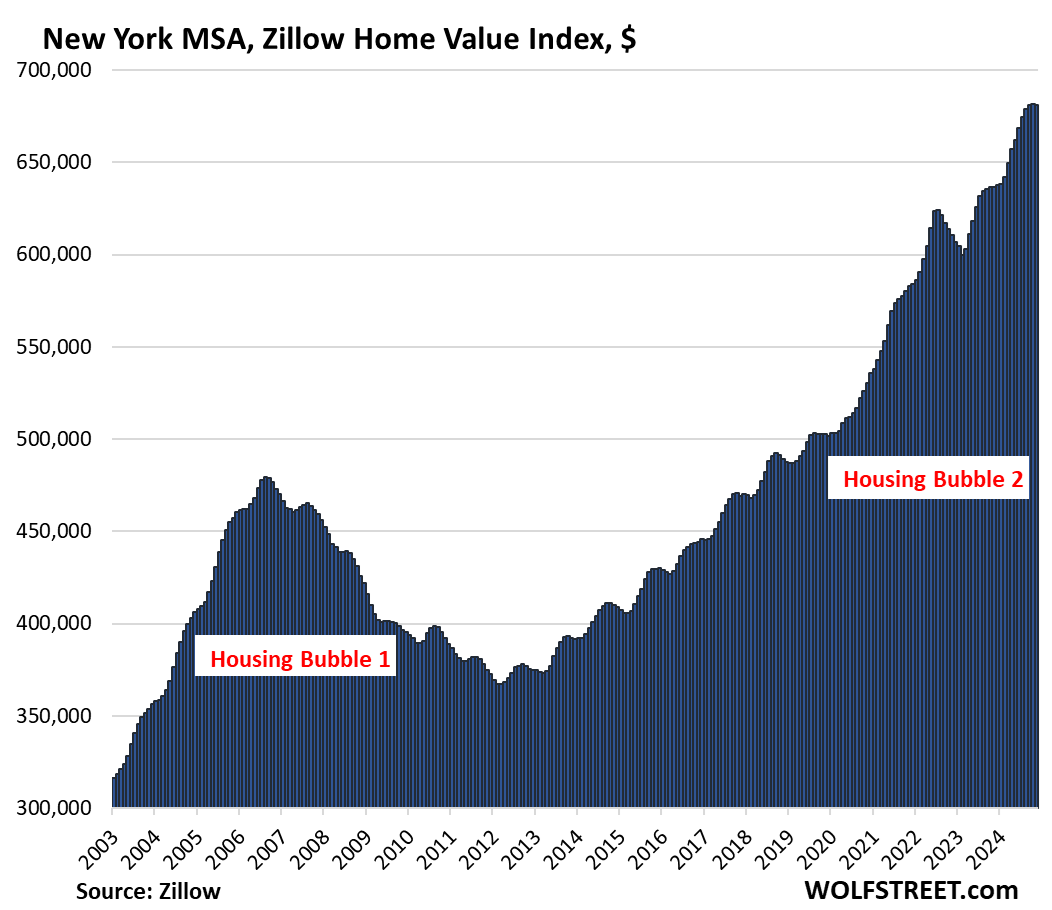
No MSA here of the 33 MSAs made a new high in November. Even prices in the New York City metro dipped for the first time, after the huge run-up. That was the last man standing.
The 30 Most Splendid Housing Bubbles in America.
All data here is from the “raw” mid-tier Zillow Home Value Index (ZHVI), released today. The ZHVI is based on millions of data points in Zillow’s “Database of All Homes,” including from public records (tax data), MLS, brokerages, local Realtor Associations, real-estate agents, and households across the US. It includes pricing data for off-market deals and for-sale-by-owner deals. Zillow’s Database of All Homes also has sales-pairs data.
We started The Most Splendid Housing Bubbles in America series in 2017 to document visually metro-by-metro the surge in home prices fueled by the Fed’s years of interest rate repression and QE. But since 2022, the Fed changed course, mortgage rates have risen, and the Fed has shed $2.1 trillion in assets under its QT program. And so metro-by-metro, and little by little, and sometimes by not so little, housing markets are changing direction.
To qualify for this list, it must be one of the largest MSAs by population, and must have had a ZHVI of over $300,000 at the peak. The metros of New Orleans, Oklahoma City, Tulsa, Cincinnati, Pittsburgh, etc. don’t qualify for this list because their ZHVI has never reached $300,000, despite massive runups of home prices in recent years.
The charts look absurd because the housing market has become absurd.
| Austin MSA, Home Prices | |||
| From Jun 2022 peak | MoM | YoY | Since 2000 |
| -22.0% | -1.1% | -3.4% | 158% |
Prices in Austin have dropped to the lowest level since April 2021.
| San Francisco MSA, Home Prices | |||
| From May 2022 peak | MoM | YoY | Since 2000 |
| -10.2% | -0.3% | 2.0% | 291% |
| Phoenix MSA, Home Prices | |||
| From Jun 2022 peak | MoM | YoY | Since 2000 |
| -8.8% | -0.5% | -0.4% | 221% |
| San Antonio MSA, Home Prices | |||
| From Jul 2022 peak | MoM | YoY | Since 2000 |
| -8.3% | -0.8% | -2.4% | 148.6% |
Prices in San Antonio have dropped to the lowest level since February 2022
| Denver MSA, Home Prices | |||
| From Jun 2022 peak | MoM | YoY | Since 2000 |
| -7.4% | -0.5% | 0.7% | 212% |
| Sacramento MSA, Home Prices | |||
| From July 2022 peak | MoM | YoY | Since 2000 |
| -6.3% | -0.3% | 1.9% | 246.3% |
| Salt Lake City MSA, Home Prices | |||
| From July 2022 peak | MoM | YoY | Since 2000 |
| -5.8% | 0.0% | 2.1% | 214% |
| Portland MSA, Home Prices | |||
| From May 2022 peak | MoM | YoY | Since 2000 |
| -5.6% | -0.2% | 1.4% | 218% |
| Dallas-Fort Worth MSA, Home Prices | |||
| From Jun 2022 peak | MoM | YoY | Since 2000 |
| -5.8% | -0.8% | -0.5% | 193% |
| Seattle MSA, Home Prices | |||
| From May 2022 peak | MoM | YoY | Since 2000 |
| -5.2% | -0.3% | 4.7% | 238% |
| Honolulu, Home Prices | |||
| From Jun 2022 peak | MoM | YoY | Since 2000 |
| -4.8% | -0.4% | 0.6% | 280% |
| Raleigh MSA, Home Prices | |||
| From July 2022 peak | MoM | YoY | Since 2000 |
| -3.4% | -0.5% | 0.9% | 158% |
| Tampa MSA, Home Prices | |||
| From Jul 2022 peak | MoM | YoY | Since 2000 |
| -3.3% | -0.6% | -0.7% | 212% |
| Nashville MSA, Home Prices | |||
| From July 2022 peak | MoM | YoY | Since 2000 |
| -3.2% | -0.3% | 1.3% | 217% |
| Houston MSA, Home Prices | |||
| From Jul 2022 peak | MoM | YoY | Since 2000 |
| -3.1% | -0.6% | 0.4% | 151% |

| San Jose MSA, Home Prices | |||
| From May 2022 peak | MoM | YoY | Since 2000 |
| -2.3% | 0.3% | 7.5% | 337% |
| Las Vegas MSA, Home Prices | |||
| From June 2022 peak | MoM | YoY | Since 2000 |
| -2.4% | -0.1% | 5.2% | 179% |
| Minneapolis MSA, Home Prices | |||
| From May 2022 peak | MoM | YoY | Since 2000 |
| -2.1% | -0.3% | 1.7% | 157% |
| Charlotte MSA, Home Prices | |||
| MoM | YoY | Since 2000 | |
| -0.4% | 1.5% | 170% | |
| San Diego MSA, Home Prices | ||
| MoM | YoY | Since 2000 |
| -0.3% | 3.9% | 334% |
| Los Angeles MSA, Home Prices | ||
| MoM | YoY | Since 2000 |
| -0.2% | 4.5% | 330% |
| Orlando MSA, Home Prices | ||
| MoM | YoY | Since 2000 |
| -0.6% | 0.0% | 236.5% |
| Milwaukee MSA, Home Prices | ||
| MoM | YoY | Since 2000 |
| -0.7% | 4.8% | 143.9% |
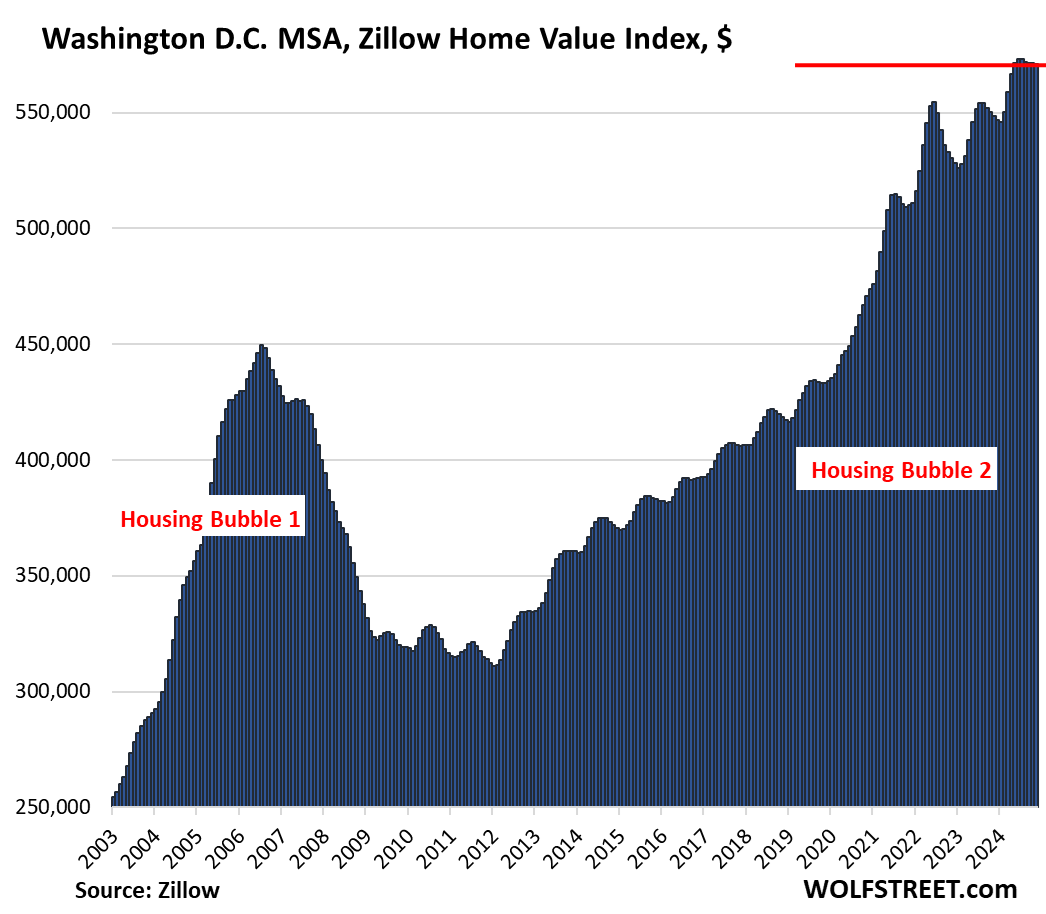
| Washington D.C. MSA, Home Prices | |||
| MoM | YoY | Since 2000 | |
| -0.1% | 4.1% | 215% | |
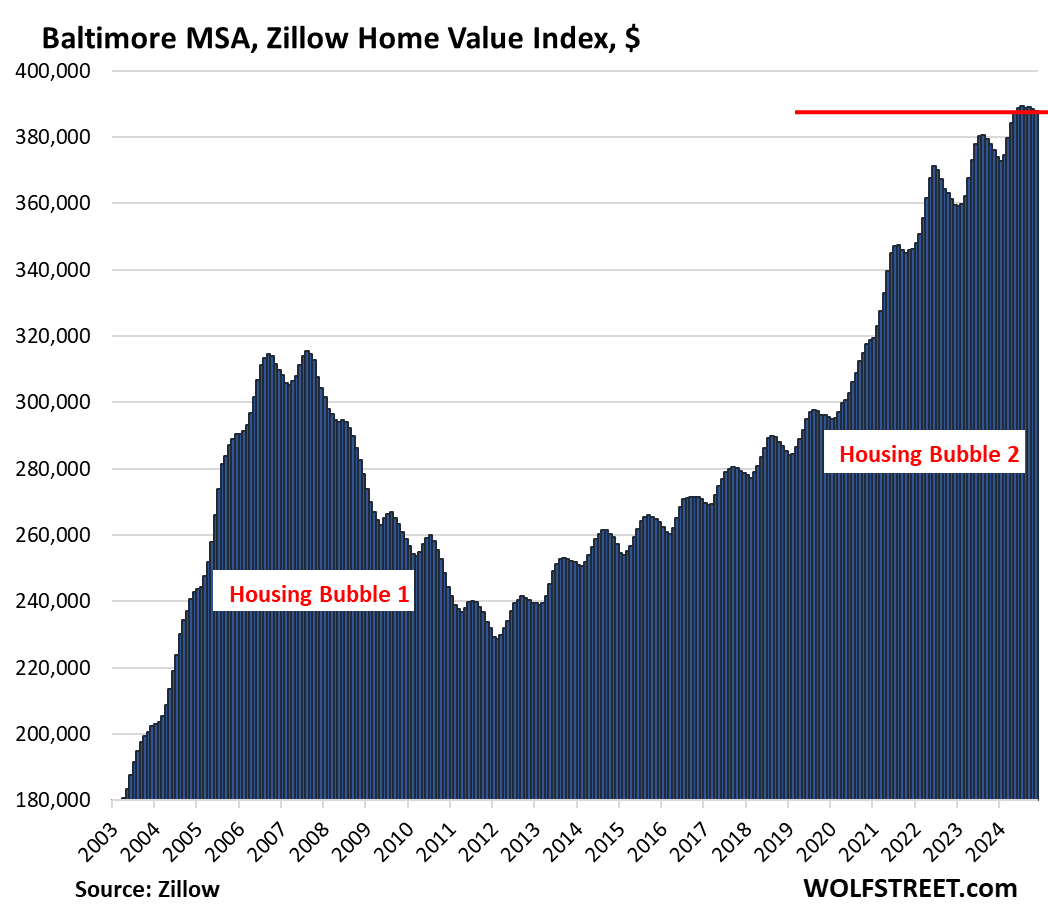
| Baltimore MSA, Home Prices | |||
| MoM | YoY | Since 2000 | |
| -0.2% | 3.1% | 174% | |
| Miami MSA, Home Prices | ||
| MoM | YoY | Since 2000 |
| -0.6% | 1.4% | 331.0% |
| Atlanta MSA, Home Prices | ||
| MoM | YoY | Since 2000 |
| -0.7% | 0.6% | 162% |
| Kansas City MSA, Home Prices | ||
| MoM | YoY | Since 2000 |
| -0.3% | 3.2% | 176% |
| Columbus MSA, Home Prices | ||
| MoM | YoY | Since 2000 |
| -0.5% | 3.3% | 153% |
| Boston MSA, Home Prices | ||
| MoM | YoY | Since 2000 |
| -0.4% | 4.6% | 225% |
| Chicago MSA, Home Prices | ||
| MoM | YoY | Since 2000 |
| -0.3% | 5.0% | 112% |
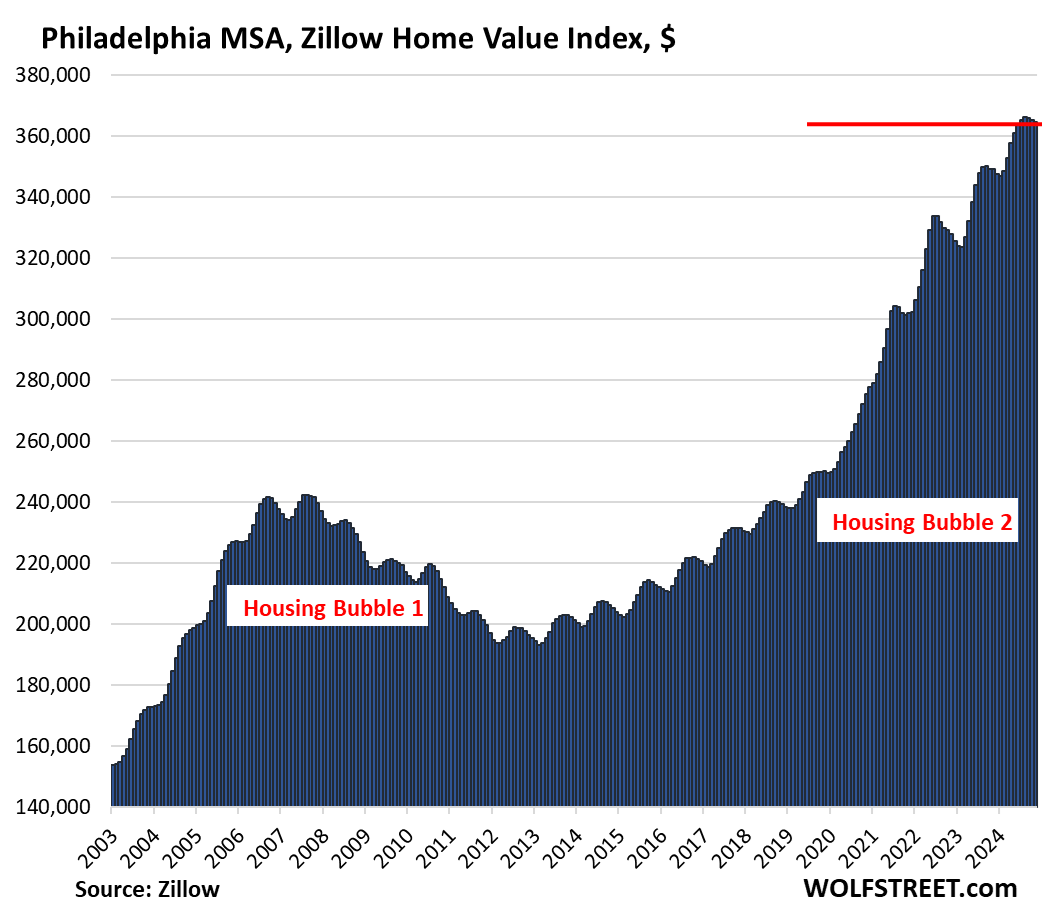
| Philadelphia MSA, Home Prices | ||
| MoM | YoY | Since 2000 |
| -0.2% | 4.5% | 201% |
| New York MSA, Home Prices | ||
| MoM | YoY | Since 2000 |
| -0.1% | 7.0% | 212% |
Enjoy reading WOLF STREET and want to support it? You can donate. I appreciate it immensely. Click on the mug to find out how:

![]()
How low can you go?
After such a huge run up, prices seem to be holding up pretty well in my opinion.
I will print green stuff like a mad fool if this thing crashes!!! Hahahahahahahahahahahhahahahahahaa!!!!!!!!!!
Exactly. This filthy scum and his henchmen have destroyed pricing.
Thanks, Jerome! Very cool ™
It is going down very slowly
Wonder what would happen if even a mild recession hits us economy
It seems we have reached a permanently high plateau.
Robbert,
Yep…post-2000 we’ve had a permanently high plateau of permanently high plateaus.
Primarily because too many market participants lack even a smidge of historical knowledge about macroeconomics, market dynamics, etc.
Although things are getting a bit better, maybe.
In general Doomed Housing Bubble 2 (2014-2024) was probably only maybe 60% the size of Doomed Housing Bubble 1 (2003-2008).
And/but that included the monumental stupidity of the 2021 Pandemic-Killed-1 million-But-Housing-Demand-Gonna-Soar Blow-Off-Bubble-Top
The real poison in the system is DC frequently treating any decline from the artificial, unsustainable asset bubbles it blows as Apocalypse Now – ZIRP edition.
So the asset valuation delusions compound.
Instead of taking the punchbowl away, the Fed spent 20 years handing out lampshades and poppers.
Depth, the iron hand of the market will eventually crush these cockroaches. Unfortunately, nobody can predict when it will happen. The USSR lasted 80 years, 80 years of hell for the Russian people, and 50 years of hell for the countries USSR conquered after WWII.
A lot of that is because wages have actually increased for enough people in this areas as well as population increases to keep things high. More money chasing less goods for more people = inflation. Most cities are not building enough for the influx of new people. Houston itself saw maybe 300k more people over 20 years but in the metro area it saw 3 million new people. There’s a lot of new money that see cheap houses while builders are trying to trickle in housing to ensure they keep profits high. To do so, they have to make sure demand stays high enough to squeeze maximum profits out of with luxury homes, while also not overbuilding to drop prices.
The best ratio seems to be 60%-70% ownership with the rest forced to rent. Those who get to be in the ownership class must meet the their minimum profit producing threshold to be able to buy.
Unfortunately a recession won’t fix this. Being underwater would suck, but many people with 2-3% would rather keep their underwater, low price mortgage then risk having pay 6%. In 2008, mortgages were cheap and values were high, then the mortgages were cheaper because values dropped. A recession now might drop values from very very high to very high, while making the overall payments about the same for those who already own.
My 3% mortgage is 50% cheaper than it’s rental value. For a 6% rate, my house value would have to drop 40% to be equal to my current 3% rate. However, my salary and my wife’s salary are high enough, that it would be easy to buy up rental properties for an affordable price. Those who can’t afford now, won’t afford at a 40% drop unless rates also drop. But then I could easily afford a bigger house and more rentals because my salary is not going drop. Either way my wealth allows me to benefit and there’s simply not enough houses in my market for me not to come out ahead.
And your job is secure? Sure hope so . I don’t want recession , drop in home prices , or financial crises rather I want productive growth and prosperity for all without any handouts like we had during pandemic and ZIRP.
I see a conflict between the asset price and the interest rate. The zirp mentality of QE ignored the remarkable increase in asset prices that free money engenders. A bubble in asset prices is the cause, the kernel of an inflationary episode because the collapse in the price of overpriced assets is repugnant too the moneyed class that owns them.
The general cost of living increases too support the increase of asset prices.
The graphs indicate that the housing bubble is still semi inflated.
These prices are in fixed dollar amounts. From June 2022-November 2024 the US dollar has lost 6.5% of its value due to inflation. So you would have had to have seen a price appreciation of that much just to stay even… and you can subtract 6.5ppts from all of these numbers (Austin is actually down 28%+ in real dollars… not 22% in fixed dollars).
So many of these metros are up from their lowest point from the peak, such as San Fran, Phoenix, Sac, SLC, to name only a few. I think the rate cut mania pushed them all up from those previous lows.
LOL, that lowest point in any of the cities you name happened long before you were born, and before your parents were born.
If you want to know from the low point during the housing bust to now you can figure it roughly by looking at the chart.
If you want to know from 2000 to today, you can look at the number I gave you for each metro.
He’s not wrong.
1stTDinvestor said “up from their lowest point from the peak”
i.e. Prices peaked, dropped, and now are higher. Still below peak, but don’t seem to be continuing to drop further.
Yes-ish, it is kind of hard to determine as there is such a strong seasonality component for some areas.
He said the “lowest point from the peak.” Meaning the lowest point *after* the Fed’s belated pivot in 2022. These lowest points tend to coincide with the Fed’s chicken-out in March 2023, after which house prices spiked back up in concert with stocks and crypto, as part of the reloosigoosification of the broad US economy.
LOL, I would pay good money to hear a reporter ask JPow directly about the “reloosigoosification” of markets via rate cuts! 😆
I understand renegotiating the past. What is more important is where we go from here. I mean is crypto an offspring of QE, an anonymous currency, or a scam.
The Fed will lower T bill interest rates by 25 bpts because they promised everyone they would. To do otherwise would be revolutionary which is unlikely.
Housing still way overpriced here in FL. Recently drove by a house (now vacant lot) that was sold in April 2023 and immediately put up for rent and never rented out after multiple price cuts. Now it was demolished entirely as a vacant lot and put up for sale yesterday for $500k more than they paid (asking $1.55m right now lol). Immediate nextdoor neighboring house is pending at $1.3m and completely updated and looks very nice. This is on Main St in Windermere, FL for anyone curious. Rather than taking the L on the property they doubled down and demo’d it and ask for 50% price hike hahahah.
Good place to let the dog empty its bowels.
Wow. So when people leave dog shit in someone else’s yard, it’s not just that they’re lazy savages, but actually because they are petty and jealous (and cowardly)? Here I’ve always tried to talk myself down from that assumption.
Pathetic if true.
We have a ton of luxury new construction spec homes in Park City, Utah, lots of new construction inventory over $2 million. A lot of it is sitting. Some of these high end builders may have missed the pandemic migration boom into resort towns like this in the West? But who knows? I have stopped trying to predict anything.
People who make things will get the squeeze. The financial engineers who make nothing will profit. Until unemployment rises, or long bonds dislocate higher.
@1stTDinvestor,
I too have stopped making predictions. This counterintuitive economy has made fools of so many MSM “experts” and their predictions. Particularly those who loudly predicted a recession when Powell began raising rates.
My best guess (not prediction) for residential RE is an ongoing slo-mo slide. As Wolf stated, little by little. Here in Cincinnati, many sellers are still engaging in what I call “sucker fishing.” That is, their initial listing price is sky high. They’re testing the market to see if they can find a sucker who is willing to substantially overpay.
But I’ll take back what I said. I will make two predictions. Those are: I predict the mainstream financial media will continue making daily economic predictions. I’ll further predict that most of those predictions will be wrong.
NOW we’re getting somewhere realistic regarding ”predictions” Cold one!!!
Many decades ago, the word from the old locals in the flower state was, “Only FOOLs and tourists predict the weather in Florida,,, but ya qualify as a tourist for 7 years until ya learn better.”
Kinda sorta the way it IS and ALWAYS has been with markets, despite the appearance otherwise from those with better and very much better information: Insiders always far damn shore, including NOW when it continues to be ”legal” if not moral for our elected folx; others for eva, including such as the ”robber barons” of the 19th and 20th centuries who had their own communication networks; etc., etc.,
Your two predictions, regardless of their veracity, contradicts your previous declaration two paragraphs above that you had sworn off making predictions.
I should know. The heartbreak of a cherished belief, demolished by experience. My predictions are not what they once were.
For instance, how will the housing bubble be resolved.
I agree with your comment
I have stopped trying to predict anything.
Irrational behavior is unpredictable by mere mortals.
Hence the need for AI and BILLION dollar data centers possibly useful in forecasting with some degree of accuracy the actions of the FOMO crowds.
You really are clueless about the social version of AI. A program sold as accurate, regularly making two standard deviation mistakes.
Worse than the population used too train them, unless it is a synthetically produced documentary glorifying the authoritarian agenda.
From a Colorado resort town perspective, the second home market in resort areas are usually the first to drop AND the last to recover.
When times get tighter, the second home buyers disappear first. If times get very tight, the second home resort area home prices plummet from people trying to unload their second homes and speculative rental investments.
This has been a cycle since the 1980’s in Colorado. I’ve seen it all before.
There are some new factors to consider. Crime (or perceived crime) in many of the major cities is a huge concern for the wealthy. Added to this is the anger against the wealthy, They don’t feel as safe in L.A., Chicago, Seattle, etc. In the next downturn I’m not so sure they will dump their second homes. They provide safety and an escape, proximity to those of the their own kind. They might actually dump their primary home instead and move permanently to their vacation homes.
That’s an interesting outlook. Do you happen to have any statistical or historical data as to when the rich folks had done away with moving to ‘secondary’ houses during the recessions?
I moved to Denver Co area in 2008 and saw 3 million specs sit for 5 years or more no one could afford them
Nothing Lasts. Back in 1995 Park City, Alta, Solitude Utah was an inexpensive Poor Man Ski Wonder Land.Even Robert Redford could be found on the Street outside the Egyptian Theater encouraging the non elites to see the show. Lodging, Lift Tickets and Beer could be had. Now Paper Wealth has taken over many aspects of the once real-world.
Utah and the American West are still Scenic and hope to go back.
If you’re going to move, rent your current house and move to a rental house.
That’s good advice
Correct!
Or sell your house for the best price you can now, then rent for the next couple of years as prices slowly come down.
That’s what we’re doing.
Much better advice
In my hood a home would rent for 6k per month but to buy it takes 13k per month that too a slow depreciating asset
Whenever I decide to convert the equity in my home it will be worth the same as now as long as I’m buying another property and not selling it to pay for the assisted living facilities.
I wonder which is severely overpriced new cars or new homes? Much to do about nothing as it seems charts are not moving downward in values by leaps and bounds. I guess owners of the American Dream are still immersed in all that equity, waiting for the next crisis or the other shoe to drop. Meanwhile it’s seems basic services and dining out at the favorite spots is getting more substandard/disappointing.
New vehicles are severely overpriced. We just got $10k off a $52k MRSP 2024 vehicle. A 19% discount is nothing to sneeze at.
AGREE DD!!
Wanting another new vehicle to drive across USA to see the grandchildren after 5 years,,,
But absolutely NOT buying anything until prices get back to last time, not the first time, when we bought new trucks for 50% of MSRP,,,
And, to be sure, we financed both to help the sales folx get their pay, then paid them off ASAP according to the soonest that the dealer folx said was OK, usually 90 days.
For one visitation trip, rent one or fly.
True, sorta – but not so much if the preceding MSRP run up was 50%.
Say $35k in 2019, $52k in 2022, then $42k following 20% discount today…
Of course, everybody has to deal with the manipulative sales process at any given moment, no matter how abusive/slanted, and aggressive haggling can only go so far.
But the whole MSRP discounting concept is designed to make buyers feel that they “won” when in fact they simply got ripped off less than the initial attempt.
Most sales processes are designed to fixate buyers’ attention solely on anything other than actual, total, final, price.
Yes, aware of the games they play. This model had an $48k MSRP in 2019, plus the 2024 version has some hedonic upgrades that didn’t exist in 2019. Some manufacturers
& models have not seen ridiculous inflation. Been on the fence for several years, since before inflation, and watched the price of this model every year.
dining out at the favorite spots is getting more substandard/disappointing…. How true! Tend ahs been developing for 25+ years. Very few restaurants understand that patrons want unique experiences – signature, creative dishes, professional service, memorable ambiance.
Unfortunately, many restaurateurs today prefer to serve premade foods – “thaw, scoop and plate” – airline style; served by untrained, unprofessional waiters, all enclosed within blahh buildouts.
Nothing sounds “warning bells” like cold mashed potatoes at a “higher end” restaurant!
Where I live, many restaurants shop Costco the last hour before closing.
Is it possible to calculate what the average price of a house in the US should be?
Like the old saying – it’s all about location, location, location. The real estate markets weren’t just turbo-charged due to QE policies at the Fed and free money from the Federal government, there were massive regional flows of people – much of which hasn’t unwound. Additionally there was a huge increase in the number of people buying second homes. It will only unwind when some combination of the following occurs: (1) people die (2) remote work policies are reversed – forcing people back to metro areas (3) there is a major recession and people lose their jobs – and have to unload real estate that they can’t afford to own. There are already cracks in the market for new housing – with major incentives being offered just to get people into homes. Homes which they might not otherwise be able to afford – and certainly can’t afford if they lose their jobs.
To add to that, the longer term trend of urbanization. I realize the Zillow data doesn’t show rural areas, but my guess is they are continuing their long-term decline as seen in most of the world. Less here as we have better demographics and had more friendly immigration policies.
RE is one of the most disparate, volatile asset markets there is.
Just look at the huge range of post-2000 run-ups (from 112% to 340% – all in the same country, speaking the same language).
And…those 300%+ rise markets were *already* some of the most expensive in 2000.
20 years of interest rate madness cultivated a more profound madness.
Watch the TNX. 5% is yellow lights blinking.
5.5% is red lights with klaxon horns.
You may miss the second warning unless you still have cell phone service while living in your car… Unless you’ve sold off all assets except your free and clear home and have all your former assets in 6% T Bills. I don’t see the housing market withstanding 8%+ 30 year rates at these lofty prices.
I’m too old care, so I’m settling for leaving each kid 5 acres and a mule. I hope they can learn the basics.
-g-
Nonsense. There will be HUGE demand for the 10-year @ 5.5% which will put a ceiling on rates.
Give me a 10 year at 5.5% and my entire IRA and Roth accounts are going there!
In the dim past the rule of thumb was 2.5x annual income. That’s laughable now.
Northern,
That’s because “back then” people just didn’t value housing so high, and houses were smaller, and families were mostly single income, etc., etc. All those things have changed.
When’s the correction,
“Is it possible to calculate what the average price of a house in the US should be?”
The problem is there’s no such thing as “should”.
On the positive side seems like a lot of room to negotiate commissions.
Glen – always an interesting question. Out of curiosity, have you ever negotiated a transfer of 400k plus dollars without any professionals on your side of the deal? Not likely…
It’s easy to say, I got this, until the keys to the front door and the cash don’t change hands as expected.
Professional percentage takers more like
Finally … the country realizes how little value “real estate brokers sales people” add to the transaction.
Today, buyers are often more knowledgeable about the products being offered for sale than the people involved in their sale. The internet provides practically all the information one needs to become super well informed.
Do I really need some one in popsicle colored suit and or jacket to point out to me … “this iy your front door … this is your hallway … this is your living room … this is your, etc…
Over the years I bought and sold handful of houses. The best overall transactions were those without parasites involved – yes the 6% or 5% crowd only subtracted value.
I preferred transaction were those that were handled by real estate lawyers. They submitted my offers, drafted the contracts, total cost – less than 1% of the value of the property. The transactions were quick, effective, economical. Drama free and totally free of Real estate trend BS – like staging, and other fads.
I had a closing lawyer but sold 2 properties over a million each with no realtors and a friends condo realtors could not move @ 2 a.m.(buyer worked 2nd shift),I do not need realtors.
I am still looking for home and a fair amount of acreage(20 minimum)but will not pay flu pricing.
I’ve done over a dozen purchases and sales of rental properties. Stopped using agents a while ago. For some of us, once you’ve done it a few times you realize what little value agents bring to the process. For first-time purchasers, sure, bring an agent. FYI I’m a contractor and don’t need any assistance evaluating structures and their conditions. What works for me is not necessarily best for everyone.
Great advise.
This old digger has had to deliver
Bad news way to often to the diy
Couple who were not knowledgeable in zoning regulations.
Worse are the ones who did zero homework on the cost of that 4000ft2
Home in the hill country.
yeah, how’d that NAR lawsuit work out for Byers? lmao!
The striking point the price charts make is that given the poor demand/supply issues (and concomitant high mortgage rates) is there is a LONG way down in prices forthcoming.
Not sure what would prevent that
Wolf, what determines the order of the metros in this series?
A mix of secret sauce and randomness.
I’m in Phoenix now – it’s not hard to believe that prices have dropped about ten percent from the peak. But that just means houses that were $300k in 2019 and went to $600k in 2022 are now back to $540. I think it will take time and maybe a few more percent off to clear this market. Some owners might be saying “you don’t want to buy at this price? Fine, rent it from me and let’s talk in a few years”. If a house is professionally managed and still cash flows a dollar a month a lot of owners will sit and wait.
The $300k in 2019 was a massive bubble. 2014 prices, inflation adjusted, would be fair market value.
“The $300k in 2019 was a massive bubble. 2014 prices, inflation adjusted, would be fair market value.”
I told my son that back in 2019 when he was looking for a house at a 3% mortgage rate. My family told me that in 1987 when my wife and I bought a house with an 11% mortgage rate.
Both were bad advice for different reasons if you wanted to own a house 10-20 years.
I wouldn’t bet on a housing crash of more than 20-30% because the US government is now on the hook for any foreclosures. Politicians will do anything they can to avoid another 2008 when the banks were on the hook. However, the ineptitude of many politicians may cause a recession leading to exactly this.
I think house prices will drift down until nobody remembers speculative investing in a house was once a lucrative idea (5 years). A 10 year drop of 30% should do it with 2-3% inflation. Unless inflation rages out of control again causing assets and wages to rise.
We sold our first house after 8 years and with sales costs and upgrades, broke even for tax purposes.
The family was outraged that we didn’t make a killing on the sale after 8 years, since if they sold, they would have after the massive inflation of the late 70’s an early 80’s. It still comes up at family gatherings 30 years later. “You shouldn’t have sold”! However, we bought another larger house and have enjoyed this speculation phase of the 2000’s. At least for now.
I was happy with a place to live that was cheaper than rent that sold for a small amount more than our neighbor’s house with the same floorplan and condition.
Perceptions take a LONG time to die out. We are entering that phase again that I experienced in the late 80’s and early 90’s where everyone still expects to make a killing. That may take a decade or more to die out.
I thought I was buying at the peak in 2020, but if I had chose not to buy then because of that……
Home prices drifting down over the years sounds about right.
ShortTLT,
Even with a 4 year retrospect, you made a good decision based on today. Hold on to your low interest mortgage and you will do well in the next 10-20 years.
In many ways, I think the Fed avoided a catastrophe by allowing mortgage holders to refi/buy at such low rates before turning the screws on inflation and the economy. People are much less likely to foreclose and dump the catastrophe on the taxpayers when they have a mortgage payment lower than rent.
To the people who buy now, Don’t Panic!, and hold on for 20 years and you will do well, also. That has been true for recorded time.
The bubbles and bursts have been more frequent since 2000, but the long term trend is up.
IMHO,
Houses should be a place that people have committed to live for the longer term at a fixed cost. Home prices should track inflation just like they did from 1940-1970 (When America was great?). The payoff of home ownership is the insurance of a longer term fixed cost with a fixed rate mortgage.
If you want mobility, renting is a good option but I wouldn’t expect inflation protection in the long term. That’s the price you pay for mobility. Things are out of whack today with rents lower than mortgages. I believe that will flip again in the next 5-10 years.
Houses should NEVER have an ROI of 30+%/year at the peril of becoming a speculative investment and growing a bubble. Houses are a place to live.
Certainly correct where we are now in the saintly part of the TPA bay area depth!
Houses on this block were selling about $100/SF in 2015, $70K if not added to since built in 1950.
Went, ’18-’19, to $200/SF and now $400.
Many but not all are then demolished to build twice or three times the footage plus additional amenities to sell for $500-600/SF.
A house is a depreciating asset on appreciating land. It will be interesting to see how people react when the land ceases to appreciate.
What you are describing is the scourge of QE. The ultimate kicking the can down the road.
The bailout of the wealthy that were bankrupt.
Meanwhile, the best of us, raise families teaching the children that love is the best choice.
Struggling because their income is insufficient to afford the sacred responsibilities that they feel compelled to provide.
They certainly can’t afford a mortgage payment unless they make a lot of money.
always great when the prices go from unreal to ridicules. But i only saw a really bad time 1988 when i graduated but one day they will be right i suppose but you might have to wait out 3 cycles. Man plans god laughs and actually even if you don’t believe in god it is actually accurate.
You reference 33 markets, but yet, only talk about the top 15 or so. Cincinnati is a hot market now. Why not show it?
RTGDFA.
From article: “To qualify for this list, it must be one of the largest MSAs by population, and must have had a ZHVI of over $300,000 at the peak. The metros of New Orleans, Oklahoma City, Tulsa, Cincinnati, Pittsburgh, etc. don’t qualify for this list because their ZHVI has never reached $300,000, despite massive runups of home prices in recent years.”
Jim,
After you RTGDFA, Plot the Zillow data out. Inventory is low. If priced ok, it moves fast. But, take a look at the median asking price. It’s moving downward in a hurry.
I’m pretty sure Ohio is a fictional place.
I’m pretty sure you are wrong. Not only does Ohio exist but it is actually a bell weather state.
Ahhhhh, stocks, cars, and used homes (the few scarce resources) are not going to the moon, your populist/progressive paper notes are becoming worthless. I can’t believe people are still recklessness enough to invest in bonds and savings accounts. The only reason dollars are going down is because they are benchmarked against other worthless paper from other reckless governments.
Inflation degrades the dollar, yes, but houses and the big stock indexes are in a bubble. Good to have some dry powder saved for when the bubbles pop. In the meantime, interest from cash savings can pay a lot of expenses.
Ah, the Buffet gambit. Dry powder to spend when asset prices fall over the next decade.
Prices are coming down little by little for now, but I wonder, as inventory continues to build, if prices will start falling faster once the market becomes flooded with homes?
YES Lucca,
As Wolf has made clear, and confirming that with our own experience over many decades of RE investment/owners.
Many crashes down the line, it’s kinda like the way Hemingway expressed something:
”Gradually, then suddenly.”
BEE ready is the only really relevant advice.
AKA,,, ”Keep your powder dry and ready.”
I will only add, keep reading everything on what I now call ”Wolf’s Wonder” because of the help I have had by reading his work…
Tell that to the real estate speculators who went ‘all in’ during the roaring 20’s. Pick just about any decent sized town in the US and you can find those beautiful hand crafted Victorians fully remodeled for way below current replacement cost. mainly because that type of excellence in wood working and the availability of great wood and the cost of labor is not replaceable today.
The decorative parts, other parts, and entire sections of Victorian homes (and other styles) were mass-produced in factories and sold in kits by mail-order from Sears, to be assembled on site. Entire houses. That was part of what Sears did. It was factory production at the time, and now there are no longer any factories that produce these components, and repairing or replacing them is hard and very expensive.
Same as with a factory-built 1938 vehicle. They’re expensive and hard to repair, which is one of the reasons not many people use a 1938 vehicle as a daily driver; they keep it in climate-controlled storage. But you can’t do that with a Victorian.
Lucca,
Where are current homeowners going to go if their current 3% mortgage is less than comparable rent? They certainly cant buy a similar house at the current mortgage rates which would mean a payment almost 2X current rents. It doesn’t pay to panic and walk away.
The inventory will slowly build from people Dying, Divorcing, or some other Disaster. It will be much slower than the mass panic of 2008. Prices will drift down at this rate.
The Fed are geniuses for avoiding a crash like 2008. Most non-dead, non-divorced people are so grateful for their 3% mortgages that dumping or foreclosing on their houses is the last thing on their mind.
Bring out the dead and divorced! This rate will determine how fast prices fall.
I was wondering the same thing.
I’m also curious which of the metros would get the gold, silver and bronze medals. Assuming “most splendid” goes back to 2000 it would appear to be San Jose, San Diego, and Miami, with Los Angeles getting an honorable mention.
Year over year and month to month numbers would present totally different winners.
Fascinating. All the most pleasant places to live.
St. Louis Fed
National inventory for sale year over year, the most important chart
Jan 2022 inventory- 376K
Jan 2023 inventory- 617K
Jan 2024 inventory 666K
Dec 2024 inventory- 954K
I expect this number to explode higher in 2025. I said on this forum a year ago that it would get way higher this year. All these homes that got pulled off the market this year because they didnt sell will get listed again at the start of next year. Some panic has already started in certain states and cities.
Now, if inflation gets unanchored and the bond market calls the Feds bluff that 2 percent is never happening again unless of a severe recession which it will at some point, the 10yr US treasury will shoot higher and should crush housing. Its already going higher after the FED has been cutting.
Cleveland Fed is forecasting .4 on the CPI next month. That will push the CPI towards 3 and Core over 3. And thats with oil prices still in the gutter.
For those wanting much cheaper housing in the years to come, all you have to look for is rising inventory and a rising 10 yr US treasury.
I also cant wait to see how all these massive tariffs that Trump wants and how it impacts things. Im looking forward to it because that will throw gas right on the inflation fire which will rocket the 10 yr higher.
I still say it will crash worse than 2008. In the field we are seeing it . Commercial is first up
Yep, it’s inevitable. Factor in inflation and a big increase in carry costs due to insurance and taxes and people are getting squeezed. Very few sales occurring for existing homes.
The last 2 years we were in the eye of the hurricane thinking the worst is over but it’s going to get brutal very soon IMO.
I feel like we’ve been saying that for 2 years now – and when prices start rising again March, then what happens? These small .5-.7% drops by Metro are just offset in the spring. Unless we sizeable iot continued declines over a 12 month period it just looks like the return of seasonality.
There’s a middle ground here. Prices stagnate or drift lower over the years. Eventually, wage inflation brings price/income ratios back into balance.
No epic crash, but no more price appreciation either.
Riley,
We are in this situation with an ADU. The mortgage is constant but insurance and property taxes went up 20%. Local rents have not increased enough yet to cover this. Not enough increase to sell our primary home but it is more painful. Thankfully wages have gone up 10% and the stock market this year has gone up 25% so the REAL effect has been minimal.
If the cost of eggs goes up 100% from $100/year to $200/year but my salary goes up $1000/year, am I really in pain?? I think I am every time I go to the grocery store. Elections are won and lost on this.
We are all walking on a tightrope during inflation. We don’t like it.
The Federal government has assumed the risk of a housing crash in which jingle mail is the best alternative. Makes one wonder if this is another planned gutting of the meager wealth that most people have.
Wolf,
As always, I enjoy reading your articles.
At what point do you expect the “real estate” bubbles to pop?
What event/s will most likely trigger the price moderation, crash, etc?
Given that the economy is behaving quite well, interest rates are declining, real income is growing, mortgage levels are not unreasonably high, unemployment rate is hovering at 4% – historical lows, lots of cash on personal balance sheets, lots’ of equity in current homes … – why would real estate bubbles burst any time soon?
It has already “popped” in some metros. It goes metro by metro.
You are pretty savvy but when real estate prices go from silly to ridicules and even by your charts they don’t go down. So call inflation. or whatever but the charts don’t lie.
“by your charts they don’t go down”
That was your reply to my “It has already “popped” in some metros. It goes metro by metro.”
Look at chart #1, for example. Down 22% from peak in 2022, or chart #2, down 10% from peak in 2022. Both are back to where they’d first been in 2021. Or chart #3, down 9% from 2022.
Can you not see??? Did you even look at the charts, or are you just bullshitting because it’s Friday night bullshit time?
Not sure why everyone is getting their panties in a wad? The US average Compound Annual Growth Rate (CAGR) for housing is 4.4%. That works out to 181% over 24 years. Kansas City is just under this average as are several other cities. Can anyone say location, location, location? Sure, Austin and several others that went almost vertical in 2021 are going to revert to the mean. Wolfie shows why you shouldn’t invest there. Others like Seattle have a CAGR of just over 5%, and will probably continue to do so unless we have a recession, then all bets are off.
Hi Wolf,
Will there soon be a second series of Europe’s most magnificent housing bubbles?
Maybe. But it’s a lot of work and not many people read the first one. Non-US-Canadian topics draw relatively few readers in general unless something blows up. So I post only very selectively on non-US topics.
Hi Wolf,
Thank you for your regular reports on the housing market.
From my reading of the local prices, Kansas City is experiencing a bit of downturn. Just as you reported. I am interested in buying a home there. Perhaps I would give it another year to see where the prices go.
Do you have any recommendations for the timing? Also, do you think Kansas City will go through drastic drops like Austin? It is very hard to get a sense of these things.
I appreciate your reporting. Thank you.
If I may, wait for the Kansas City housing prices too subside unless you are wealthy enough where price is secondary.
When the tide goes out, all boats go lower.
Homes still going way over ask here in NW New Jersey. We’re over an hour and 20 minutes drive from NYC. People apparently still have way too much money to blow.
These prices are determined at the margin, of course. The question is how many fools will continue to buy these greed-driven prices. The fools are getting weeded out, and when most of them have gone, prices will drop. The snowball is starting to roll downhill, slowly at first, and then pretty fast. It’s like a train getting going, to mix metaphors.
Thanks Wolf! Just curious – I understood what you mean by lack of seasonality since we haven’t seen much traditional seasonality these last few years in some of these markets. However – does this look like normal seasonality is returning and can we compare it to those years?
There are many metros here with zero seasonality going back 20 years. When prices in those metros change, it’s NOT seasonality, no matter what.
Seems Housing Bubble 2 is quite durable against popping- at least so far.
No post from Phoenix-I on this? Either he’s given up and gone long RE or maybe now works for the Fed!
I was wondering what happened to him as well.
Maybe he finally bought something.
Nope…just don’t feel like posting anything after Nov…in the grand scheme of things of what to come, perhaps housing market is the least of my concern..
It’s ok to have a massive massive upward trend in housing prices for years but when it comes to bringing it down fast….um everything is rigged. Wondering if this country is even real. It’s almost kinda pointless to post these housing price chart when it’s so elevated and the drops are trivial.
Any Realtors with data points out there with how lower volume is affecting them and the market. Must be at a breaking point for some who are underemployed or basically unemployed at this point.
My realtor is taking a corporate job in January. She couldn’t survive on such limited sales.
My buddy who’s a realtor also does professional listing photos for other realtors as a side hussle.
At these nose bleed prices, three sales per year will keep them from starving with a six pct commission.
As if I know, by virtue of my many years mining.
Worthy of a re-post given the latest Wolf-info this week(note that the last 1/4 point cut lit a fire under the tnx rate and it appears to be deja vu this time too. Excellent call made by Wolf.
Wolf Richter
Nov 8, 2024 at 12:32 am
In this environment, lower Fed rates = higher inflation = higher long-term rates = higher mortgage rates. So these young buyers then can try to buy a home with a 12% mortgage? We did. Prices will plunge if this happens.
Be careful what you wish for.
How’s the job market in those cities?
I remember way back in 2018 waiting at OHare airport (flight going to Florida ) seeing people using their laptops to browse southwest Florida houses.
Is it almost time for a Splendid Crypto Bubble article?
Is crypto, worthless by the measures applied to a currency that is acceptable in public transactions. With no military champion to defend it’s value, crypto is a high risk investment.
Wolf, Just wondering if you ever thought about graphing the bubbles on the S&P 500? Might make an interesting story to lay those against the bubbles in the housing market?
Wolf – can you explain the difference between this data and the case-schiller?
I’ve noticed lots of people now ignore this data and point to the CS index. Granted, these people are investors or RE professionals that depend on selling homes to make a living. So I know what they’re trying to do.
I already did explain it in the article linked below. Make sure to click on the link and read the article.
The CS lags 3-4 months, and it’ll catch up with this data here. In addition, the CS ignores metros such as Houston, Philadelphia, Austin, San Antonio, Sacramento, San Jose, Kansas City, etc. etc.
For the few metros the CS does cover, it’s fairly close to the data here, but lags 3-4 months.
I discussed all this in the article linked below, plus the history of the CS, how it was bought decades ago from the founders and was neglected by the new owners before it changed hands again. Now S&P owns it. S&P doesn’t care one iota about it, so adios.
READ THIS:
https://wolfstreet.com/2024/09/02/why-well-replace-the-case-shiller-home-price-index-for-our-series-the-most-splendid-housing-bubbles-in-america/