
The labor force rose, after shedding 2.1 million people in 8 months amid the crackdown on illegal immigration and the wave of retirements.
By Wolf Richter for WOLF STREET.
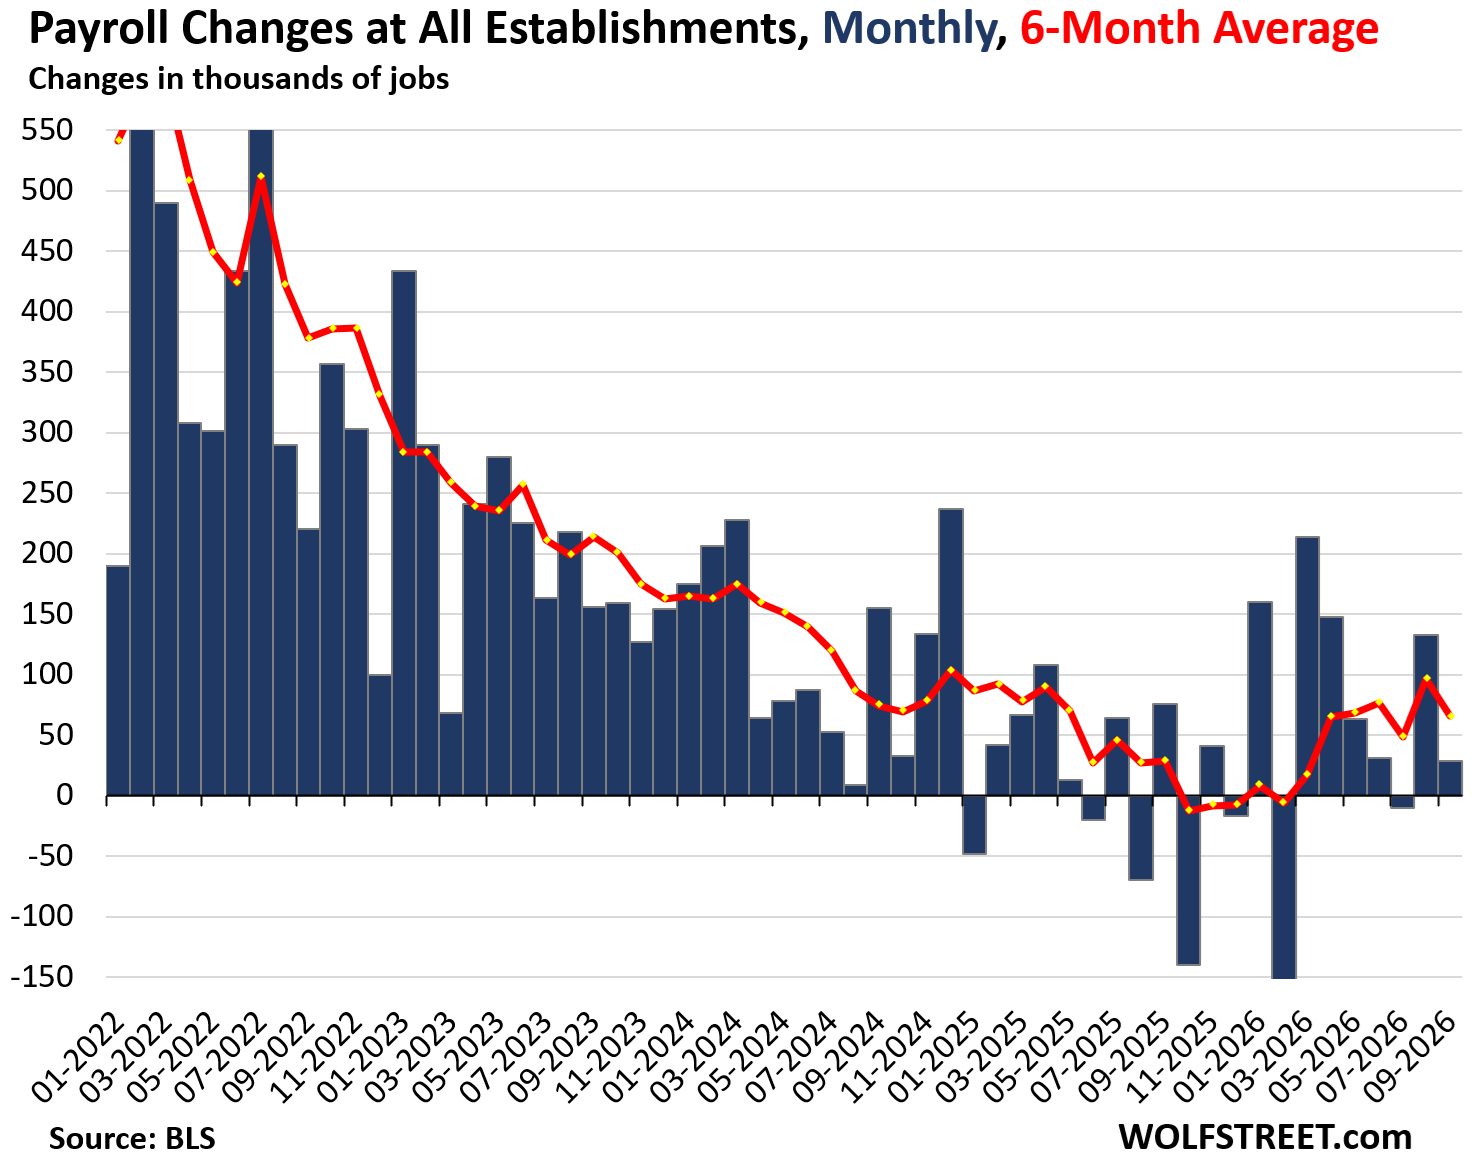
Overall payrolls of nonfarm employers rose by 29,000 in September from August (blue columns in the chart), to a record 159.04 million, as governments at all levels shed 17,000 jobs, mostly at local governments, and private-sector employers added 46,000 jobs.
The revisions are yoyoing in both directions: This time, the prior two months were revised down (August by -29,000 and July by -31,000). In the report a month ago, the prior two months had been revised up (July by +44,000 and June by +11,000). This data on nonfarm payrolls, released by the Bureau of Labor Statistics today, is based on surveys of employers.
The six-month average gain of total nonfarm payrolls, which irons out some of the month-to-month squiggles and includes the revisions, at 66,000 jobs, were a step-down from the August six-month average that had been the highest since June 2024 (red line).
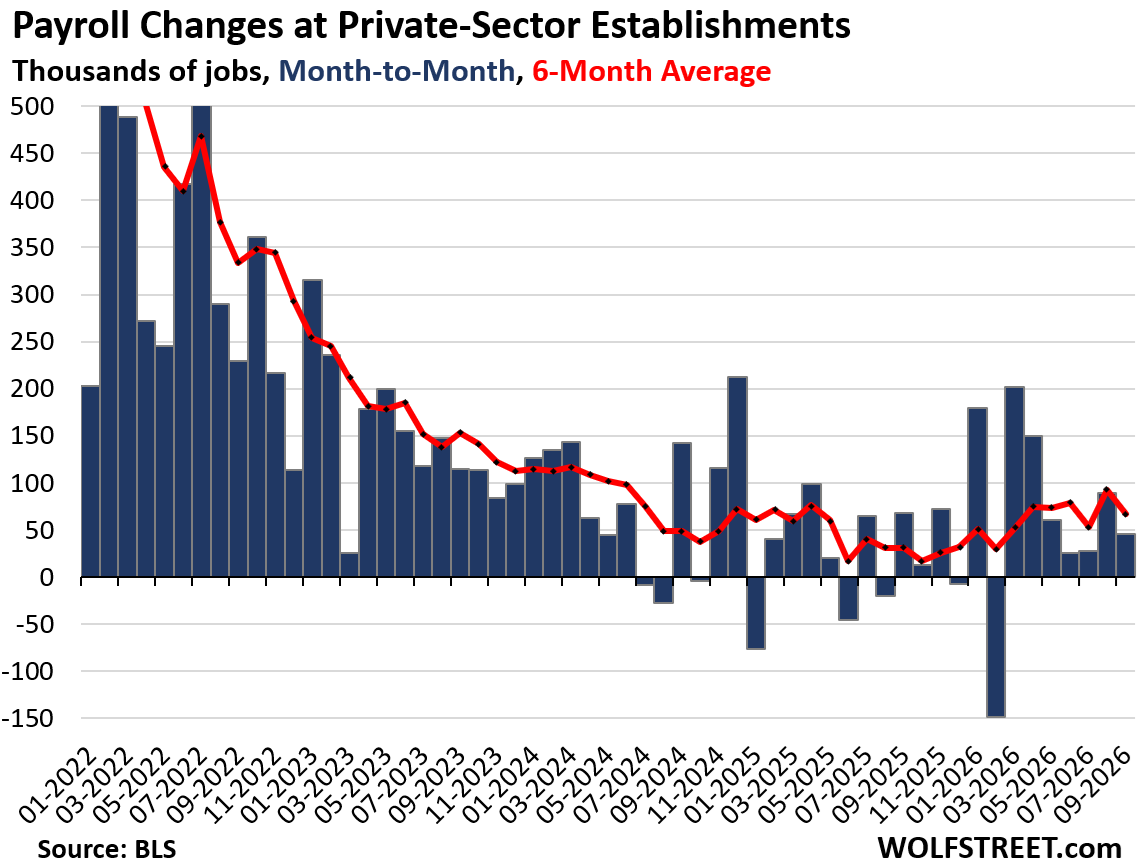
Private-sector payrolls rose by 46,000 workers, to a record 135.72 million.
The six-month average job gain of 67,000 jobs was also a stepdown from the August gain of 93,000 jobs, which had been the highest since June 2024.
This job growth is occurring despite the labor force having declined by roughly 2 million people from the peak in 2025 as a result of the crackdown on illegal immigration and the continued wave of boomer retirements.
By category of private-sector employers.
Three major private-sector industries shed jobs:
- Financial activities, includes real estate (-7,000)
- Information (-10,000).
- Professional and business services (-9,000).
The other major private-sector industries gained jobs:
- Healthcare (+23,000);
- Construction (+11,000);
- Leisure and hospitality (+10,000);
- Manufacturing (+9,000);
- Transportation & warehousing (+8,000);
- Other services (+6,000).
- Retail trade (+6,000).
- Wholesale trade (+5,000);
- Arts, entertainment, recreation: (+3,000).
- Utilities (+500)
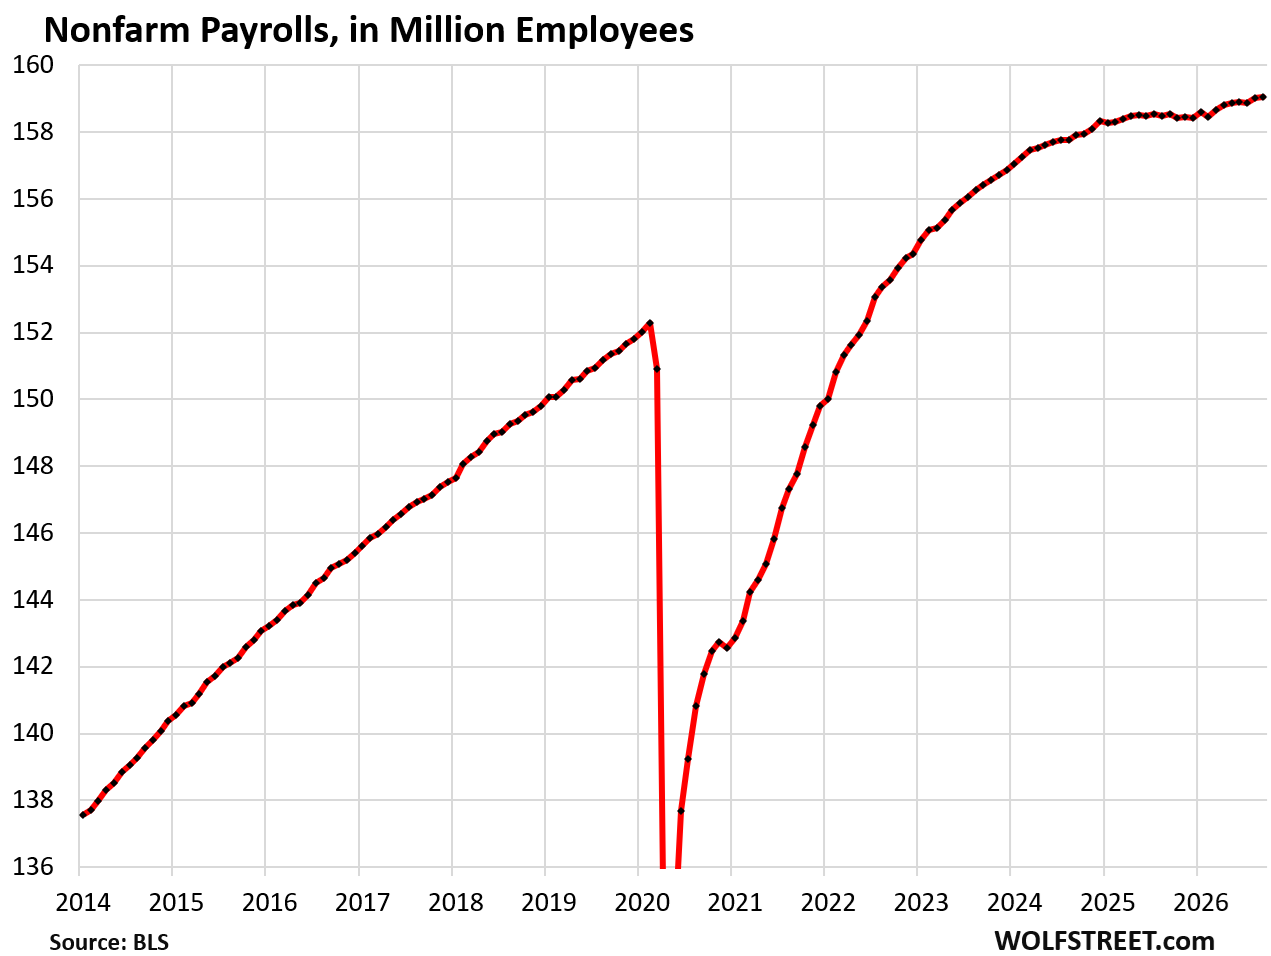
The level of total nonfarm employment rose to a record 159.04 million in September.
There was a clear flat spot from April 2025 through February 2026, when nonfarm payrolls essentially didn’t change, as private-sector employers continued hiring but on a slow pace, while the federal and state governments shed jobs.
The federal government has shed 328,000 jobs since January 2025 as the Trump administration was cleaning house, and state governments have shed 53,000 jobs as their large public university systems experienced declining enrollment including by the big money-maker, foreign students.
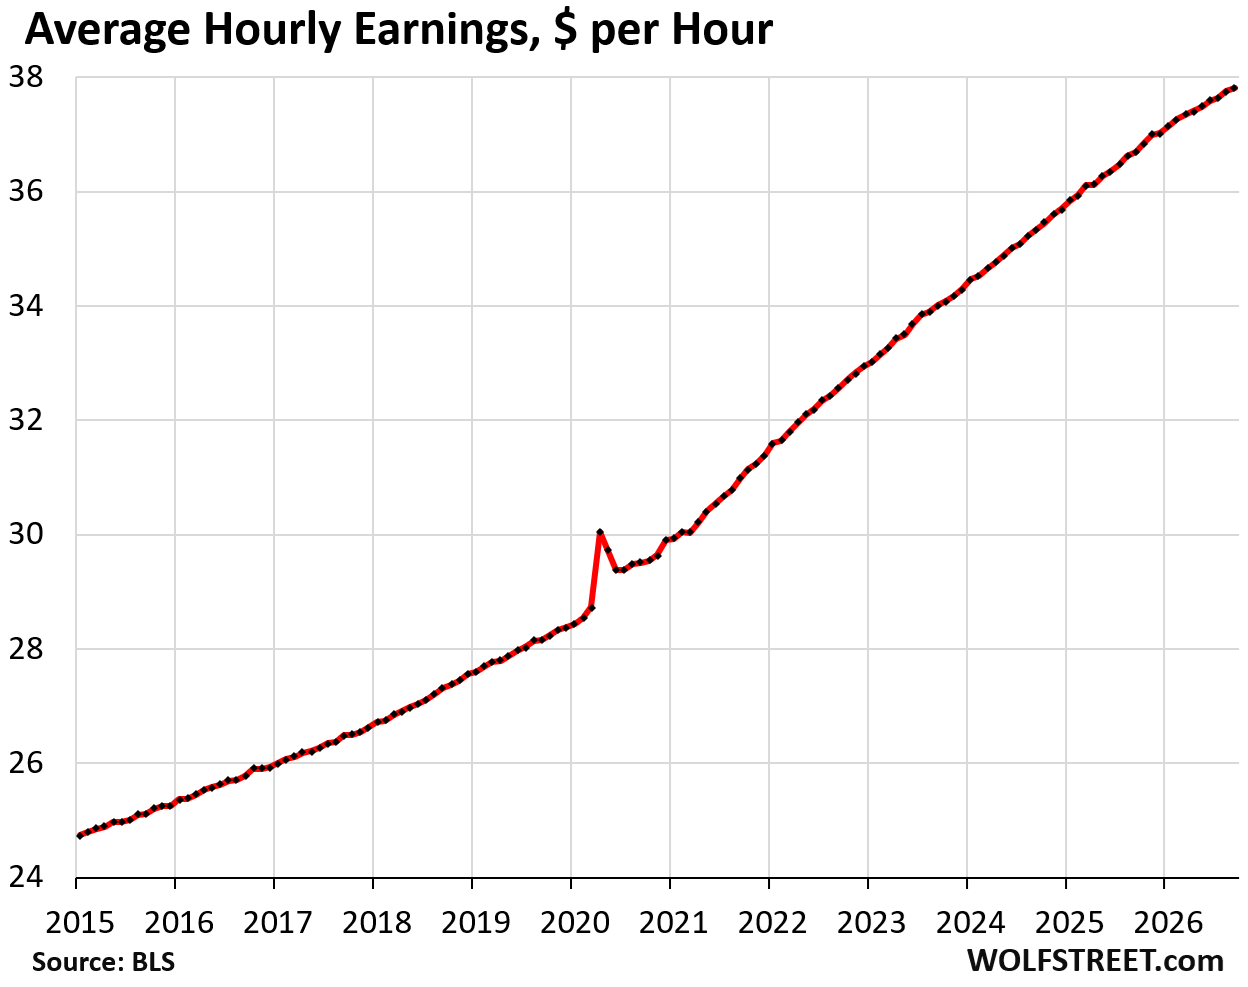
Average hourly earnings rose by 0.13% in September from August, and by 3.0% year-over-year, to $37.81 per hour.
Inflation has been running hot for months, with CPI rising by 3.4% in August, and more in prior months, and wage gains have been lagging slightly behind the rate of CPI inflation since April, after outrunning CPI inflation over the past three years through March 2026.

The labor force rose by 485,000 in September from August, to 170.3 million, the second month in a row of increases, following an uneven series of big declines this year.
The three-month average, which irons out some of the big month-to-month swings and the huge adjustments, rose by 301,000 in September from August, the first increase this year, after having dropped by 2.07 million in the prior eight months.
The labor force consists of people who are working and people who are not working but are actively looking for work. When a person decides to retire, they exit the labor force. The data is collected via surveys of households.
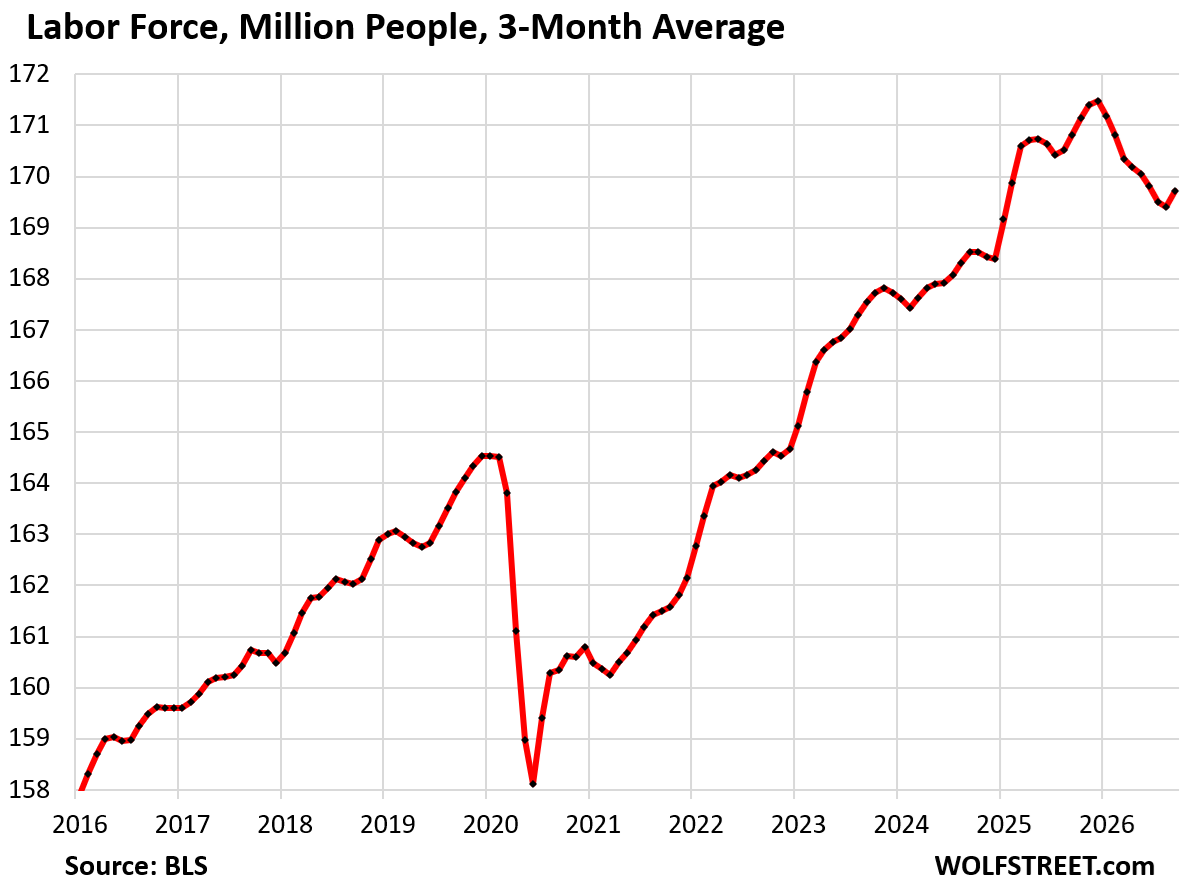
The drop in the labor force since the end of 2025 resulted from the crackdown on illegal immigration and boomer retirements.
The data on the labor force is collected via surveys of households (the above nonfarm payrolls data was collected via surveys of employers).
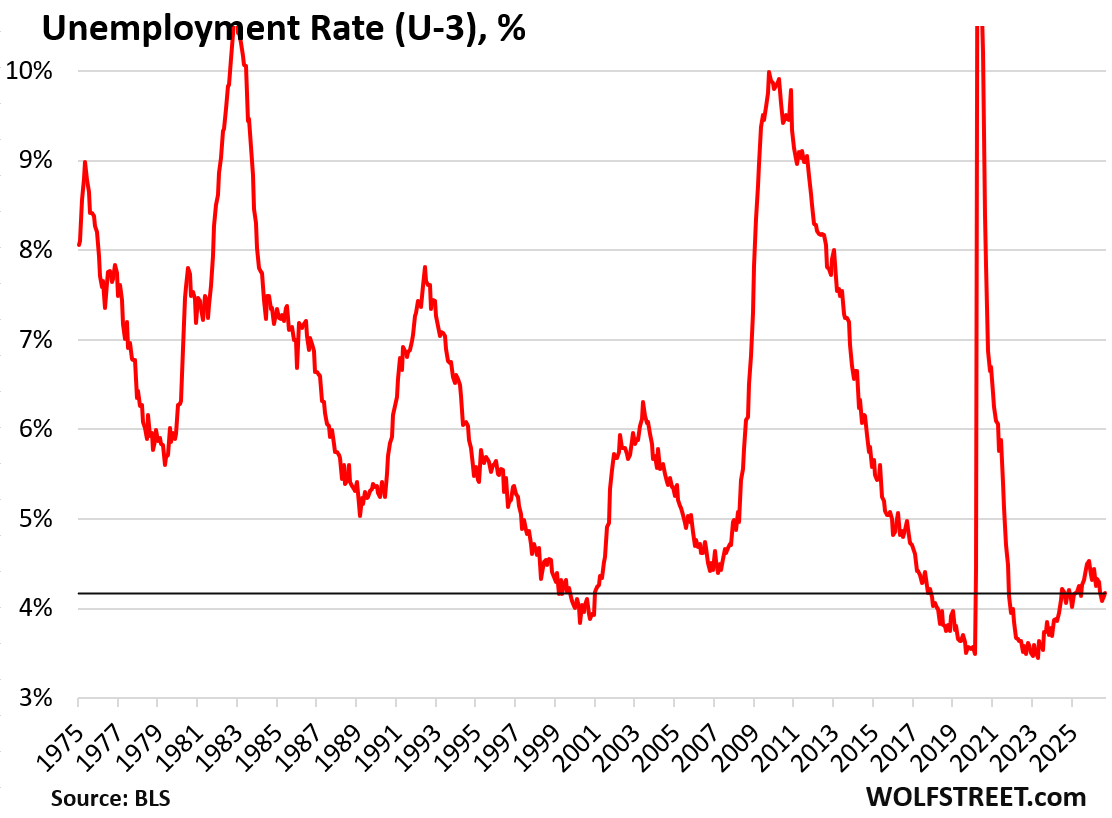
The decline in the labor force – a decline in the supply of labor – has changed the dynamics of the labor market, leading among other things to a low unemployment rate, despite so-so job creation.
The unemployment rate inched up to 4.18%, from 4.14% in the prior month, a historically low rate within a 50-year timeframe.
The unemployment rate reflects the number of unemployed people who are actively looking for a job (7.11 million) divided by the labor force (170.3 million). This data is from the BLS survey sent to households.
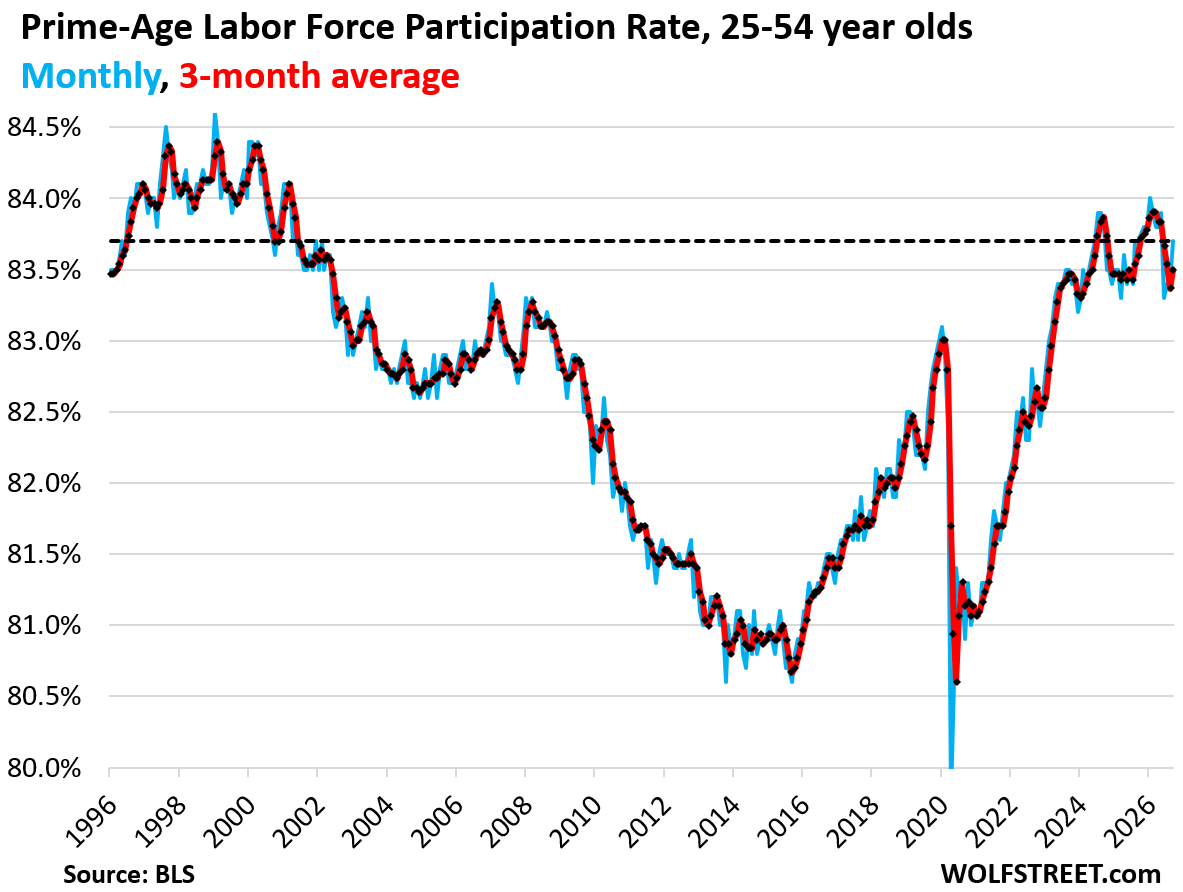
The prime-age labor force participation rate rose to 83.7% in September, the highest since May (blue in the chart below). The three-month average rose to 83.5% (red).
This range that has prevailed since mid-2024 is the highest in over 20 years.
The prime-age labor force consists of people between 25 and 54 years old. It eliminates the issue of the retiring boomers. When people retire and stop looking for a job, they’re no longer “participating” in the labor force but remain in the population until they die. It’s the surge of boomer retirements over the past 15 years that has pushed down the overall labor force participation rate (not shown here), but not the prime-age labor force participation rate.
Enjoy reading WOLF STREET and want to support it? You can donate. I appreciate it immensely. Click on the mug to find out how:


Looks like the “buy the dip” crowd for the long bonds are being more cautious today. I see nothing in the numbers above that is screaming “must lower rates” to the FED.
Correct, no rate cut data here. Today’s jobs data does not oppose a rate hike in December.
And the Fed is not going to hike before the midterms. I don’t think that ever happened. They’re going to sit tight during the midterms, and then they do what they think they should do.
Hiking right before the midterms would certainly show Fed independence.
They should do another 1/4 pt. At this stage they should have a “tweaking rates up bias”. Show seriousness about inflation while not shocking the markets.
No, it would just show stupidity.
Ha ha, no Wolf. I’m an EE (control theory) who also majored in Econ (because it was trivially easy and fun).
Fed must be disciplined with predictable data driven rules. The markets adapt accordingly. What we have now is Kaubuki Theater, and paying the price.
Economists like Taylor, Friedman, Kydland, Prescott, and even former Fed Governor Charles Plosser have all said basically the same.
The guy chirping about rules doesn’t know about the Taylor rule. Classic engineers disease!
This is wild. We have never before seen the prime age (25-54) employment to population ratio stay constant for this long. Typically it’s either growing (during booms) or shrinking (during recessions), but it has now been constant at about 81% for almost 4 years straight.
The closest previous example was 1997-2001, the only time in history with a higher percentage of employed 25-54 year olds.
numbers – The question is are we in 2000 or 2002.
2002.
“The federal government has shed 328,000 jobs since January 2025 as the Trump administration was cleaning house”
Has this drop in federal employment managed to have any effect on the deficit yet, even if it is small in terms of the total?
If their average pay was $100,000 and if I counted my zeros correctly, we should be saving 30-40B / year from the reduction right?
That sounds like a lot, but it would only be 3% of a 1T shortfall :(
That and more was sucked up by the rise in bond rates
Midwest Ralph – the entire federal payroll for executive branch civilian workers amounted to about $383 billion in 2025, compared to a $1.775 trillion dollar deficit. As I’m sure you are well aware, we are currently over $40 trillion in debt, so you could wipe out the entire civilian workforce and it wouldn’t get you very far. If you want to see a crazy chart, look at the FRED chart of the federal surplus/deficit over the entire available history (from 1901 thru 2025): https://fred.stlouisfed.org/series/FYFSD#. It’s nuts.
And meaningless unless you adjust for how much the economy has grown.
A chart of nominal US GDP looks equally crazy.
A drop in bucket, lost in other waste associated with the firings and layoffs.
Wikipedia: “The Senate subcommittee on investigations reported that DOGE has generated over $21.7 billion in waste across the federal government. Treasury Department and IRS officials predicted a decrease of more than ten percent in tax receipts by the April 15 deadline in 2025—more than $500 billion in lost federal revenue; they noted that “DOGE-driven workforce reductions” were a factor. However, actual revenue for 2025 increased from $5.100 trillion to $5.313 trillion. [remember there’s an extra $250 billion from new tariffs]
The Partnership for Public Service estimated in April 2025 that the DOGE effort will cost taxpayers over $135 billion in 2025 due to productivity losses, paid leave, and the costs of dismissing and re-hiring employees. This estimate did not include the costs of lawsuits or lower tax collections by the IRS.”
Tangent, but I’m surprised I don’t see any more coverage of actual farm payroll stats. I know its very seasonal, usually not that relevant, but its weird that with so much conversation around illegal immigration and the impact on labor, this isn’t being reported on? Not requesting that Wolf writes on this, just a thing I noticed.
Farm workers are included in the household survey data above of total employment, unemployment, labor force, unemployment rate, participation rates, etc.
The crackdown on illegal immigration isn’t specifically targeting farm labor, from what I can see, but urban areas (raids at construction sites, meatpackers, etc.)
Farm employment is always just a tiny part of US total employment. USDA estimates that there are about 2.5 million farm workers, compared to 163.2 million total employment (including nonfarm payrolls, self-employed, farm-workers, etc.)
The popular media is really playing the one side of this information
The billionaires who control everything, and are clamoring for rate cuts at the expense of the working class and poor who they are financially raping, OWN the media and control the information flow.
Jobs are a lagging indicator. We have “sticky” wages.
That stuff is always funny. “Lagging” behind what? Jobs are not an “indicator” of something else. They’re IT.
Wolf:
When you state jobs shed at local governments….
does that include state, or just city and parish/county jobs and what not ?
Just curious.
State jobs are listed separately in a separate chart. “Local” means cities, counties, parishes, etc.
Ok
Thanks…
Because all of the California State Agencies have been mandatory cut by 10 percent for a few years now, with the exception of California’s State Fire Department CAL FIRE which has been hiring like mad and budget expanding for a couple years now.
They have been trying to accommodate the state’s expanding problematic disasters most especially wildland fires.
I was curious where they stood as far as statistics.