
The 2-year and 3-year yields indicate that the 10-year yield could go way higher over the next few months.
By Wolf Richter for WOLF STREET.
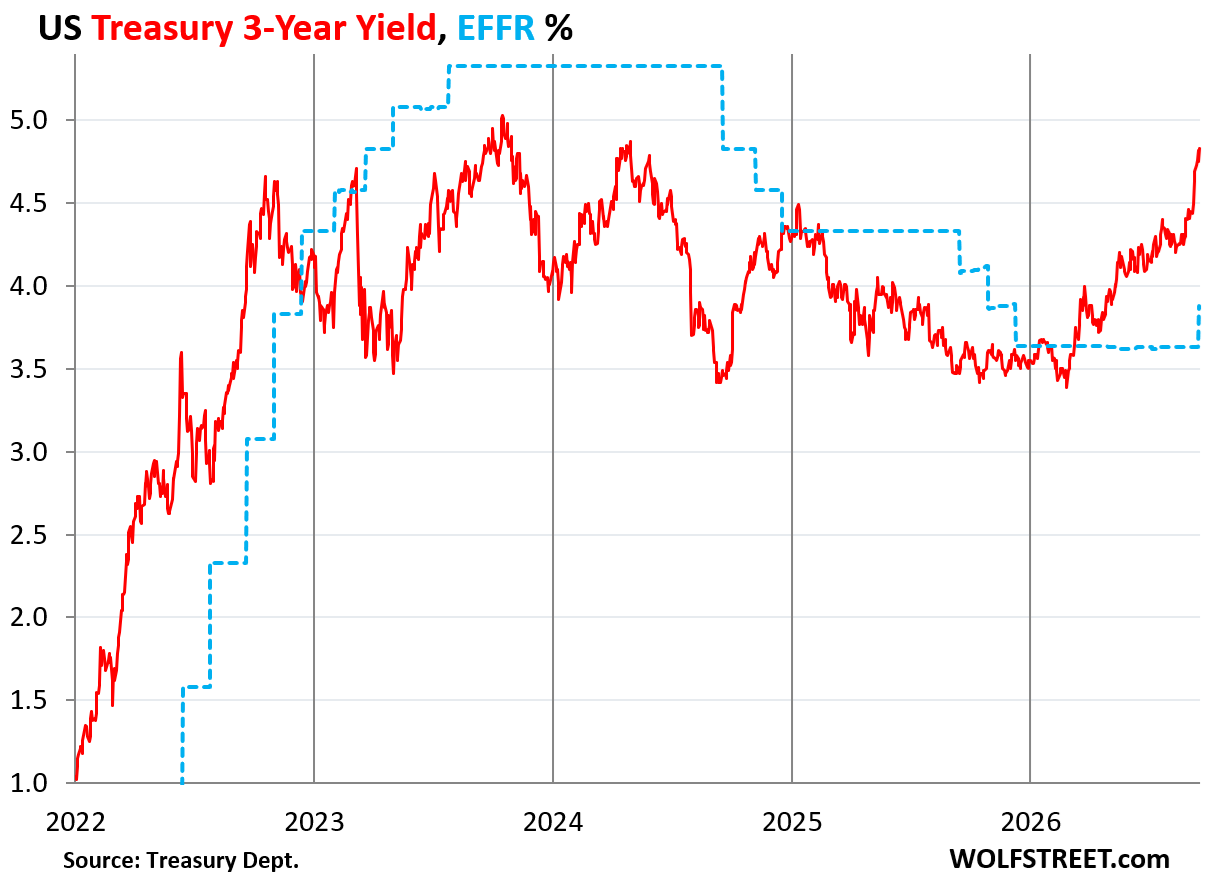
The 3-year Treasury yield spiked by another 14 basis points this week – the week of the Fed’s hawkish rate hike – and by 56 basis points since Warsh’s financial-conditions-are-not-restrictive speech in Jackson Hole on August 28. Since the end of February, it has soared by 144 basis points. It closed on Friday at 4.86%, the highest since April 2024. That was over four months before the first round of rate cuts even started.
The yield is now just 15 basis points below the 10-year yield, which makes for a narrow spread. More on that in a moment. For many investors, that narrow spread and proximity to 5% would make the 3-year maturity attractive. But that demand hasn’t emerged, and the yield kept spiking on Friday by 8 basis points.
It’s 95 basis points above the Effective Federal Funds Rate (EFFR, blue in the chart), which the Fed targets with its policy rates. So these buyers and sellers in the bond market are now counting on multiple additional rate hikes, on top of the rate hike this week.
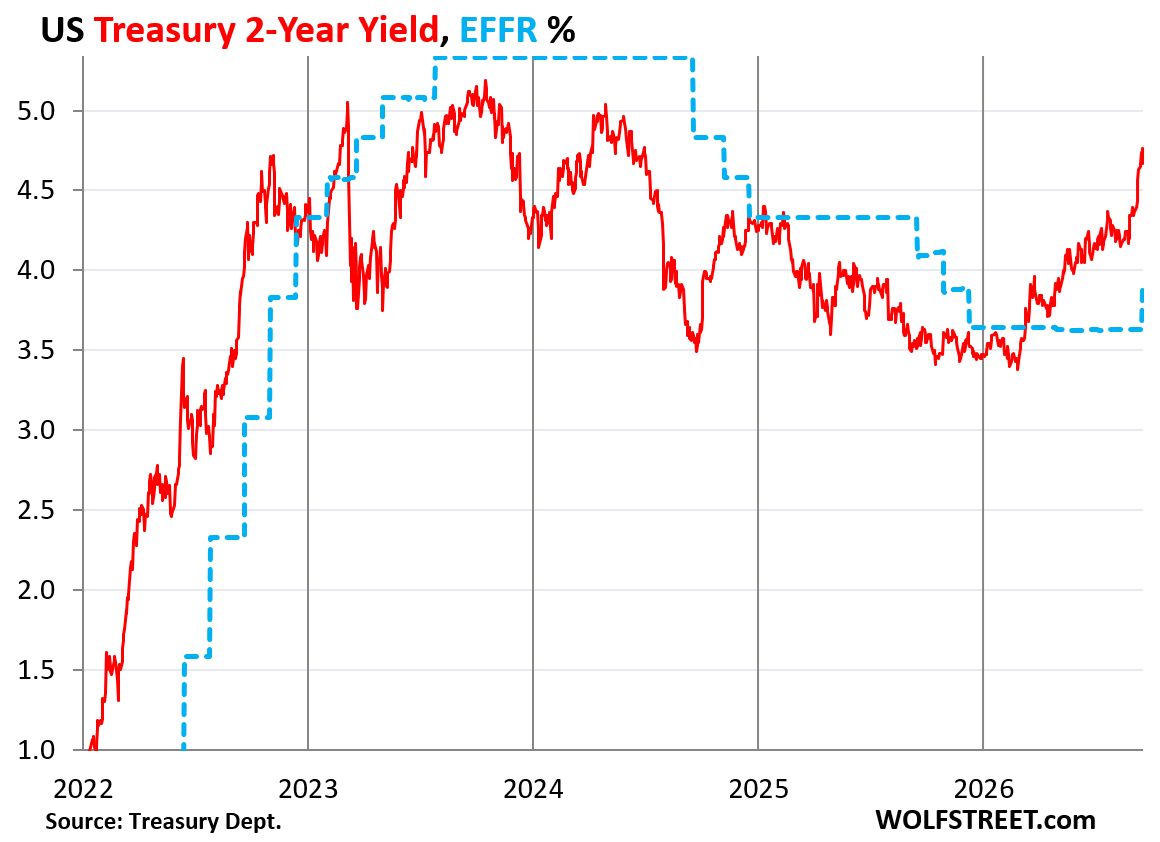
The 2-year Treasury yield soared by 13 basis points this week and by 56 basis points since Warsh’s speech. Since the end of February, it has soared by 134 basis points.
It closed at 4.76% on Friday, the highest since June 2024, about three months before the first round of rate cuts had even started.
It’s 88 basis points above the EFFR, thereby also pricing in multiple rate hikes. And it’s now only 25 basis points below the 10-year Treasury yield.
But the 10-year Treasury yield has gotten stuck at around 5%. It had been within a hair of 5% last week, rose to 5% this week, and after a drop on Thursday, bounced back on Friday and closed at 5.01%. This 5% is the magic line for the 10-year yield.
Last time it pierced 5% briefly intraday on October 23, 2023, the floodgates of demand opened, and investors jumped off the fence and started buying hand over fist, and the yield plunged that very day, and kept plunging for two months [Some thoughts on the Treasury yield above 5%].
This time around, the floodgates did not open, but there was enough buying to balance out the selling, and the yield got stuck at 5%.
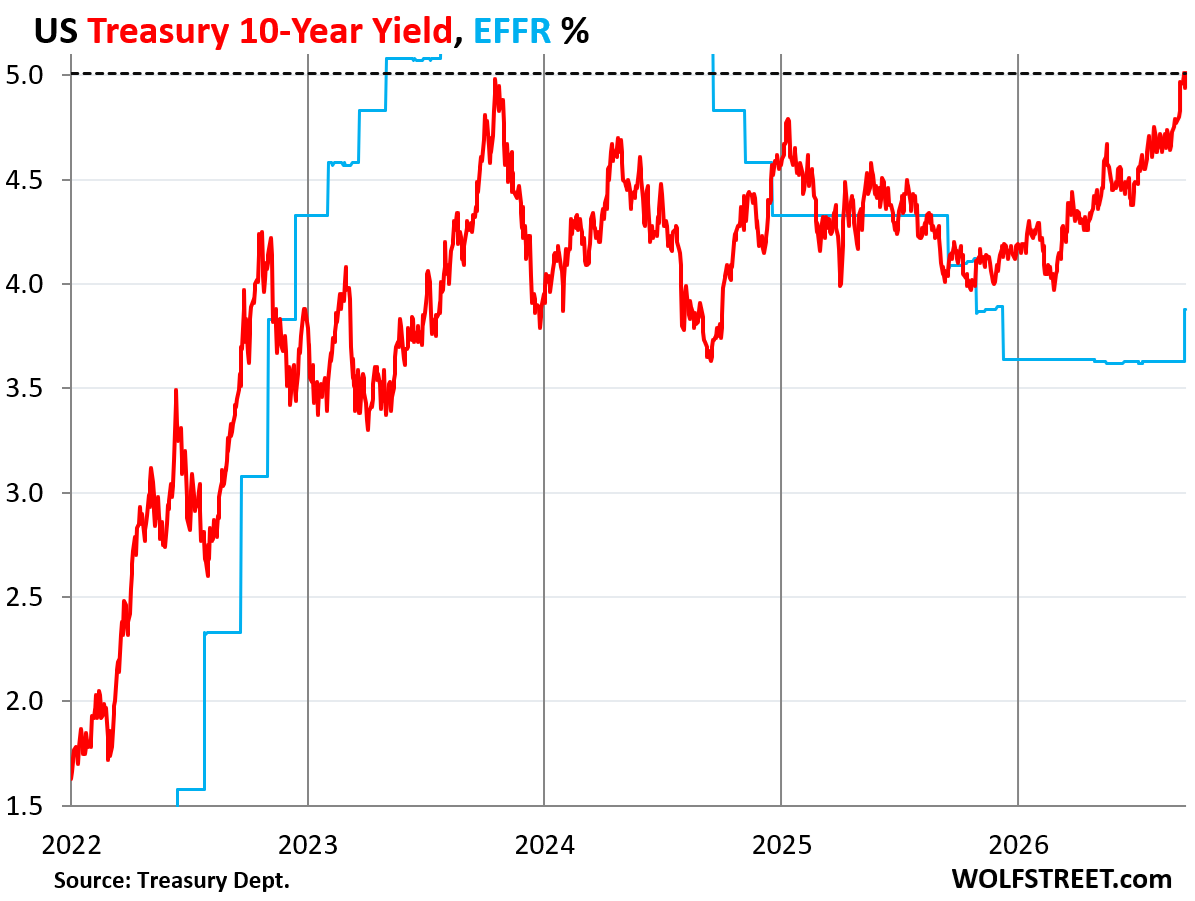
Signs the 10-year yield might break through the 5% line over the next few months: While the 2-year and 3-year yields continued to soar, the 10-year yield kept bumping into the 5%, and each time it hit that magic number, more demand emerged and kept it from going over 5%. This dynamic has narrowed the spread to the 3-year yield to just 15 basis points, and to the 2-year yield to just 25 basis points.
In the past, during periods of economic growth and inflation, such as now, the spread between the 2-year yield and the 10-year yield spent lots of time in the range of 100-250 basis points.
This narrow spread today, and the much wider spread during times of growth and inflation indicates that the 10-year Treasury yield at today’s level is still well below where it might end up going, according to buyers and sellers in the 2-year and 3-year maturity portion of the bond market.

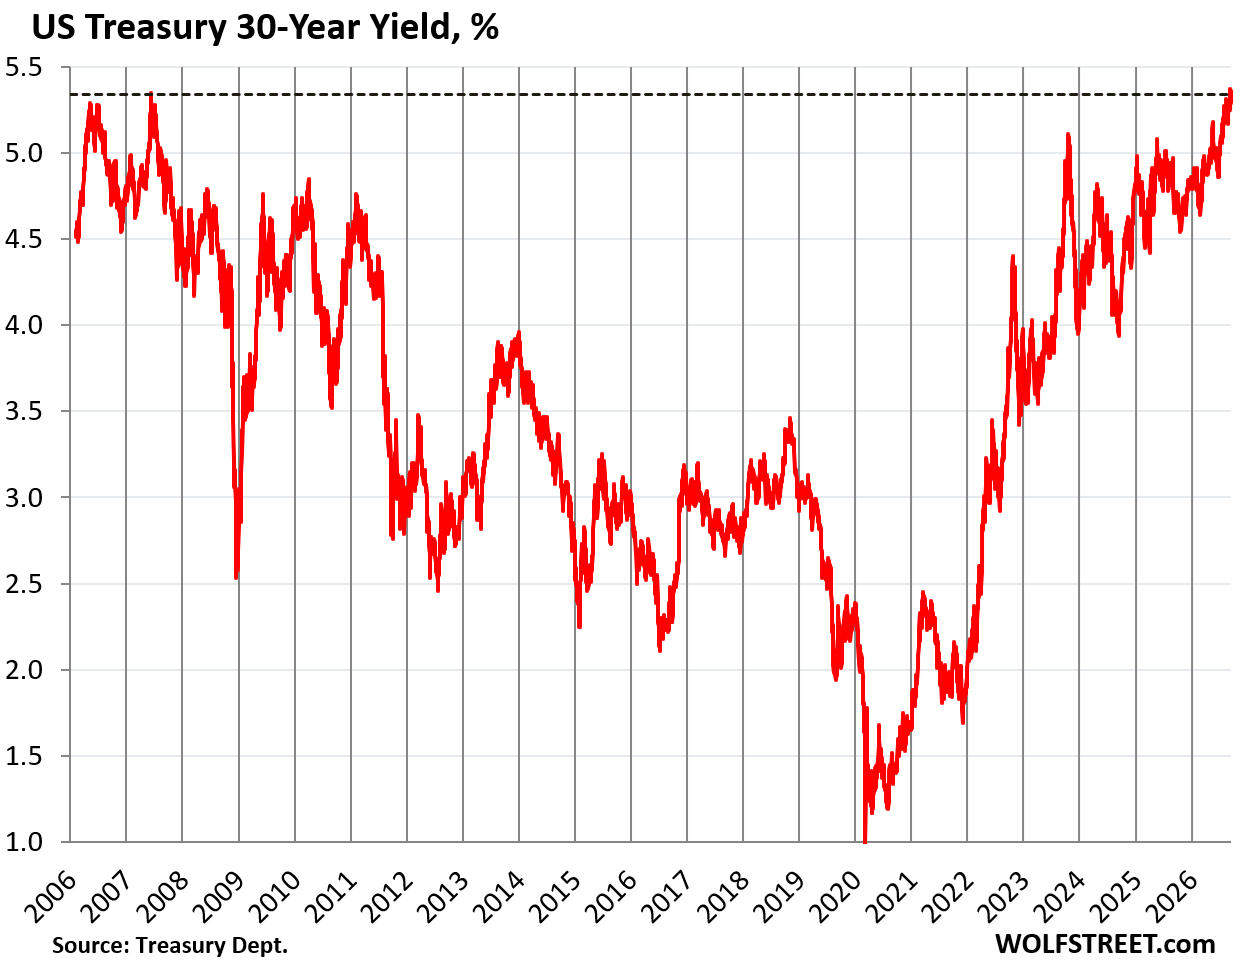
The 30-year Treasury yield has gotten stuck at the 5.35% range over the past two weeks and closed on Friday at 5.34%.
This range is the highest since 2007, the last year before the Fed’s QE and financial repression drove a wooden stake through the heart of the bond market and buried it in an unmarked grave – from which it started rising in 2022.
So maybe all that happened is that the long-term Treasury yields are in the process of normalizing as the bond market is coming back to life, with the encouragement of the Fed under Warsh.
The Treasury Yield Curve has steepened in the 1-year to 3-year range but flattened out in the 4-year to 10-year range, which brings us back to where the 10-year yield might be going, according to the buyers and sellers in the 2-year and 3-year maturities portion of the bond market.
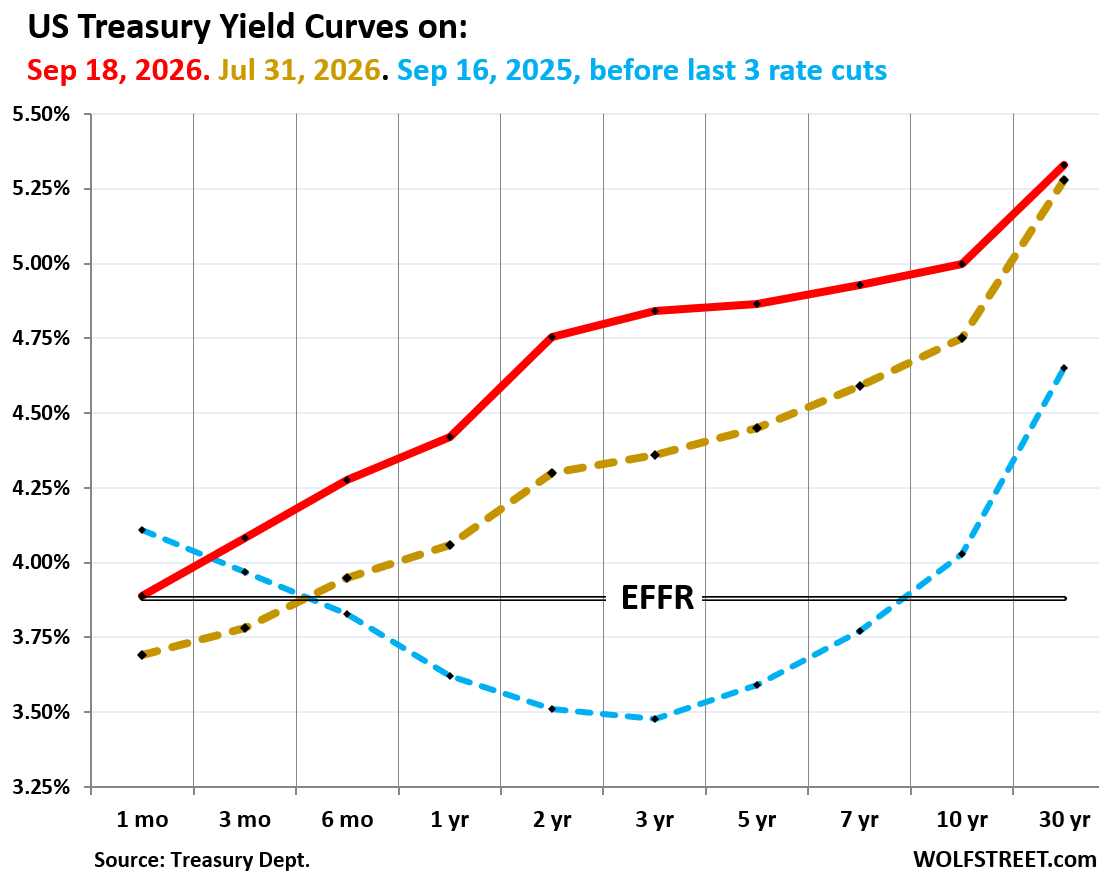
The chart below shows the yield curve of Treasury yields across the maturity spectrum, from 1 month to 30 years, on three key dates in 2025 and 2026:
- Red line: Friday, September 18, 2026.
- Gold dotted line: July 31, 2026, two days after the no-rate-hike FOMC meeting.
- Blue dotted line: September 16, 2025, before last three rate cuts.
The Fed’s rate cuts last year pushed down short-term yields, but longer-term yields rose as the bond market was worrying about inflation and deficits.
The chart also shows that since the eve of the Fed’s last round of rate cuts, since September 16, 2025, the 2-year yield and the 3-year yield have risen by the most.
Now there is this bulge in the middle (red line), indicating that this section of the bond market thinks the 10-year yield has still some ways to go higher, while enough buyers of the 10-year maturities are still enthralled by the 5% magic line.
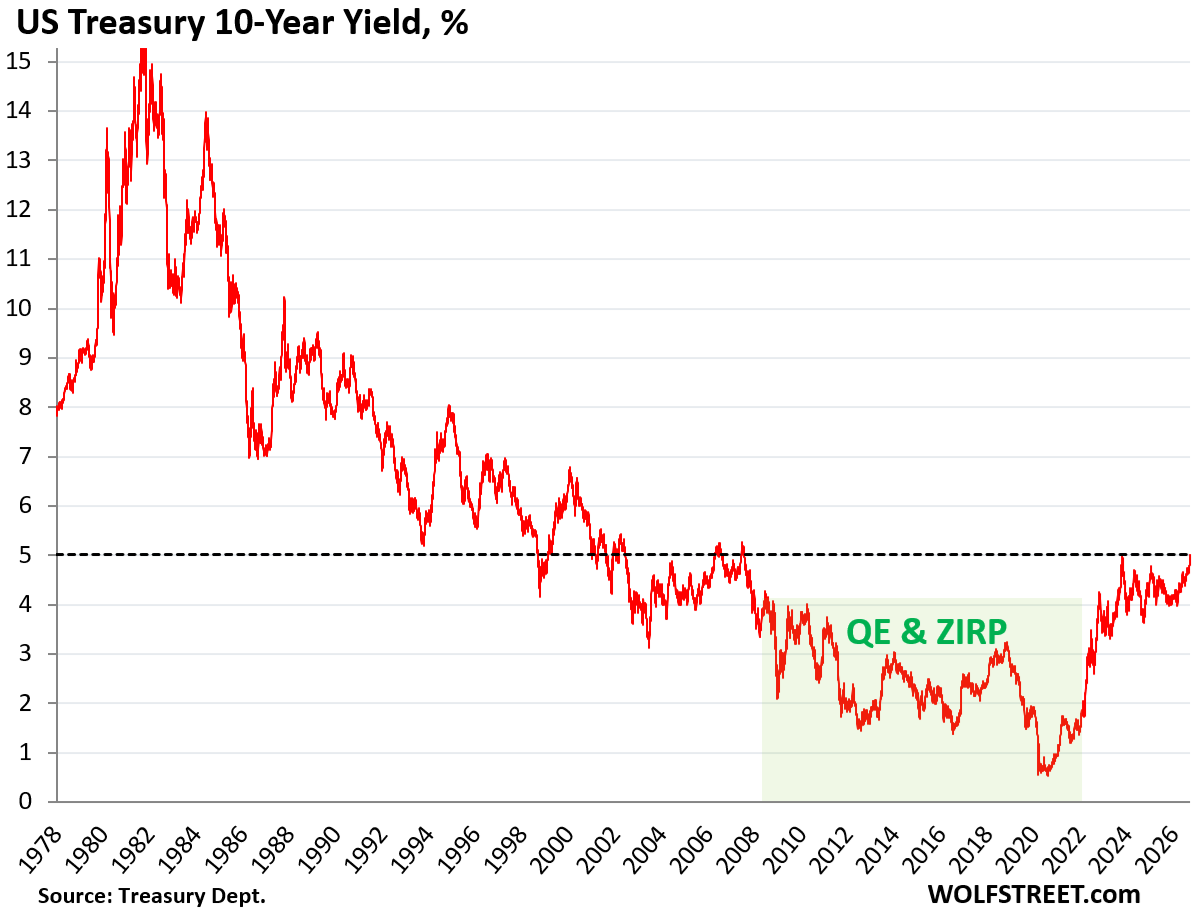
Before the financial repression era that began in 2008, a 10-year Treasury yield at 5% was not high. It’s only high compared to the years of financial repression, starting in 2008, when the Fed purchased trillions of dollars of Treasury securities and MBS to artificially force down long-term yields. But this experiment ended in early 2022 amid 9% inflation, the worst in 40 years, and the worst home-price explosion ever that is now called the “affordability crisis.”
Warsh has been an outspoken critic of the Fed’s QE and ZIRP policies after the first round of QE and resigned from the Fed over this issue in 2011. And now he has welcomed with open arms the bond market coming back to life.
Enjoy reading WOLF STREET and want to support it? You can donate. I appreciate it immensely. Click on the mug to find out how:


Way cool. It’s no happenstance that rates rose when the DD, demand deposit, to TD, time deposit, ratio rose.
The flight to liquidity has increased the means-of-payment money supply.
While M2 has increased by 1,192b since July 2025, DD’s have increased by 1,471b dollars (or all of M2’s growth is in DDs).
Seems people are paying attention and expecting higher yields in the future, therefore not locking up their money now in time deps.
Indicates to me inflation is much higher than reported.
Inflation in the overall economy for consumers, businesses, and governments — which is what matters here, not consumer price inflation alone — is reported as 6.4% in Q2 annualized (blue) and as 4.4% year-over-year, shooting straight up. Inflation for businesses is even higher (PPI reports this inflation = 5.4% year-over-year).
This is the official data from the Bureau of Economic Analysis. It seems you don’t know what reported inflation actually is — this article has the details:
https://wolfstreet.com/2026/07/30/inflation-in-the-overall-economy-hitting-consumers-businesses-and-governments-was-really-bad-in-q2-even-without-energy/
Yes, that second wave of inflation is just getting started. Summer of 72′ again Wolf, this time with debt/GDP at 120%…
…Interesting times.
If we used the inflation formula from the 70s would inflation be measured lower, higher or the same as today?
In the 2yUsT in 2006 we had yield 5.92% as inter day high and in 2023 we had 5.252, when that sloping resistance line gets taken out the 2 year yield at 8% is in play, a fib extension from high yield of 2006 to the low yield floor of 2011 12 13 hits at 8.2%ish The Fed failed in 2023 in dealing with inflation. Will see if Warsh can do the right thing in the future regardless of the pain to the capital class. When we invert unemployment rate with inflation rate denial of the magnitude of raises needed will be obvious. 5.3% $tnx in less than a month maybe as soon as next week and then the bottom falls out in equities. I am seeing Diesel with a 7 handle this weekend. Price of diesel is now correlated with yield, it’s baked in that yield will rise from the recent price rise of diesel. Those historically normal spreads between 2 year and 10 year still can occur with time.
Thanks for the article!
“If we used the inflation formula from the 70s…”
🤣 this stupid stuff never dies. Vacuum-tube TVs, no cellphones, no internet, no broadband, no streaming subscriptions, only basic healthcare with many treatments and medications not available and people dying from stuff that today they don’t die from, cars that were primitive slow uncomfortable death traps, homes that were much smaller… that’s what inflation measured back then. I became an adult in the 1970s and know what it was like, and what inflation was like. No Comparison to today. Life has changed. And inflation indices changed with it as they should.
I’m a GenX-er, and remember my family’s only TV (an early 70s color model) had to “warm up” for about a minute before you got any picture. When we got a 2nd TV, it was somebody’s black-and-white cast-off. When the color TV finally bit the dust in the mid-80s and my parents replaced it, I thought it was pretty cool that the picture came up right away. And we didn’t need to adjust a bunch of knobs to get the picture looking right. Vertical-hold, horizontal-hold, color, tint, fine-tuning. Come to think of it, if you could get the picture looking good on an early-70s TV with rabbit ears, you were halfway to being skilled enough to run a mass spectrometer.
A person had to go to the library to read about the 100 Years War. A person would have to watch the news or read the newspaper the next day to find out who won a sporting event they did not see. If a person missed an episode of their favorite show, they likely would never see it. Companies would be forced to send multiple employees half way across the country to discuss critical issues. There were literally 3 – 5 channels on TV. Cars got fractions of the miles per gallon they get now. People still died of measles…….. oh wait.
I love me primative death traps!
My 442-455 Olds/70 GTO/67 Firebird,the list goes on of cars I never should have sold,always thought they would be available and reasonably priced.
Dump the Vietnam war and would be glad for the 70’s.
Good to know! Thanks
Limit sell SPY 573.65 that’s when the short covering rally turns into smart money selling!
Cheers
Well, inflation measurement do follow much the same methodology today as in the 1970’ties. It can then be argued both that the inflation measurement measure the same and not today.
The rate of price change on a set of goods, for example items people consume, is measured. That is the consumer price index. How the items making up the index and how the items are weighted is much the same. What is in the index is quite different.
This make the price index a reasonably good measurement of the rate of change. Any long time comparison or comparison of two different periods of time not so. It is much the same as engineers using a straight line to represent any kind of curve. Ok for a short piece of the curve, but way of over any distance or different places on the curve.
Oh man! This article has me charged up!!
I agree. The first good news in a long while. Fundamentals coming back?
Trump abhors institutions and alliances. He’ll figure out a way to torpedo this trend, rest assured. From my perspective, anything that limits billionaire profits will be undermined as quickly as possible.
Yeah, that’s what I’m afraid of, but if by some chance the 10-year gets to 6% or 7%, that could change my whole retirement picture.
OutWest,
Because of all of his success in so many other areas? He has 6 chapter 11s under his belt which speaks for itself. Don’t think chapter 11 is an option now.
I’ve got bad news for you. If you take away the 1982-1998 periods, 10 year treasuries don’t really make much money after inflation adjustment. They don’t lose it either, but the dream of big risk-free growth in Treasuries is very dependent on exactly when you choose, and for most of the last 100 years, they didn’t make very much money unless you picked that time period.
Let’s f***ing go!!!
Guy 1: My, that’s a beautiful watch you are wearing!
Guy 2: Yes, it has great meaning for me, it’s from my grandfather!
He sold it to me on his deathbed.
Slow week for treasury auctions coming up. Not even $500B, but maybe Norway pulling back from treasury debt auctions will boost the 5yr closer to 5% and give those buyers of the 10yr some other choices.
Lol it seems those Republican bastards are screwing the pooch for when the Democratic bastards come back in power.
The debt expenses and financing expenses just keep going up.
If that crashes the economy, the yields will be back up to the teens in order to attract capital to this risky business.
Pan camera to Mitch McConnell singing Bob Seger in his adult diaper.
Please don’t associate Bob Seger with Mitch McConnell.
He has a closer association to Ted Nugent. SAD
What have you got vs Ted Nugent ? You some kinda Cat Stevens fan or something ?
Right, Mitch ain’t got no Night Moves
I don’t see the Dems coming back. They are a dead party. No grassroots. No corporate donations. No media ownership. We are in a one-party state.
One must also consider the refunding of long term debt with short term debt is putting the pressure on yields and flattening the curve along with Bessent’s constant jaw boning and his messing with the yen trade.
Yeah, there is substantial substitutability between short and long term investing. Which would you choose?
This article contains a mix of facts, coherent interpretation, and historical context. I hope folks appreciate how rare and valuable this is in the age we live in.
Agreed, thanks Wolf!
There’s a reason I check this site everyday (along a few others) for economic news rather than the more mainstream sites.
People complain about “the media” which is just BS. There is plenty of quality media information sources out there. It is just a matter of which ones people choose to consume.
The question is, do people want to be informed, or do they want to have their already formed, biased opinions reinforced? Unfortunately so many FOX News, CNBC, etc idiots choose the latter. There is good, informative media out there if a person wants it.
I read a lot of mainstream media and most of it is pretty good, as long as you aren’t on some of the straight propaganda sites like Fox, and you aren’t taking the opinion pages at face value. If anything, it’s *too* objective and they tend to “both-sides” every issue past the point where most people have already figured it out (see: crypto and AI).
I feel like the “can’t trust the media” narrative is just a way to steer people towards social media, podcasts or short-form video where people can just spout whatever they want, and the algorithm locks you into seeing more and more of whatever bias you already have.
At least in the traditional media, and even on blog sites like this one, you have actual people doing this as a job, for a discrete publication, and you can kind of keep track of who’s spouting BS. That’s a lot harder when it’s millions of randos on TikTok talking to their phones, or AI generated YouTube channels, or podcast bros booking every nutjob they can find because they’re really just selling the entertainment value.
I’m confused by this, since I thought falling yields meant a bull market as prices rose:
“This range is the highest since 2007, the last year before the Fed’s QE and financial repression drove a wooden stake through the heart of the bond market and buried it in an unmarked grave – from which it started rising in 2022.”
What does “buried the bond market” and “rising in 2022” refer to here?
Do you mean that 2007 was the year the Fed replaced the bond market as rate/price setter, for example?
And “rising” means the bond market is now starting to replace the Fed as rate/price setter?
You misunderstand the job of the bond market. The bond market’s job is to determine the price of credit, as negotiated between buyers and sellers who look at the economy every day. The Fed killed that activity since the Fed determined the price of credit (= zero or near zero), and the bond market was dead.
Howdy Youngins. Valuable History lesson provided by Lone Wolf.
Advertisement below by Squirrels Anonymous
Buy Bonds ( T Bills that is ) save yourself and your country before it is too late.
If you can not buy bonds and make a return higher than the inflation rate, then why buy any Treasury Bonds?
Because they are liquid; you can get out of the short term ones quickly and easily. They do pay something also, but it is taxed.
So the nature of the bond market has changed. You buy bonds for their liquidity when you do not have any other money making venture at hand.
Oh, for the old days of the 5 percent and a toaster bank account and an honest inflation rate of 2 percent or less. The government is always taking something away and not adding anything of value as is goes on spending binges of our money!
You’re forgetting to factor in the most important factor of all: RISK. Risk has a price.
Howdy Lone Wolf. Some old timers just cannot break old habits too. We like to look at it, smell it, touch it, save it, keep it till we die too.
Well, sometimes you also buy them when you fear other places you could put your money would lose even more.
In hindsight it looks like the FED did 2 too many cuts in 2025. Strange even though Powell detested Trump. The FED always seems to be in a rush to cut as soon as possible and always reticent to hike. Reticence to hike is always explained away … i.e. “transitory” … “tariff impact” …
If the FED doesn’t do it’s best to do what it can (hike) then the non-asset holders are more likely to vote for more socialism everywhere.
As per Gundlach’s recent CNBC appearance his take was that if he were a board member he would have dissented and voted for a 50bps HIKE and called it “Stun and Done” lol
He was referencing how high the 2Y is above SOFR and made the analogy to 2022 I believe where they had to rapidly hike to catch up.
At what point do you think capital rotation from equities returning 2-3% FCF yield into USTs earning 5%+ becomes a real force to be reckoned with?
How much in Bonds do I need to become a vigilante? Time to set some future life goals!
Zero, that’s a true vigilante, refuses to buy a single bond. But the trick is that you’d need to have the ability to buy billions of them, but refuse to, or else it’s not very effective. I’ve been in the vigilante camp for years, but the market hasn’t noticed yet 🤣
Under the “floor system” banks would refuse to lend reserves at lower rates. But today 6mo T-bills are higher than the IORB rate. The FED is too easy by its very definition.
Forget the ten year
The vigilantes are pot shotting the Bills.
A week and a half ago the ten year traded where the 3 year now is
On what planet does buying a 10 year bond make sense? I’d guess if the 10 was selling at 6.5% it MIGHT make up for 7 years of extra risk vs. the 3 yr at 4.86
Buying a 10 year bond hasn’t made sense for over 5 years now.
During those same 5 years, the media and equity investors have been trying to wish <3% yields back into existence.
A lot of idiots believed them and bought TLT because they take one look at the 10y graph and think "what goes down must come back up".
Now, the bond market is finally waking up and reminding everyone what interest rate risk is.
The only real big drop in the 10-year total return was in 2021-early 2022. If you bought at the end of 2022, total returns kept even with inflation. Also, if you bought in 2008, total returns also kept up with inflation. Stocks made a lot more, but 10 year Treasuries were not a total disaster.
I’m now completely liquid. The bounce in bitcoin reminds me of when Volcker first became Chairman and the ensuing money supply errors in 1979. Money #’s to be released tomorrow.
Completely liquid?
-Last year’s tax cut bill is pushing corporate margins higher
-We’re at full employment and stable
-Corporations are getting massive tariff refunds, while not reducing price hikes they made due to tariffs
-AI adoption is proceeding rapidly (see any professional conference)
-Wage growth is pacing with inflation
-Real GDP growth has been around 2%
-GDPNow is estimating a 5.1% annualized rate of GDP growth for the 3rd quarter
Basically, business is booming. What metric are you looking at that has scared you into money market funds?
Regarding this: My personal anecdotes:
I wrk for a Big Tech with market cap of ~$260B.
Few months back, our executives pushed AI big time and after that our current AI bill comprised of 70% of total cloud bill.
After seeing the AI bill and no corresponding productivity increase, company decided to do severe token rationing and now AI bill has fallen down to 33% of its peak.
Company is looking aggressively to open wright models instead of using frontier models.
We are talking about 100s of millions in annualized AI usage.
Here is the flow of money for AI $$
end Company -> Cloud Provider ->Big AI companies -> datacenter companies like coreweave.
My friends are in big techs and the story is similar.
70% drop in AI usage on cost basis across many companies will show up in all these hyper scalers and other related companies.
AI is for sure very useful and will become integral part of our life but the economy of AI as a biz is not making sense with current numbers.
IBDDs are down 60b on the H.4.1 release this week (after Wolf said quarter end was up). I’m looking for short-term money flows, the volume and velocity of money, to fall in the 4th qtr. this year. I’m looking for long-term money flows to stay elevated.
Will get a better reading tomorrow.
FYI: I didn’t talk about “quarter end” but about “tax day” (Sep 15), which causes a lot of liquidity shifts.
Didn’t know that. Thought taxes were the same.
Q1 income → April 15
Q2 income → June 15
Q3 income → September 15
Q4 income → January 15 of the next year
I’m reminded every quarter because I have to file personal and corporate estimated income taxes by the 15th of those months, and then I can watch my erstwhile money move through the banking system to the TGA like a pig moves through a python, I wish 🤣
St. Louis FED nowcast for real output
Q3 2026: 3.13966
Q2 2026: 2.09019
Q1 2026: 2.49967
Q4 2025: -0.17368 pricked the gold market
Q3 2025: 0.42047
As a retiree, I buy bonds for current income needs. Like several other commenters, I anticipate and welcome higher yields.
Hypothetical question: My bond ladder has 3 1/2 “rungs” (i.e 2027, ’28, ’29, ’30). As a gradualist, at what yield level do I finish investing in the 4th rung and begin adding a 5th?
Maybe just buy OZKAP and enjoy a perpetual 7.5% yield instead of tying your income to bonds in an era of rising rates?
Why on earth is the Bank of the Ozarks offering 7.5% dividend yield?
Bank perpetual preferred generally are not cumulative. If they have to interrupt the dividend payments, like some had to in the GFC, those are lost forever. So there’s some additional risk of going through a “rough patch”.
A lot of the perpetual preferred for industrial companies I’ve poked at are cumulative, which means missed dividend payments are noted and then made good eventually, assuming the “rough patch” is temporary and not terminal.
Sources I’ve read say that different treatment of bank perpetual preferred is a regulatory requirement that disallows them from being cumulative. But I haven’t dug deep enough to know if that’s authoritative.
Bank of the Ozark’s is one of the riskier banks out there, hugely into risky CRE loans. Over half of its total loan portfolio were CRE loans. If no one else wanted to finance your CRE project, you went to the Bank of the Ozarks. In recent years, it has been trying to shrink its CRE exposure and shed troubled loans, etc.
OK fine, just don’t confuse a high-risk stock like this with Treasuries. The dividend can get cut to zero without warning. The stock can crash. You’re taking HUGE additional risks to get an additional 2.5 percentage points.
That explains it. Constant 7.5% dividend with no price increase looked a little bit too much like Madoff-like returns.
Agree with everything you wrote, just wanted to add a different framing.
At a 5% coupon vs. a 7.5% dividend, that’s a 50% increase in gross income (different way to look at it than comparing percentage points).
For a middle income individual looking at the net spendable pocket money after taxes there’s even more benefit. My calculator says that’s a 68% increase in net income, working from 15% QDI marginal rate vs. 24% standard income marginal rate as assumptions, i.e. you keep 85% of the dividend check but only 76% of the coupon. I’m ignoring the effects of state income tax because I happen to live in a state without one so don’t really know how that changes the picture.
Yup, a lot more risk. But 68% more spending capacity isn’t going to come free. The risks at the moment are definitely keeping me from jumping into the deep end. But perpetuals are on my radar to nibble at as the interest rate picture wiggles (things other than OZKAP).
It seems the Central Bankers are there to prohibit the effects of free market forces.
Every action they take is to blunt true price discovery, protect some at the expense of others as I believe Hayeck noted.
We tried Hayeck’s and Andrew Mellon’s classical ideals, and one of the outcomes was the Great Depression. The population decided they’d like to enjoy economic growth instead of eating economic moralism.
LOL! Unfortunately, the average person is a moron and the supply side still requires real inputs (that cannot be conjured out of thin air). All the while there are now well over 8 billion market participants all competing for the very real inputs required to maintain a decent standard of living. Wake up, the depression was not the reset, the world wars were, so be very careful what you wish for.
Chris B, when and how did we implement Hayek’s ideals into the marketplace?
Chris
and what of the magic money that makes one group rich and leaves the others behind?
32 TRILLION DOLLARS of borrowed money spent by the government since 2009
6.7 Trillion of debt hidden on the Fed’s balance sheet, off the market
Hayek hit it right on the head when he said “When central planners decide, they benefit one group at the expense of another.” (paraphrase)
And the inflation and the drop in the purchasing power of the nation’s currency fluffed the assets of the group that “benefited”. Savers, workers, shelf fillers that didnt have the assets were harmed.
Hi Wolf,
Is the 10 year bumping against 5% because anything over that amount would cause the forward earnings yield of the sp500 to be even with the return amount? As an example, if we’re currently sitting at 19.1 PE ratio, then we’d think that our earnings yield would be 5.24%. If the 10 year can also return 5 and a quarter, then people would rotate into it, right?
Somewhat, yes, but you have to work in some sort of squishy risk premium in there too.
Secondly, you’re comparing a flat stream of future cash flows to a growing stream of future cash flows. The estimated rate of growth is in constant flux.
The net is the two numbers have a lot of stretchy-ness in terms of their relation to one another.
Agreed. The so-called “Fed model” in which you compare earnings yield (earnings to price ratio) with 10 year Treasury yield very vaguely works as a broad indicator, but it has many periods where it is off by quite a lot for quite a long time.
For example, since 1960 the difference between earnings yield and 10 year yield averages pretty close to 0, but has spent as much as 20 consecutive years around -2 percent, and as much as 10 years at +2 percent. It is currently at -2 percent, i.e. the 10 year yield is already 2 points higher than the earnings yield (calculated as a 7 year average).
Wolf
Do you have any thoughts on the spike in the Standing Repo Facility activity?
What spike? There was none. Essentially $0 balance.
However, there was a spike at this time last year, and I covered that extensively.
Wolf – tell your AI to crank out this week’s first story. 😊. We won’t let your secret out. It’s between us.
🤣
https://wolfstreet.com/2026/09/21/tech-science-social-media-jobs-in-san-francisco-silicon-valley-plunge-to-2019-level-ai-magic-money-boom-is-paper-thin/
5 pct rate moving into shorter durations?
How’s a guy going to refinance at cheap rates?
Maybe they failed to use a wooden stake (oops) on the bond market. Maybe it was plastic. I think the government is going to need a lot of garlic.
The AI bubble could keep inflating for many years. Sure it will burst some day like the the dot come bubble, but it could be 10 years before that happens. Are you willing to sit out another 400 percent growth of the Nasdaq 100 while betting that the burst is just around the corner?
Fomo makes for a great investment strategy/s.
Just don’t use leverage or short and you will be okay either way
The US is a deteriorating credit with massive deficits as far as the eye can see. Meanwhile, Congress lacks the courage to increase taxes (revenue) to force the uber wealthy and mega corps to pay their fair share. Worse yet, Trump appears hellbent on chasing away our allies and doing everything within his power to tank the economy. Rates are going higher along with inflation, the 10-year will be yielding in the 6s before next summer.
you’re living in a dust storm. What you fail to mention, Congress lacks the will to cut spending! The tired mantra of tax the rich, pay your fair share, you need to review the actual facts on who pays taxes to IRS. As for Trump, you need to ditch the hate, and review actual deals with countries that he has made. i.e., Panama, Denmark, Greenland, soon to be Canada, China.
Part of what holds the 10-year at 5% may be who’s buying there. Pensions and insurers matching long liabilities have funding ratios that look far better at these yields, and 5% is a natural level to lock in duration. That’s a buyer with a price target, not a view on inflation. One way to tell whether the line breaks: watch the 5-year, 5-year-forward breakeven. If the move so far is mostly real yields (the 10-year real is around 2.6%), those liability buyers can keep absorbing supply. If forward inflation expectations start climbing too, they lose their reason to step in, and the 2s and 3s would likely be proven right about where the 10-year ends up.