Germany, France, Italy, Spain, Netherlands, Poland, Belgium, Sweden, Ireland, Austria, Norway, Denmark, Romania, Czech Republic, Finland, Portugal, Slovakia, Hungary, Bulgaria.
By Wolf Richter for WOLF STREET.
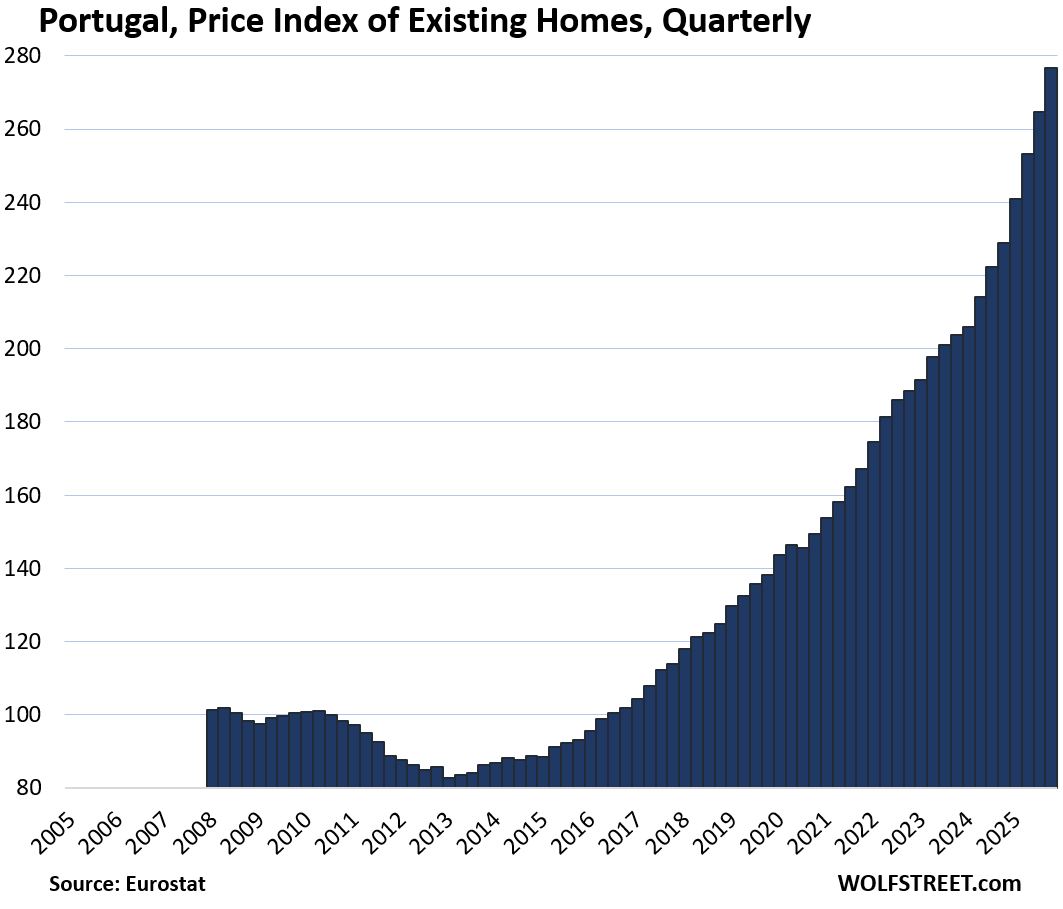
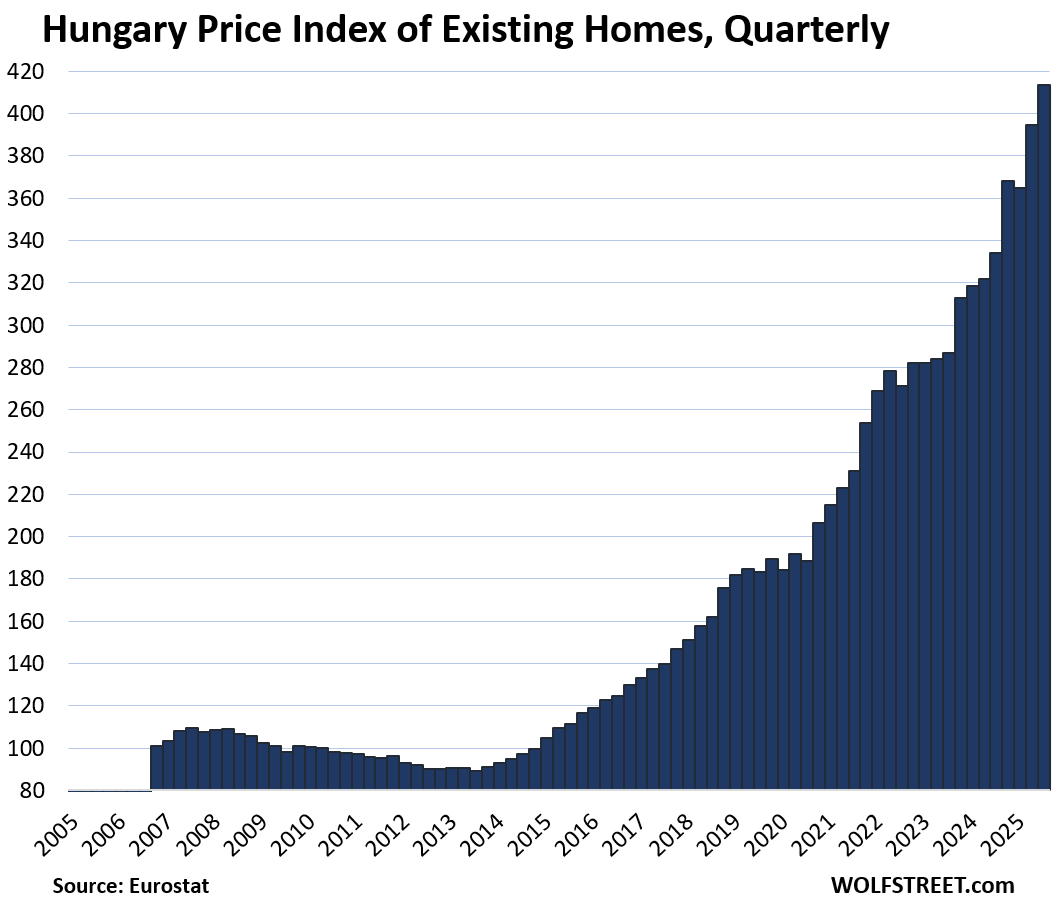
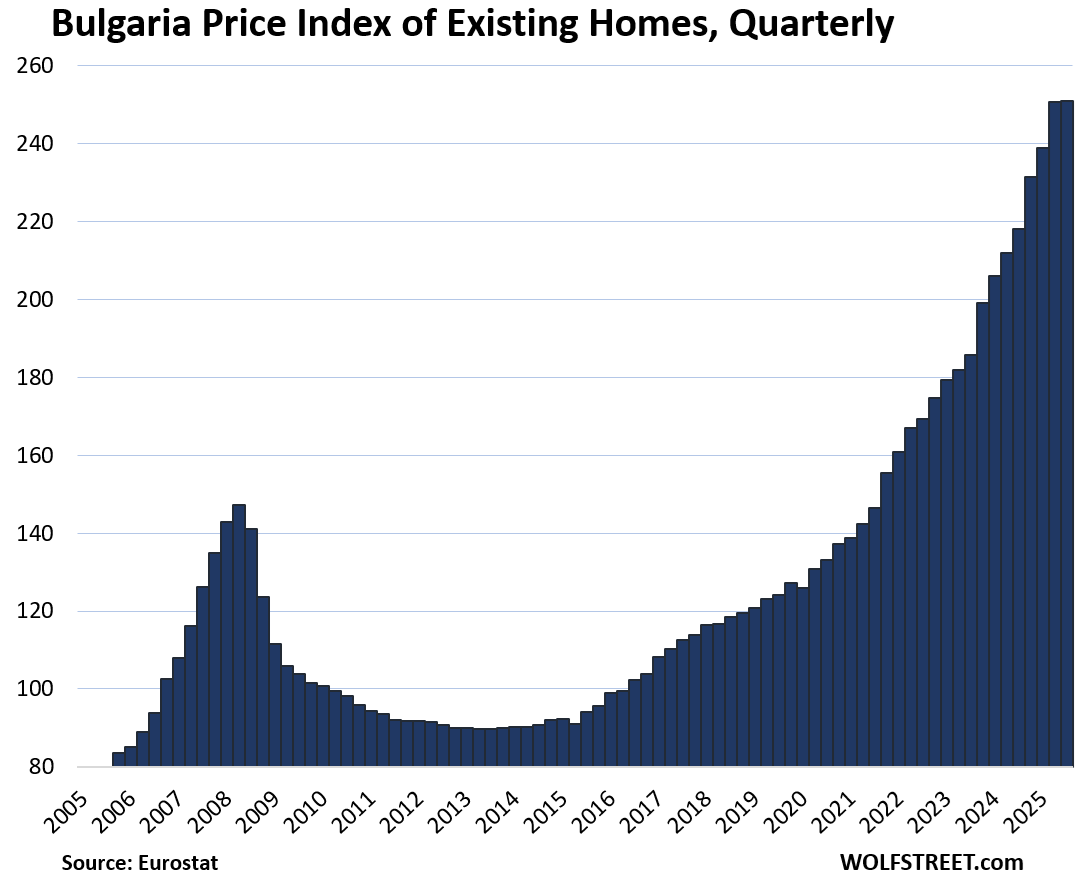
In some of the 19 largest countries by GDP in the European Union (EU) and in the European Economic Area (EEA), prices of existing homes of all types have skyrocketed to new highs, led by Hungry (+23.7% year-over-year), Portugal (+20.9% year-over-year), and Bulgaria (+15.0% year-over-year).
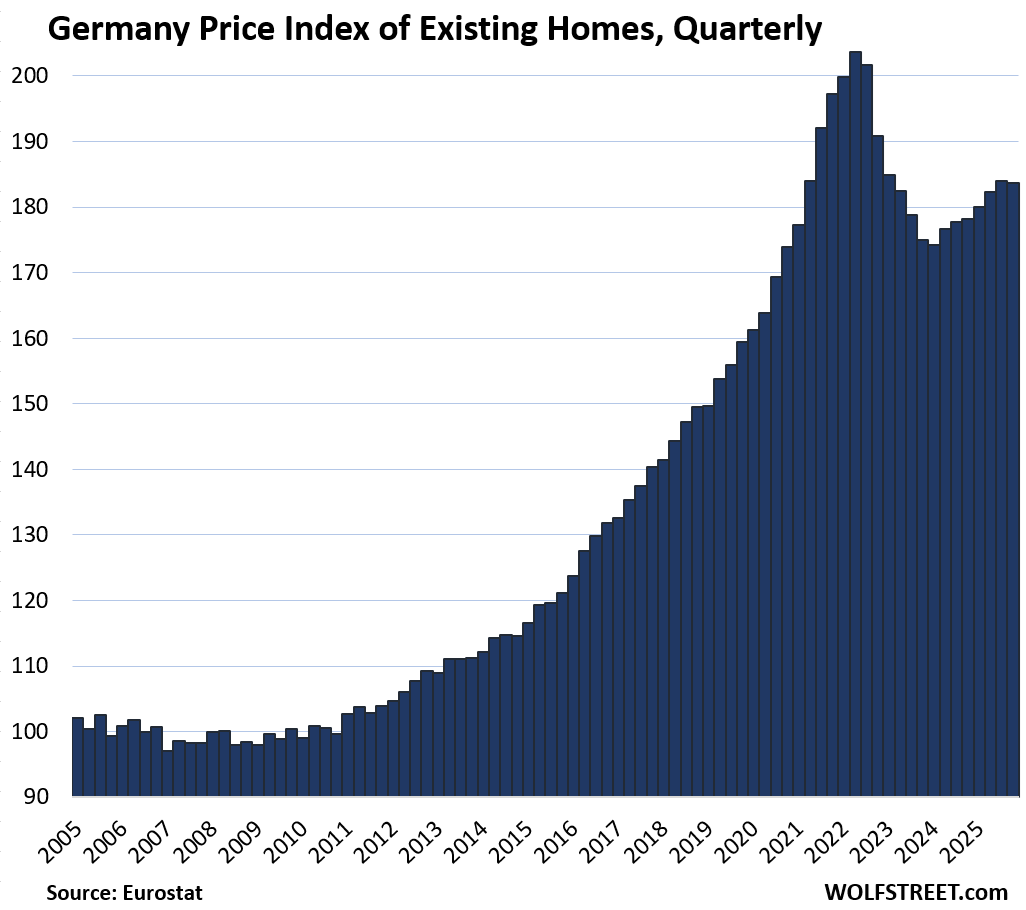
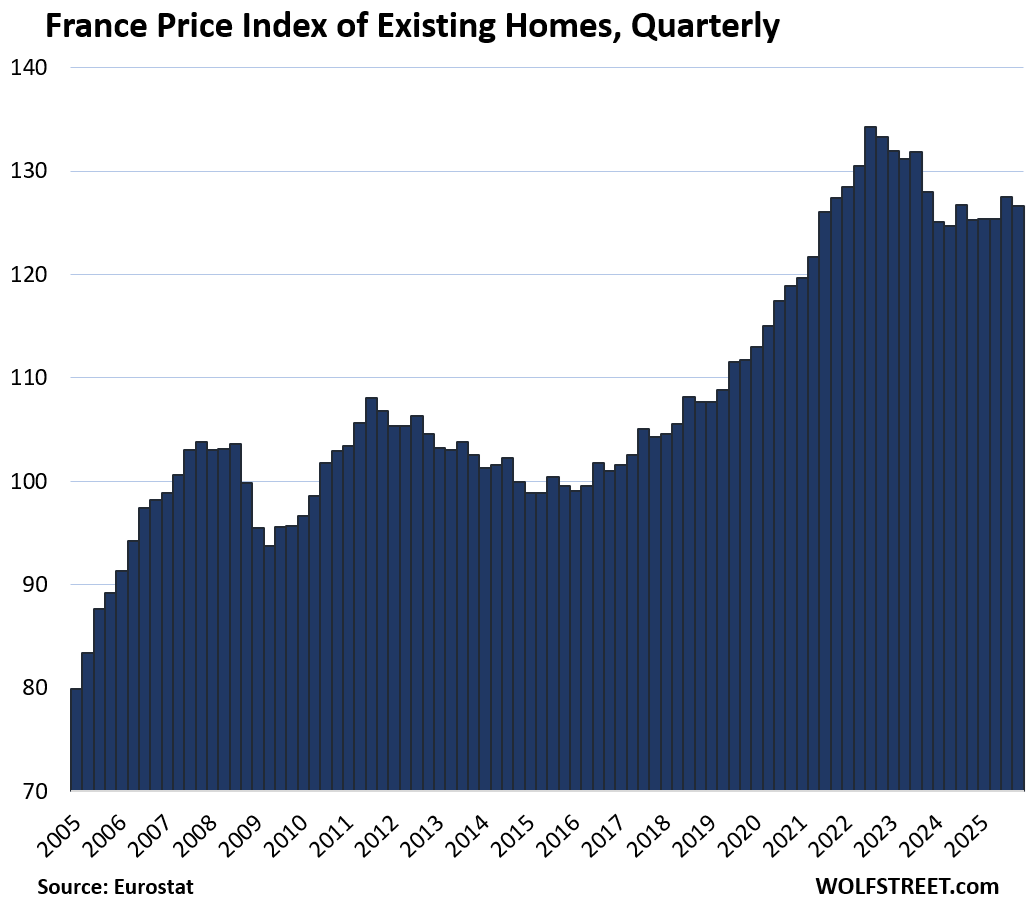
In other countries, prices of existing homes have wobbled along below their peaks in prior years, including Germany, France, and Austria.
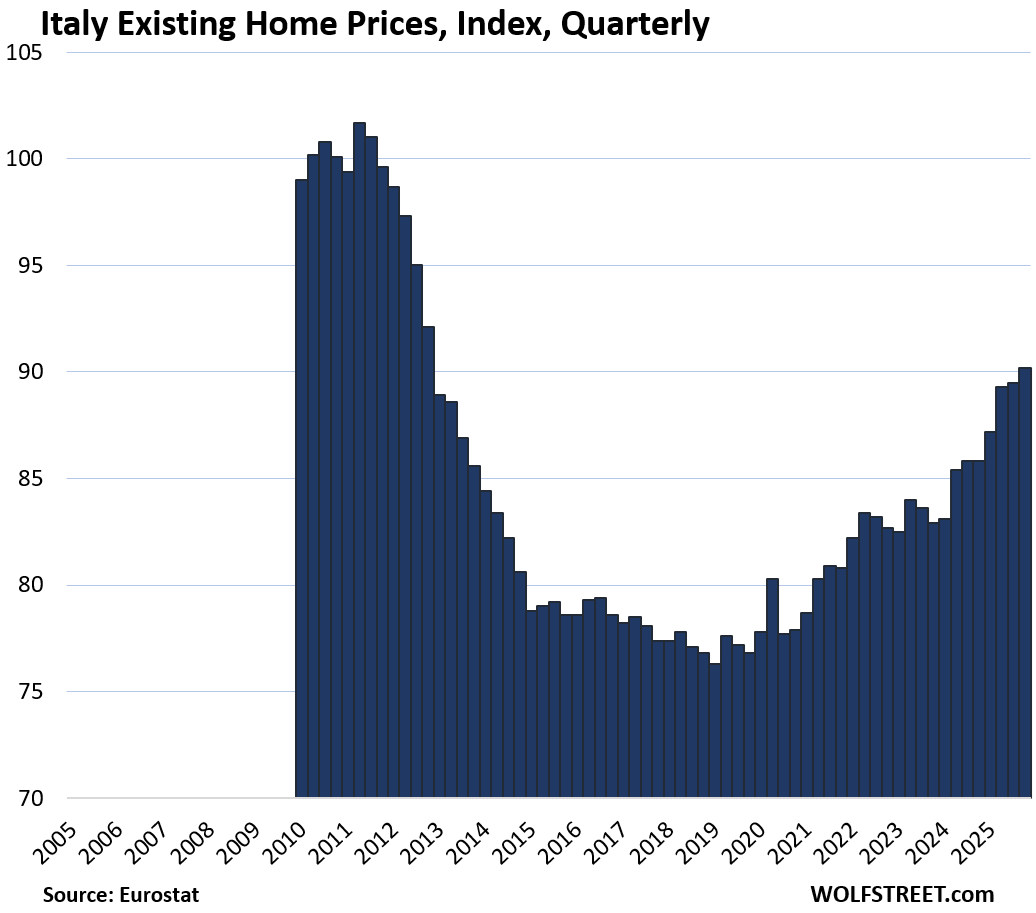
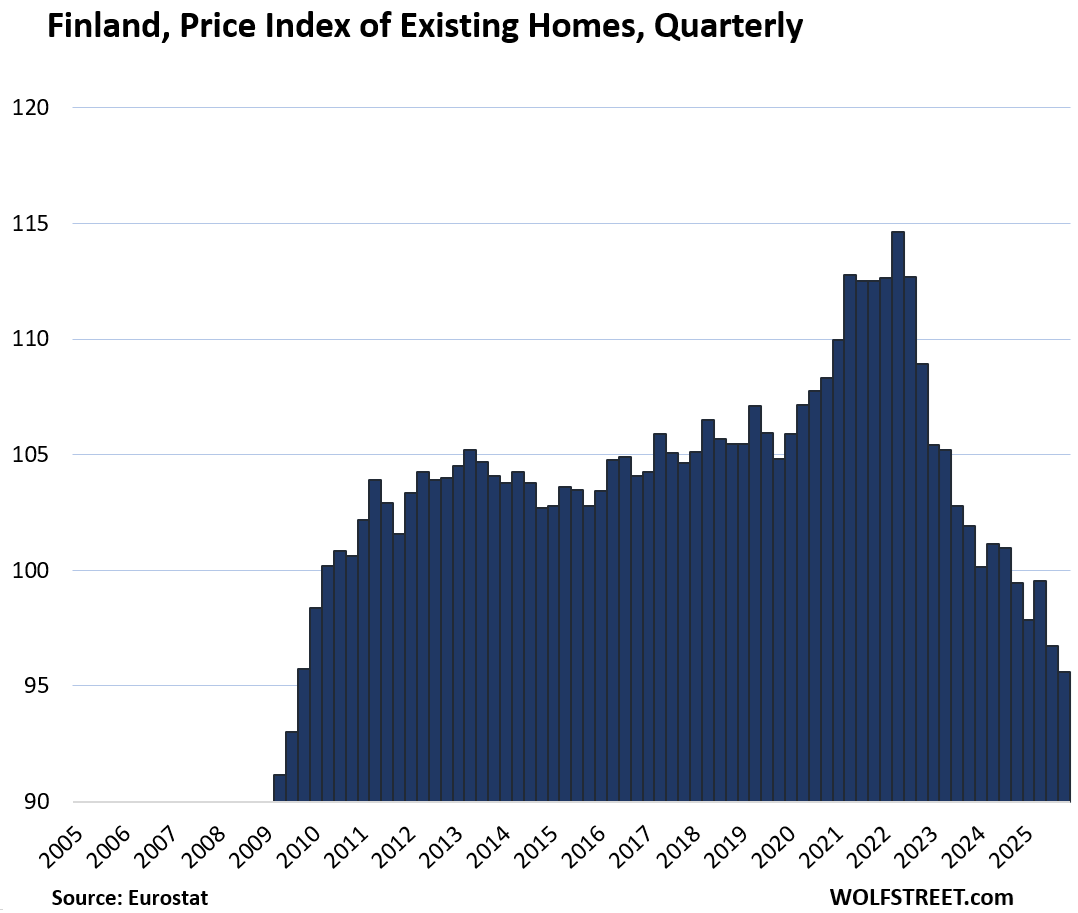
In Italy, prices of existing homes are still below where they’d been in 2011, the prior housing bubble that had imploded, despite substantial increases in recent years. And in Finland, prices have fallen by 16.6% from the peak in 2022 back to 2010 levels.
Here is our quarterly wild ride across these 19 housing markets in Europe, based on the new data from Eurostat through Q4 2025 for existing homes.
Countries where prices are below a peak in prior years (year of peak):
- Finland: -16.6% (Q2 2022), back to 2010 levels.
- Italy: -11.3% (Q2 2011)
- Germany: -9.8% (Q2 2022)
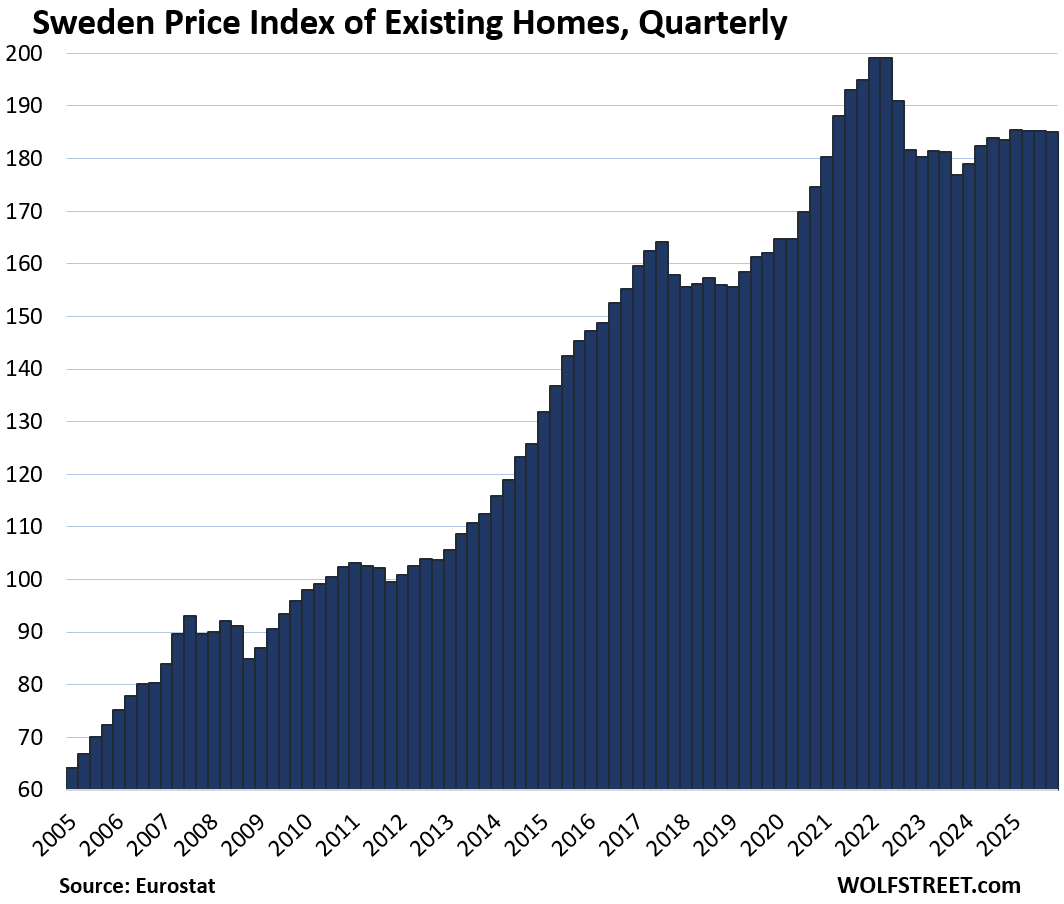
- Sweden: -7.1% (Q2 2022)
- France: -5.7% (Q3 2022)
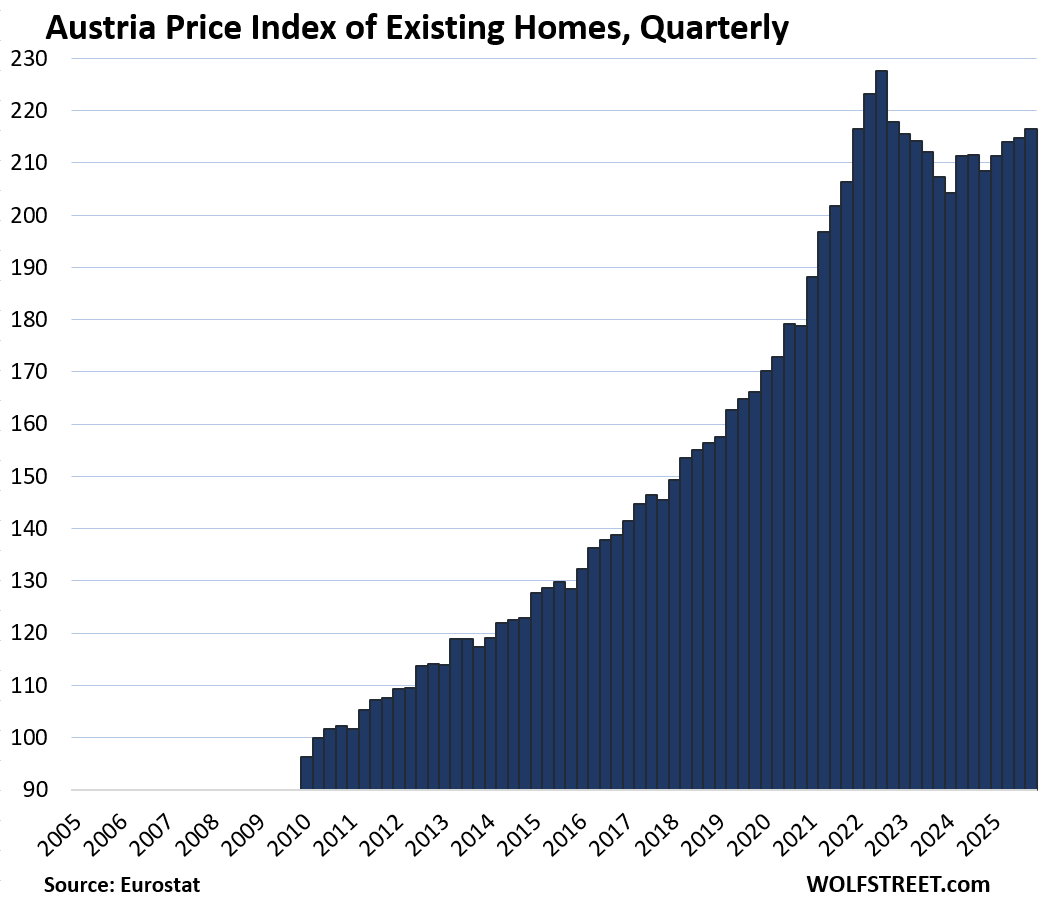
- Austria: -4.8% (Q3 2022)
Biggest price gains since 2010:
- Hungary: 308%
- Portugal: 175%
- Czech Republic: 165%
- Bulgaria: 147%
- Slovakia: 138%
- Austria: 125%
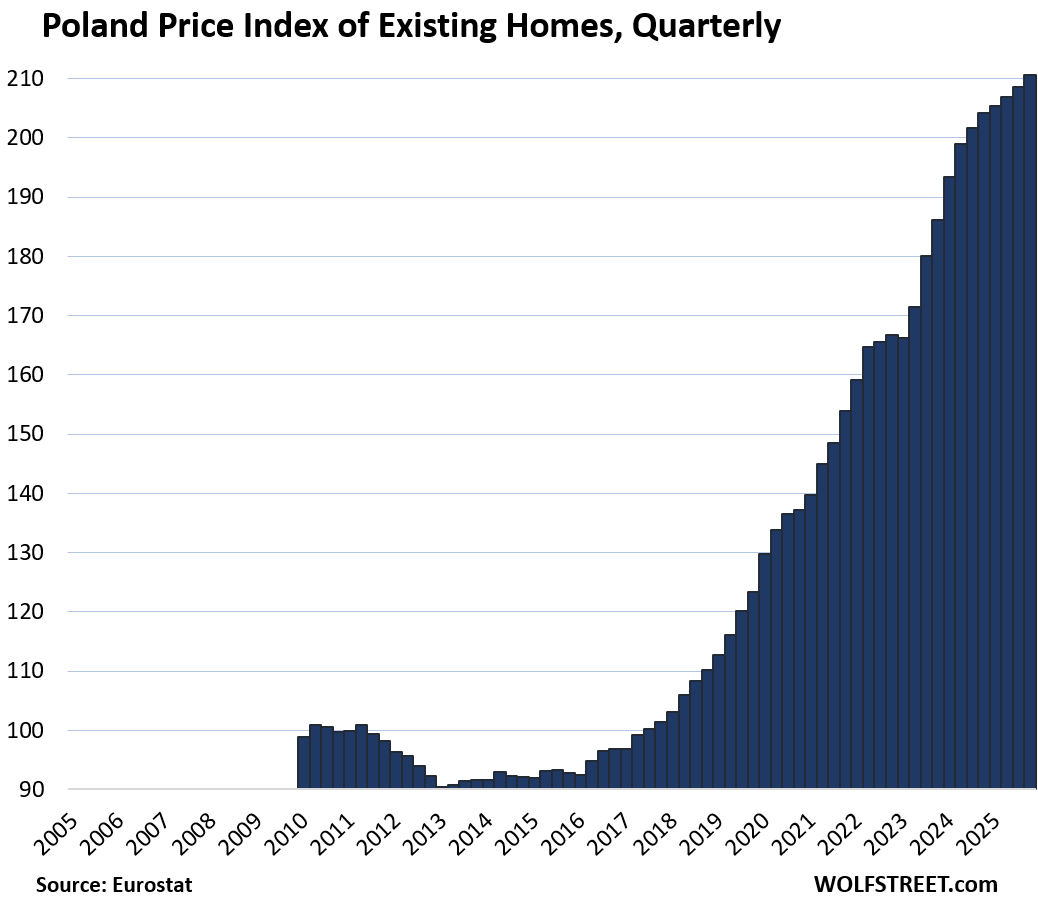
- Poland: 113%
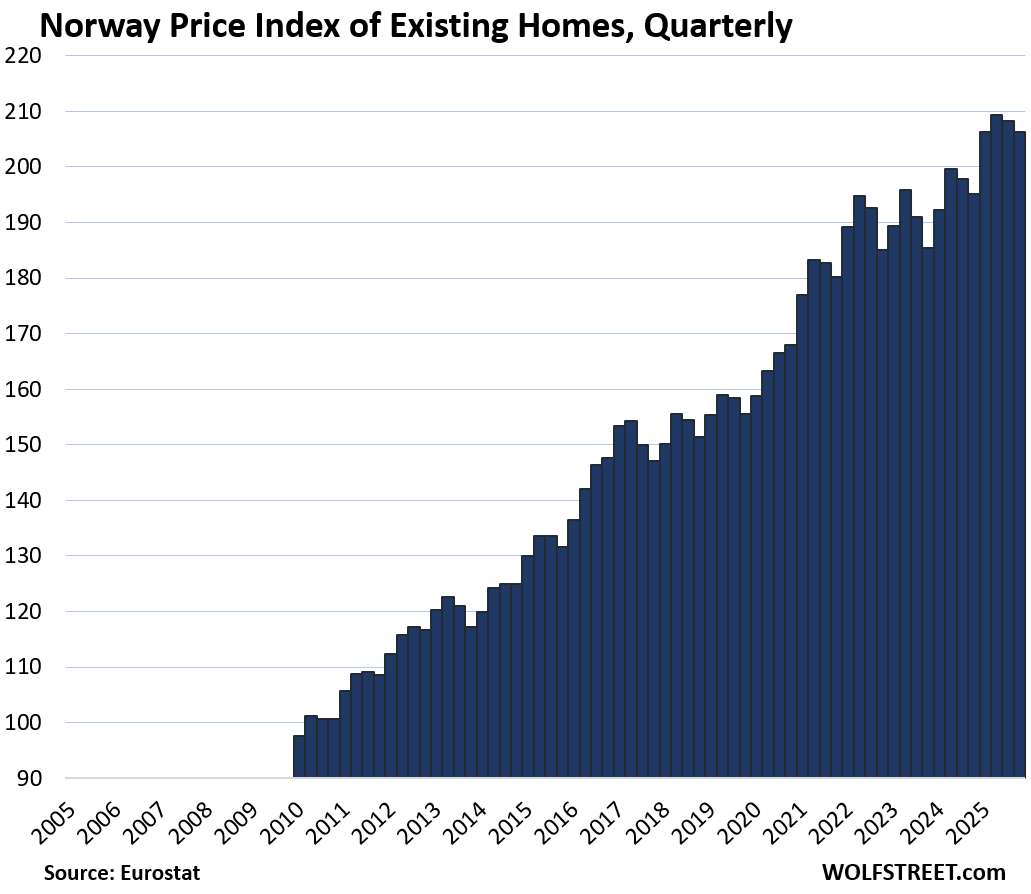
- Norway: 111%
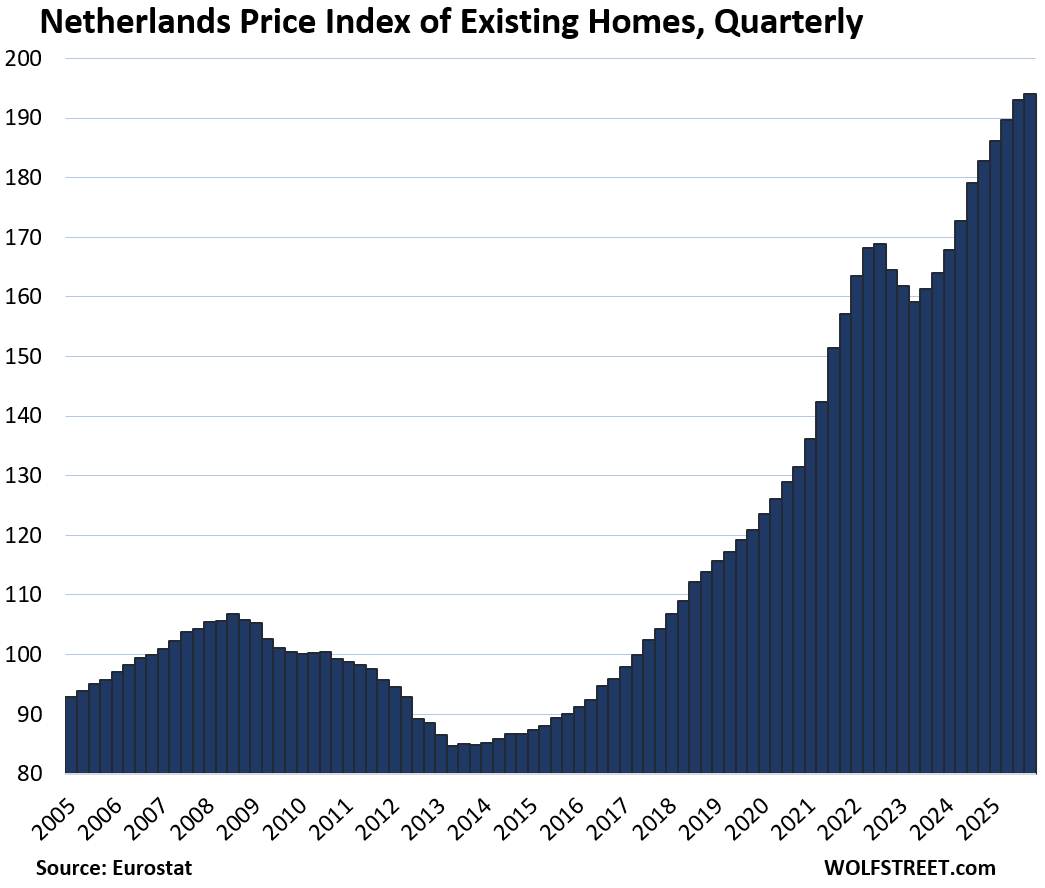
- Netherlands: 94%
- Sweden: 89%
- Ireland: 88%
- Germany: 85%
- Denmark: 75%.
Biggest year-over-year gains in Q4:
- Hungary: 23.7%
- Portugal: 20.9%
- Bulgaria: 15.0%
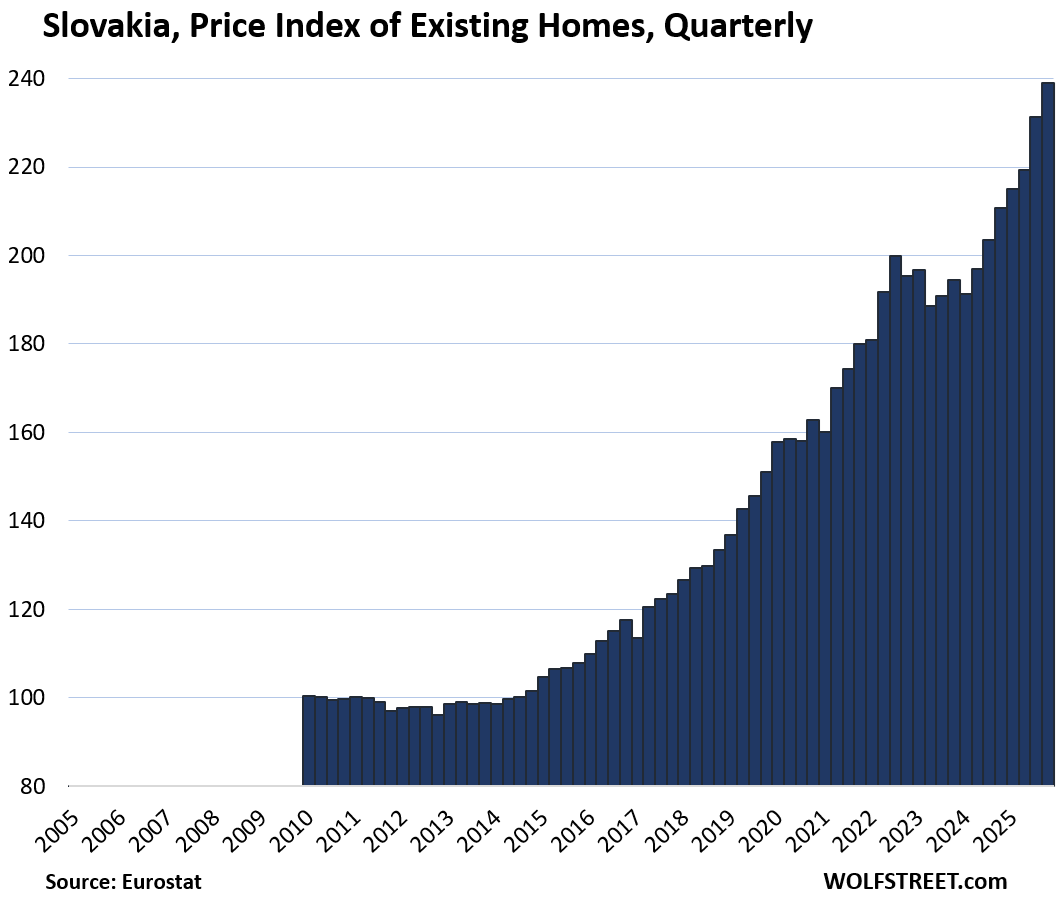
- Slovakia: +13.4%
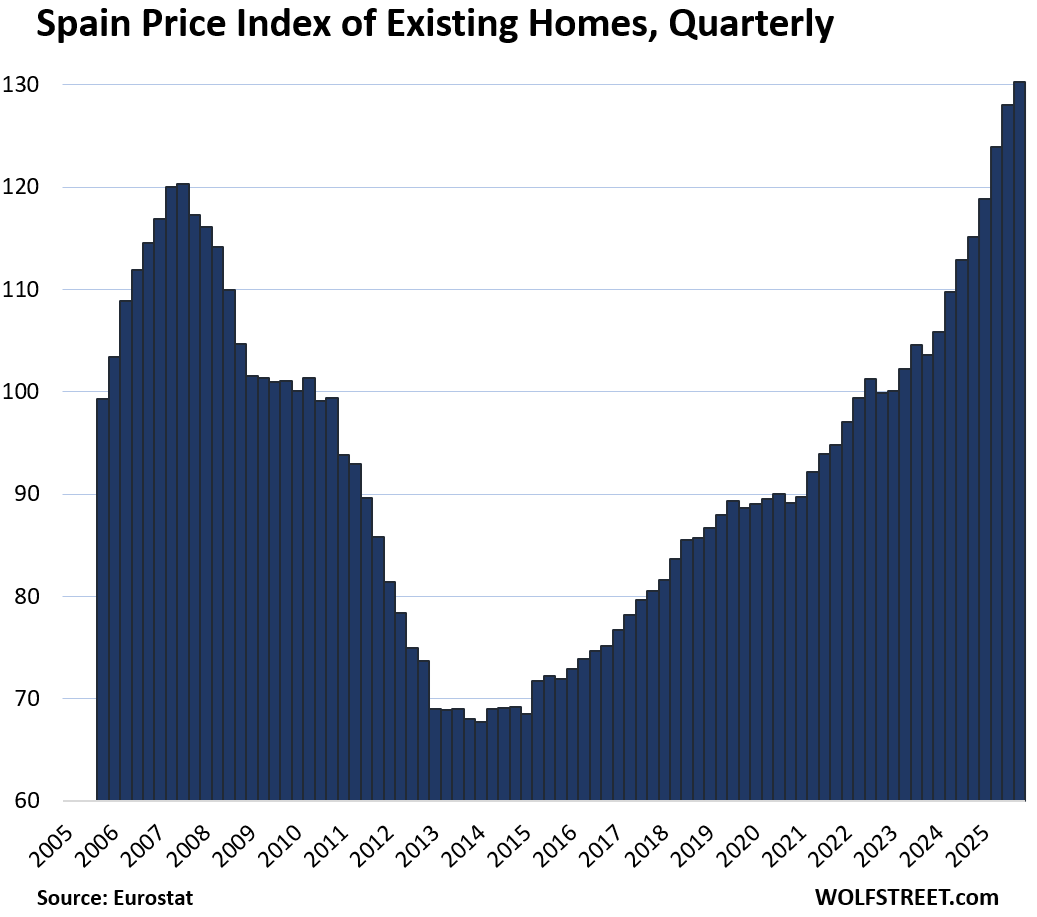
- Spain: 13.2%
- Czech Republic: 10.0%
- Denmark: 7.6%
- Ireland: 7.3%
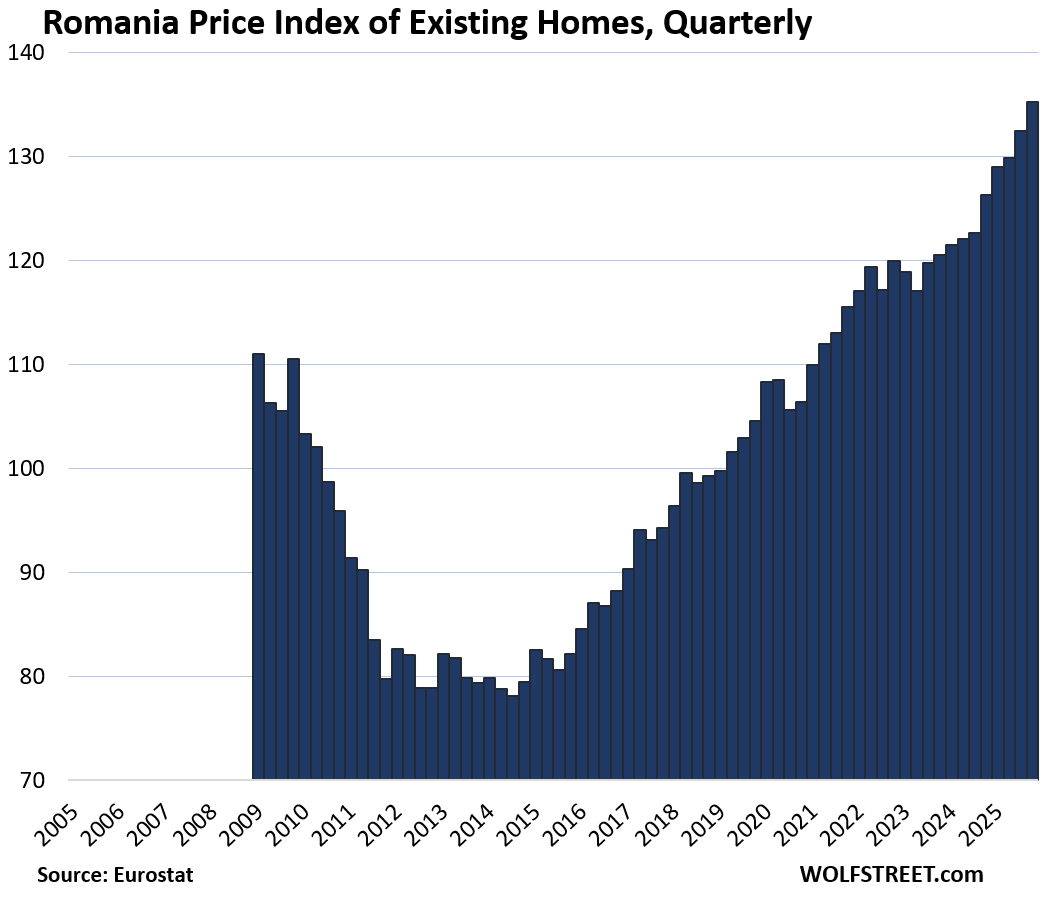
- Romania: 7.1%
- Netherlands: 6.2%
- Italy: 5.1%
Biggest quarter-over-quarter gains in Q4:
- Hungary: 4.8%
- Portugal: 4.6%
- Slovakia: 3.3%
- Czech Republic: 2.4%
- Romania: 2.1%
- Ireland: 2.0%
- Spain: 1.8%
- Denmark: 1.4%
- Poland: 1.0%
The 5 countries with quarter-over-quarter declines in Q4:
- Finland: -1.2%
- Norway: -0.9%
- France: -0.7%
- Germany: -0.2%
- Sweden: -0.1%
Home price indices for the 19 largest EU/EEA countries:
Eurostat’s data goes back to 2005 for some countries, but not as far for other countries; I put all of them on the same timeline going back to 2005 for easier comparison. Eurostat does not provide home price data for Greece, though in terms of GDP, Greece would fit into the line-up here.
The vertical axis shows index values (where the values for 2010 were set at 100), rather than prices in currency, so it’s not possible to compare the price levels across the markets.
The little tables show either three or four columns, from left to right: % change since 2010; quarter-over-quarter (QoQ) % change; year-over-year (YoY) % change; and % decline from the peak in prior years, for the six countries where that occurred. For five countries the prior peak was in 2022; for Italy, it was in 2011.
| Germany, Prices of Existing Homes | |||
| since 2010 | QoQ | YoY | From peak |
| 85% | -0.2% | 3.0% | -9.8% |
| France, Prices of Existing Homes | |||
| Since 2010 | QoQ | YoY | From peak |
| 31% | -0.7% | 1.1% | -5.7% |
| Italy, Prices of Existing Homes | |||
| Since 2010 | QoQ | YoY | From peak |
| -9% | 0.8% | 5.1% | -11.3% |
| Spain, Prices of Existing Homes | ||
| Since 2010 | QoQ | YoY |
| 30% | 1.8% | 13.2% |
| Netherlands, Prices of Existing Homes | ||
| Since 2010 | QoQ | YoY |
| 94% | 0.5% | 6.2% |
| Austria, Prices of Existing Homes | |||
| Since 2010 | QoQ | YoY | From peak |
| 125% | 0.8% | 3.8% | -4.8% |
| Poland, Prices of Existing Homes | ||
| Since 2010 | QoQ | YoY |
| 113% | 1.0% | 3.1% |
| Sweden, Prices of Existing Homes | |||
| Since 2010 | QoQ | YoY | From peak |
| 89% | -0.1% | 0.8% | -7.1% |
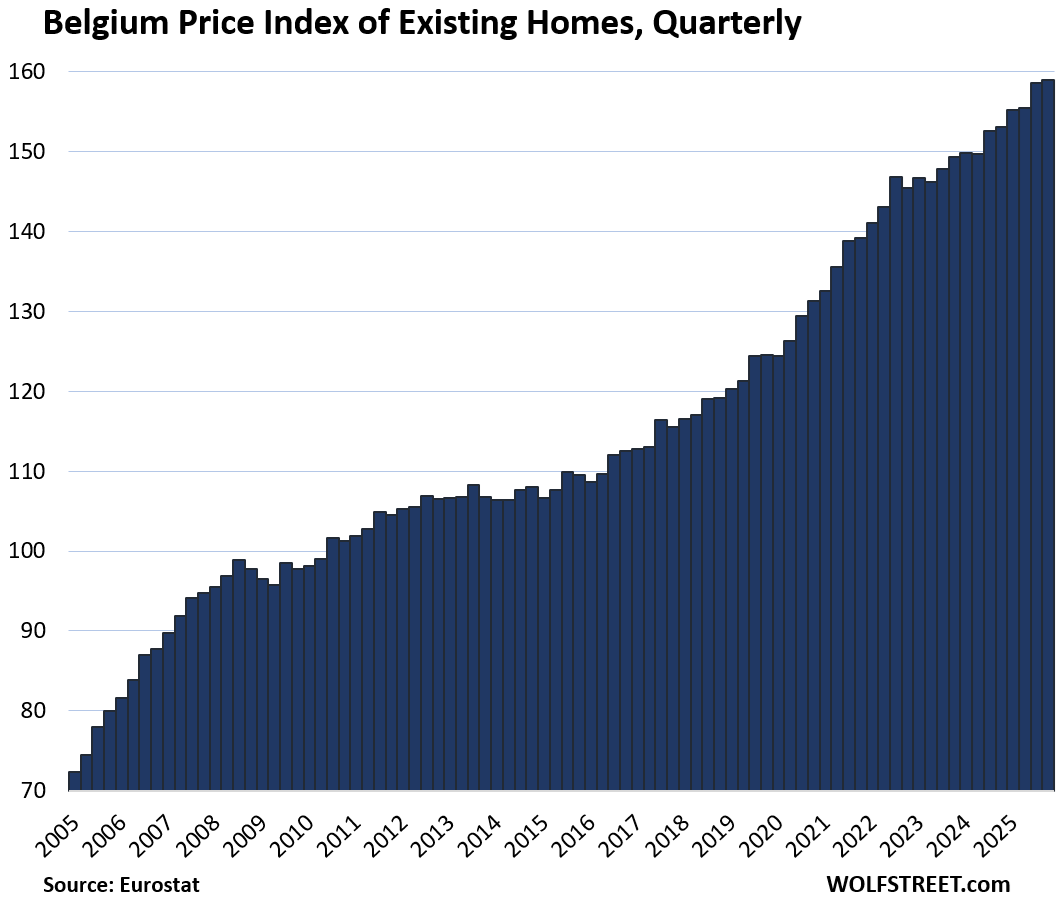
| Belgium, Prices of Existing Homes | ||
| Since 2010 | QoQ | YoY |
| 62% | 0.3% | 3.9% |
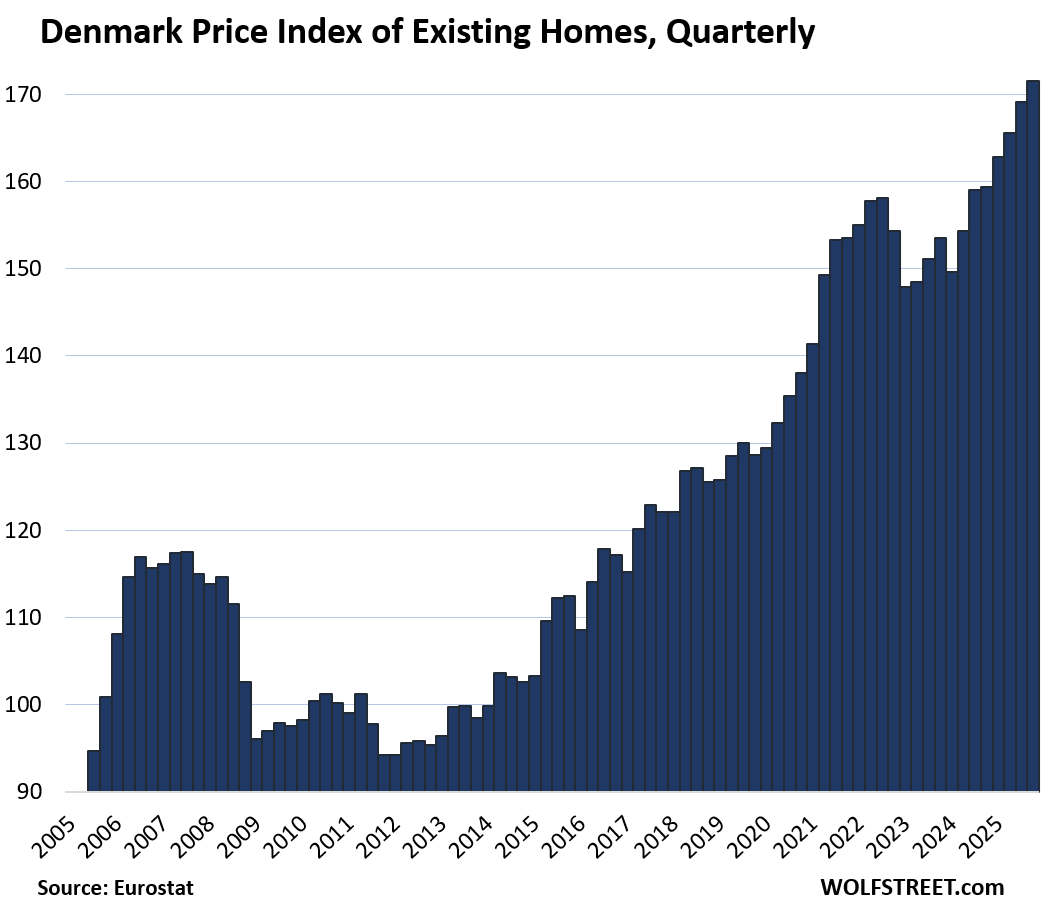
| Denmark, Prices of Existing Homes | ||
| Since 2010 | QoQ | YoY |
| 75% | 1.4% | 7.6% |
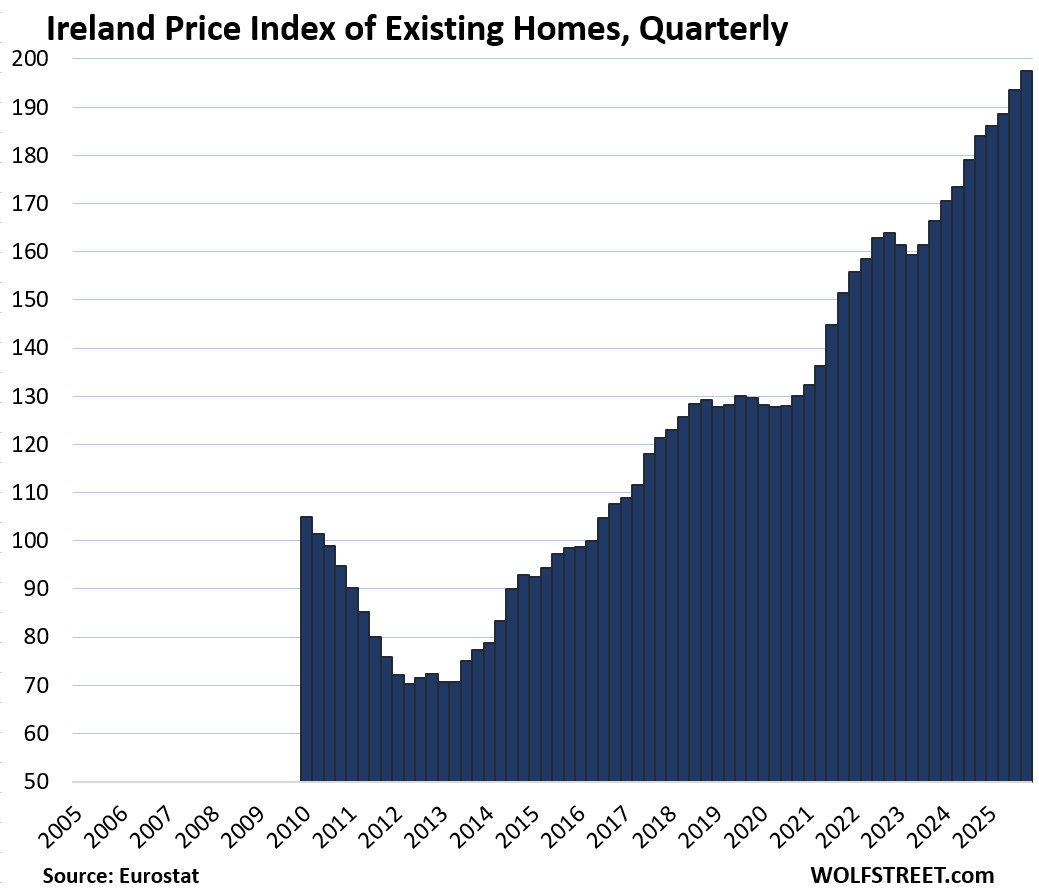
| Ireland, Prices of Existing Homes | ||
| Since 2010 | QoQ | YoY |
| 88% | 2.0% | 7.3% |
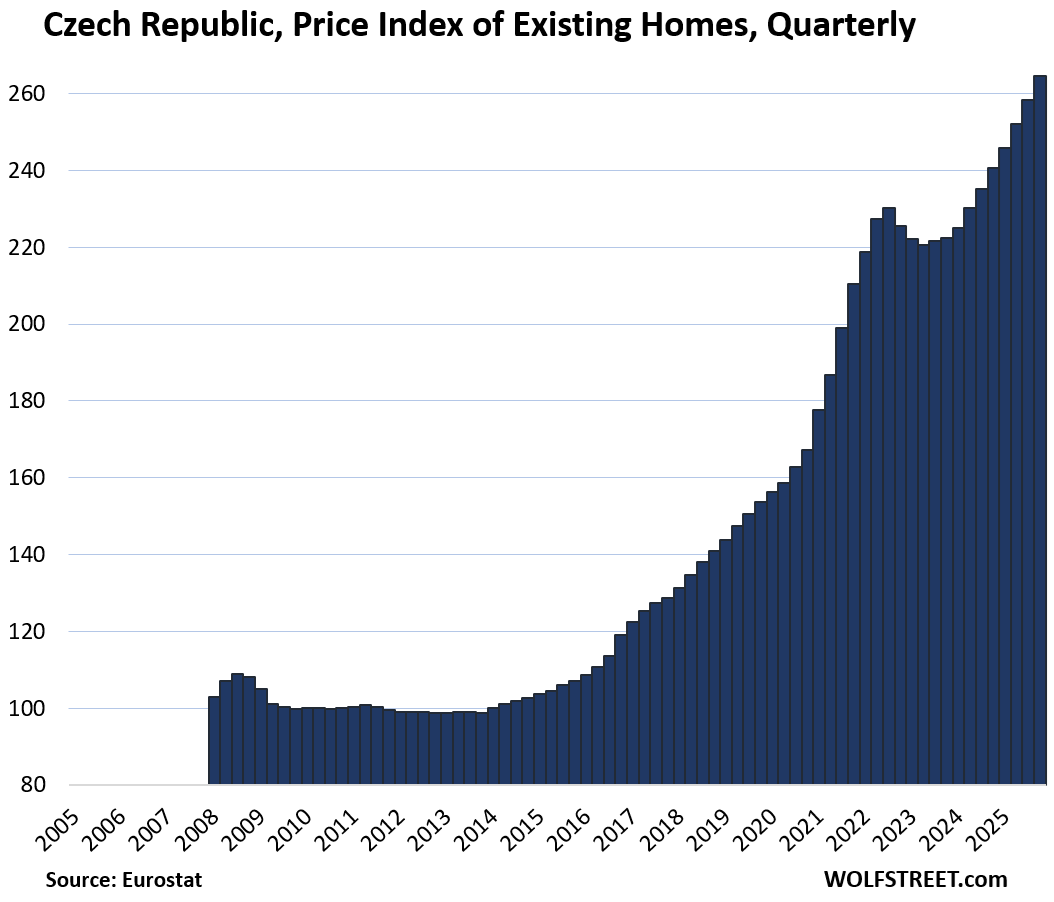
| Czech Republic, Prices of Existing Homes | ||
| Since 2010 | QoQ | YoY |
| 165% | 2.4% | 10.0% |
| Norway, Prices of Existing Homes | ||
| Since 2010 | QoQ | YoY |
| 111% | -0.9% | 5.7% |
| Finland, Prices of Existing Homes | |||
| Since 2010 | QoQ | YoY | From peak |
| -3% | -1.2% | -3.9% | -16.6% |
| Romania, Prices of Existing Homes | ||
| Since 2010 | QoQ | YoY |
| 31% | 2.1% | 7.1% |
| Portugal, Prices of Existing Homes | ||
| Since 2010 | QoQ | YoY |
| 175% | 4.6% | 20.9% |
| Hungary, Prices of Existing Homes | ||
| Since 2010 | QoQ | YoY |
| 308% | 4.8% | 23.7% |
| Slovakia, Prices of Existing Homes | ||
| Since 2010 | QoQ | YoY |
| 138% | 3.3% | 13.4% |
| Bulgaria, Prices of Existing Homes | ||
| Since 2010 | QoQ | YoY |
| 147% | 0.1% | 15.0% |
Enjoy reading WOLF STREET and want to support it? You can donate. I appreciate it immensely. Click on the mug to find out how:

![]()
What happened in Finland?
Rap music.
No wonder the Finnish youth rank happiest on earth. Affordable housing !
War in Ukraine happened. And Finland is probably next. Not the first time.
In Finland, ~93% of mortgages are variable-rate loans.
From the BoF:
“In Finland, a new housing loan usually has a maturity of 25 years and an interest rate and monthly loan-servicing costs that change once a year according to the 12-month Euribor.”
As a result, ECB rate increases post Covid have been felt by the majority of the market relatively quickly and have put significant downward pressure on property values.
Stephen Elop happened. Then a post-Nokia decade of hangover.
Oh, recently? Variable rate loans combined with an austerity government.
Would I be safe in assuming the
countries highest price increases
have a younger population ?
Not sure about that. But most of them had much lower home prices 10 or 20 years ago than countries like Germany and other expensive places. So lots of people from those expensive countries, plus lots of Americans and Brits and others, went shopping there for second homes or to retire or as rental property or whatever. Some of the cities in those formerly cheaper countries are wonderful… such as Prague and Lisbon. They were relatively cheap back then, and now they’re a lot more expensive. Portugal is a big favorite for Americans and Brits. Eastern Europe has long been a favorite for Germans. Prague attracts buyers from everywhere. A flood of conversions to vacation rentals have turned into another big factor in the price spike. In all of those cities with ballooning home prices, homes have become unaffordable for local salaries – which is a huge problem.
conversations to vacation rentals
autocorrect fail
This is very much the situation in Poland (my old home country), the main cities attract a lot of central EU and some western capital, some of it is just ex immigrants returning but regardless it’s money from outside economies. This is leaving a lot of locals shut out of those markets. The interesting thing is that still today if you draw circles around those cities as you approach outer city limits you start to get pricing that’s more attainable for people who work locally (there’s a significant group of traveling workers, they’ll spend a few weeks abroad and come home for a couple or so, some of my friends do this). So the price difference between old square and outer limits is massive, then as you move into the smaller cities and countryside etc. you start to get very affordable pricing.
Anyway, this is very cool analysis, I enjoyed this article a lot!
Just window shopping around, I can see that Europeans really hate living in small towns or rural areas. There is a huge price difference, perhaps reflecting the high cost of car commuting. Yet I wonder if the small town life might be great for retirees, assuming they can get to doctor appointments and buy groceries.
In the US it’s the opposite. Everyone wants to bulldoze a little piece of forest 50 miles from a city and build their ugly snout house there and commute an hour to and from work each day for the rest of their lives. Don’t ask me to make sense of it. I only live here!
Chris B, I don’t believe this is true. People prefer cities and inner-ring suburbs.
If people are buying houses 50 miles out, it’s because that’s what they can afford
I’m 35 miles out and I wouldn’t move in closer at any price.
To Chris,
In Europe it’s more common to use bicycle or walk. So ideally everything (grocery, school, kindergarten, park, playgrounds) should be in 15 minutes walk distance.
Spending 2 hours each day in traffic to get kids to school is a nightmare
Thanks, lots of moving parts !
Hungarian here: I don’t think that’s a huge factor in our country. The proportion of young people in our population has been falling, and many of them left the country during this time. The government did introduce massive mortgage programs to help families who want to have kids to offset this, but that wasn’t the main driver behind the exceptional price growth.
The main factors were a huge influx of real estate investor money (Airbnb, the Hungarian ‘new aristocracy,’ and Russian and Chinese buyers laundering their money here) and the fact that we started from a very low base. The 2008 crash hit Hungary extremely hard, especially in the real estate market. Since then, Hungarian real estate went from being very affordable to absolutely unaffordable on a Hungarian salary.
Just here for the rage and fed stroking. Thank you. Houses are good but what about beds.
Hmmmmmm…..,housing back to 2011 levels or so….,suddenly I am not on buyers strike!
It would be useful to see a chart of the most recent home prices by country (in euros or dollars) so I can compare them to what are found in the U.S.
Sure, as I pointed out in the article, but Eurostat doesn’t provide price data in currency.
“The vertical axis shows index values (where the values for 2010 were set at 100), rather than prices in currency, so it’s not possible to compare the price levels across the markets.”
I’m going to be “that guy”…. I know Italian real estate really well, and do not trust this data. OR, maybe it’s a super broad average that is dragged down by the growing number of infamous EUR1 homes getting counted in small villages that have been emptying out.
I can assure you that properties anywhere in any city you have heard of (and many towns you haven’t) are *well* above 2011 highs. Even Napoli and Palermo, places way off the expat map and historically stale, have risen bigly.
It’s hard to understand, because incomes haven’t risen much, and so homes are no more affordable there for the younger masses than in the US, probably worse.
1. These are “existing homes.” single-family and condos combined. Not newbuilds, which are much higher. Properties in the core of a city are higher, further out much lower. You’re not checking further out because you don’t want to live there.
2. Italy (along with Spain) had a HUGE gigantic property bubble up to the euro debt crisis, which imploded. Prices were ridiculously inflated, after 10 years of the euro run-up. you might have missed that. But that’s the base for the comparison.
I was there for the 2011 bubble. The most obvious was the influx of Russian and UK money in particular into super-prime property pushing up prices. Tuscan countryside, surrounding Florence, was all inflated. After a dip around ’14-’19, “prime” everywhere is now well above 2011.
I do look at areas further out and in what Americans would consider remote areas (e.g., inland Puglia). They’re are all way up (in Euros). My guess, from above, is that there are lots of derelict/empty homes getting counted in today’s stats, that weren’t counted before, and are pulling the average down.
I’m sure you are right about the averages sweeping in a bunch of rural/semi-abandoned areas getting swept into the averages (I think I’ve seen *multiple* *movies* about restoring run down Italian properties in rural settings – I think of it as “Eat Pray Porn”.
But, that said, Italy is working against pretty strong demographic age decline among the native populace and the (not unrelated) long building fiscal basket case that is Italian government (not Japan level out of whack…but bad and without the preceding boom decades that Japan saw).
So, there are definite macro factors working against Italian homebuying. And Wolf is definitely right in terms of the decline being measured against the Sunny-Europe implosions of 2009-2011.
Cas127, for sure the demographic problem is real, though it may be offset by foreign buyers.
Hungary is interesting. Politically opposed to the EU ‘open-door’immigration policies yet sees massive prices rises.
Is EU wealth fleeing to Hungary as a consequence?
LOL no. Years ago, Hungary was one of the cheapest countries in terms of housing, and people from expensive countries started to buy second homes, rental properties, vacation rentals, etc. as an investment. Budapest is a huge tourist magnet, beautiful city, and converting condos into vacation rentals has gotten to be such a big thing that the government is trying to limit it, including banning it in some parts, because it has taken a lot of housing stock off the market and driven up prices for locals.
Where does Eurostat get the Hungarian data from the Orban government?
Hungary is a dog shit country with a dog shit government, And it has the dog shittiest housing prices, still
So before we give any credit to a country for its appreciation rate, let’s look at the levels. These are 2026 average housing prices.
2026 National Average Property Prices (€/m²)
Germany: €4,680 (Sources: Immowelt, Statista, Julius Baer)
France: €3,005 (Sources: Meilleurs Agents, SeLoger, Deloitte Property Index)
Portugal: €2,050 (Sources: Idealista, Confidencial Imobiliário)
Hungary: €1,160 (Sources: ingatlan.com, Investropa, Otthon Centrum)
Same difference between San Francisco and Tulsa. But for Tulsans, it doesn’t matter how expensive homes are in San Francisco. What matters to them is that home prices in Tulsa doubled in the span of a few years.
Wolf,
Is the data collected as same house sales , à la Case-Schiller or aggregated?
The Case-Shiller is terrible. It uses algos to make home price changes out of sales pairs where the prior sale was many years earlier, and it uses algos to come up with values for home improvements, etc. It’s full of algos. That’s one of the reasons why I stopped using it. It was better than median price when it was invented decades ago, and it’s still better than median price, but median price sucks completely. And it only covers 20 cities, so it has a “20-city” index, but no actual national index. What it calls the “national” index is a mixture of the 20-city index and the FHFA House Price Index, which is heavily skewed and useless because it’s only based on prices in government-backed mortgages, not cash deals, and not mortgages that are not backed by the government, such a jumbo mortgages.
Now imagine the difficulty of measuring this in many of these Euro countries where the data are scattered and messy!
you have the same issue in the US. Very messy housing data.
And to think real estate data access has been continually improving for 25 years.
Just imagine what a god-awful, opacity-breeds-abuse hellscape the SFH real estate markets were pre-2000.
And, yet.
Despite the rapidly improving data/data access, all it took was for ZIRP to turn that data into additional raw fuel for rampant SFH speculation and pricing volatility despite more info being more widely available than ever before.
That said, people have been using better data to get wiser – but very slowly.
Thanks for showing charts of other countries housing prices. It gives a good comparison.
What is interesting is if you go look at data that shows the ratio of family median income it takes to buy the median priced home, the U.S. is still one of the cheapest. Out of top 90 countries there are only 3 or 4 that are cheaper then the U.S. when it comes to income to house price ratio and the percentage of mortgage payment as a percentage of income.
I find the information at the worldpopulationreview site and then look for Affordable Housing per Country.
That’s obviously a goofball measure. For example, the site says that the US housing price to income ratio = 3.3. SO median household income in the US = $83,730 (Census Bureau); and the median price of an existing home = $398,000. The ratio of is therefore 4.8 not 3.3. But whatever.
I don’t trust Eurostat because, for example, it calculates unemployment in Bulgaria based on surveys and polls, while the Bulgarian labor office is based on real data from unemployment claims. And guess what, according to Eurostat, unemployment in Bulgaria is 3+ percent, while according to the Bulgarian labor office it is 5+ percent
That’s a BS comment because unemployment offices measure unemployment insurance claims as percent of those eligible for unemployment insurance. But not everyone who works qualifies for unemployment insurance. This is exactly the same in the US. You cannot compute a valid overall unemployment rate from people who already receive unemployment insurance or claim unemployment insurance benefits.
But do you think Eurostat can calculate an accurate unemployment result through surveys and polls?
Eurostat uses the “harmonised” data that the country’s statistics office sends to Eurostat. “Harmonised” means that all countries calculate the data by the same rules. Eurostat didn’t make up these figures; they were produced by Bulgaria’s statistics office.
That is the same with ALL data Eurostat publishes.
it is about already APPROVED REQUESTS for aid.
Good to know that when the bubbles pop, “we’re all in this together.” China, Europe, USA, Oceania. Getting my popcorn ready — just hope it’s not the nukes popping it.
Tissue fire inflation via the most monumental bailout money printing in human history from 2010-2022.
Now European banks are teetering on the precipice of collapsing dog doo-doo loans going sour, which affects their ability to keep the housing and commercial property flaming baton balancing on the nose of the dancing seal standing on a razor blade whilst bouncing on a pogo stick, trying to ascend a ladder swaying in the wind on a hydrogen filled balloon.
Let’s talk about European housing prices in say about 2031-2032. Let’s check back in then and compare to 2010. This rise in particular for some Western European markets is simply not sustainable by underlying economic strength. As to to Bulgaria… For goodness sake. When your average cost of housing is coming up from about the price of a used SUV you buy in Dallas and your average household income is a fraction of even say Russia for example, of course then you will have what appears to be substantial rise. This is due to improving economic conditions in the major cities there in Bulgaria.
We have a maintenance facility serving aviation under development there in Sofia and see it first hand. Just for context…
The majority of Europe’s economy is in crushing stagflation right now and very near the cliff edge to accelerating deflation. Just give it about another 12 months and you will see those effects in the headlines. Right now, it’s just swimming under the surface like a shark about to break the dorsal fin by your rubber raft.
Prices in Sofia are already like those in the vicinity of Paris, Berlin, in cities like Montreal, Ottawa and many others. Salaries in Sofia are many times lower than those in the armed cities. Bulgaria’s economy and GDP are supported by loans. Although the debt to GDP ratio is still low but Bulgaria’s debt is growing at the fastest pace in the EU. The first quarter of 2026 the deficit is already unprecedented. They accepted us into the EU with tricks, a deficit and inflation above the permissible. If you think that 200-300 thousand euros is little money for housing in Bulgaria I will tell you that a house 50 km from Paris costs that much. The average price of an apartment in Montreal is 265,000 euros, as well as in Ottawa and a little less in Calgary. Check out what the GDP is in these cities and countries as well as their average salaries.
And keep in mind that housing in the United States is cheaper than in Canada, where prices in some cities are like those in Sofia.