It will further fuel the acceleration of the Fed-favored PCE Price Index.
By Wolf Richter for WOLF STREET.
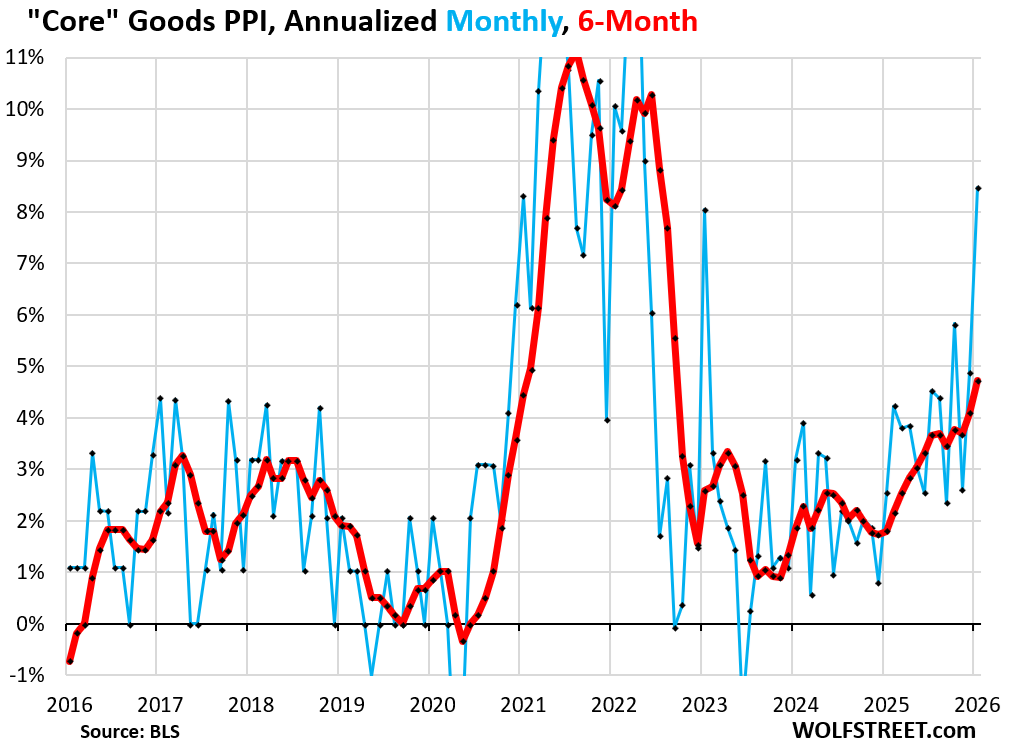
The Producer Price Index (PPI) for services spiked by 0.81% (+10.2% annualized) in January from December, seasonally adjusted, the second spike in a row. The PPI for “core” goods, which excludes food and energy products, spiked by 0.68% (+8.5%), the most since 2022. PPI does not track import prices and tariffs; it tracks prices that companies charge each other. So it tracks how companies are shuffling the costs of the tariffs around amongst each other. But the PPI for finished core goods rose by a more modest but still high 0.42% (+5.2% annualized), suggesting that there is resistance to price increases among consumer-facing companies as they’ve had a hard time passing on price increases to consumers without losing sales.
The worst inflation impulses were in services in January, and the services PPI weighs 68% of the overall PPI. It moves the needle.
The PPI for Final Demand Services spiked by 0.81% (+10.2% annualized) in January from December after the 0.67% spike in December, seasonally adjusted, according to data from the Bureau of Labor Statistics today (blue in the chart). The 6-month average rose by 4.1% annualized, a hair less than in December, which had been the worst since February 2025 (red).
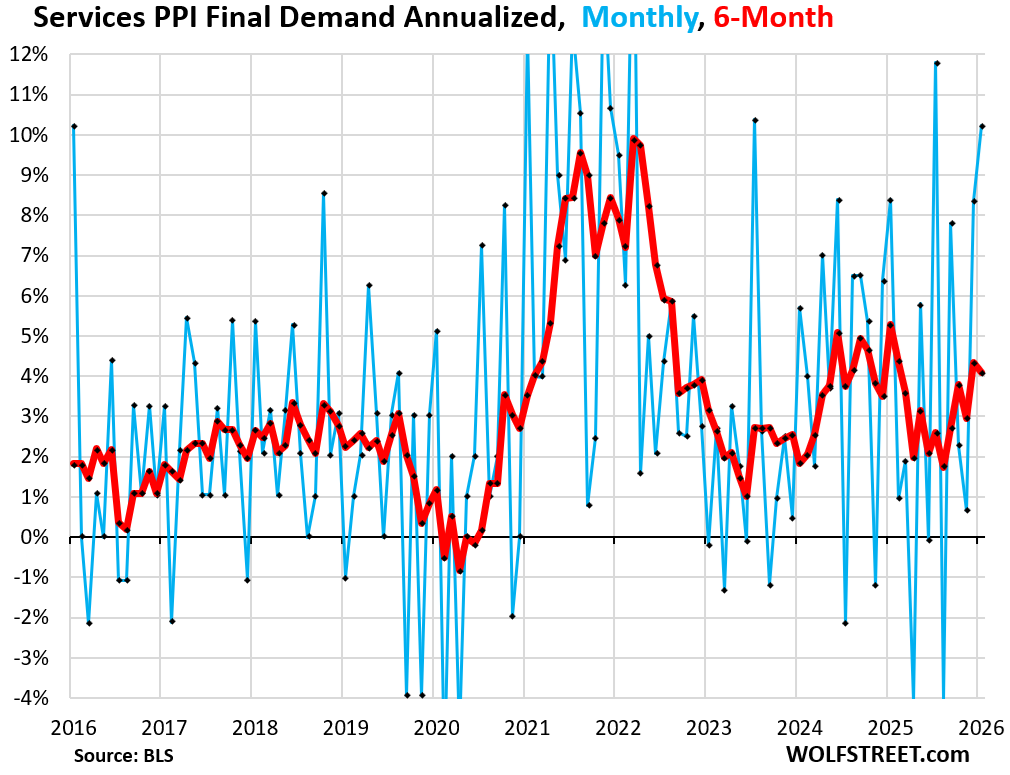
Within the services PPI, two of the three major categories moved up sharply:
- Trade services PPI (weighs 19% in overall PPI): +2.5% month-to-month not annualized, driven by professional & commercial equipment wholesaling: +14.4%.
- Transportation & warehousing services PPI (weighs 4.9% in overall PPI): +1.0% month-to-month not annualized.
- Finished services less trade, transportation & warehousing (weighs 38% in overall PPI): unchanged.
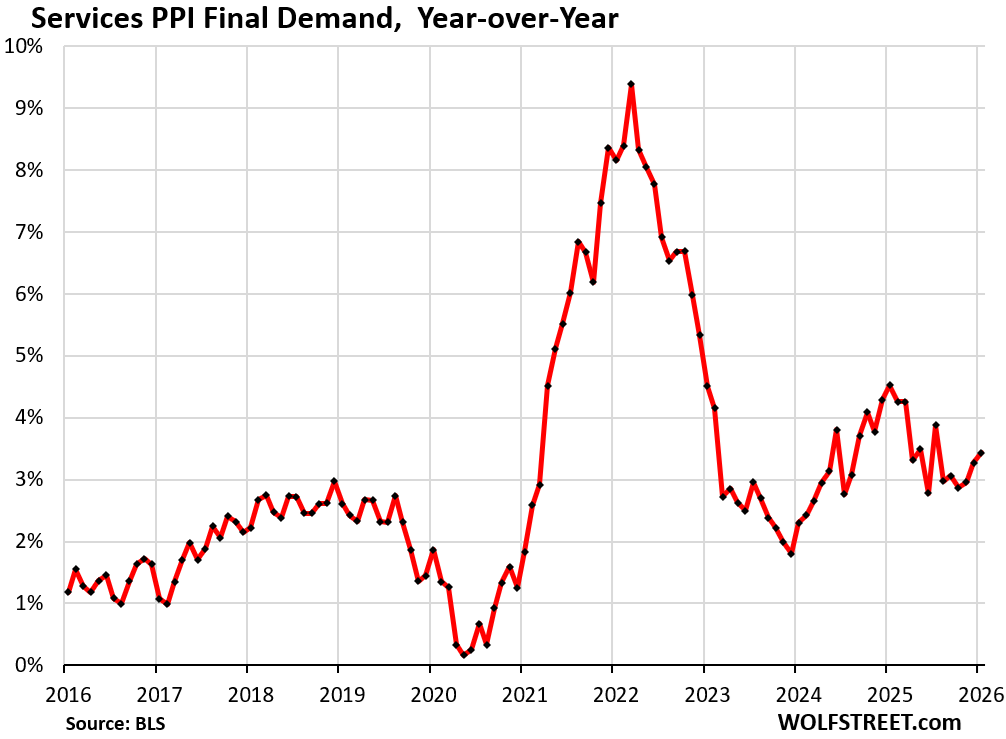
Year-over-year, the services PPI accelerated to 3.44%, the third month in a row of acceleration.
The low point, the point of the coolest recent services PPI inflation, was in December 2023 at 1.8%.
Impact on the Fed-favored PCE Price Index:
The PPI for Portfolio management, which feeds into the PCE Price Index of January (to be released March 13), spiked by 1.5% month to month not annualized in January, the fourth month in a row of big spikes. Year-over-year, it spiked by 17.9%. This ads to indications that the Fed-favored core PCE price index, which was already 3.0% in December, will further accelerate away from the Fed’s 2% target.
Goods prices.
The PPIs final demand for both food and energy plunged month-to-month:
- PPI for Food: -1.5%;
- PPI for Energy: -2.7%.
But goods prices without food and energy were another thing.
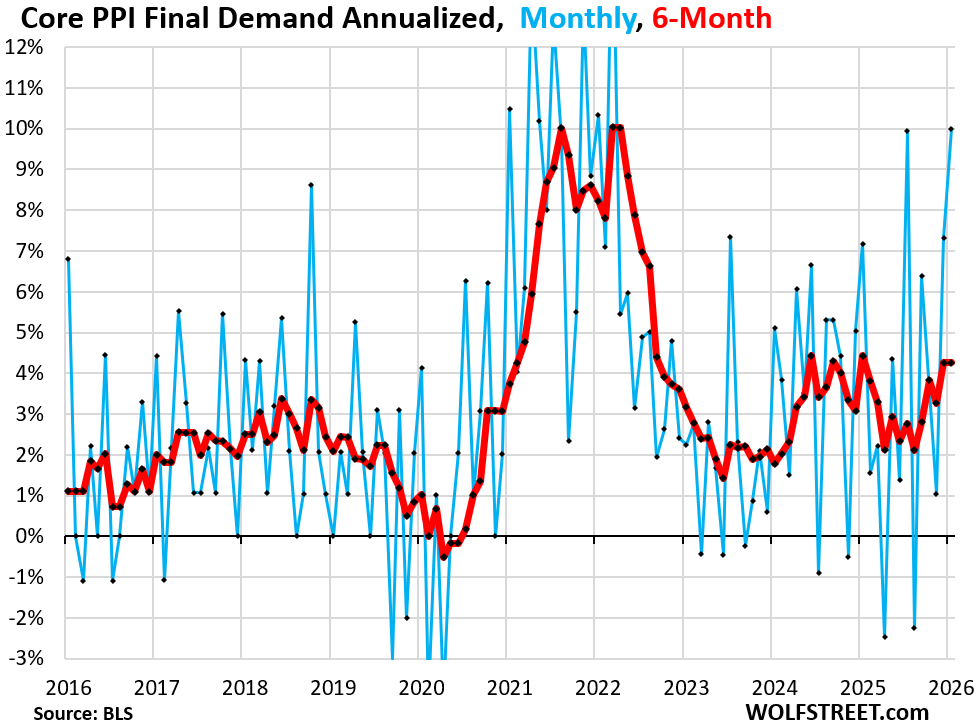
The Core Goods PPI final demand (excludes food and energy) spiked by 0.68% in January from December (+8.5% annualized).
The 6-month average rose by 4.7% annualized. Both were the worst since 2022.
The tariffs are percolating through the goods categories at various stages of the PPI as companies try to pass them on to each other. But consumer-facing companies have resisted price increases because consumers have resisted price increases, and these companies had trouble passing on higher costs to consumers without losing sales.
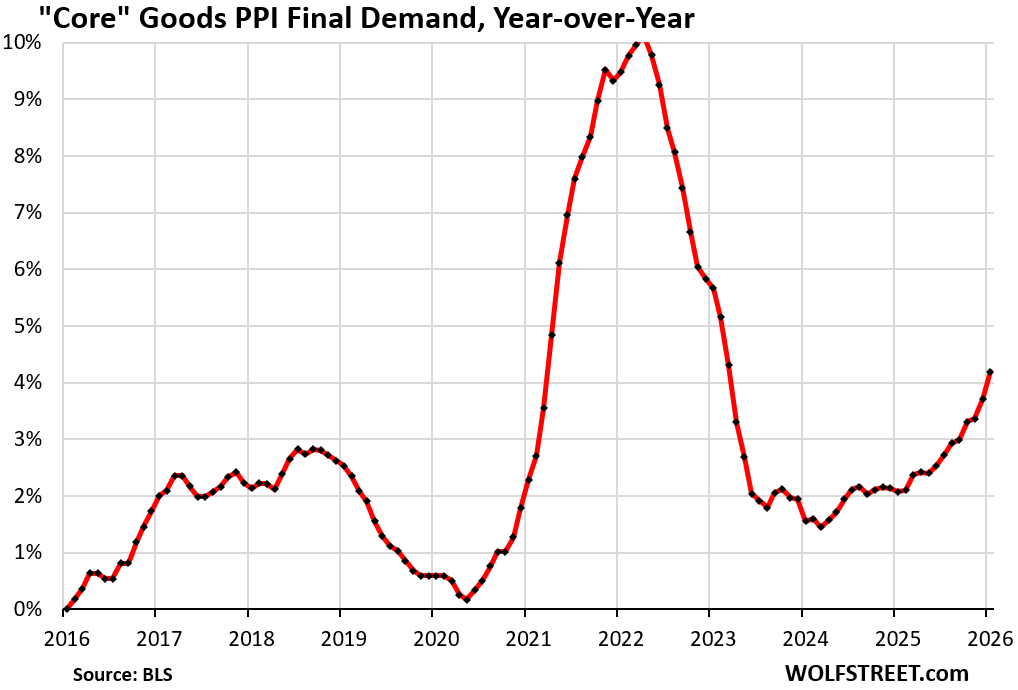
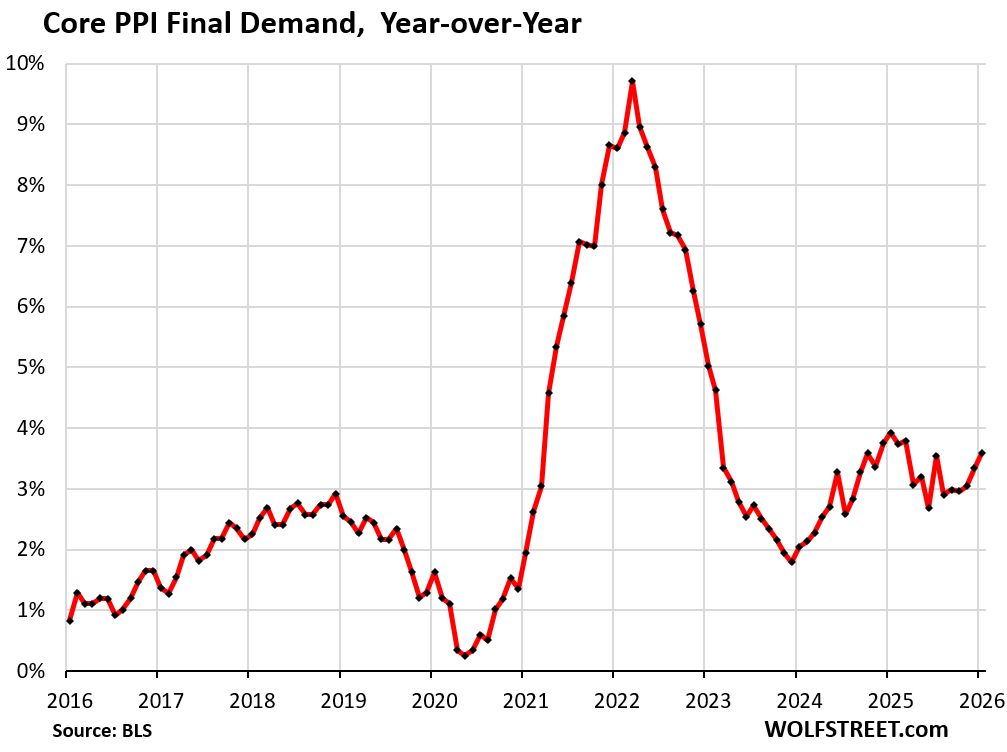
Year-over-year, the core goods PPI jumped by 4.2%, the worst since March 2023.
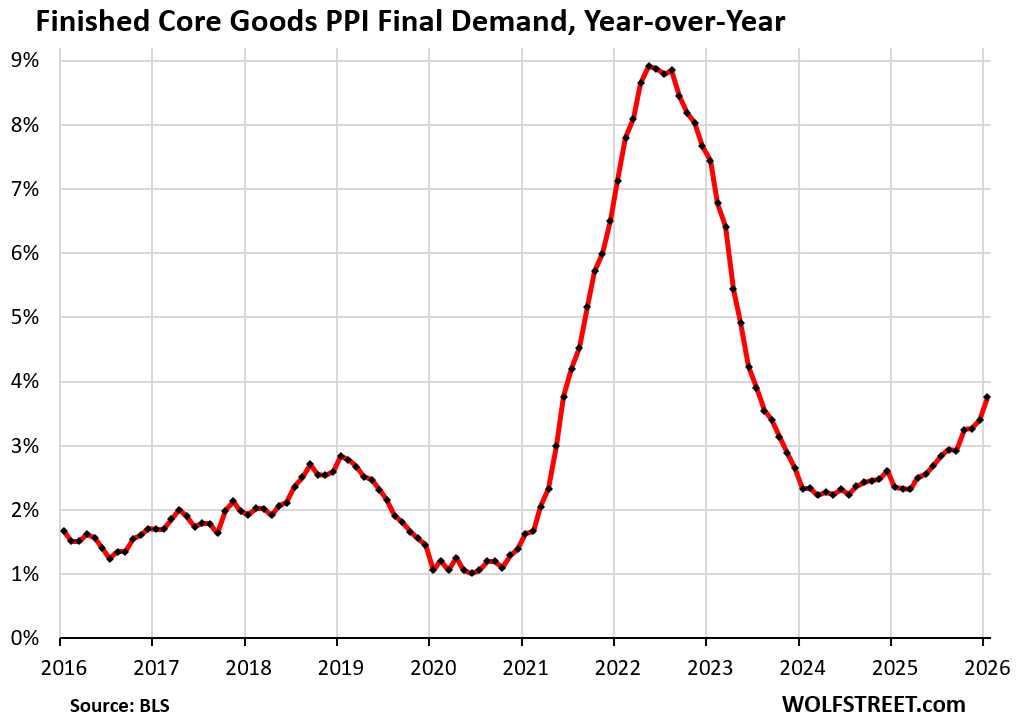
The “finished core goods” PPI — goods ready to be sold to the end-user — also accelerated, but not to the extent the “core goods” PPI has: 0.42% month-to-month (+5.2% annualized). The 6-month average rose by 4.1% annualized.
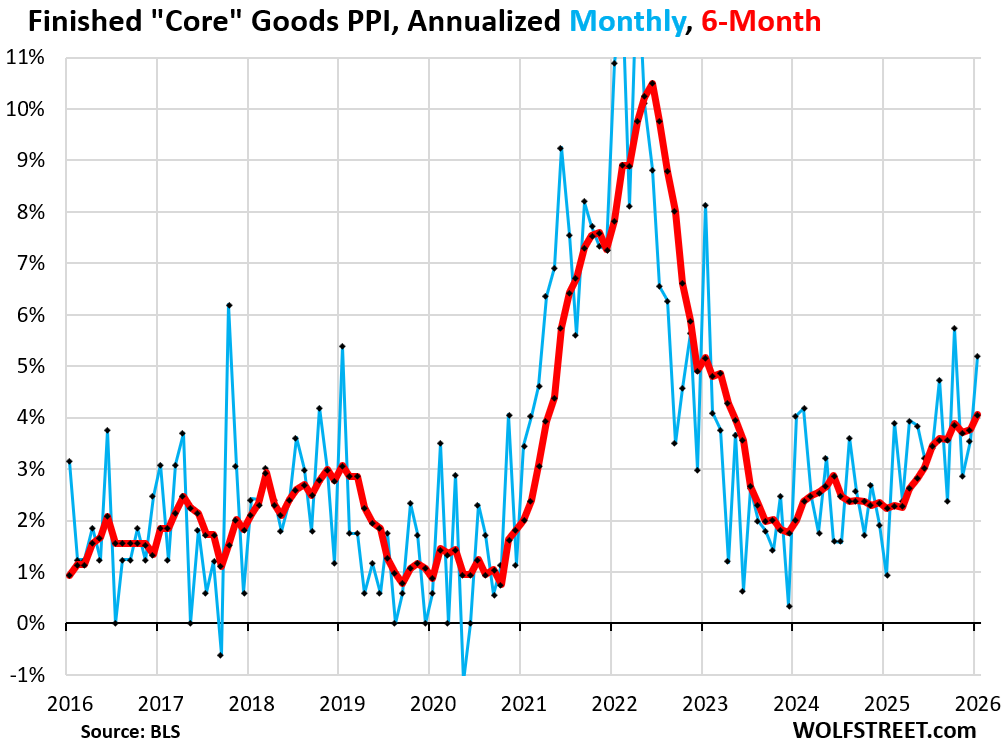
Year-over-year, the finished core goods CPI jumped by 3.8%, the worst since July 2023.
“Core PPI Final Demand, which includes all goods and services except food and energy, spiked by 0.80% month-to-month (+10.0% annualized), driven by 0.81% spike in the services PPI.
The 6-month average rose by 4.3% annualized, same as in December, and both were the worst since January 2025.
Year-over-year, core PPI accelerated to +3.58%, the worst since March 2025.
The overall PPI Final Demand, muffled by the plunge in food and energy prices, jumped by a more modest but still bad 0.48% month-to-month (+5.9% annualized).
Year-over-year (red in the chart), the overall PPI rose by 2.9%.
Inflation has been broadly accelerating since 2023 at the producer level, except in energy products, where prices have plunged.
Here we’re looking at this mess on a year-over-year basis for overall PPI (green double line), core PPI (purple line), services PPI (red line), and core goods PPI (yellow line), and it clearly shows the trend that started in 2023:
Enjoy reading WOLF STREET and want to support it? You can donate. I appreciate it immensely. Click on the mug to find out how:

![]()
You’ve always said inflation is sticky and has a tendency to want to continue to rear its ugly head. We’re seeing that in action right now. Thanks, Wolf.
I was born too late to remember the ’70s. I guess it’s time for a redux?
I remember the 70’s well, especially the late 70’s when long term bonds were cratering. Called “Certificates of Confiscation “ at one point.
For people with funds available for investing, 1981 presented an excellent opportunity to lock in 15% yields on 30 year zero coupon US Treasuries. These days, I don’t think bond yields are high enough to compensate investors for likely future inflation.
You’ll never forget the joy of an 18% mortgage rate on a renewal date that hit our family in ’81. I was 26 then with a young family and home to pay for. It was a real incentive to never ever have another mortgage or owe anyone for anything ever again….. for sure. Have owned a home outright from 1995 onwards, and now this is all just a sideshow. If an Iran strike goes off into unintended consequences….well, you might just see that redux. Luckily, the economy has inertia and is still stumbling forward, somewhat. However, it can change in an instant. Back then it was the oil embargo. It could be many things this time around. A few sinking tankers and missile strikes will change everything.
I remember an old customer of mine talking about a co-worker who just bought a new house. His words, “Sure, the Guy’s mortgage is affordable right now, but it has to be affordable when you’re not working too.”
It would be impossible IMO, for us to ever have interest rate as high as they were during the 80’s again, given our 38 Trillion $ debt. After reading another one of Wolf’s Awesome reports, I feel comfortable to continue just laddering my CD’S for 3 to 6 months!
Not a bad time to ladder CDs! Hopefully when the tide rolls back in the market’s fit will be over 😆
Was it impossible for Argentina?
They made it possible, by depreciating the currency. The same thing will happen in the US. Check out Ray Dalio’s thoughts.
Check out WU and KEY. I have a $150K portfolio at SoFi with those as two thirds the total. I began investing for the first time in May of 2025. My ROI on paper is just over 18% (was over 25% untim last month’s blood bath). So far, I have collected over $4,800 in qualified (i.e. tax free) Dividends. I’m an old man who avoided stocks until now. I am 79 and a retired FAA air traffic controller living in Vermont.
Oh my goodness. These kinds of comments of very concentrated investments in just two companies by a 79-year-old torture my heart.
The below is the furthest thing from financial advice in the world.
If you have $1 million in financial assets and $150k invested as you said, I have no problem with that. But if you have $150k in financial assets, and they’re all invested in 2-3 companies (esp. troubled WU and F) just to earn the dividends, then I get deeply worried.
PG&E had a nice dividend yield and then cut it to zero. And the share price crashed too. As did many companies, including Intel. Investors suddenly lost all their dividend income and a big part of their capital investment. Dividends are not guaranteed. The company’s board decides how much, if any, dividend it pays. This is different from bond interest, which the company guarantees.
Western Union [WU] is troubled. Revenues have dropped by 20% over the past four years. It’s cash-transfer business is getting clobbered from all sides. It’s still very profitable thanks to the ripoff that it offers its clients. Which is also its vulnerability. Now people have lots of other and cheaper options, and they’re switching which is why WU’s revenues are declining. The stock is down by 60% in five years, but it pays a 9% dividend yield? That dividend is at risk over the longer term. It’s OK to have some of it as a small portion of your portfolio, maybe to trade a temporary increase in the share price, but to be so concentrated in this one stock means you’re flirting with impoverishment at your advanced age. This is called “yield chasing.” It’s one of the riskiest and potentially most expensive things investors can do.
That you own some KEY doesn’t worry me. But at your age, you need diversification including a big portion in low-risk assets that will be there when you need them. You cannot start over again, like a 35-year-old can.
Wolf, agree with your points, but at least if he was at the FAA, he likely has a federal pension (and probably the good pre-1985 one based on his age), so he’s far ahead of most people.
Then why is he chasing yield?
Good question. Maybe he can live on the pension and sees this as his “fun money.” Certainly wouldn’t be my choice!
I’m looking at KEY, it’s on the watch list. Open to thoughts – the reputation is there it seems… 🤔
Few wanted 18 percent interest rates. If you can’t sell your bonds at a low rate you will have to sell them at a high rate. It’s really not a choice. And yes it will not be nice for the people. Ask Russia, Greece, Venezuela etc.
Between high and rising inflation, burgeoning supply of treasuries and Kevin Warsh’s desire to reduce the Fed’s balance sheet;
It sure doesn’t look like long term bonds are a good investment
Agreed. Everyone says that the only way out of our debt is thru inflation (devaluing the debt), but then they go invest in long bonds as if that isn’t the very investment that’s being devalued!
Who’s investing in long bonds?
A lot of people. Otherwise the 10 year wouldn’t be at 4%
@MM1,
Backing your comment at the drum set with a rimshot, here.
Actually after all the inflation of the 70’s bonds were worth a ton. People holding them had to be getting rich. ‘82-‘86 to be specific
It’s always the trend that looks obvious that reverses, then everyone smacks their forehead and says “if only I had bought some of that”
Good point, but I would imagine that the only way long-term bond yields move lower to push up prices is through a very nasty recession or worse. I have had a modest position in TLT now going on 3 years, waiting for yields to fall as a result of a recession. I’ve slowly started to sell out of that position small losses. I’m getting tired of waiting on a recession. I don’t see myself buying into TLT in future or bonds longer dated than 10 years at most.
Forget about TLT 🤔 times like these were made for LTPZ! It’s like a TIP fund with risk and volatility!
Like SCHP on crack. (NFA, I own the fund because I like to party) 🎉
And when it rolls over, you’ll know the storm has passed…
Then you buy again when it’s cheaper than dirt 🫡
Despite the PPI figures, yields on Treasury notes and bonds are down today, some substantially down. MSM say it is a flight to safety. But safety from what? Generally, when inflation numbers shoot up, yields also shoot up. I wonder what is happening. Why would the market want to push yields lower if an increase in inflation is starting to raise its ugly head.
Safety from getting crushed in the stock market.
Qualified Dividends are safer than bonds.
Dividends are not guaranteed. the company can cut them to zero, and the principal of your investment then crashes.
PG&E had a nice dividend yield and then cut it to zero. And the share price crashed too. As did many companies, including Intel. Investors suddenly lost all their dividend income and a big part of their capital investment. Dividends are not guaranteed. The company’s board decides how much in dividends, if any, it pays. This is different from bond interest payments, which the company guarantees. In addition, the company guarantees you the face value of the bond, and unless it goes bankrupt, that’s what you will get when the bond matures. A stock can collapse by 80% or 90% no problem. This site is full of examples.
You mentioned WU here in another comment. Its stock is down 60% in five years, but it has a 9% dividend yield now? This is a huge risk over the longer term.
Wolf, you are smart guy I have been reading off and on for years, but I do not see where you got the idea I have a million dollars to invest. I do not. As the observant poster TSonder305 above mentioned, I am retired (FAA) so I never have to “worry” about making ends meet.
But try to forget my age and JUST LOOK at my numbers and forget this “diversified” business for a moment. Guys like you would have us buying a pack of ETFs to be “safe”. Yeah, if you are happy with 10-12 % on paper ROI plus some measly dividends, lower than what I can get from F or KEY, never mind WU’s GIANT Divdend that you are probaly mistanly branding a “value trap”.
FLO is a high div value trap. WU is NOT. You are behind the times and losing great divs because of your fear that “divs can be lowered”. Yeah, but there is thing called TRACK RECORD and available CASH. WU has PLENTY of that. No available cash problems AND no cash flow problems at ANY of the three stocks I own, by the way. Their dividends are stable for a number of years. The 1981 double digit % Bond yields coming back are wishful thinking, and Inflation is what you think the Fed says?
Alright, believe what you will, but I decided to get in WU, KEY and F for solid reasons, despite your Debbie Downer Funeral March beliefs about WU (and probably F too).
I have, as I said, aabout 18% on paper ROI for 150K invested. And, I began that portfolio in MAY of last year. How did you do in that time period, Bro?
I’ll post chapter and verse from Jenny Harrington ,CEO of Gilman, on WHY they are going do the same plan with WU as they did a few years ago with BMY. Check it out.
Here is my “overly concentrated unsafe dumb old man” Portfolio for your viewing pleasure. Mock all you want but try not to argue with success, Bro. Your readers will take you to the woodshed.
WU 5,300 Shares Avg cost $9.23 Total return $1,995.44 | 4.08% Dividends $2,333.64 Total value $50,936.53
KEY 2,600 Shares Avg cost $17.73 Total return $$7,911.55 | 17.16% Dividends $1,081.10 Total value $54,015.63
F 3,100 Shares Avg cost $11.05 Total return $9,383.76 | 27.38% Dividends $846.67 Total value $43,654.20
I have 23 shares of WMT here and there Avg cost $112, but they are not relevant to this discussion, though knowing you, you will say looky, here , Anthony’s got some respectable stock. I work at Walmart, so it is a job security thing. I am not impressed with their miniscule dividend, though I agree that long term the stock will provide some decent Cap Gains when, and only when, I sell it.
I’ve got a LEAP January 15, 2027 Call 50 contracts on WU for $12 strike. I will be right here to remind you what a smart guy you are and how my call option expired worthless if that is what happens. However, if WU goes to $23 by then, do the math. I’ll be here to remind you of that too. check out that option chain, bro. Can you believe the $15 Call crowd is BIGGER than than the $12 crowd? I think Gilman is probably there, but it sure is no HEDGE, bro. SOMEBODY BIG thinks WU is headed up. I’m not selling it or KEY or F. I just buy the dips Have a nice day.
Wolf
The saying goes you can lead a horse to water….
People gonna do what they gonna do, and sometimes you just have to wish the best of luck I guess.
Wolf has it here imho – WU is paying for investors to hold on to a sinking ship. It will be sudden when those dividends end – when capital exits the Company it exits the Comoany. It’s been a decent hedge against crypto but it won’t last; their entire business model dies to ETH 🤷♂️
Plus, if a stock has a 9% dividend based on current market prices, many traders who are not Wolf are also expecting dividends to be cut. Time will tell who is reading this correctly, and the size of past returns does not play into that future one whit.
Because it is clear the stock market is overvalues.
NVIDIA went down 5% after their earnings. Everyone knows the top is in and it is time to get out.
The idea that Nvidia’s 70% margin is stable is the biggest joke of them all. I just don’t see this lack of competition lasting indefinitely.
Google leasing/selling their TPU clusters is a big threat to Nvidia. Those units are easier to manage and much cheaper per-op because they only do tensor math and can skip some of the precision (fewer transistors means less power) necessary for a general-purpose GPU, which Nvidia chips still support.
They just needed to be proven usable outside of Google and the recent Meta deal does just that.
Nvidia is strong with GPUs but with companies designing ASICs will make a dent into their growth market. ASIC chips are more much more compute and power efficient for regular AI uses. GPUs will remain the gold standard to train models though.
@TSonder,
Especially when their forward contract for memory chips funs out.
Agree with all of you. Nature abhors a vacuum. The only way someone can maintain a 70% profit margin long-term is to engage in illegal, anticompetitive behavior or have a patent on something, the function of which can’t be replicated.
Think about it. If you had a deli that was taking 70% of their revenues to profit, a competitor would open up a deli and undercut them, figuring “Hey, I’ll work at a 50% margin and still make plenty!”
The same general principle applies to GPUs. Nvidia right now can charge whatever it wants because the other BigTech companies are dumping ungodly amounts of money into it to “keep up” with the others. But I’m sure they’re not happy about it, which is why they have been exploring (and will continue to explore) alternatives.
Agreed on the so-called “growth” stocks that are zero dividend smoke and mirrors. High dividend stocks like WU and good divdend stocks like KEY nd F is what I have, in total, 150K portfolio at SoFi on. I have collected over $4,800 in qualified divdends since May 2025, when I first began investing despite being 78 years old at the time.
Oh my goodness. These kinds of comments of very concentrated investments in just two companies by a 79-year-old (as you said in another comment) torture my heart.
The below is the furthest thing from financial advice in the world.
If you have $1 million in financial assets and $150k invested as you said, I have no problem with that. But if you have $150k in financial assets, and they’re all invested in 2-3 companies (esp. troubled WU and F) just to earn the dividends, then I get deeply worried.
PG&E had a nice dividend yield and then cut it to zero. And the share price crashed too. As did many companies, including Intel. Investors suddenly lost all their dividend income and a big part of their capital investment. Dividends are not guaranteed. The company’s board decides how much, if any, dividend it pays. This is different from bond interest, which the company guarantees.
Western Union [WU] is troubled. Revenues have dropped by 20% over the past four years. It’s cash-transfer business is getting clobbered from all sides. It’s still very profitable thanks to the ripoff that it offers its clients. Which is also its vulnerability. Now people have lots of other and cheaper options, and they’re switching which is why WU’s revenues are declining. The stock is down by 60% in five years, but it pays a 9% dividend yield? That dividend is at risk over the longer term. It’s OK to have some of it as a small portion of your portfolio, maybe to trade a temporary increase in the share price, but to be so concentrated in this one stock means you’re flirting with impoverishment at your advanced age. This is called “yield chasing.” It’s one of the riskiest and potentially most expensive things investors can do.
That you own some KEY doesn’t worry me.
But at your age, you need diversification including a big portion in low-risk assets that will be there when you need them. You cannot start over again, like a 35-year-old can.
Tariffs hit → prices rise → consumers squeezed → companies sell less → economy slows → unemployment rises → Fed cut rates → higher bond prices → so smart money buys bonds now in anticipation of that whole chain playing out.
Nice theory except in reality it breaks at step 2, “prices rise”.
Wolf’s data (and much other data) show tariffs impacting producer prices and consumer company margins. But not consumer prices. Companies have not been able to pass along higher goods prices.
The theory also breaks down at “Fed cut rates -> Higher bond prices”. The Fed has cut its overnight interest rate several times in the past year and a half, but that has not reduced the longer term rates that drive bond prices.
The days of lowering overnight Fed rates lowering long term bond yields are over. There is too much debt floating around.
The response of bond during the last market dip in 2022, the inability to control bond rates during the recent carry-trade scare, and the lack of response to long term bonds during recent interest rates show the power of the Fed is not what it used to be.
This was my question too.
PPI is sending the same message it was sending in mid-2021, to those willing to listen.
But yet again, people are fleeing into long-duration treasuries as if they don’t remember those getting utterly smashed just four short years ago.
My reason to flee the stock market would be to free up funds for shorting TLT.
It’s an historical flight to liquidity. I don’t know what to make of it. The only tenant that I can apply is that an excess of savings over real investment outlets leads to deflation. But Trump likes to run it hot.
What caused the collapse of PPI Final Demand in the second half of 2022? That data is noisy, but the mid-2022 drop was enormous.
So these are “% change” charts, not “price level” charts. In my CPI articles I usually present both. When the year-over-year % change plunges from +10% to +2%, prices are still increasing by 2% but the pace of increases is much smaller than 10%.
The pace of inflation cooled dramatically in 2022 from the huge spike in 2021 through mid-2022. Energy prices collapsed (big negative % change). Many goods prices, which had exploded, also dropped, including commodities prices, which impact PPI more. Services inflation, which was white hot in 2021, cooled a lot. Inflation was raging back then. That’s no longer the case. But inflation is accelerating.
For the past 3 months, the Swamp has been posting on this site that inflation is accelerating. No one has been responding to my posts. I see a rate increase just around the corner to knock this inflation out. Walsh is just the right person to do this. The sooner the better.
I doubt anyone has the fortitude to do this. The caterwauling from the media would be deafening.
SC,
Even you will be surprised by how high inflation will get. This is when they will CUT rates—for the common good.
IDK, have you seen the following hawks/doves table, which lists which FOMC members have voting rights for the next 3 years?
https://www.itcmarkets.com/hawk-dove-cheat-sheet-2/
As I stated before, Walsh was nominated to take the blame for inflation, and for efforts to fight inflation. He is the foil, just as JPow was.
Inflation will get high. Walsh will come under fire from the president. None of us will remember that it was the president calling for rate cuts while inflation was too high in 2025 and 2026. All the media repeaters will walk around repeating that the inflation is Walsh’s fault, and feel smart for repeating the slogans they saw on the interwebs.
Chris B,
Warsh with an r
They should never have cut rates in the fall of 2024.
It’s more likely to be a rate reduction. The figures have been volatile. It’s kind of like the end of 2007 where money flows signaled a downswing in the 4th qtr. 2008 — the long-term superseding the short-term.
That just marked the end of the distributed lag effect of money flows.
Money is not neutral as the pundits suggest (“the idea that a change in the stock of money affects only nominal variables in the economy such as prices, wages, and exchange rates, with no effect on real variables, like employment, real GDP, and real consumption”)
Any injection of new money can be robust, neutral, or harmful. It all depends upon the distributed lag effect of monetary flows, volume times transaction’s velocity. And the distributed lag effect(s) of money flows the volume and velocity of money, have been mathematical constants for > 100 years.
The most notable decline in the long-term distributed lag effect was during Paul Volcker’s 1st – 2nd qtrs. 1980. 3mo t-bills dropped from 16 percent on 3/25/1980 to 6.18% on 6/13/80. I.e., Volcker screwed up.
The actual data sure looks like inflation 1) hasn’t gone away and 2) is high and 3) is accelerating.
Yet I read and hear from other sources about all the theoretical deflationary factors that “the fed” must valiantly fight, and how based on these theoretical factors, further inflation is not even possible at this point. Maybe they haven’t fully given up yet on the disgraceful modern monetary theory , I don’t know.
And when the data doesn’t align with theory, they just change the subject. Or just don’t talk about it at all. Example -the PPI information isn’t really newsworthy I guess at WSJ – its buried.
This site is the best for inflation reporting, thanks Wolf.
The initial shock of tariffs is deflation as people reduce spending and there is inventory to work down. Then 9-12 months later companies must increase prices as inventory is reduced and new stock is more expensive to purchase.
Note how little attention this is getting in major media. WSJ, Bloomberg have it buried.
Yes. When CPI came in awhile back at 2.9%, that was “less than expected” because 3.0% was “expected,” and that was plastered EVERYWHERE. Never mind that it was still .9% above the Fed’s ridiculous target.
it is truly amazing; I had to search for it on WSJ. Even though it purportedly rattled the almighty stock market, and is possibly behind a flight to safety happening right now. I guess they need their exit liquidity.
Wolf’s “on point”.
I believe I remember Wolf posting an article a long time ago about billionaires purchasing most of major newspapers, etc. even though these were known money losing businesses.
For a multi-billionaire, the value of owning news media is to protect my image and project favorable coverage for their other business and political interests.
If the paper loses $100 million a year, that’s ok because the paper’s influence is keeping Congress in line, keeping the Administration from interfering, and generally keeping all the other streams of income nice & healthy.
P.S. don’t get Wolf started on it, but most of the media would be a lot more profitable if Google wasn’t abusing its monopoly position in internet advertising. Everyone else makes the content, and yet Google gets the vast majority of the advertising money. If the advertising market were competitive, content creators would get a lot more revenue.
Ghost…
Yeah…
That was kinda my point by mentioning it.
Exhibit A for why people who only subscribe to the media matching their ideological alignment are walking around so misinformed all the time.
If PPI is lower than expected next month, the WSJ will make it front-page news, and the people who didn’t notice January’s blowout will get the false impression inflation is falling.
I believe that imports average ~14% of GDP, and 2025 Tariffs averaged ~7%,
Tariffs receive the spotlight, but the USD devaluations & FX volatility in 2025, and notably in Dec 25, must also be a component driver on PPI inflation close in magnitude to the tariffs and sometimes greater. Even though the vast majority of imports are settled in USD, foreign suppliers must also be attempting to increase pricing to cover these impacts. (December Annualized changes: CNY 12.75%, EUR 12.1%, DXY 12.8%)
Is it still transitory?
Has been going on 5 years now
During heat death of the universe inflation will be 0% so technically it’s still transitory.
Wolf, attempting to put a couple of your articles together: This article seems to shine a new light on the electricity demand article that you published earlier this week. With such high demand for AI data centers, it follows that there would be an increased demand in services, correct? That is, the spike in the services aspect of the PPI follows the massive demand for data centers. Assuming that correlation the case (please correct me if I am wrong), services inflation seems like it will be very sticky for some time.
At what point can we admit that the government doesn’t give an F about inflation?
If the asymmetric “average” inflation target didn’t convince people nothing will.
Good question.
I propose “when they haven’t achieved inflation at or below their 2% target in five years or more.”
Oh wait……
The U.S. Government is the world’s largest debtor. They care very, very deeply about inflation. The higher inflation the better for a debtor!
Most of the population is also deeply in debt. They will tolerate inflation as long as their income rises to match.
It’s not surprising it took some time for the tariffs to start hitting the charts. The companies I know that purchase in Asia front loaded for 2025 during the latter half of 2024. 2026 inventories now have tariffs baked in. I’m seeing it with dramatic price increases for bike parts especially tires. I assume consumer electronics that require chips and memory will face demand pressures later this year. Better buy your latest phone ASAP.
Tariffs have been hitting the PPI charts for many months, and I’ve talked about it many times. Companies are paying the tariffs obviously, and they’re passing them on to each other obviously, and eating them. That’s what the PPI shows. This is not consumer price inflation. This is inflation in what companies buy. And so far, very little of it has gotten passed on to consumers, so the tariffs have only mildly touched consumer price inflation.
But if companies have been passing them on to each other and eating the tariffs, without raising consumer prices proportionally, then how has the S&P500’s profit margin been steadily rising?
https://dqydj.com/sp-500-profit-margin/
Few of the biggest S&P 500 companies sell imported goods to consumers. Nvidia has gigantic profits and obscene profit margins, but only a minuscule portion of that profit comes from its consumer products. Amazon makes most of its profits in its AWS division, not retail, and it doesn’t care whether its third-party vendors make any money or not – it gets a fee from each transaction and from other services it provides for them. Tesla’s vehicles have about 65% to 70% US content, and its profit has plunged. Meta and Alphabet sell almost no goods to consumers. Apple got tariff exemptions. USMCA compliant goods are not tariffed…
Most of the S&P 500 profits are from services (not tariffed). Other companies are selling goods to other companies or governments, not consumers (Boeing, Caterpillar, GE Aerospace, RTX, GE Vernova, Northrop Grumman, oil & gas drillers such as ExxonMobil, and the US imports little gasoline (it’s a big exporter of gasoline and diesel), etc.
And the automakers other than Tesla – they do sell to consumers through the franchise system — have had huge GAAP losses in 2025 because they ate the tariffs lock, stock, and barrel.
@ Chris B.
Read John Hussman’s work. Corporate profit margins are the mirror image of government deficits and household borrowing.
That’s a macro accounting identity. One sector’s deficit must be another’s surplus.
It’s not sustainable but it has gone on much longer than one would have expected.
Corporations will tolerate the government deficits and inflation since that keeps profit margins at the current, historically unprecedented levels.
Assume retailers can’t raise prices but are starting to pay higher costs. What happens to margins?
Then stocks follow. So buy your latest phone now but take your time buying stocks.
INFLATION FEAR RETURNS
UBS DOWNGRADES US STOCK MARKET
It’s called deflation in stocks prices. Growth slowing as companies can pass the higher costs to consumer.
Inflation remains one the most powerful weapon in managing the huge debt of a nation, but it’s a double edge sword.
It could easily create a cruel internal conflict and here it surely means a civil war, given the polarization in US.
If the growth won’t not exuberant, it’ll be an incredible problem for many administrations to come.
Not just an internal conflict, but ultimately, it can destroy the trust foreigners have in your bonds, which trust is the very reason they wanted your bonds in the first place.
>Hopefully the Boomers go quietly without gloating about their heist.
Too late.
The Republicans and Democrats, both of which have run up the massive debt with massive deficit spending, which fuels inflation, get 99% of the vote. Maybe people will start caring about fiscal responsibility in the future, but there is currently no division over inflation.
I’m just over here fist bumping the bond market…
If on Tues Mar 31 QQQ (C) > 620: [1M] will flip. If above 601: for the [3M] it’s good enough. If not: no harm is done!
If on Mar 31st SPX closes > 6,690 for the [3M] it’s good enough. SPX will close Dec 17/18 gap and Nov 21/24 gap.
How much of services is wages? All of it? Half of it? These government reporting categories often have roundabout definitions that make them hard to interpret.
I have the same question.
The “huge sucking sound” is shifting to your pocket.
Many “seasoned” folks around here have seen this before. The second wave of inflation is just getting started, unfortunately Walsh is no Volcker. I hope everyone bought oil and gas stocks last week. The MIC is in control, not a good thing.
Hedge accordingly.
Make sure to fill your gas tank in vehicles and gas cans,feel for some reason the price will be going up quickly!
Well, at least another undefined war in the Middle East should help with deficit, inflation and other issues.
After the shenanigans in Iran, expect energy prices to go through the roof. Sky high, launched into orbit.
US is the largest oil and gas producer in the world. Not 1973 anymore.
WTI Crude Oil up 6.24%. Buckle uo!
Ephemeral knee-jerk reaction. We get this every time. Generally, it fizzles after a couple of days.
Ai will create deflationary forces as IT workers are laid off, along with legal assistants, accountants, teachers, and other white-collar workers. When millions of people are laid off, that will depress demand, it will depress prices, it will be deflationary. Ai is a big deal. Half of public school teachers could be displaced with program learning that’s exciting with multi-media presentations and information presented in interesting ways. The teacher at the center of the classroom has never been a great model for learning.
Half our teachers could be replaced with twinkies and the kids would be better off.
No, because they did that during the school lockdowns, and we now can see the results, and kids are worse off as learning suffered substantially.
It always amazes me that people view investing in the education of future generations as a waste of money, and the underpaid teachers who often work long hours outside of school, as parasites to be replaced by some algorithm as long as its cheaper.
Theres something pathological about people who want to replace teachers with some tech bro developed LLM. A highly educated work force is one of the US best assets and the rising trend of anti-intellectualism in the US is going to bite us in the ass if it’s not checked and allowed to run amok. A well educated and highly productive workforce is a cornerstone of what actually makes America great and the people who want to tear that down for political reasons often don’t see how foolish it is or they don’t care because they don’t believe it will affect them personally.
There were 18 national merit scholars at my high school, my graduating class.
At the Univ of Wisconsin where I graduated college, the school of education was where all the students with low grades went to get their degree. In my last three years of HS I learned absolutely nothing. I learned more about current events reading headlines from newspapers while delivering newspapers on my newspaper route. Teachers will the first to be replaced by AI.