The PCE price index gets pushed down far less by the doctored housing index than CPI does because housing weighs half as much in PCE.
By Wolf Richter for WOLF STREET.
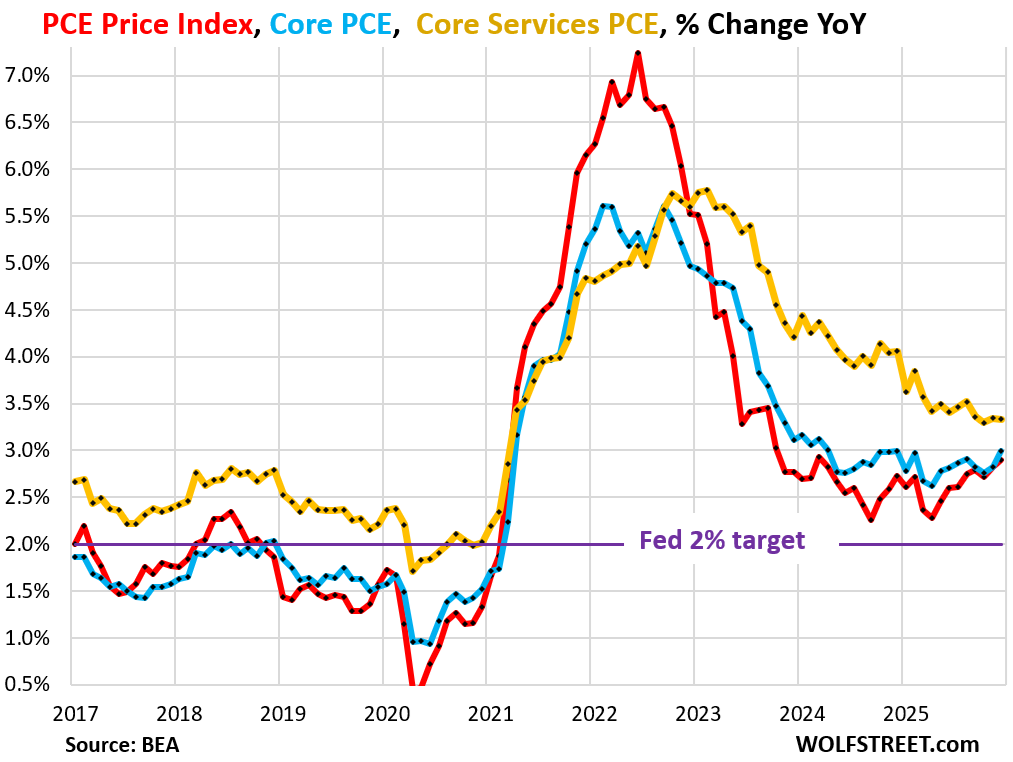
The PCE price index, the inflation measure that the Fed favors as its yardstick for its 2% inflation target, accelerated to +2.9% year-over-year in December, the most inflation in nearly two years, according to delayed data released by the BEA today (red in the chart). It started accelerating in April.
On a monthly basis, it jumped by 0.36% (4.4% annualized). The six-month average accelerated to 3.0%, the worst since June 2024.
The core PCE Price index, which excludes food and energy components, accelerated to +3.0% year-over-year in December, the worst since April 2024 (blue in the chart). It also started accelerating in April. On a monthly basis, it also jumped by 0.36% (4.4% annualized).
The Fed’s target is 2% for these measures (purple line), not 3%. But they’re now at 3% on a rising trend.
The core services PCE price index increased by 3.3% year-over-year, same as in the prior two months (yellow in the chart). Month-to-month, it jumped by 0.33% (4.0% annualized). The six-month average accelerated to 3.5%, the worst since March 2025.
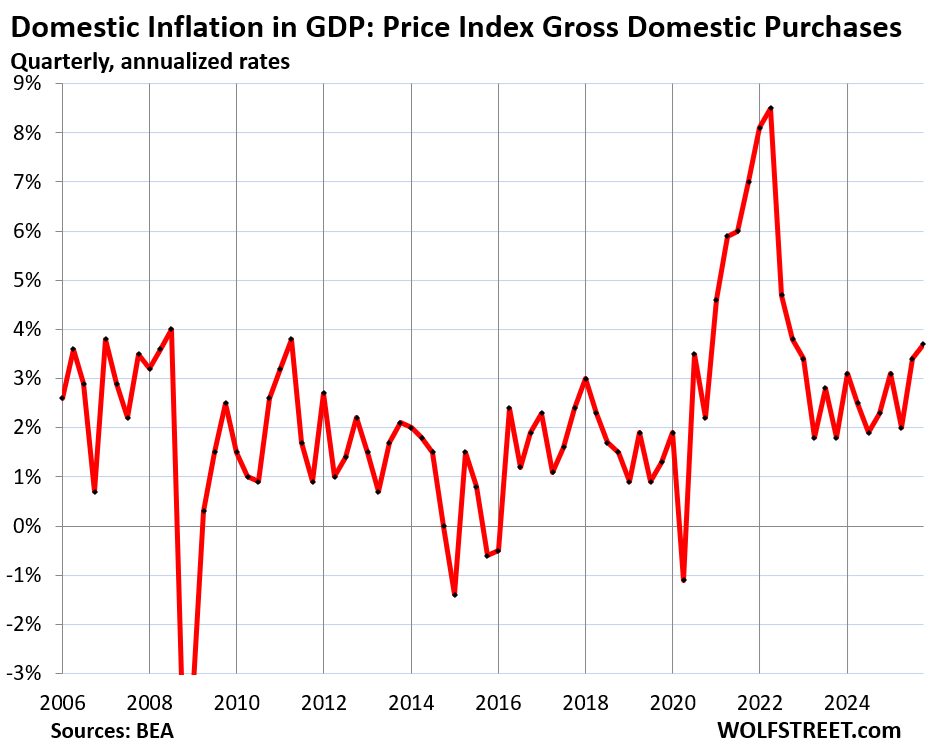
GDP inflation rose by 3.7% in Q4 – that was part of the huge trove of GDP data released today by the BEA, along with the PCE price index. GDP measures spending and investments by consumers, businesses, and governments in the overall US economy. The inflation adjustments for “real” GDP amounted to 3.7% annualized in Q4.
This hot reading is in part due to business and government spending categories where inflation has been higher than in consumer-facing prices. This 3.7% is the inflation rate for the overall economy, not just consumer spending.
The Price Index for Gross Domestic Purchases, which reflects inflation adjustments in GDP except for imports, so domestic inflation, accelerated to 3.7% in Q4, the worst in three years.
But wait… CPI has been cooling for months.
The US uses several different price indices, all sharing some data but cover different parts of the economy, and with different weights on each subcategory, and the methodologies differ.
The PCE price index and the GDP deflators above are released by the BEA; the PCE price index reflects consumer-facing inflation and the GDP deflators reflect much broader inflation in the overall economy.
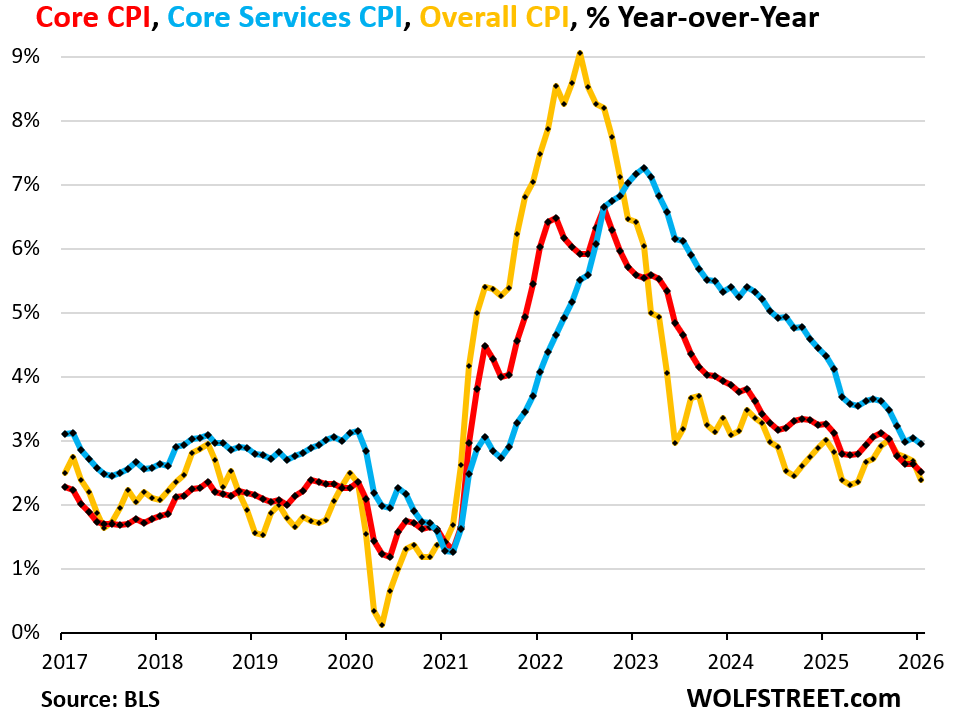
The Consumer Price Index (CPI), released by the Bureau of Labor Statistics, reflects consumer-facing inflation.
On a year-over-year basis, core CPI started decelerating in September and overall CPI in October, just as the PCE price index components were taking off. So what gives?
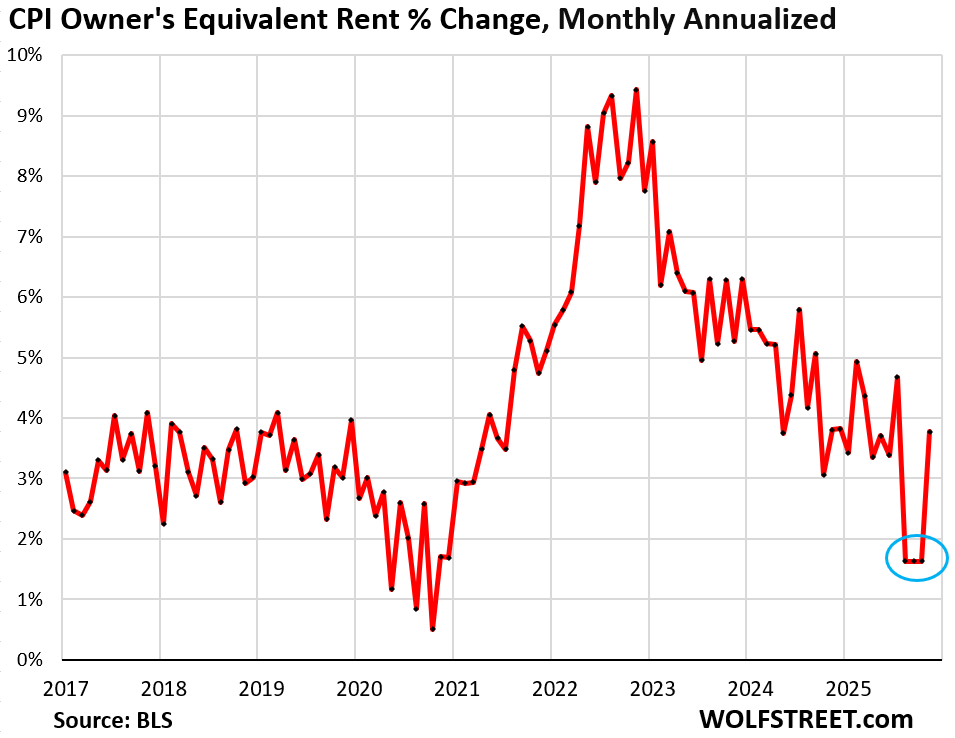
The major factor that drove that deceleration was the outlier deceleration in the CPI housing components, particularly Owners’ Equivalent of Rent (OER), a massive component that weighs 26% in overall CPI: Over a three-month period – September, October, and November – the clearly doctored ultra-low OER figures pushed down services CPI, core CPI, and overall CPI due to its massive weight, and those three months will continue to push down year-over-year readings until they fall out of the 12-month timeframe in the fall (my discussion here):
There are many differences between the PCE price index and CPI. One of them is that housing indices have much smaller weights in the PCE Price index.
The PCE price index also uses the rent data and the OER data from the same surveys as the CPI, but combined, rent and OER weigh about 17% in PCE while they weigh about 35% in CPI.
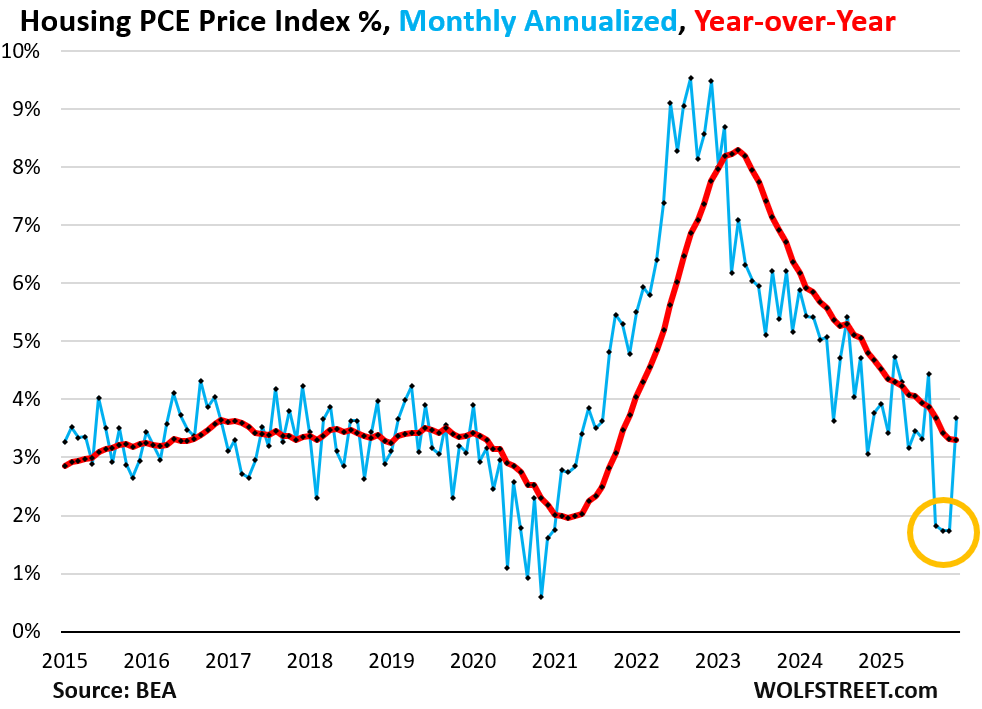
So the doctored OER data also pushed down the PCE price index and the overall index for housing inflation. But because it has much lower weight in the PCE index, the effect of the doctored OER is not nearly as much.
The chart of the overall housing PCE price index shows those three doctored months – September, October, and November – that will carry forward, lowering the index values for all times by that amount. This will continue to push down the year-over-year percentage changes until those three months fall out of the 12-month timeframe later this year.
The PCE price index is suddenly higher than CPI.
Normally, the PCE price index shows lower inflation readings that CPI. That is one of the reasons the Fed prefers the PCE price index for its 2.0% inflation target.
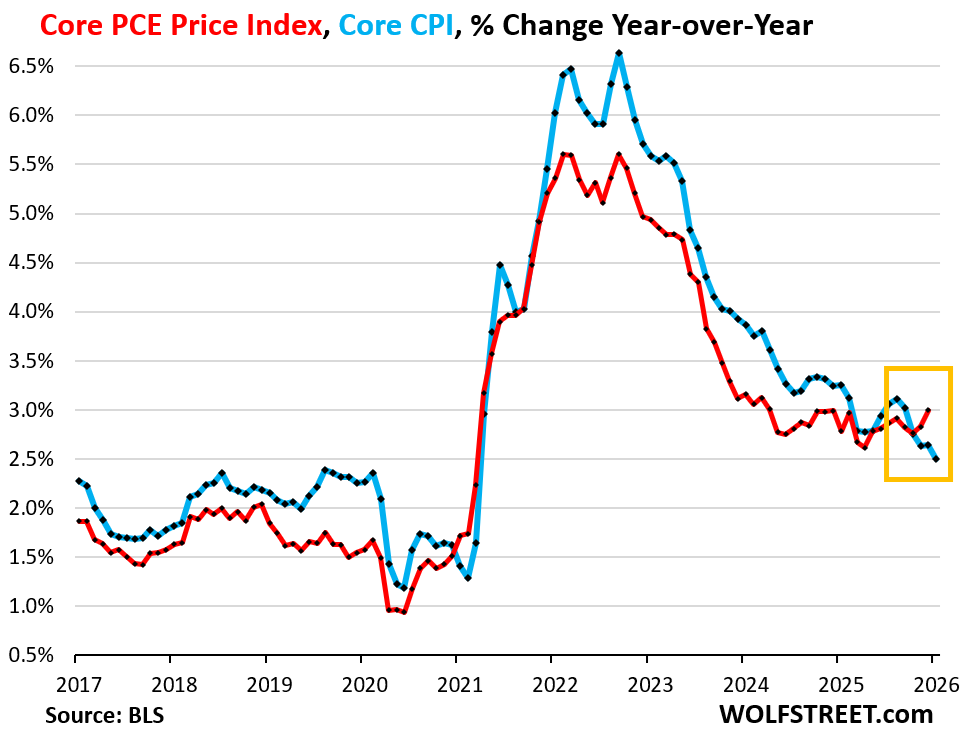
But now they have gone in opposite directions, with the PCE price index and the core PCE price index accelerating and being substantially higher than CPI and core CPI respectively.
The chart shows the year-over-year change of the core PCE price index in red and of core CPI in blue. Note the divergence:
In addition, goods prices…
The PCE index for durable goods rose by 2.1% year-over-year, still pulling down the overall PCE price index, but less so than they did before.
Prices of motor vehicles, parts, and accessories, the largest category of durable goods, rose by just 1.2% year-over-year, with price drops in some categories and increases in others. Prices are still below where they had been in mid-2022.
Prices of recreational goods and vehicles, including consumer electronics, TVs, etc., have wobbled lower for years, but the memory chip shortage due to demand from AI servers have caused prices of computers and other electronics to rise recently. Still, the index is up by only 1.8% year-over-year.
But prices have been rising again in furnishings and durable household equipment, after the 30-months long plunge from mid-2022. Year-over-year, the PCE price index for furnishings and durable household equipment rose by 4.0%.
The PCE price index for food & nonalcoholic beverages purchased in stores for off-premise consumption jumped in December by 0.41% (+5.1% annualized), which pushed the year-over-year increase to 2.1%, having about doubled from 2024.
The Fed needs to pay attention.
The hot overall inflation data in the GDP release today (3.7%) and the accelerating consumer-facing inflation in the PCE price index today (2.9% and 3.0%) indicate that inflation is rumbling throughout the economy and is bubbling to the surface at the consumer end.
There is a lot of stimulus in the economy – government deficit spending, tax cuts for companies and individuals, massive corporate investments in anything related to AI, and too-low interest rates and spreads. Under these combined conditions, inflation isn’t going to sleep.
The Fed is relying – thankfully this time – on the PCE price index as its yardstick. In the minutes of the last Fed meeting, which preceded today’s inflation data, the topic of rate hikes already cropped up for the first time in a while:
“Several participants indicated that they would have supported a two-sided description of the Committee’s future interest rate decisions, reflecting the possibility that upward adjustments to the target range for the federal funds rate could be appropriate if inflation remains at above-target levels.”
In case you missed it: Hot Inflation & Plunge in Federal Government Spending Slam Real GDP. But Trade Deficit Least Bad in 2 Years
Enjoy reading WOLF STREET and want to support it? You can donate. I appreciate it immensely. Click on the mug to find out how:

![]()
Thanks, Wolf. Now please, get some rest!
🤣 fixin to
Take two weeks off, Wolf. MISH can babysit us while you’re gone. I laughed one day when one commenter called you MISH.
Mish…..?!
Why,when you have 4chan business to keep you in top economic intellect shape!
I second this. Wolf’s battle with the internet’s wanton mental slop is commendable. Atlas probably needed a break as well.
I love this stuff Wolf, you know why? Because you give me a glimpse into the future. Its nice to know ahead of time what the talking heads choose not to tell.
“Doctored” OER data amounts to 2% difference over 3 months, or 0.25% annualized. This means it lowered CPI data by 0.08% and PCE by 0.04% at the weightings mentioned in this post.
Sorry that was meant as a general post not a reply.
Oops. 2% over 3 months is 0.5% and that means 0.16% and 0.08%. Clearly I shouldn’t be posting today, especially in a place where I can’t fix my mistakes!
Hi Wolf,
Is there a average/median annualized wage growth to compare how people are doing against inflation?
Yes. These are total wages and salaries paid to all workers in the US, without transfer payments (such as Social Security, stimulus money, etc.). They’re adjusted for inflation on the PCE price index.
There are two things you see here in the flattening line in 2025:
1. Population growth has slowed to a crawl in 2025, and employment growth has slowed to a crawl too, which means that in total, the number of workers that are getting paid hasn’t risen much.
2. The increase in PCE inflation in the second half of 2025 has about eaten up the pay increases of this only slightly growing workforce.
Also note the inflation shock in 2021-2022, when wage increases, though substantial, didn’t keep up with the suddenly raging inflation, and workers fell behind, and it took until about mid-2023 to catch back up. This type of sudden inflation resurgence is nasty. There is nothing benign about inflation.
The OER, because it is a “survey” invites politically motivated “tweaking”.
Antiquated, when there now is real time hard data on housing that can replace the “survey” which apparently was adapted when there was no reliable hard data.
PCE running hotter despite the fact it is a chain weighted index that allows for substitutions for items that have risen in price, correct?
“PCE running hotter despite the fact it is a chain weighted index that allows for substitutions for items that have risen in price, correct?”
Yes, and that’s really concerning about CPI.
OER should be replaced with the actual expenses homeowners’ face, such as homeowners’ insurance, HOA feeds, property taxes, repair and maintenance costs. They do that in many countries, including Canada. In Canada, they also have factors for mortgage interest rates and replacement values.
sorry, but not seeing why the OER figures are “clearly doctored”? was that explained in another post? thanks.
1. Just look at the chart of QER, don’t you see?
2. here are some posts:
https://wolfstreet.com/2025/12/18/todays-doctored-cpi-inflation-release-is-like-a-bad-joke-but-very-serious-though-it-suits-the-administrations-narrative/
https://wolfstreet.com/2025/12/18/todays-doctored-cpi-inflation-release-is-like-a-bad-joke-but-very-serious-though-it-suits-the-administrations-narrative/
https://wolfstreet.com/2026/02/13/services-inflation-spikes-in-january-but-bad-joke-oer-cpi-pushes-down-on-year-over-year-cpi-oer-is-huge-and-bad/#comment-671249
Thanks, Wolf.
The market certainly doesn’t seem to believe inflation is going to be an issue in the long term with the 10-year bond yield hovering just a smidgen over 4% in the past week.
With current inflation running at 3%, the market must think that inflation is going to be well below that for a long time as having just a 1% difference over the long term wouldn’t leave investors much room to maneuver if things go wrong on the inflation front.
It’s a tug of war between the inflation worriers selling treasuries and the recession worriers buying treasuries.
The stagflation crowd is piling into gold and foreign markets.
Place a bet on your favorite horse!
That little blip in the PCE and divergence from CPI – after they were both falling together for years – was last seen in early 2021 before inflation skyrocketed. Not to say this time is the same but the Fed has to get ahead of letting it even start to repeat.
I was surprised how little the stock markets and bond rates reacted to the Fed notes with mention of rate increases. No one can say they didn’t warn us!
That’s assuming the current crop of Fed actually wants to fix the problem it claims it does.
I’m hoping Waller will be less of a squish than Powell, who has no spine other than pleasing the elite who write about him.
My thoughts exactly. People give Powell way too much credit. He is responsible for the last 6 years of the k shaped economy, and hurting real people with that already had real problems. He completely ignored the inflation for a year and then caved too early, when inflation wasn’t solved.
He ignored the problems and just went to grateful dead concerts while rome burned. We needed a volcker but got a Powell instead.
Thorough and insightful review of inflation indexes.
I believe I’ve seen past comments from some Fed Gov’s and perhaps other pundits that the 2% target may well be 3%, ongoing. That is to say, they are going to accept a slightly higher base rate of inflation.
This makes perfect sense to me when considering the national debt crisis we’re in. It will however, be extremely painful for a large number of citizens.
The one thing I continue to think interesting on this inflation thing is that while it may help “solve” the debt/GDP problem, it also makes US workers even more uncompetitive against other countries such as China. That is unless those countries are also inflating at the same rate (which I do not know if that is the case).
It would be interesting to know what the underlying inflation is for manufacturing countries like China, South Korea, Japan and India.
If I understand you, the OCE is a imputed value (made up in the imagination of the survey participants) so it has no real basis in reality, and the Labor jerks can manipulate it to lower the real price index, to make the administration look good (Dow $50,000 y’all!).
So we should be expecting higher prices soon, but fake numbers of the price index, the typical lying bastards playbook?
Personally, I am no fan of the OER (which is what I think you meant rather than “OCE”). However, in its defense, what the BLS really cares about is not the absolute “imaginary” amount people believe their home would rent for, but the change in that rent amount from month to month.
Between Q4 2008 and 2020 PCE was in accumulation. It’s testing the 12Y accumulation box. First target: 1980 high at 10%. A larger count is between Q1 1987 at 2.6% and Q4 2025 at 2.7%. This 40 years box can sent PCE well above 1974 high at 11.9%, to the 20% area. Inflation is boxed in. The Fed cannot do anything about it.
Excellent stuff. Thank you!
Oh, and isn’t Warshit’s talking point “have a belief and stick to it, stop relying on data”, the best kind of Freudian warning of bad things this way comes?
Fed pay attention? As much as I expect the Supreme Court to switch to casual dress code.
“There is a lot of stimulus in the economy – government deficit spending, tax cuts for companies and individuals, massive corporate investments in anything related to AI, and too-low interest rates and spreads. Under these combined conditions, inflation isn’t going to sleep”.
Well said.
However, many folks, especially seniors, are getting economically whacked by local taxes and fees while being on a fixed income.
Young families are being hit with higher government-driven inflation as well. Sales taxes, property taxes, licensing fees, etc., have all risen in the past six years.
“State and local taxes account for approximately 10.3% of the income for the average U.S. family, based on 2024 data from the Institute on Taxation and Economic Policy (ITEP)”.
All True, unfortunately. We’re at the beginning of an inflationary depression. What standard of living we still have is based on almost $40 trillion of federal debt…and fake interest rates that were near zero for over 12 years.
What about Truflation? It shows inflation crashing.
It’s a bad blockchain joke.
What are the flaws? I see so many Youtubers, even Lance Roberts from RIA, using Truflation to support their views.
For example, they use “asking rents” for their rent index. NO ONE pays asking rents because asking rents are what landlords want for their VACANT units. Tenants pay actual rents. They’re established either at lease renewal or at lease signing. They’re also using MRI to get data from landlords on new lease signings. The government’s measure uses actual rents on a large group of rental apartments and houses that it surveys over and over again, regardless who lives there, to determine what rent were paid “this month.” It then establishes the rent index from that. That’s the only rent index we have that depicts actual rent and actual rent inflation.
For its index of owned housing, it uses government agency data and Fed data, LOL. And it includes a factor for mortgage rates. So if mortgage rates decline, it means inflation goes down?
Obviously people can use whatever suits their narrative.
Truflation has crashed roughly 2% and is currently showing 0.77% – with used car prices crashing and retail heavy discounts to move excessive holiday overhang.
CPI also showed a drop in used vehicle prices in January. Truflation uses the same data source for used vehicles as the government does lol
https://wolfstreet.com/2026/02/13/services-inflation-spikes-in-january-but-bad-joke-oer-cpi-pushes-down-on-year-over-year-cpi-oer-is-huge-and-bad/
Everything you’ve got or eat comes from the ground or the sea. Commodity prices are going up. Expect end prices to do the same.
We are at the beginning of another 15 year cycle that has alternately favored real assets vs paper assets since 1933. Prepare accordingly.
You mean paper assets vs real?
Send me all your worthless paper assets.
Fed futures are pricing in a drop to 3.0% by the end of the year. The bond market, however, so far sees no rate changes at all for at least 2 years. It’ll be interesting to see who’s right.
Fed rates are overnight rates. Bond rates are 10-30 year rates. Two different things.
Wolf, how much you think the released Nominal PCE and Core PCE would be if the OER Data was not Doctored ?
They’d both be over 3% yoy, but I don’t know by how much.
On a month-to-month it would make a bigger difference for those three months. It might have rattled some people.
All I know is that almost everything I bought on Amazon two years ago is a lot more expensive now.
I don’t know how much has to do with the tariffs, but it’s not good.
Corporate America will keep sticking it to consumers, because that is what they do. They see we’re saving some money at the gas pump, so they jack us up on other stuff.
Lets talk about food prices. I buy the same 15 items every week at the same chain, Giant food. I keep track of the prices I pay for these 15 items. If they go up I notice it immediately. If the quality goes down I notice that also. In the past month a number of my 15 items went up 15% or more. Others disappeared from the shelves altogether because of supply chain issues. I see that the official food price inflation is benign at 3% or less. I would have to say these numbers are total BS. They are rigged. Total lies. END OF STORY.
Just looked at an outback dish I had in 2024, was $13.99, as of today $10 more!!! $23.99
What the Fudge?
Once the semi-annual CPI hits inflation adjusted bonds, there is no way to claw the lowball numbers back. May 1 is the semiannual adjustment date, so there are still a few months to fix this atrocity.
Hi Wolf, any thoughts on Truflation numbers that are showing a continued decrease in US cpi? Truflation using real time data versus the December PCE puts their numbers at least a month a head of these reports. I realize the calculations aren’t identical. Currently showing US CPI at 1.02%
Trueflation is a bad blockchain joke.
Note that there is a PCE metric that is minus food, energy, AND HOUSING. It reads +2.9% inflation, annualized. Perhaps with the doctored OER, we will have to switch to watching it. In FRED, the code is IA001176M .
The link, if I’m allowed to post it, is
https://fred.stlouisfed.org/series/IA001176M#
This series also offers a less-noisy view of the upward trend in inflation since the first rate cut in September 2024, at the price of cutting out a lot of important inputs.
For a preview of what comes next, study a chart of PCE, CPI, and the Federal Funds Rate in 1974. In the latter half of that year, the FFR was cut to below the rate of inflation. A brutal recession had started so the Fed correctly reasoned that CPI/PCE would fall later. It did.
However, the FFR was then held at below the rate of CPI or PCE inflation from late 1974 until late 1977. That is, for those 3 years the Arthur Burns Fed had the government borrowing at a rate lower than inflation, in an attempt to juice the economy. The result was a resurgence in inflation that started in late 1977 and led to the famous “malaise” of the late 70s and early 80s that Paul Volker only managed to extinguish through mass unemployment, deep recession, de-industrialization, and financial chaos.
The modern parallel could be on the way. The FOMC has been cutting rates into the headwind of rising inflation – with no recession in sight – for almost a year and a half. When inflation tips above the FFR (later this year?) you’ll know we’re repeating the mid-1970s.
“But in 12 months, my administration has driven core inflation down to the lowest level in more than five years, and in the last three months of 2025, it was down to 1.7%.” 😒
He is still way behind Biden who claimed in Aug 2022 that the US had “zero inflation” 🤣
When it comes to inflation, these goofballs are all the same.
Unreal. He should’ve been lampin’ at his beach house in Rehoboth from Jan ’21 through Jan ’25…
…I’m just disappointed that the current guy didn’t give due credit to BLS for applying carry-forward methods to OER to drive down that core inflation “in the last three months of 2025.”